Article

Influence of Mature Overstory Trees on Adjacent 12-Year Regeneration and the Woody Understory: Aggregated Retention versus Intact Forest

1
Department of Forest Resources, University of Minnesota, 1530 Cleveland Avenue North, Saint Paul, MN 55108, USA
2
School of Biological Sciences and ARC Centre for Forest Value, University of Tasmania, Private Bag 55, Hobart, Tasmania 7001, Australia
3
USDA Forest Service, Northern Research Station, 5985 Highway K, Rhinelander, WI 54501-9128, USA
4
USDA Forest Service, Northern Research Station, 1831 Hwy 169 E., Grand Rapids, MN 55744, USA
5
Rubenstein School of Environment and Natural Resources, University of Vermont, 81 Carrigan Drive, Burlington, VT 05405, USA
*
Author to whom correspondence should be addressed.
Forests 2017, 8(2), 31; https://doi.org/10.3390/f8020031
Submission received: 21 November 2016 / Revised: 13 January 2017 / Accepted: 19 January 2017 / Published: 25 January 2017

Abstract

:
Retention harvesting, an approach that intentionally retains legacy features such as mature overstory trees, provides options for achieving ecological objectives. At the same time, retained overstory trees may compete with the nearby recovering understory for resources, and much remains to be learned about potential trade-offs with regeneration objectives, particularly over extended time periods. We assessed the influence of aggregated retention (reserved mature overstory and understory patches) versus intact forest on structure and productivity (standing biomass) of the adjacent woody understory and regeneration 12 years after harvest in northern Minnesota, USA. Each site was dominated by Populus tremuloides Michx., a species that regenerates prolifically via root sprouts following disturbance. Overall, fewer differences than expected occurred between the effects of intact forest and aggregated retention on regeneration, despite the small size (0.1 ha) of aggregates. Instead, harvest status and distance from harvest edge had a greater influence on structure and standing woody biomass. Proximity to aggregates reduced large sapling biomass (all species, combined) relative to open conditions, but only up to 5 m into harvested areas. This suggests the trade-off for achieving productivity objectives might be minimal if managers use retention aggregates in this region to achieve ecological objectives and meet management guidelines.

1. Introduction

Practices that maintain or enhance biodiversity and structural complexity in forest ecosystems may increase adaptive capacity [1], an increasingly emphasized management goal in light of ongoing environmental change [2,3]. Thus, the development, evaluation, and adaptation of approaches that conserve those elements while continuing to provide forest products are rising in importance. Retention harvesting, an approach that intentionally retains legacy features such as single, mature, overstory trees or undisturbed patches (aggregates), provides options for achieving that balance across ecosystems [4,5], yet much remains to be learned about the long-term effectiveness of retention harvesting in different ecosystems and potential trade-offs with meeting tree regeneration objectives [6].
Natural disturbances result in greater young forest structural complexity compared to even-aged regeneration methods such as clearcutting [7,8]. Residual live trees (as well as other structural and biological attributes that persist after disturbance) provide continuity both temporally between forest generations and spatially across a landscape. Such complexity and continuity positively influence many aspects of biodiversity [5,9,10] through provision of habitat for birds and mammals [11], maintenance of ectomycorrhizal communities [12] which influence nutrient availability and cycling, amelioration of the microenvironment [13,14], and other mechanisms. Accordingly, retention harvesting systems that reserve mature, overstory trees after harvest have been developed to provide similar habitat, complexity, and services as natural legacies [4,7,8]. In addition to positive impacts for biodiversity evident in the short- and medium-term [5,12,15], model simulations of stand development over periods of up to 240 years suggest structure in at least some actively managed forests (i.e., in the Pacific Northwest), will be more similar to natural forests if harvested within retention systems rather than clearcutting [16].
Retention harvesting practices aim to maintain integrity, resilience, and diversity of forests while also providing forest products [17,18,19]. However, application may also involve trade-offs with short-term productivity and specific regeneration goals [20]. Retained overstory trees can result in greater competition for light [21,22], water, and nutrients [23] which can have a direct negative effect on the establishment and growth of regenerating tree species [24,25,26,27,28]. While competition for light may influence growth regardless of shade tolerance [21], species such as Populus tremuloides Michx. might be impacted to a greater degree both directly, because of high intolerance of shade, and indirectly, through cooler soil temperatures known to reduce root sucker initiation and annual growth [29]. On the other hand, retained overstory trees may ameliorate the microenvironment [13] and improve regeneration survival, facilitate access to mycorrhizae [30], or indirectly improve growth of P. tremuloides regeneration by reducing competition from other species such as shrubs [31]. Understory shrubs are known to limit tree regeneration success and growth across many forest ecosystems [32,33,34], particularly for shade-intolerant species [10], and can retard succession [31]. The effects of overstory retention on the shrub layer likely depend on site factors and the composition of the shrub community; observations in aspen mixed-conifer stands suggest that overstory retention in partial harvests decreases growth of shrubs [35], but without necessarily conferring any benefit to target (crop tree) species [35]. Overall, mixed results have been observed in aspen-dominated ecosystems [36,37] and limited information exists on aspen response and regeneration dynamics 10 years or more after partial harvest or harvesting with long-term retention (but see [31,38,39]).
Understanding the biophysical effects of retained overstory on surrounding harvested areas (“forest influence” [40,41]) and its temporal scale [40] is integral to achieving the ultimate goals of continuity, recolonization, and structural complexity associated with retention harvesting [28,42]. It is generally assumed by forest managers that forest influence is greatest within a distance approximately equivalent to the height of the dominant trees in a given forest ecosystem [28,41] even though evidence suggests a high degree of variation, depending on the variable of interest, time since harvest, and forest type [42]. Across biomes, forest influence on microclimate generally extends 10–20 m into harvested areas [42], with distances up to 44 m observed in temperate Tasmanian forests [43], and can persist for as long as 45 years in some systems [14]. Observations from boreal forest suggest a more limited distance of influence on understory structure than other ecosystems, with effects only extending 5–15 m into harvests [44]. This might, in part, be explained by the shorter stature of trees in this ecosystem.
The smaller patch size of retained aggregates may decrease the forest influence provided by those aggregates over time relative to intact forest. Close proximity to harvest edges can limit the longevity of overstory trees because of increased exposure to wind and other stressors, particularly in aggregated retention where retained trees are more exposed [45,46,47]. For instance, windthrow occurs more frequently and up to greater depths in retained aggregates relative to larger intact forest stands in temperate forests of Tasmania, Australia [47]. Similarly, observations in Canadian boreal mixedwoods suggest higher rates of mortality in overstory trees in cut areas following partial harvests compared to intact stands, both as a result of stress from exposure (primarily hardwoods) and windthrow (mostly conifers) [46]. This mortality can contribute downed, dead wood and influence the coverage and exposure of mineral soil, all factors determining the availability of appropriate substrate and conditions for seedling germination. The survivorship of mature trees also affects seed availability, seed dispersal (as species differ in their response to edge conditions [46]), and the microclimate. Thus, seedling germination and establishment are subject to forest influence and differ according to the arrangement and proximity of mature overstory [48] at short- to medium-terms after harvest [10]. Moreover, while mostly similar between aggregates and intact forest, some evidence suggests a greater depth of microclimatic influence into harvested areas associated with intact forest [43]. This could be related to greater sunlight penetration of aggregate edges (and therefore less shade) resulting from the mortality discussed above, a lesser degree of shade over the course of a day because of sun positioning and smaller patch size, differing influences on airflow, or a combination of the above [43]. Overall, understanding forest influence as it relates to overstory retention is key to quantifying potential trade-offs and evaluating the success of retention harvesting practices at achieving balance among ecological, economic, and social objectives.
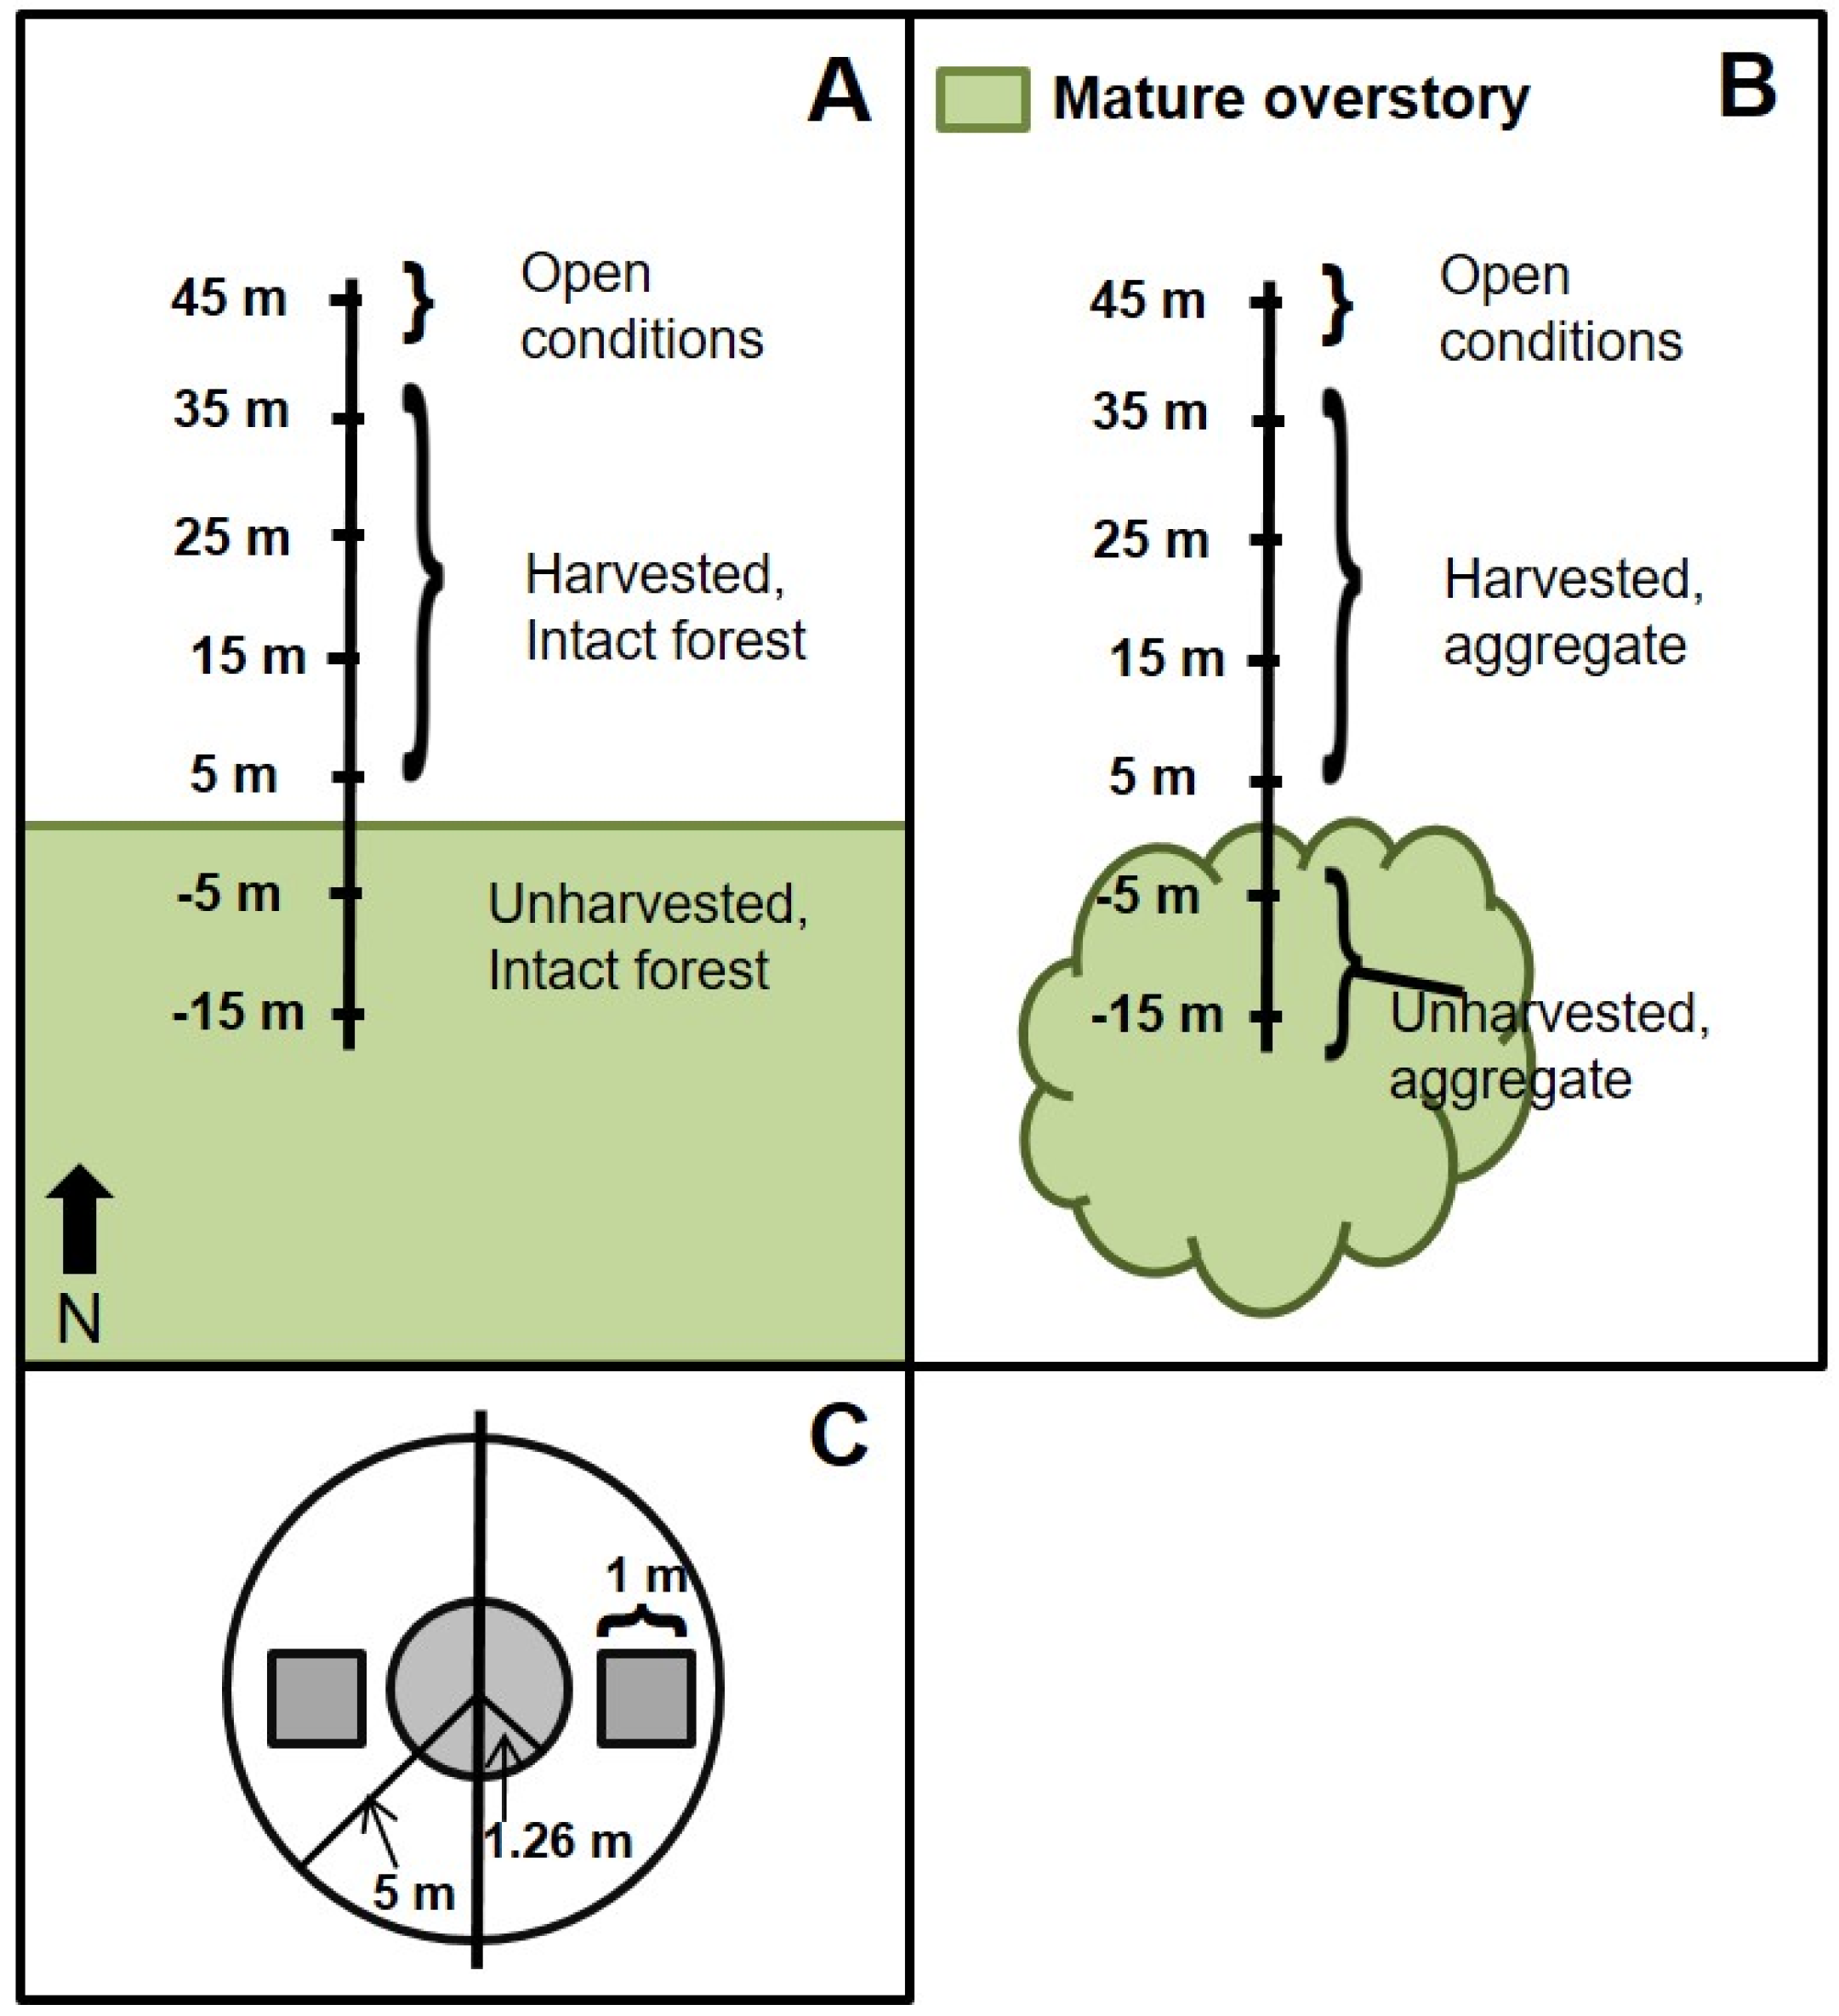
Our study assesses the influence of aggregated retention on the structure and productivity (standing biomass) of tree regeneration and the woody understory. This was accomplished using a dataset that includes replicates from multiple sites dominated by P. tremuloides, a species that regenerates prolifically via root sprouts following disturbance such as harvest [29]. Based on observations of forest influence on general plant species composition [49] and the functional diversity and functional composition in the woody understory of the same P. tremuloides-dominated forest ecosystem (Curzon et al. unpublished), as well as observations of forest structure in boreal forest [44], we hypothesized that intact forest and aggregates would both influence structural composition of adjacent regenerating forests. We also hypothesized that the magnitude and extent of forest influence into regenerating forest would be greater adjacent to intact forest edges relative to small, retained aggregates.

2. Materials and Methods

2.1. Study Area

This study includes three mesic northern hardwood sites located in northern Minnesota, USA: Ashebun Lake (AL; 46.9° N, 93.8° W), Soo Line (SL; 47.0° N, 93.8° W), and Dog Lake (DL; 46.8° N, 94.1° W). P. tremuloides (quaking aspen), Acer rubrum L. (red maple), and A. saccharum Marshall (sugar maple) generally dominated the mature canopy with lesser components of Tilia americana L. (American basswood), Quercus macrocarpa Michx. (bur oak), and Betula papyrifera Marshall (paper birch). All three sites are characterized by parent materials deposited by glaciation during the Wisconsonian age. Plots were located in forests growing on gently rolling moraine with thick glacial till. Average annual snowfall for the area is 137 cm. Precipitation averages 71 cm annually and is generally distributed evenly throughout the year with higher values often recorded in June and July [50].

2.2. Field Methods

Sampling of the woody understory occurred during the 12th growing season (July–September 2012) after harvest over frozen ground with approximately 60 cm of snowpack during December 2000 and January 2001. The typical rotation for P. tremuloides in this region ranges from 35 to 50 years for pulp production, but varies with site quality, so we consider these observations to be medium-term. Transects running perpendicular to harvest edges (from south to north, into harvested areas) were replicated twice for each of two overstory conditions (intact forest and aggregates) at each of three sites. This design was intended to maximize the shading influence of mature overstory trees. In a few cases, the azimuth of transects was adjusted slightly to avoid conditions that could confound results (i.e., a skid trail). Intact forest stands were larger unharvested forest tracts located immediately adjacent to the cut area (Figure 1). They extended for the length of the harvest boundary and were required to have interiors with a minimum of 100 m from edge in any direction. Transects extended from plots located 15 m within these stands (under mature canopy) out to 45 m into harvested areas (no mature canopy) for a total length of 60 m. Aggregate transects extended from near the center of those aggregates (15 m from harvested edge, Figure 1) out to open, harvested conditions located 45 m from the aggregate edge (total length of 60 m). This maximum distance (45 m from edge into harvests) exceeded the average height of dominant canopy trees (17.4 m) and ensured that the associated aggregate was the nearest unharvested forest to each sampling point. As such, plots at 45 m served as regenerating forest reference conditions, where shrubs and trees grew in open conditions, free from mature overstory canopy and forest influence.
To accommodate increased stem density in smaller size classes, decreasing plot sizes were nested and centered at regular, 10 m intervals along each transect (Figure 1) to sample three different strata of the forest understory. The largest plot (78.5 m2, 5 m radius) was circular and used to sample the density, diameter at breast height (DBH), and species of shrubs and trees >2.54 cm DBH and <10 cm DBH (hereafter: large shrubs and large saplings). Centered within large plots were smaller, circular plots (5 m2, 1.26 m radius) for sampling the density, diameter at 15 cm height (D15), and species of shrubs and trees >1 m height and <2.54 cm DBH (hereafter: medium shrubs and small saplings). Lastly, the percent cover of all shrubs and trees <1 m height (hereafter: small shrubs and seedlings) was recorded in paired 1-m2 quadrats that were perpendicular to and 2-m distant from plot center (Figure 1).

2.3. Analysis

2.3.1. Understory Forest Structure and Standing Biomass

Forest structure was quantified in terms of stem density, mean stem diameter, and above-ground standing biomass by guild (tree or shrub species) in the two upper strata (medium to large stems >1 m height) described above. Additionally, the diversity of sapling diameters (all tree stems >1 m height and <10 cm DBH), a measure of structural complexity, was calculated by assigning saplings to 2.5 cm DBH classes and using the Shannon Diversity index (H’). Species-specific allometric equations developed for the Lake States region were used for biomass estimation of tree and shrub species based on field measurements of diameter [51]. Only percent cover of each species was recorded for woody stems shorter than 1 m (seedlings and small shrubs).
We used non-metric multidimensional scaling (NMS) to look at understory structure and structural complexity collectively using all strata and guilds [52,53]. In order to limit multicollinearity, the analysis only included structure variables not strongly correlated with one another (r < 0.7 for all pairs, Table 1). Measures of structure were relativized across plots so that analysis was not dominated by any one structural component, which also revealed those conditions most strongly associated with each variable (Table 1; [53]). Correlations between all measures of structure and NMS axis scores were tested using Kendall’s Tao. Ordinations were performed in PC-ORD v. 6.08 (MjM Software Design, Gleneden Beach, OR, US). Two factors, effects of overstory condition (intact forest vs. aggregate) and harvest status (harvested vs. unharvested), and their interaction were tested with permutational multivariate analysis of variance (PERMANOVA) using the Adonis function in the vegan package [54] in R (R Core Team 2016, v. 3.3.1, R Foundation for Statistical Computing, Vienna, Austria).

2.3.2. Forest Influence and Edge Effects

We defined forest influence as occurring where a difference from reference conditions (plots at 45 m from edge) occurred in a given structural variable in consecutive plots extending from the harvest edge into unharvested or harvested areas (all distances −15 m to 35 m, Figure 1) [55]. To account for variability among transects, we quantified the degree of influence or effect (difference from the reference) using the following equation adapted from methods for assessing magnitude of edge influence (MEI; [55]):
MEI = (er)/(e + r),
where e represents the mean responses for plots located some distance from harvest edges and r represents the mean of observations from a reference condition located in open, harvested conditions along the same transect (i.e., plots 45 m from edge; Figure 1). This approach yields values that range between −1 and 1, with a value of 0 indicating no difference from conditions that might be expected following a conventional clearcut harvest [55]. We then tested the null hypothesis that aggregates and intact forest had no influence (MEI = 0) on surrounding regenerating areas using the randomized test of edge influence (RTEI) approach [56,57,58]. This entailed comparing mean observed MEI to 95% confidence intervals derived from a distribution of randomized MEI values for each response variable at each distance, individually (i.e., [56]). The randomized distributions were generated using blocking, with 5000 permutations per site (block) [55].
Multilevel linear modeling provided a secondary approach for determining whether mature overstory trees (aggregates and intact forest) influenced understory structure and standing biomass in nearby regenerating forest. While the models do not indicate a distance threshold for influence, they allow testing of relationships between distance from harvest edge and each component of structure, specifically within harvested areas. The observed value for each structural variable in harvested plots (5 m to 45 m, Figure 1) served as the response and was transformed as necessary to meet statistical assumptions (as indicated in Table B1). Distance from harvest edge into regenerating forest was treated as a fixed effect. A random intercept term was included for overstory condition (intact forest vs. aggregate) as well as for transect (nested within site) in all models. A random intercept term was also included for site where that term accounted for significant covariance and comparison of models using Akaike’s Information Criterion for small sample sizes (AICc) suggested an improved fit. Analyses were conducted in SAS 9.4 using the MIXED procedure.

3. Results

3.1. Forest Structure and Standing Biomass

Ordination of structural components revealed a gradient in understory structure and productivity (standing biomass) most strongly related to the presence of overstory trees (harvest status; Figure 2; Table A1 and Table A2). A three-dimensional NMS ordination provided the best solution (stress = 13.1%) and clearly distinguished harvested and unharvested plots along Axis 1 (Figure 2). Medium and large shrub density and biomass, total understory biomass, diameter diversity for small saplings, and low shrub cover were all positively and significantly correlated with Axis 1 scores (Table 1). This indicates that relative values for each of these structural components increased along a general gradient extending from the inner-most plots beneath mature overstory to harvested plots located furthest from harvest edges. Clear differences between the effects of overstory condition (aggregates vs. intact forest) on the difference in axis scores between observations and the reference were not apparent for Axis 1 or Axis 2, but differences were evident along Axis 3 which explains 13% of the variation in structure (Table A2). The density of medium shrubs, density and biomass of small saplings, and cover of small shrubs were all positively correlated with this axis (Table 1). While the mean Axis 3 scores were higher for plots within and near intact forest (−0.01) compared to aggregates (−0.08), the mean difference between observations and the reference (ΔA3) was more negative for intact forest (−0.44) than for aggregates (−0.19). Measures of P. tremuloides abundance, specifically, did not correlate with Axis 1 or Axis 3, the two axes generally associated with the factors tested in this study (Table 1). Analysis with PERMANOVA confirmed the significant effect of harvest status (F = 15.105, p = 0.0002), but did not detect any differences related to overstory condition (intact forest vs. aggregates; F = 1.332, p = 0.246; Table A1).

3.2. Magnitude and Distance of Forest Influence and Edge Effects

Estimation of the distance of forest influence revealed differences between aggregates and intact forest not immediately apparent with NMS. Proximity to intact forest reduced total understory biomass, large sapling density, and large sapling biomass up to 5 m into harvested areas (Figure 3, panels B, D, G). Values for those structural components within aggregates (−15 m and −5 m, Figure 3) were also different from the reference conditions, but aggregate influence on harvested areas was only observed for large sapling biomass (up to 5 m, Figure 3). The environment created by close proximity to aggregates also reduced seedling cover substantially relative to the reference conditions, but only in regenerating forest immediately adjacent to the harvest edge (5 m).
While mixed effects models do not allow an estimation of distance of effect, results generally confirmed the DEI analysis with a positive relationship occurring between total understory biomass, large sapling biomass, and large sapling density and distance from harvest edge across both treatments (Table B1).

4. Discussion

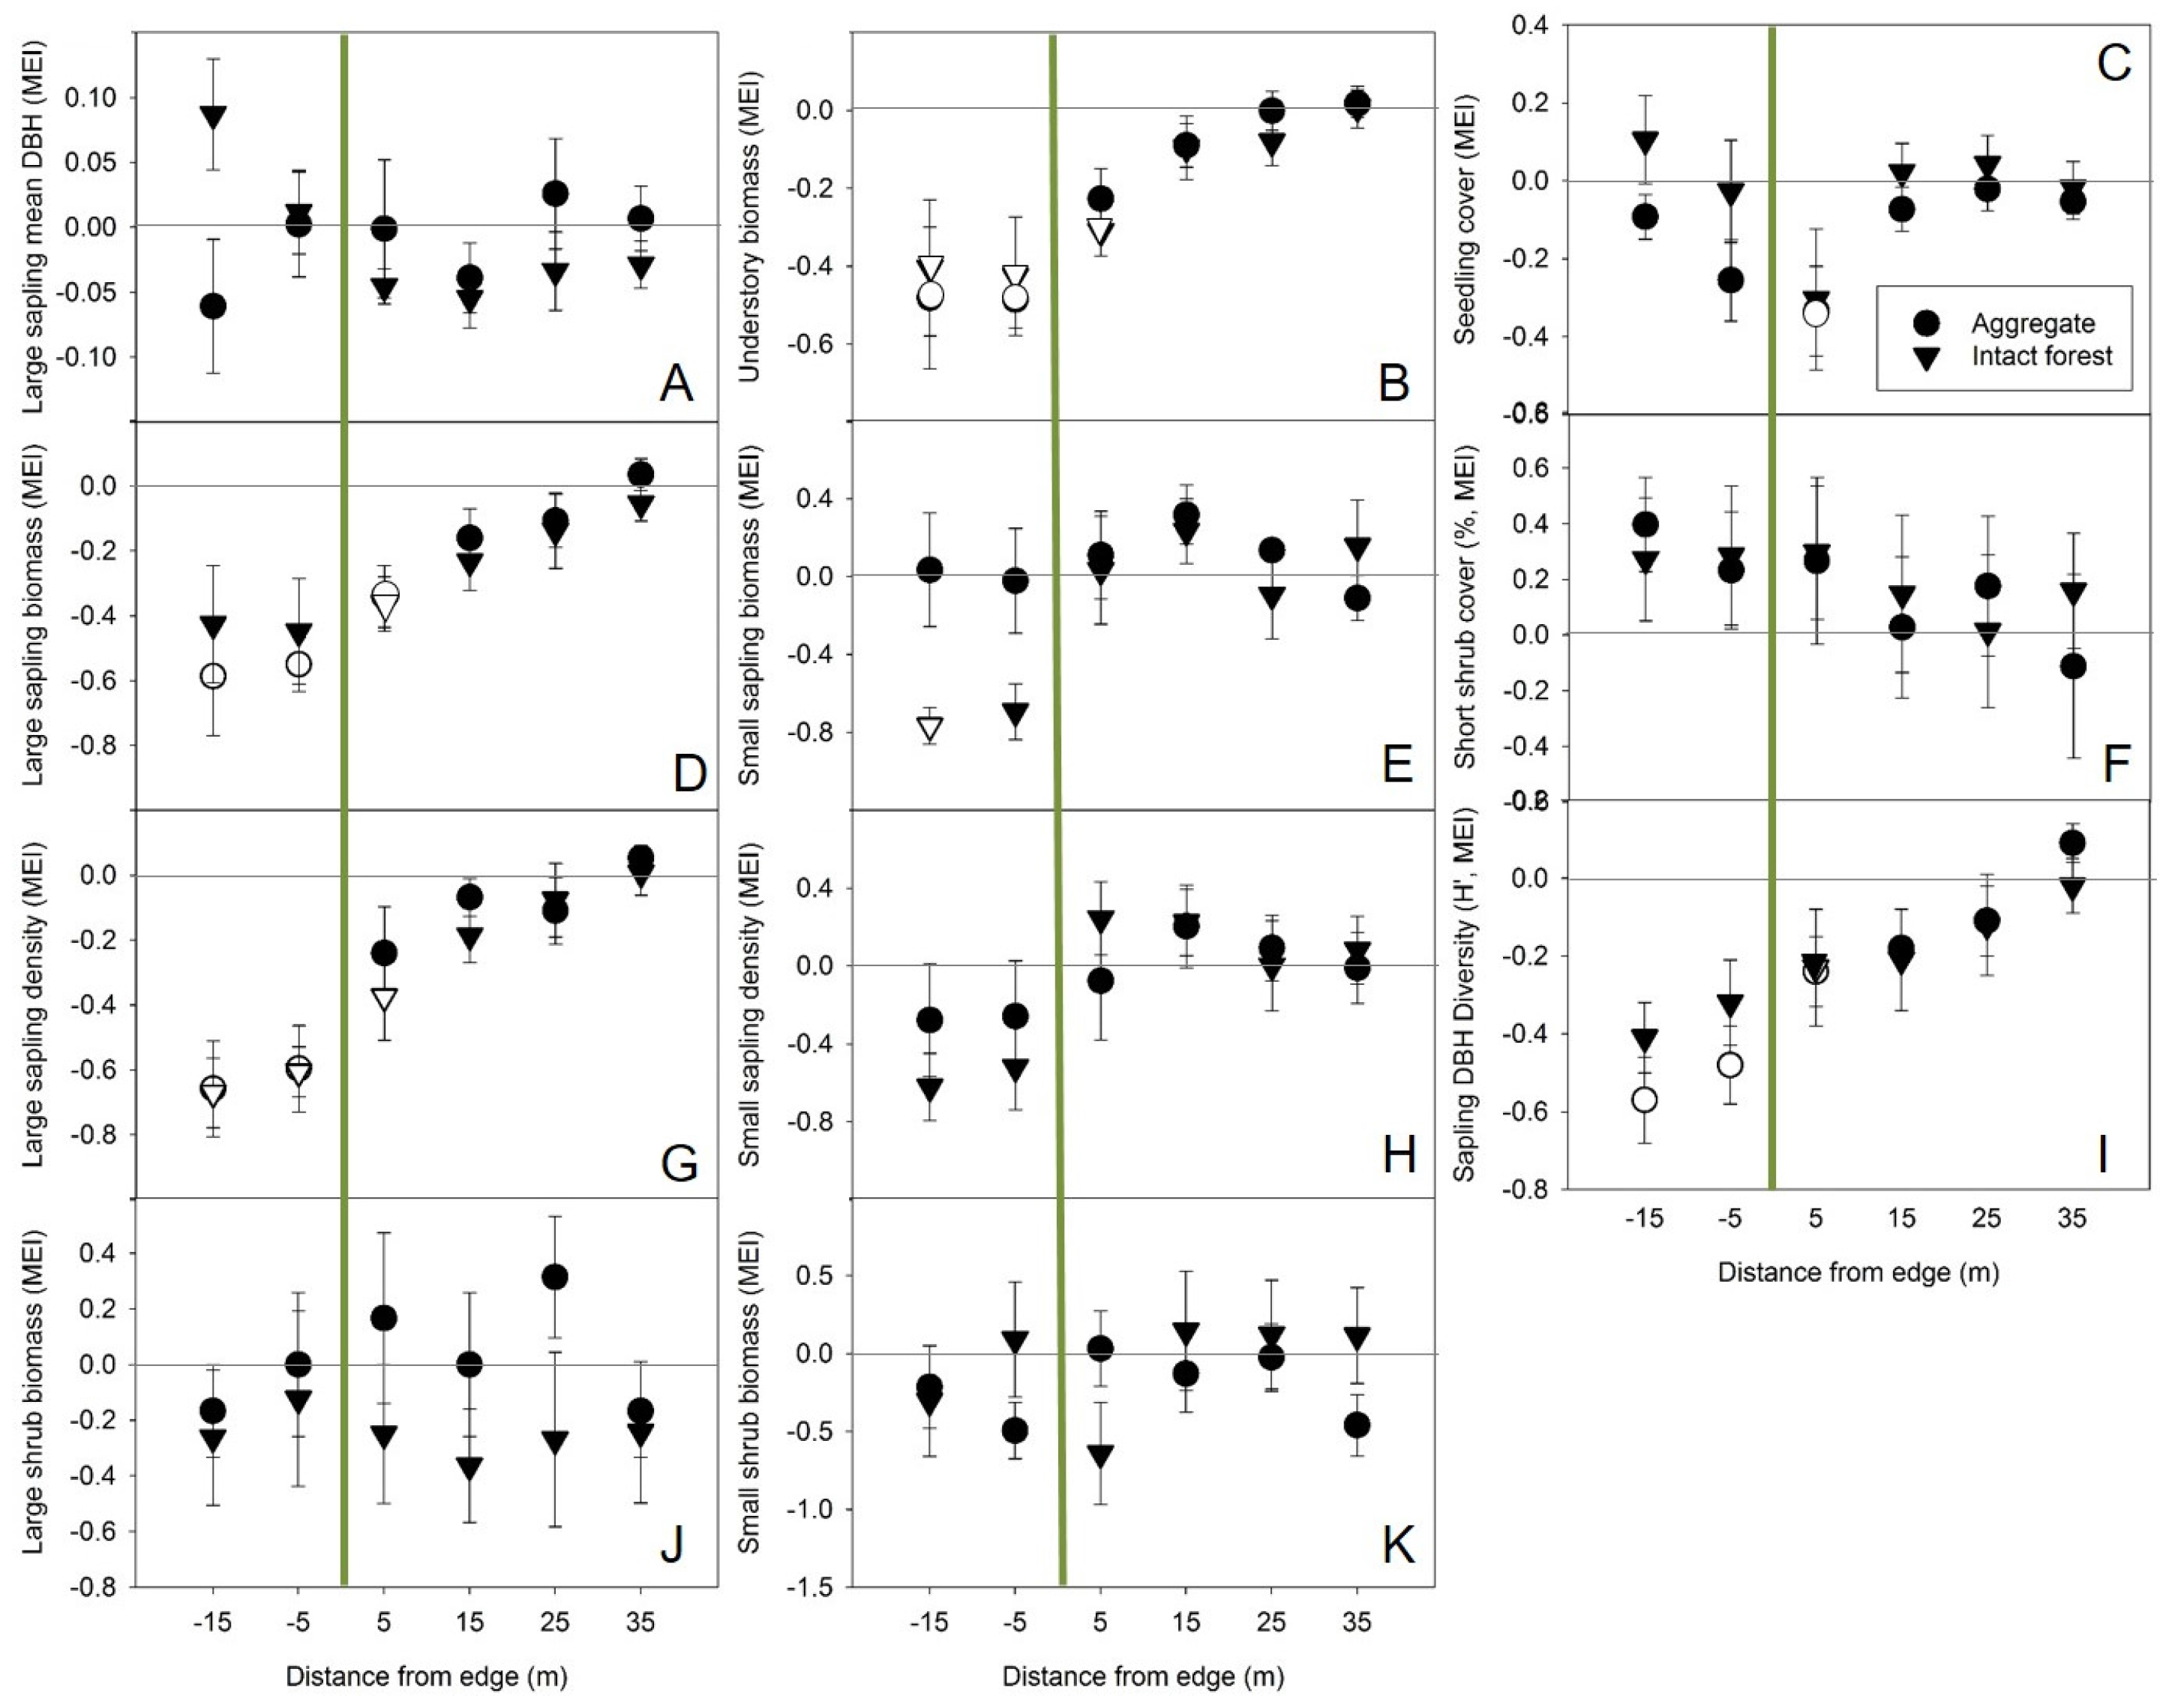
Overall, fewer differences between the effects of intact forest and aggregated retention were observed relative to expectations despite the small size of aggregates (0.1 ha) included in this study. Instead, distance from harvest edge (up to 5 m into harvests) and whether a plot was harvested or unharvested had more influence on structure and standing biomass of regeneration and the woody understory, regardless of whether transects were adjacent to intact forest or aggregates. Yet, even given these similarities, analysis of depth of edge influence suggests that forest influence exerted by aggregates resulted in fewer significant effects on structural variables indicative of regeneration success (i.e., large sapling density and total understory biomass). These findings have implications for managers who are interested in implementing retention practices but are also concerned about losses to productivity of the regenerating forest.
The general similarity in influence on the structure of regeneration that occurred between aggregates and intact forest is consistent with observations of community composition in vascular plant and beetle species on the same sites [49]. These results are also consistent with comparisons of the extent of microclimate effects between aggregates and intact forest reported for cool, temperate Eucalyptus forest in Tasmania three to four years after harvest [43]. While forest influence may vary across a harvest with differences in aspect, we positioned transects as consistently as possible to maximize the influence of shade from mature, overstory trees on surrounding harvested areas. If a substantial difference in the mortality of overstory trees near the harvest edge does not exist between aggregates and intact forests, then neither would the resulting shade and influence on the microclimate during the middle of the day when shading would be expected to be most similar for the two patch sizes given sun position and have the greatest impact on ameliorating microclimatic conditions [43].
We also suspect that the rapid development of regenerating harvested areas, particularly given the dominance by P. tremuloides, a prolific and fast-growing species [29], has lessened the contrast between mature forest and regenerating harvests (as suggested in [44]) leading to fewer differences in the microenvironment and in resource availability between mature and regenerating forest that may have existed previously. The distance of influence we observed associated with both overstory conditions is shorter than reported for other regions over periods of up to 20 years (i.e., Psuedotsuga menziesii-dominated forests in Washington, DC, USA; [15]). However, it is consistent with evidence from studies in boreal and sub-boreal forests more similar to those assessed here that suggest that the response of regeneration growth and density to proximity to mature overstory trees may generally extend short distances [44]. The lower stature of these forests (mean mature overstory height of 17.4 m across the study) may contribute to the shorter distances of influence relative to other systems such as those dominated by P. menziesii where a moderate site index at 100 years ranges 32–35 m [59] and in mature temperate eucalypt forests with overstory tree heights of 35–50 m [49].
Variability within and across sites as well as other variables not included in these analyses appeared to be more important drivers of differences in sapling densities and biomass than either overstory condition of nearby retention (aggregate vs. intact forest) or distance from edge (Figure 2, Table A2). Although a reduction in total large sapling biomass was observed in harvested areas immediately adjacent to aggregates, the density of large saplings in total, and the density and biomass of large P. tremuloides saplings specifically, was variable and not significantly different from open conditions at all distances from edge. P. tremuloides abundance also showed only weak relationships with the two NMS axes associated with distance from edge and overstory condition (Axes 1 and 3, respectively). These results contrast with reductions in stem density and biomass observed in P. tremuloides-dominated systems with 40% basal area retained [38]. However, our results align with findings that retention level (up to 50% basal area retained) had little effect on total or specifically aspen/birch sapling densities [22] and that stem density may be less impacted by retained overstory trees than growth rates [27]. Comparable eucalypt densities and growth rates between harvests with aggregated retention compared to clearcuts also suggests negative impacts on crop tree regeneration may be less of a concern in some systems [60]. The negative forest influence on sapling diameter diversity observed here, while minimal, suggests that overstory retention may retard structural development [60].
Shrub biomass immediately adjacent to aggregates, while not found to be significantly affected by forest influence, may have been high enough on average to make up for any reduction in sapling biomass contributing to the overall standing biomass pool (Figure 3). Aggregates had a negative influence on seedling cover up to 5 m into regenerating harvest areas, but negative correlations between seedling cover and multiple measures of shrub abundance suggest this could have been an indirect effect resulting from the level of competition exerted by shrubs which were relatively high in density, biomass, and cover near the harvested side of those edges (Figure 3). As observed in boreal aspen-mixed woods [35], retention did not appear to reduce competition from shrubs in nearby harvested areas. In fact, interpretation of the lesser difference between observed plots and reference (open, harvested) plots near aggregates along Axis 3 (positively correlated with small shrub abundance) suggests the possibility that aggregates had a lower negative influence on shrubs than intact forest.

5. Conclusions

Our study addresses a knowledge gap in the medium-term effects of retention harvesting practices on the structure and productivity of natural regeneration. Overall, small retention aggregates operated similarly to intact forest in terms of influencing the structural characteristics of regeneration 12 years following harvest, but with significant effects only extending 5 m into harvested areas. While the maximum extent of influence was the same for the two overstory conditions, there was some evidence that aggregates influenced fewer structural variables. This suggests the trade-off between ecological and productivity/regeneration objectives might be minimal when using similar retention approaches.
Retention aggregates may not provide the same habitat as interior forest [5], although general vegetation composition was found to be quite similar at our study sites [49]. While aggregated retention achieves some ecological goals regardless of retention patch size [42], retaining larger areas (>1 ha) of mature forest is generally recommended [10]. Given the similarities in influence on regeneration between intact forest and small aggregates observed here, managers choosing to retain larger aggregates may be able to do so without increasing the extent of reduced productivity into harvested areas. Future work should explore the influence of aggregate size on the magnitude and distance of forest influence on biodiversity as well as on regeneration densities and production to inform management decisions on the most functional organization and distribution of aggregated retention for balancing an array of objectives.

Acknowledgments

The authors thank Potlatch Corporation and the Cass County, MN Land Department for access to study sites and logistical support. Wes Bailey assisted with field work and data management. We also thank Courtney Kerns, Cassandra DeMillo, and Brian Clough for help in the field or with other aspects of the study. This research was supported by the USDA Forest Service, Northern Research Station and the Department of Interior Northeast Climate Science Center. We dedicate this article to the late Wes Bailey, whose commitment and hard work made this study possible.

Author Contributions

S.C.B., C.C.K., and B.J.P. conceived and designed the experiments; M.T.C. analyzed the data. M.T.C., S.C.B., C.C.K., B.J.P., and A.W.D. wrote the manuscript.

Conflicts of Interest

The authors declare no conflict of interest.

Appendix A. Effects of Overstory Condition and Distance from Harvest Edge on Plot Distribution in Species Space (NMS)

Table A1. PERMANOVA results for structural variables included in NMS ordination. Factor designations are as follows: Overstory, aggregate vs. intact forest; Harvest status, harvested vs. unharvested; overstory ×harvest, interaction between the two main factors.
EffectDfFp-Value
Overstory11.3320.246
Location515.1050.0002
Overstory × Location50.72160.615
Table A2. Mixed effects ANOVA results for differences in axis scores between observed plots and open, harvested reference condition. Factor designations are as follows: Overstory condition, aggregate vs. intact forest; Location, distance (± m) from harvest edge; overstory X location, interaction between the two main factors. Bold text indicates statistical significance with p < 0.05.
Δ Axis 1 (60.4%)Δ Axis 2 (16.3%)Δ Axis 3 (13.2%)
SourceDFFp-ValueFp-ValueFp-Value
Overstory condition11.770.19022.350.13174.130.0477
Location52.090.083511.48<0.00012.120.0787
Condition × Location50.650.66260.780.56862.240.0658
Table A3. Means with standard error in parentheses for differences in Axis scores between observed plots at each location relative to harvest edge and reference plots (45 m into harvest). Negative numbers for distance from edge indicate plots are unharvested (Figure 1). Lower-case letters in superscript indicate significant differences (p < 0.05) between plot means at different distances where distance as determined with post-hoc Tukey-adjusted pairwise comparisons was a significant main factor.
Location (m)Δ Axis 1Δ Axis 2Δ Axis 3
−15−0.61 (0.267)0.75 (0.109) a−0.53 (0.119)
−5−0.61 (0.232)0.69 (0.107) a,b−0.20 (0.125)
5−0.21 (0.202)0.23 (0.182) b,c−0.45 (0.081)
150.09 (0.144)−0.07 (0.128) c−0.40 (0.184)
250.04 (0.230)0.07 (0.124) c−0.23 (0.152)
35−0.14 (0.176)−0.13 (0.090) c−0.09 (0.128)
Table A4. Means with standard error in parentheses for differences in NMS Axis scores between observed (all distances from harvest edge) and reference plots (45 m into harvest) as they differed between intact forest versus aggregates. Lower-case letters in superscript indicate where the main factor, overstory type, was significant.
Overstory ConditionΔ Axis 1Δ Axis 2Δ Axis 3
Aggregate−0.12 (0.111)0.31 (0.096)−0.19 (0.069) a
Intact forest−0.44 (0.150)0.15 (0.088)−0.44 (0.088) b

Appendix B. Multilevel Models for Structure Response to Distance from Harvest Edge

Table B1. Parameter estimates with standard error in parentheses for multilevel models of the effect of distance from harvest edge on forest understory structure. The R2 provided comes from the regression of observed on predicted values for each model. Abbreviations are as follows: biomass, BM; diameter at breast height, DBH; Populus tremuloides, POTR.
ResponseFixed EffectsRandom Effects
InterceptpDistancepAggregate (Intercept)Intact Forest (Intercept)pR2
Understory woody BM (Mg/ha)12.17 (1.38)0.00030.19 (0.04)<0.00010.20 (0.51)−0.20 (0.51)0.7600.44
Large sapling BM (Mg/ha)7.75 (1.74)0.03430.21 (0.04)<0.00010.88 (1.26)−0.88 (1.26)0.6130.58
Small sapling BM (Mg/ha0.5)1.42 (0.28)0.0497−0.01 (0.05)0.12−0.03 (0.11)0.03 (0.11)0.8270.70
Large sapling density (stems/ha)5104.04 (698.33)0.004186.26 (18.13)<0.000116.99 (131.65)−6.99 (131.65)0.9180.59
Small sapling density(Mg/ha0.5)110.89 (32.47)0.0574−0.25 (0.39)0.53−2.89 (8.54)2.89 (8.54)0.7920.71
Diversity (H’), sapling DBH0.24 (0.04)0.00870.005 (0.001)<0.00010.02 (0.03)−0.02 (0.03)0.5770.53
POTR, large sapling BM (Mg/ha)4.41 (2.36)0.18850.29 (0.061)<0.00010.924 (1.367)−0.924 (1.367)0.6220.46

References

  1. Seidl, R.; Fernandes, P.M.; Fonseca, T.F.; Gillet, F.; Jönsson, A.M.; Merganičová, K.; Netherer, S.; Arpaci, A.; Bontemps, J.D.; Bugmann, H.; et al. Modeling natural disturnaces in forest ecosytems: A review. Ecol. Model. 2011, 222, 903–924. [Google Scholar] [CrossRef]
  2. Dale, V.H.; Joyce, L.A.; McNulty, S.; Neilson, R.P.; Ayres, M.P.; Flannigan, M.D.; Hanson, P.J.; Irland, L.C.; Lugo, A.E.; Peterson, C.J.; et al. Climate change and forest disturbances. Bioscience 2001, 51, 723–734. [Google Scholar] [CrossRef]
  3. Lindner, M.; Maroschek, M.; Netherer, S.; Kremer, A.; Barbati, A.; Garcia-Gonzalo, J.; Seidl, R.; Delzon, S.; Coronoa, P.; Kolstrom, M.; et al. Climate impacts, adaptive capacity, and vulnerability of European forest ecosystems. For. Ecol. Manag. 2010, 259, 698–709. [Google Scholar] [CrossRef]
  4. Lindenmayer, D.B.; Franklin, J.F.; Lohmus, A.; Baker, S.C.; Bauhus, J.; Beese, W.; Brodie, A.; Kiehl, B.; Kouki, J.; Martinez Pastur, G.; et al. A major shift to the retention approach for forestry can help resolve some global forest sustainability issues. Conserv. Lett. 2012, 5, 421–431. [Google Scholar] [CrossRef]
  5. Fedrowitz, K.; Koricheva, J.; Baker, S.C.; Lindenmayer, D.B.; Palik, B.J.; Rosenvald, R.; Beese, W.; Franklin, J.F.; Kouki, J.; Macdonald, S.E.; et al. Can retention forestry help conserve biodiversity? A meta-analysis. J. Appl. Ecol. 2014, 51, 1669–1679. [Google Scholar] [CrossRef] [PubMed] [Green Version]
  6. Gustafsson, L.; Kouki, J.; Sverdrup-Thygeson, A. Tree retention as a conservation measure in clear-cut forests of northern Europe: A review of ecological consequences. Scand. J. For. Res. 2010, 25, 295–308. [Google Scholar] [CrossRef]
  7. Seymour, R.; Hunter, M.L., Jr. Principles of ecological forestry. In Composition in Managing Forests for Biodiversity; Hunter, M.L., Jr., Ed.; Cambridge University Press: New York, NY, USA, 2002; pp. 22–61. [Google Scholar]
  8. Franklin, J.F.; Spies, T.A.; Van Pelt, R.; Carey, A.B.; Thornburgh, D.A.; Berg, D.R.; Lindenmayer, D.B.; Harmon, M.E.; Keeton, W.S.; Shaw, D.C. Disturbances and structural development of natural forest ecosystems with silvicultural implications, using Douglas-fir forests as an example. For. Ecol. Manag. 2002, 155, 399–423. [Google Scholar] [CrossRef]
  9. Hunter, M.L., Jr. Maintaining biodiversity in forest ecosystems. In Composition in Managing Forests for Biodiversity; Hunter, M.L., Jr., Ed.; Cambridge University Press: New York, NY, USA, 2002; pp. 3–21. [Google Scholar]
  10. Halpern, C.B.; Halaj, J.; Evans, S.A.; Doviak, M. Level and pattern of overstory retention interact to shape long-term responses of understories to timber harvest. Ecol. Appl. 2012, 22, 2049–2064. [Google Scholar] [CrossRef] [PubMed]
  11. McElhinny, C. Forest and Woodland Structure as an Index of Biodiversity: A Review; A literature review; NSW National Parks and Wildlife Service: Sydney, Australia, 2002; p. 84.
  12. Rosenvald, R.; Lõhmus, A. For what, when, and where is green-tree retention better than clear-cutting? A review of the biodiversity aspects. For. Ecol. Manag. 2008, 255, 1–15. [Google Scholar] [CrossRef]
  13. Heithecker, T.D.; Halpern, C.B. Edge-related gradients in microclimate in forest aggregates following structural retention harvests in western Washington. For. Ecol. Manag. 2007, 248, 163–173. [Google Scholar] [CrossRef]
  14. Baker, T.P.; Jordan, G.J.; Steel, E.A.; Fountain-Jones, M.M.; Wardlaw, T.J.; Baker, S.C. Microlimate through space and time: Microclimatic variation at the edge of regeneration forests over daily, yearly and decadal time scales. For. Ecol. Manag. 2014, 334, 174–184. [Google Scholar] [CrossRef]
  15. Baker, S.C.; Halpern, C.B.; Wardlaw, T.J.; Crawford, R.L.; Bigley, R.E.; Edgar, G.J.; Evans, S.A.; Franklin, J.F.; Jordan, G.J.; Karpievitch, Y.; et al. Short- and long-term benefits for forest biodiversity of retaining unlogged patches in harvested areas. For. Ecol. Manag. 2015, 353, 187–195. [Google Scholar] [CrossRef]
  16. Hansen, A.J.; Garman, S.L.; Weigand, J.F.; Urban, D.L.; McComb, W.C.; Raphael, M.G. Alternative silvicultural regeimes in Pacific Northwest: Simulations of ecological and economic effects. Ecol. Appl. 1995, 5, 535–554. [Google Scholar] [CrossRef]
  17. Halpern, C.B.; Evans, S.A.; Nelson, C.R.; McKenzie, D.; Ligouri, D.A. Response of forest vegetation to varying levels and patterns of green-tree retention: An overview of a long-term experiment. Northwest Sci. 1999, 73, 27–44. [Google Scholar]
  18. Franklin, J.F.; Berg, D.R.; Thornburgh, D.A.; Tappeiner, J.C. Alternative silvicultural approaches to timber harvesting: Variable retention harvest systems. In Creating a Forestry for the 21st Century; Kohm, K.A., Franklin, J.F., Eds.; Island Press: Washington, DC, USA, 1997; pp. 111–139. [Google Scholar]
  19. Gustafsson, L.; Baker, S.C.; Bauhus, J.; Beese, W.J.; Brodie, A.; Kouki, J.; Lindenmayer, D.B.; Lõhmus, A.; Guillermo, M.P.; Messier, C.; et al. Retention forestry to maintain multifunctional forests: A world perspective. Bioscience 2012, 62, 633–645. [Google Scholar]
  20. Palik, B.J.; Engstrom, R.T. Species composition. In Managing for Biodiversity; Hunter, M.L., Jr., Ed.; Cambridge University Press: New York, NY, USA, 2002; pp. 65–94. [Google Scholar]
  21. Wright, E.F.; Coates, K.D.; Canham, C.D.; Bartemucci, P. Species variability in growth response to light across climatic regions in northwestern British Columbia. Can. J. For. Res. 1998, 28, 871–886. [Google Scholar] [CrossRef]
  22. Newsome, T.A.; Henieman, J.L.; Nemec, A.F.L.; Comeau, P.G.; Arsenault, A.; Waterhouse, M. Ten-year regeneration responses to varying levels of overstory retention in two productive southern British Columbia ecosystems. For. Ecol. Manag. 2010, 260, 132–145. [Google Scholar] [CrossRef]
  23. Boyden, S.; Montgomery, R.; Reich, P.B.; Palik, B. Seeing the forest for the heterogeneous trees: Stand-scale resource distributions emerge from tree-scale structure. Ecol. Appl. 2012, 22, 1578–1588. [Google Scholar] [CrossRef] [PubMed]
  24. Palik, B.J.; Mitchell, R.J.; Pecot, S.; Battaglia, M.; Mou, P. Spatial distribution of overstory retention influences resources and growth of longleaf pine seedlings. Ecol. Appl. 2003, 13, 674–686. [Google Scholar] [CrossRef]
  25. Aubry, K.B.; Halpern, C.B.; Maguire, D.A. Ecological effects of variable-retention harvests in the north-western United States: The DEMO study. For. Snow Landsc. Res. 2004, 78, 119–137. [Google Scholar]
  26. Mitchell, A.K.; Koppenall, R.; Goodmanson, G.; Benton, R.; Brown, T. Regenerating montane conifers with variable retention systems in a coastal British Columbia forest: 10-year results. For. Ecol. Manag. 2007, 246, 240–250. [Google Scholar] [CrossRef]
  27. Urgenson, L.S.; Halpern, C.B.; Anderson, P.D. Twelve-year responses of planted and natural regenerating conifers to variable-retention harvest in the Pacific Northwest, USA. Can. J. For. Res. 2013, 43, 46–55. [Google Scholar] [CrossRef]
  28. Mitchell, S.J.; Beese, W.J. The retention system: Reconciling variable retention with the principles of silvicultural systems. For. Chron. 2002, 78, 397–403. [Google Scholar] [CrossRef]
  29. Frey, B.R.; Lieffers, V.J.; Landhausser, S.M.; Comeau, P.G.; Greenway, K.J. An analysis of sucker regeneration of trembling aspen. Can. J. For. Res. 2003, 33, 1169–1179. [Google Scholar] [CrossRef]
  30. Luoma, D.L.; Stockdale, C.A.; Molina, R.; Eberhart, J.L. The spatial influence of Pseudotsuga menziesii retention trees on ectomycorrhizal diversity. Can. J. For. Res. 2006, 36, 2561–2573. [Google Scholar] [CrossRef]
  31. Bose, A.K. Sapling recruitment and mortality dynamics following partial harvesting in aspen-dominated mixedwoods in eastern Canada. For. Ecol. Manag. 2004, 329, 37–48. [Google Scholar] [CrossRef]
  32. Royo, A.A.; Carson, W.P. On the formation of dense understory layers in forests worldwide: Consequences and implcations for forest dynamics, biodiversity, and succession. Can. J. For. Res. 2006, 36, 1345–1362. [Google Scholar] [CrossRef]
  33. Dovčiak, M.; Reich, P.B.; Frelich, L.E. Seed rain, safe sites, competing vegetation and soil resources spatially structure white pine regeneration and recruitment. Can. J. For. Res. 2003, 33, 1892–1904. [Google Scholar] [CrossRef]
  34. Montgomery, R.A.; Palik, B.J.; Boyden, S.B.; Reich, P.B. New cohort growth and survival in variable retention harvests of a pine ecosystem in Minnesota, USA. For. Ecol. Manag. 2013, 310, 327–335. [Google Scholar] [CrossRef]
  35. MacDonald, G.B.; Cherry, M.L.; Thompson, D.J. Effect of harvest intensity on development of natural regeneration and shrubs in an Ontario boreal mixedwood stand. For. Ecol. Manag. 2004, 189, 207–222. [Google Scholar] [CrossRef]
  36. Pre´vost, M.; Pothier, D. Partial cuts in a trembling aspen conifer stand: Effects on microenvironmental conditions and regeneration dynamics. Can. J. For. Res. 2003, 33, 1–15. [Google Scholar] [CrossRef]
  37. Brais, S.; Harvey, B.D.; Bergeron, Y.; Messier, C.; Greene, D.; Belleau, A.; Pare, D. Testing forest ecosystem management in boreal mixedwoods of northwestern Quebec: Initial response of aspen stands to different levels of harvesting. Can. J. For. Res. 2004, 34, 431–446. [Google Scholar] [CrossRef]
  38. Palik, B.; Cease, K.; Egeland, L.; Blinn, C. Aspen regeneration in riparian management zones in northern Minnesota: Effects of residual overstory and harvest method. North. J. Appl. For. 2003, 20, 79–84. [Google Scholar]
  39. Man, R.; Kayahara, G.J.; Rice, J.A.; MacDonald, G.B. Eleven-year responses of a boreal mixedwood stand to partial harvesting: Light, vegetation, and regeneration dynamics. For. Ecol. Manag. 2008, 255, 697–706. [Google Scholar] [CrossRef]
  40. Bradshaw, F.J. Quantifying edge effect and patch size for multiple-use silviculture—A discussion paper. For. Ecol. Manag. 1992, 48, 249–264. [Google Scholar] [CrossRef]
  41. Keenan, R.J.; Kimmins, J.P. The ecological effects of clear-cutting. Environ. Rev. 1993, 1, 121–144. [Google Scholar] [CrossRef]
  42. Baker, S.C.; Spies, T.A.; Wardlaw, T.J.; Balmer, J.; Franklin, J.F.; Jordan, G.J. The harvested side of edges: Effect of retained forests on the re-establishment of biodiversity in adjacent harvested areas. For. Ecol. Manag. 2013, 302, 107–121. [Google Scholar] [CrossRef]
  43. Baker, T.P.; Jordan, G.J.; Baker, S.C. Microclimatic edge effects in a recently harvested forest: Do remnant forest patches create the same impact as large forest areas? For. Ecol. Manag. 2016, 365, 128–136. [Google Scholar] [CrossRef]
  44. Harper, K.A.; Drapeau, P.; Lesiur, D.; Bergeron, Y. Negligible structural development and edge influence on the understory at 16–17-yr-old clear-cut edges in black spruce forest. Appl. Veg. Sci. 2016, 19, 462–473. [Google Scholar] [CrossRef]
  45. Scott, R.E.; Mitchell, S.J. Empirical modelling of windthrow risk in partially harvested stands using tree, neighbourhood, and stand attributes. For. Ecol. Manag. 2005, 218, 193–209. [Google Scholar] [CrossRef]
  46. Bladon, K.D.; Lieffers, V.J.; Silins, U.; Landhausser, S.M.; Blenis, P.V. Elevated mortality of residual trees following structural retention harvesting in boreal mixedwoods. For. Chron. 2008, 84, 70–75. [Google Scholar] [CrossRef]
  47. Wood, M.J.; Scott, R.; Voker, P.W.; Mannes, D.J. Windthrow in Tasmania, Australia: Monitoring, prediction and management. Forestry 2008, 81, 415–427. [Google Scholar] [CrossRef]
  48. LePage, P.T.; Canham, C.D.; Coates, K.D.; Bartemucci, P. Seed abundance versus substrate limitation of seedling recruitment in northern temperate forests of British Columbia. Can. J. For. Res. 2000, 30, 415–427. [Google Scholar] [CrossRef]
  49. Baker, S.C.; Strengbom, J.; Wardlaw, T.J.; Kern, C.; Edgar, G.J.; Thomson, R.J.; Bigley, R.E.; Franklin, J.F.; Gandhi, K.J.K.; Gustafsson, L.; et al. A cross-continental study of plant and beetle responses to retention of forest patches during timber harvest. Ecol. Appl. 2016, 26, 2493–2504. [Google Scholar] [CrossRef] [PubMed]
  50. Palik, B.J.; Kastendick, D. Response of seasonal pond plant communities to upland forest harvest in northern Minnesota forests, USA. For. Ecol. Manag. 2010, 260, 628–637. [Google Scholar] [CrossRef]
  51. Perala, D.A.; Alban, D. Allometric Biomass Estimators for Aspen-Dominated Ecosystems in the Upper Great Lakes; Research Paper NC-314; USDA Forest Service, North Central Experiment Station: St. Paul, MN, USA, 1994.
  52. Kruskal, J.B. Multidimensional scaling by optimizing goodness of fit to a nonmetric hypothesis. Psychometrika 1964, 29, 1–27. [Google Scholar] [CrossRef]
  53. McCune, B.; Grace, J.B. Analysis of Ecological Communities; MjM Software Design: Gleneden Beach, OR, USA, 2002; p. 300. [Google Scholar]
  54. Oksanen, J.; Blanchet, G.; Friendly, M.; Kindt, R.; Legendre, P.; McGlinn, D.; Minchin, P.R.; O’Hara, R.B.; Simpson, G.L.; Solymos, P.; et al. Vegan: Community Ecology Package. R Package Version 2.4-1. 2016. Available online: Https://CRAN-R-project.org/package=vegan (accessed on 09 July 2016).
  55. Harper, K.A.; MacDonald, E.; Burton, P.J.; Chen, J.; Brosofske, K.D.; Saunders, S.C.; Euskirchen, E.S.; Roberts, D.; Jaiteh, M.S.; Esseen, P. Edge influence on forest structure and composition in fragmented landscapes. Conserv. Biol. 2005, 19, 768–782. [Google Scholar] [CrossRef]
  56. Harper, K.A.; Macdonald, S.E. Quantifying distance of edge influence: A comparison of methods and a new randomization method. Ecosphere 2011, 2, 1–17. [Google Scholar] [CrossRef]
  57. Dodonov, P.; Harper, K.A.; Silva-Matos, D.M. The role of edge contrast and forest structure in edge influence: Vegetation and microclimate at edges in the Brazilian cerrado. Plant Ecol. 2013, 214, 1345–1399. [Google Scholar] [CrossRef]
  58. Dupuch, A.; Fortin, D. The extent of edge effects increases during post-harvesting forest succession. Biol. Conserv. 2013, 162, 9–16. [Google Scholar] [CrossRef]
  59. Means, J.E.; Helm, M.E. Height Growth and Site Index Curves for Douglas-Fir on Dry Sites in the Willamette National Forest; PNW-341 Research Paper; USDA Forest Service, Pacific Northwest Forest and Range Experiment Station: Portland, OR, USA, 1995.
  60. Scott, R.E.; Neyland, M.G.; McElwee, D.J. Early regeneration results following aggregated retention harvesting of wet eucalypt forests in Tasmania, Australia. For. Ecol. Manag. 2013, 302, 254–263. [Google Scholar] [CrossRef]
Figure 1. Transect design. Plots along both intact forest (A) and aggregate (B) transects extend from 15 m within intact canopy (unharvested areas indicated by negative distances) out to 45 m into harvests (positive numbers). The layout of plots centered on each sampling point along each transect is depicted in (C). There are two replicates of each transect type at each study site.
Forests 08 00031 g001
Figure 2. Three-dimensional NMS ordination of plots based on structural conditions. Panels (A,C) illustrate all replicate plots while panels (B,D) are the centroids for each condition. The shade indicates whether plots were located in unharvested areas under mature overstory (black) or in regenerating harvested areas (grey). Symbol shape indicates either aggregate transects (circles) or intact forest transects (triangles), while greater symbol size corresponds with increasing distance (range 5–45 m) from harvest edge. Correlations between structural components and NMS axes are provided in Table 1. Table A2 contains mixed effects ANOVA results indicating treatment effects on differences in axis scores between observed and reference plots.
Forests 08 00031 g002
Figure 3. Magnitude of edge influence (MEI) on woody community structure, including all woody stems <10 cm DBH as it relates to the transition between harvested areas and two types of mature forest overstory (aggregates or intact forest, as indicated by symbol shape). Each panel (AK) presents the MEI for a different structural attribute of regeneration and the woody understory. Observations extend from 15 m within mature canopy (−15 m) up to (+) 35 m into clearcuts. Plots at (+) 45 m served as reference conditions. Forest influence is interpreted as occurring where MEI for a particular trait differs significantly from zero (p < 0.05, indicated by hollow symbols). Solid lines at 0 m (x-axis) indicate the edge between mature canopy (aggregates or intact forest) and adjacent regenerating forest. Total woody biomass (panel D) includes above-ground stem and branch biomass for all understory woody vegetation >1 m height and with DBH < 10 cm. The legend in panel (C) applies to all panels.
Forests 08 00031 g003
Table 1. Kendall’s tau (τ) correlation for understory forest structural components and non-metric multidimensional scaling (NMS) axes. Percentages in parentheses for each axis indicate the variability explained.
Structural ComponentSize Class and GuildAxis 1 (60.4%)Axis 2 (16.3%)Axis 3 (13.2%)
τp-Valueτp-Valueτp-Value
Mean diameterLarge sapling (DBH) *0.1220.1040.1720.0220.2030.007
Small sapling (D15)−0.020.818−0.44<0.0001−0.210.006
DensityMedium shrubs0.507<0.00010.1240.108−0.250.001
Large shrubs0.436<0.00010.2250.010.2980.001
Small saplings *0.0120.881−0.58<0.0001−0.230.003
Large saplings *0.436<0.00010.2250.010.2980.001
BiomassMedium shrubs *0.645<0.00010.1160.126−0.20.01
Large shrubs0.457<0.00010.2360.0070.3020.001
Small saplings0.020.794−0.45<0.00010.2430.001
Large saplings0.1660.027−0.31<0.00010.2530.001
Woody understory * (>1 m height, <10 cm DBH)0.324<0.0001−0.31<0.00010.1730.021
DBH diversity (H’)All saplings *0.0520.488−0.270.0010.368<0.0001
Cover (%)Small shrubs *0.0540.4710.35<0.0001−0.34<0.0001
Seedlings *−0.020.752−0.280−0.030.668
POTR mean diameterLarge saplings (DBH)0.29400.0370.6410.1590.044
POTR biomass (Mg/ha)Small saplings0.0550.486−0.34<0.00010.1570.053
Large saplings0.0740.346−0.270.0010.2650.001
POTR density (stems/ha)Small saplings0.0950.254−0.34<0.0001−0.150.076
Large saplings0.0090.913−0.33<0.00010.1590.044
Asterisks mark those variables included in the NMS ordination. Bold type indicates significant correlations after a Bonferroni-adjustment for multiple testing along each axis (p < 0.05). DBH, diameter at breast height; POTR, Populus tremuloides.

