A Demographic Approach to Evaluating Tree Population Sustainability

Department of Forest and Wildlife Ecology, University of Wisconsin‐Madison, Madison, WI 53706, USA
*
Author to whom correspondence should be addressed.
Forests 2017, 8(2), 46; https://doi.org/10.3390/f8020046
Submission received: 5 October 2016
/
Revised: 2 February 2017
/
Accepted: 16 February 2017
/
Published: 16 February 2017
Abstract
:Quantitative criteria for assessing demographic sustainability of tree populations would be useful in forest conservation, as climate change and a growing complex of invasive pests are likely to drive forests outside their historic range of variability. In this paper, we used CANOPY, a spatially explicit, individual-tree model, to examine the effects of initial size distributions on sustainability of tree populations for 70 northern hardwood stands under current environmental conditions. A demographic sustainability index was calculated as the ratio of future simulated basal area to current basal area, given current demographic structure and density-dependent demographic equations. Only steeply descending size distributions were indicated to be moderately or highly sustainable (final basal area/initial basal area ≥0.7 over several tree generations). Five of the six principal species had demographic sustainability index values of <0.6 in 40%–84% of the stands. However, at a small landscape scale, nearly all species had mean index values >1. Simulation experiments suggested that a minimum sapling density of 300 per hectare was required to sustain the initial basal area, but further increases in sapling density did not increase basal area because of coincident increases in mortality. A variable slope with high q-ratios in small size classes was needed to maintain the existing overstory of mature and old-growth stands. This analytical approach may be useful in identifying stands needing restoration treatments to maintain existing species composition in situations where forests are likely to have future recruitment limitations.
1. Introduction
In plant ecology, there is no close analog to the concept of ‘minimum viable populations’ in animals. Extending this concept to plants has proven difficult because of the increased role that spatial processes play in non-motile populations [1,2]. Nevertheless, several investigators have applied the population viability analysis framework from animal ecology to understory plants [3,4]. In this framework, Monte Carlo simulation is used, generally with a probabilistic life-table model, to assess a population’s probability of persistence [1], oftentimes including the influence of stochastic disturbance. Various persistence criteria have been used. But because population viability analysis is most often applied to threatened or endangered species, persistence criteria are often satisfied if the target population does not become extinct. Less emphasis has been placed on demographic sustainability; i.e., maintaining levels of abundance close to, or above, current levels.
The traditional criterion used to judge the demographic sustainability of tree populations is that size distributions have a descending monotonic form, so that higher numbers of small trees can compensate for size-specific mortality [5,6]. In the American forestry literature, the steepness of slope has been quantified by the ‘q-ratio’, defined as the ratio of the number of trees in successive diameter classes [7,8]. A descending monotonic form, however, is not a definitive criterion of demographic sustainability. Some size distributions of this form could be unsustainable if mortality rates are higher than recruitment rates, and neither of these rates can be determined without long-term data. Moreover, under certain conditions, a steeply descending monotonic form might be unnecessary for sustainability. For example, gap-phase species may not need to maintain large sapling populations to compensate for mortality if sapling growth rates within gaps are high and mortality rates are low [9]. In such cases, a relatively ‘flat’ size distribution might be sustainable. Likewise, a unimodal size distribution could conceivably have an underlying stable age distribution in some cases. Fast growth in smaller trees might allow them to escape high mortality rates in the sapling classes, while low mortality and declining growth with increasing diameter might cause trees to ‘pile up’ in the medium size classes (sensu Goff and West, [10]). Evidence for stable unimodal distributions has been reported for certain species in some tropical forests [9,11].
There are a number of important North American tree species for which existing means of assessing sustainability do not provide a definitive assessment. Old-growth stands of coast redwood (Sequoia sempervirens (D.Don) Endl.), a dominant shade-tolerant species across >600,000 ha of coastal forests in California and Oregon, often have relatively flat size and age distributions in which recruitment rates seem to be low [12]. In eastern hardwood forests, yellow birch (Betula alleghaniensis Britton) and tulip poplar (Liriodendron tulipifera L.), which can function as gap-phase species in older forests, also frequently have flat or shallow size distributions with relatively few young trees [13,14,15]. It is not entirely clear if any of these species are maintaining sustainable size distributions in these stands.
The topic of population sustainability is likely to become increasingly important in this century because of large numbers of anthropogenically-induced stressors such as climate change and invasive species. Under these conditions, more rigorous criteria are needed for judging the long-term population sustainability of various size distributions. Recently, two studies with somewhat different objectives have independently proposed more rigorous criteria for evaluating demographic sustainability of tree species. Cale et al. [16] and Marks and Canham [17] both proposed methods for evaluating sustainability of tree species at a landscape level with applications for current forest health assessment. Observed mortality from a recent field census is compared with ‘baseline mortality’ required to maintain the existing size distributions in order to determine if current mortality exceeds the expected norm. The intent in these methods is not to predict the future size distribution, as both methods assume constant ingrowth and a stationary baseline mortality function. Uneven-aged forest structure at the landscape scale (monotonically descending size distribution) is also assumed.
The current paper uses a model-based method that has a somewhat different and more general objective of examining how the initial size distribution affects long-term population sustainability under present environmental conditions. Recruitment, tree growth, and mortality all respond to fluctuations in stand density based on field-calibrated equations in the model (CANOPY, [18,19]). The model can therefore predict longer-term changes in forest structure at both the stand and landscape level, as well as changes in even-aged vs. uneven-aged stands, and second growth vs. old growth [20,21]. Standard runs of the model are based on calibration data collected prior to the onset of recent major threats to forest health, which can serve as the historical mortality baseline. Prediction of forest change under future environmental stressors can also be done using the model, but it requires either re-calibration of model equations under changing conditions or else adjustment of equations to reflect various hypothetical, future scenarios.
In this paper, we use the individual-tree model CANOPY to examine temporal changes in various initial, observed size distributions in mature and old-growth forests under different recruitment scenarios and disturbance regimes. A quantitative index of demographic sustainability, which measures the degree to which initial basal area is maintained, is also used as a convenient way to compare results among multiple species, various spatial scales, and disturbance regimes. Simulation experiments are also conducted to determine the minimum number of saplings needed to sustain the overstory basal area of a species and the overall stand. Specific research questions include: (1) How is population sustainability related to the shape of the initial size distribution and the initial number of saplings? (2) How does sustainability vary among species of different shade-tolerance classes? and (3) How is sustainability among species affected by the spatial scale (stand vs. landscape)? The simulations incorporate both background mortality and episodic natural disturbance but do not include direct human manipulation; simulations of alternative silvicultural treatments have been presented elsewhere [22,23].
2. Methods
2.1. Study Areas
Field sites were located in portions of three large landscape reserves of primary northern hardwood and hemlock-hardwood forest with no or little past logging in western upper Michigan, USA. These included 23,000 ha of the Porcupine Mountains Wilderness State Park, Sylvania Wilderness in the Ottawa National Forest, and a tract of protected private lands administered by the Huron Mountain Wildlife Foundation. These sites are well suited for the simulation experiments in this study because they contain stands with an unusually wide range of size distributions and developmental stages, including various stages of old growth [24]. Sugar maple (Acer saccharum Marsh.), eastern hemlock (Tsuga canadensis (L.) Carr.), and yellow birch strongly dominate most stands. These three landscape reserves, as well as sample plots in CANOPY’s calibration data set, were largely free of major exotic pests, pathogens, and invasive plant and animal species at the time the data were collected. The two principal exotic pests and pathogens up to that time were Dutch elm disease (Ophiostoma ulmi) on American elm (Ulmus americana L.) and white pine blister rust (Cronartium ribicola) on eastern white pine (Pinus strobus L.). Both of these host tree species, however, were only minor species in the northern hardwood study sites and calibration data set. The data can therefore provide an approximate historical baseline for recruitment, growth, mortality, and gap formation for these sites prior to the onset of novel forest health problems.
Climate in the study sites is humid continental with mean summer temperatures of 20 °C and mean winter temperatures between −7.5 °C and −11 °C. Elevations range from ~182 m near the shore of Lake Superior to 600 m further inland. Annual precipitation is approximately 80–90 cm and is well distributed throughout the year. Soils are typically of loam, sandy loam, or silt loam texture and are primarily Fragiorthods and Haplorthods. All plots were on mesic or dry-mesic habitats, with about two-thirds of the plots on the Acer-Tsuga-Dryopteris (ATD) floristic habitat type of Kotar et al. [25]. The ATD habitat is above average in productivity, with a sugar maple site index of approximately 19–20 m for base age 50 years [26].
2.2. Field Methods
Plot locations were determined by random coordinates on maps of the primary forest zones. Seventy 0.5 ha plots were surveyed in the summers of 1981–1984 (from the data set of Frelich and Lorimer [27]). Each plot was divided into seven contiguous 10.1 × 70.7 m strips. Species, diameter at breast height (DBH) and crown class were recorded for all trees >2.5 cm DBH. On some younger, dense stands comprised primarily of small trees, a subset of strips was tallied. Each plot generally included a population of >165 trees larger than 10 cm DBH and was representative of the species composition and size structure of the surrounding stand. A subset of 8 plots from a wide range of stand stages was designated as permanent plots and stem-mapped. Re-measurements were conducted in 1992, 2004, and 2011.
2.3. Model Description
CANOPY is a spatially explicit, individual-tree model that simulates sapling gap capture under a disturbance regime of background mortality (sensu Lugo and Scatena [28]), as well as recruitment in larger openings created by natural disturbance or harvesting [18,23]. The model utilizes field-calibrated, species-specific equations to predict the rate of sapling recruitment, tree growth, and mortality. Several unique features of CANOPY make it especially useful for investigating the research questions in this paper. The large calibration data set includes much data from old-growth forests, which facilitates long-term projections. The model includes detailed mechanisms for sapling recruitment, gap formation, and gap capture/gap closure dynamics. A separate module simulates the historic natural disturbance regime. The model itself has been subjected to numerous tests and found to give good agreement against permanent plot data and data from stands and locations not represented in the calibration data [18,20,21,23,24].
The northern hardwood calibration data set for CANOPY v. 3, used in this paper, includes more than 12,000 trees on permanent and temporary plots measured between 1953 and 2007 in northeastern Wisconsin and western upper Michigan [19]. Stands in the calibration data span a wide range of forest developmental stages, from young even-aged stands to uneven-aged, old growth stands that include trees at the end of their lifespan. Stands also represent a wide range of past treatment history and stand densities, including unmanaged stands, recent clearcuts, shelterwoods, thinned second-growth stands, and managed uneven-aged stands. The very wide range of conditions in the calibration data set helps avoid simulations that extrapolate beyond the range of stand density, species composition, stand age, and stand structural characteristics in the observed data. The calibration data, even in the managed forest stands, can also be interpreted as reflecting baseline conditions of how forests responded to natural and human disturbance prior to the arrival of major exotic pests and other novel forest health problems. However, the model cannot be used to examine the effects of variables not directly included in the model equations, such as climate and past seedbed condition.
Calibration data for sapling recruitment were obtained from 192 plots in 68 northern hardwood and hemlock-hardwood stands in northeastern Wisconsin and western upper Michigan [18]. These stands span a similarly wide range of stand ages, stand densities, and past history. Trees >12 cm DBH were measured on 900 m2 main plots, with trees <12 cm measured on nested 100 m2 subplots. In large, permanent stem-mapped plots established in earlier studies (listed in [18]), nested 100 and 900 m2 plots were subsampled within the larger quadrants of the mapped plots.
CANOPY’s recruitment module assesses the density of 2–6 cm DBH saplings on each 10 × 10 m cell within a larger mapped plot or stand. New saplings are added whenever the current sapling density is lower than the expected density predicted by the regeneration equation, given the overstory density on the surrounding 900 m2 patch [18]. Species of new individuals are determined stochastically based on the local overstory composition and density following a method similar to Vanclay [29].
CANOPY is currently calibrated for late-successional northern hardwood forests on mesic upland sites in which recruitment is primarily through advance regeneration of shade-tolerant species and short-distance colonization by midtolerant gap-phase species. Wind disturbance usually does not facilitate the establishment of pioneer species, and late-successional species largely remain dominant [30,31,32]. Long-distance colonization by species of relatively low shade tolerance (e.g., Betula papyrifera Marsh., Populus tremuloides Michx., Pinus strobus L.) occurs primarily after fire. Because stand-replacing fires occur infrequently in northern hardwoods [33,34], and early successional trees of all species combined comprise only 3.3% of the basal area in the study area forests, post-fire and long-distance recruitment are not considered in this paper. The recruitment equations for hemlock in this paper are based on calibration data only from stands having low levels of deer herbivory.
For each species, height growth is simulated for saplings and small poles in response to initial tree size, canopy gap area, and competitor crown area. For larger trees, diameter growth and background mortality are simulated as a function of species, initial tree size, and competition level (crowding or stocking level) in a 900 m2 competition neighborhood. Mortality from natural disturbances is simulated following the natural rotation periods in Frelich and Lorimer [27], with size-dependent individual tree probability of mortality based on equations in Hanson [35]. Stochastic variation is incorporated into predictions of species composition of new recruits, height and diameter growth, background mortality, and disturbance events. Recruitment, growth, and mortality equations incorporate categorical variables and interaction terms to account for habitat variation among the three principal floristic habitat types in the study areas.
CANOPY is ‘blind’ to stand-wide characteristics throughout a simulation and only ‘senses’ the level of competition in a small patch surrounding each individual tree. There are no stand-level or temporal constraints imposed on these responses (a partial exception is a user-specified option, not present in v. 1 and v. 2, to indicate whether a 0.25 ha patch surrounding a subject tree is even- or uneven-aged). The predicted stand-level size distribution is therefore simply a reflection of the aggregate performance of all the individual trees reacting somewhat independently to their immediate environment. The trajectory of stand development is also not influenced either by existing theories or empirical data on how stand structure changes over time. For example, an equilibrium size distribution of a forest after centuries of background mortality is not constrained to take on any particular form and is determined only by the local response of many individual trees to the prevailing gap disturbance regime.
2.4. The Demographic Sustainability Index
Although complete size distributions provide the most thorough reflection of demographic trends, size distributions are not easy to summarize in concise numerical form when making large numbers of comparisons or when conducting quantitative analyses. Therefore we also defined a ‘demographic sustainability index’ as the ratio of future simulated basal area to initial observed basal area. This index evaluates the degree to which the existing species or stand basal area can be sustained over time in a particular stand or landscape, given a specified disturbance regime, recruitment mechanism, and set of environmental conditions. Spatial extent and time frame will affect the numerical value of the index, but both can be adjusted based on the questions of interest. For example, a species that is not sustainable in any individual stand may nevertheless be sustainable at a larger spatial scale if there is a shifting spatial pattern of establishment and decline. Likewise, if an even-aged stand of pioneer species has deficient regeneration, the demographic sustainability index may be quite low over a time span of about a century. But if subsequent natural disturbance or harvest/planting operations stimulate adequate regeneration, then the index could be close to 1.0 over a longer time span. Note, therefore, that the index indicates only whether the basal area is expected to increase or decrease relative to its initial value and does not necessarily indicate whether a stand has an equilibrium size distribution. Equilibrium/non-equilibrium conditions are assessed by monitoring whether or not stand structure changes over time (see ref. [24]). In Lake States northern hardwoods, the natural disturbance regime produces mostly uneven-aged stands, and so our simulations largely evaluate sustainability in a context where the canopy is usually not completely removed in a disturbance.
The demographic sustainability index was evaluated at multi-century time scales and a dual stand/landscape-level spatial scale. Depending on time demands of a particular simulation design, either 500 or 1000 year time frames were examined, a period about two to four times the average age at time of death for canopy trees in this ecosystem [36]. The simulations in this paper were designed to examine the long-term consequences of a particular demographic structure under current environmental conditions, not to predict future consequences of global environmental change. Note that the index can exceed 1.0 if the population is increasing, and that it can’t be computed on plots where a species was initially absent (to avoid division by zero). Because the index reflects a relative increase or decrease, a large relative change for an uncommon species may only correspond to a small change in absolute terms (e.g., an increase from one individual to two on a 0.5 ha plot could result in a sustainability index of 2.0 or more). For these reasons, plot-level means are not shown for uncommon species. However, this limitation can be circumvented by reporting the absolute mean increase or decrease in basal area (m2·ha−1) for each species.
The index was computed for all species pooled as well as for each of the major canopy species (sugar maple, hemlock, yellow birch, green ash (Fraxinus pennsylvanica Marsh.), basswood (Tilia americana L.), and red maple (Acer rubrum L.). While the reasons for investigating sustainability of individual species are evident, pooled species sustainability is also relevant in evaluating current forest density in cases of severe recruitment limitations. For example, combinations of exotic pests, pathogens, European earthworms, and exotic weeds and shrubs can cause high mortality and limited recruitment of many tree species in this ecosystem [37,38,39], potentially leading to immature stands of chronically low density.
2.5. Evaluation of Model Predictions
CANOPY simulations in these Michigan northern hardwood study areas have been evaluated in prior papers against permanent plot records, independent long-term field experiments, and archival temporary plots in the region. Several tests evaluated accuracy of the predicted short-term (23–30 year) and long-term (1000 year) changes in the size distribution, given that changes in the size distribution reflect the separate demographic components of recruitment, growth, and mortality. In a 23-year simulation, predicted density of new sapling recruits on permanent plots was within 7% of observed numbers (predicted = 397 ha−1, observed = 370 ha−1), and predicted relative proportions among species were similar to observed [18]. For 30-year change in size distributions, observed density of trees was within the range predicted by CANOPY for 86% of the 4-cm diameter classes [20]. After long-term simulations (1000 years) under small-gap dynamics, average predicted densities of trees in each size class were close to observed numbers of trees in uneven-aged, old-growth forests for all classes >10 cm DBH. In long-term simulations, predicted tree densities among size classes in stands of different developmental stages, and predicted frequency of each stand stage on the landscape, were also similar to observed [20,24].
For the present paper, the predicted demographic sustainability index after 30 years was also compared with the ‘observed’ index, based on monitored changes in basal area on the eight permanent 0.5 ha plots. Major changes in stand basal area would not be expected after only a few decades in mature and old forests not under environmental stress, and CANOPY and other models cannot predict the exact timing of stochastic disturbances that affect basal area. Nevertheless, a direct test of the predicted vs. observed sustainability index may give insights into the ability of the model to forecast the general ‘direction’ of short or medium-term demographic changes (increases, decreases, or no change for various species groups). A simultaneous F-test for slope and intercept was used to evaluate if observed values departed significantly from a 1:1 correspondence of predicted vs. observed [40]. Linear regression was used to verify if there was a significant trend between the predicted and observed index (slope of the relationship significantly different from zero).
2.6. Analytical Techniques
Bivariate and multiple regressions were performed to assess the degree to which the sustainability index can be predicted based on initial stand structure. Potential predictors included initial stand basal area, initial number of 2–6 cm DBH saplings present, the percentage of stand basal area occupied by the five classes centered on the mode of the basal area distribution, and several other variables. Stepwise selection based on the Akaike Information Criterion (AIC) was used to remove non-significant terms. Residual plots were manually inspected for evidence of pattern, and normality of residuals was verified with Shapiro-Wilk tests. All statistical analysis was performed in GNU R version 3.0.1 (R Foundation for Statistical Computing, Vienna, Austria) [41].
2.7. Simulation Designs
Ten separate simulation experiments, within four general groups, were designed to clarify how variations in recruitment and mortality rate, disturbance regime, and stand vs. landscape scale affect population stability (Table 1). Group 1 includes both individual-stand and larger-scale simulations (aggregate study areas of 23,000 ha), while groups 2–4 include only stand-scale simulations.
Projections of the upper Michigan field data (Group 1). Several sets of simulations projected the development of the 70 individual 0.5 ha field plots, during which sapling density was either fixed at initial levels to assess adequacy of current recruitment, or allowed to vary in response to changing overstory density. Simulations were run for 500 years, with 10 replicates per plot. In this and all other simulations discussed in this paper, the term ‘saplings’ refers to trees in the 2–6 cm DBH class (the smallest size class tracked by CANOPY).
To assess stability of the current population structure, one set of simulations (Group 1a) was conducted for individual stands in which the total number of saplings of pooled species was fixed at initial levels. Group 1a simulations did not maintain constant numbers of saplings for any individual species, only for all species pooled. Tree deaths occurred through background mortality only. CANOPY predicted the species composition of new recruits based on local overstory density and species composition.
In Group 1b simulations, CANOPY’s normal recruitment mechanism likewise determined species composition, but the restriction of fixed recruitment was removed. Sapling density fluctuated in response to changes in overstory density, again with background mortality only. Results were compared with plots in the field data that met structural criteria for a stable (steady-state) size distribution [24].
In Group 1c simulations, CANOPY set species composition and allowed understory density to fluctuate on each of the 70 plots as in Group 1b, but this time in concert with simulation of the historic natural disturbance regime (data for 1850–1980, [27]).
In all Group 1a–c simulations, final basal areas on individually simulated plots were also subsequently pooled. The sustainability index was then calculated as a ratio of final to initial pooled basal area to estimate sustainability at the landscape scale (results shown in the last column of Table 2).
In Group 1d, the 70 plots were pooled together initially and simulated as a single unit to represent the landscape scale, so that the total numbers of trees of each species at the larger scale could be experimentally manipulated. Also, in contrast to Group 1a, which controlled only the total number of saplings of all species, the simulations in Group 1d held the initial numbers of saplings of each species constant over the 500-year period. During these simulations, only background mortality was employed, but note that the initial number of saplings may also reflect the influence of recent episodic disturbance in the field data.
Simulation experiments with pre-determined numbers of 2–6 cm saplings (Group 2). To more directly assess the minimum population necessary to sustain a stand, a group of designed simulation experiments was performed that systematically varied the initial number of saplings across a wide range. Initial conditions for this group consisted of simulated size distributions after 1000 years of forest development with only small gap formation from background mortality. These initial conditions have the advantages of removing the complicating influence of past minor or moderate disturbances, and the initial size distribution is known from previous simulation experiments to sustain the initial basal area. Different species mixes were tested. Group 2a simulated pure sugar maple stands and recruitment was held fixed at pre-determined constant levels. Levels of recruitment ranged from 15% to 150% of the average number of 2–6 cm saplings in the initial conditions.
In Group 2b simulations, sapling recruitment in pure sugar maple stands was allowed to fluctuate within limits in response to overstory density, but recruitment was restricted so as not to exceed the quotas used in Group 2a. This was done in order to avoid forcing biologically unrealistic numbers of saplings into a stand. For example, in one trial, 600 trees·ha−1 was the maximum allowed number of saplings, but natural mortality simulated by CANOPY could cause numbers to fall below this level. To assess the influence of mixed species, this experiment was repeated using mixed hardwood stands without hemlock (2c), and with mixed hemlock-hardwood stands (2d).
Simulations imposing a constant q-ratio on 2–22 cm trees (Group 3). These 1000-year simulation experiments imposed pre-specified and constant maximum q-ratios on the 2–22 cm DBH classes (with a 5 cm class width as in most of the forestry literature on q-ratios). In each year, CANOPY counted the number of trees in the 17–22 cm class and determined the number that should then be expected in the smaller classes based on the specified q-ratio. If at any time, the model detected surplus trees in a size class beyond the number specified by the q-ratio, these were removed to maintain the specified q-ratio. If mortality in smaller classes was high enough that the 17–22 cm class was not replenishing itself, the target number of trees in the other classes was adjusted downward to account for the change in 17–22 cm density in order to maintain the specified q-ratio.
Simulations assessing minimum sustainable q-ratios (Group 4). Whereas the experiments in Group 3 examined constant q-ratios, Group 4 allowed for the possibility that variable q-ratios within a stand may be needed for sustainability. This group assessed the minimum number of understory trees needed in three consecutive 5 cm understory classes. Based on the simulated mean number of 17–22 cm trees in all-aged, old-growth stands under small gap dynamics (49 trees·ha−1), we determined the minimum number of trees in the next smaller class needed to sustain the 49 trees·ha−1, given the growth and mortality functions in the model. This procedure was iteratively repeated in the three smallest size classes for 500-year time spans.
3. Results
3.1. Range of Demographic Sustainability Index Values for Individual Stands
Observed values of the sustainability index on the permanent plots after 30 years tended to be clustered around 1.0 as expected, ranging from 0.9–1.3 for all species pooled and from 0.5 to 1.4 for individual species (Figure 1). Predictions for most species and plots were close to the 1:1 relationship of predicted vs. observed index values. The mean error between the observed and predicted index for all species combined was −0.018 (or 1.8% underprediction). Mean 30-year errors for the principal species were −5.1% for sugar maple, −4.9% for hemlock, and +7.4% for yellow birch. The trends for observed vs. predicted were also significantly positive for the cases of ‘all species pooled,’ hemlock, and yellow birch (p <0.0001), indicating the model in these cases tended to correctly distinguish stands in which basal area was likely to increase, decrease, or remain about the same. The trend was not significant for sugar maple because of two plots on which observed mortality (0.09 and 0.14 m2·ha−1·year−1) was lower than predicted, although the predicted values (0.20 and 0.23 m2·ha−1·year−1) were well within the range observed on the other maple-dominated permanent plots (0.19–0.32 m2·ha−1·year−1). There was no consistent difference in the degree of accuracy for all-aged stands close to a steady-state structure (plots 1,2,3) compared to younger stands far from an equilibrium structure (plots 4,5,8) and old-growth stands intermediate between these two groups (plots 6,7). Because of the limited range of index values, however, it was difficult to assess the overall degree of fidelity to the 1:1 line of perfect agreement, and all of the relationships had a slope significantly different from 1.0 and intercept different from 0.0.
While observed basal area of most species on the permanent plots remained stable or increased over time, yellow birch basal area decreased to 47%–68% of its initial value on four of the seven plots on which it occurred, an outcome that was largely anticipated by the model (Figure 1d). The predicted range of values among simulated plot replicates was related to species abundance, being smaller for dominant species and larger for minor species. For example, maple had a narrow range of predicted outcomes on maple-dominated plots and hemlock had a narrow range on hemlock-dominated plots, but both species showed a much wider range of predicted outcomes on plots heavily dominated by the other species.
When the 70 individual plots in the larger data set were simulated for 500 years with the total number of 2–6 cm saplings held constant at their initial levels (Group 1a simulations), demographic sustainability index ranged widely from 0.2 to 1.6 (Table 2). Final sustainability values depended on initial structure, recruitment dynamics, and disturbance regime; size distributions and predicted sustainability index values for a subset of five plots ranging widely in initial structure are shown in Figure 2. For any particular plot, a range of values was predicted because of the stochastic growth and mortality functions in the CANOPY model. In all cases, size distributions under a disturbance regime of single treefall gaps eventually developed a descending monotonic form, but with differing final basal areas and sustainability index, depending on initial sapling density.
A number of general trends emerged from simulations of individual plots based on an assumption of constant recruitment (Group 1a). All size distributions with high sustainability (index values ≥0.9) were initially steeply descending in form. Shallow descending monotonic curves were only moderately sustainable, typically having sustainability index values of 0.5–0.7. No flat or unimodal distributions were identified that were both sustainable and stable in form if the initial density in the sapling class was maintained throughout the simulation. For example, the rather flat, unimodal distribution in Figure 2j had an index of about 0.6. Young pole stands with large numbers of small trees were often able to sustain the initial basal area (e.g., Figure 2m) if the relatively high sapling density was maintained throughout the simulation. However, these pole stands did not have stable size distributions and were able to sustain the initial basal area only by shifting the form of their size distribution over several centuries from unimodal to descending monotonic.
When CANOPY’s normal recruitment mechanism was activated, in which sapling recruitment varied with changing overstory density (Group 1b simulations), the five stands in Figure 2 converged toward similar descending monotonic curves. These were close to the average observed size distributions from field measurements of all-aged, old-growth stands on ATD habitat (Figure 3a,d). While there were differences among replicates in the final number of trees in the 10–42 cm classes, the simulation envelopes for all five stands overlapped (Figure 3b), suggesting little inherent difference among replicates. On all 70 plots, mean simulated diameter distributions of plots after 1000 years fell near the middle of the range of field observations in all-aged stands for trees >12 cm DBH (Figure 3c).
Predictions of the sustainability index for individual species, based on 500-year CANOPY simulations of the individual plots, also indicated a wide range of index values depending on recruitment limitations and disturbance regime (Table 2, Group 1 simulations). Sugar maple, green ash, and all species pooled had mean stand-level index values >0.8 for all conditions tested. Yellow birch and red maple had low sustainability under most conditions, with ≥70% of plots having index values <0.4 for both species. Hemlock had variable levels of sustainability but showed a very gradual and progressive increase in relative basal area on ATD habitat under a regime of only small treefall gaps and low levels of deer browsing. Basswood and ash often had mean sustainability indices >1.5, but since these were uncommon species at the outset, they remained only a minor component of the forest at the end of the simulations.
3.2. Assessing Sustainability at the Landscape Scale
Observed landscape-level size distributions from the initial 70-plot field survey were descending monotonic in form for most species, with the exceptions of hemlock, white cedar (Thuja occidentalis L.) (Figure 4) and northern red oak (Quercus rubra L.). The descending distributions might be considered sustainable under traditional, ad hoc criteria. However, since it is difficult to make reliable assessments without considering the underlying population dynamics, sustainability of the landscape-level size distributions in Figure 4 was evaluated by projecting them for 500 years using the demographic equations in CANOPY.
Two sets of simulations evaluated sustainability at the landscape scale with constant numbers of saplings but with different methods for predicting the species of new recruits (Group 1a and 1d simulations). These two analyses gave substantially different results. In simulations where species composition of saplings was influenced by overstory density (Group 1a), sugar maple and ash had sustainability >1.0 (rightmost column of Table 2). Other species had only moderate or low sustainability (<0.8), including the principal gap-phase species yellow birch and red maple. In Group 1d, where numbers of saplings were maintained at initial levels for each species, all species had sustainability >1.0 except red maple (Figure 5).
3.3. Predictors of Demographic Sustainability
Multiple regressions using demographic variables based on initial plot conditions were able to explain 47%–77% of the variation in sustainability index for all species combined, and 27%–68% of the variation for individual species (Table 3). Independent variables most commonly significant were initial sapling density, initial basal area, quadratic mean diameter, and the average q-ratio below the mode of the size distribution. Demographic sustainability index was most predictable for both individual and pooled species when the initial number of saplings was held constant under a disturbance regime comprised only of background mortality (Group 1a, Table 3). Sustainability of individual species was least predictable under background mortality alone but without any recruitment limitations (R2 = 0.27–0.45; Group 1b). Incorporating the historic natural disturbance regime resulted in the lowest predictability for pooled-species sustainability (R2 = 0.47). However, predictability for sugar maple and yellow birch was higher under the historic natural disturbance regime (Group 1c) than under background mortality with density-dependent recruitment (Group 1b) and similar to results under background mortality with fixed recruitment (Group 1a).
In the original field data, the number of 2–6 cm saplings decreased steeply in a log-linear fashion with increasing stand basal area (Figure 6a). Simulations indicated that the sustainability index is positively correlated with the initial number of saplings and negatively correlated with initial basal area. Sustainability index of 1.0 was predicted at 37 m2·ha−1 of basal area and 320 saplings·ha−1 (Figure 6d,e). These two levels of initial stand basal area and initial number of saplings are very similar to the mean observed values of stands in the field data (Figure 6b,c).
3.4. Minimum Number of Understory Trees for Sustainability
Controlled experiments that started with an all-aged stand after centuries of background mortality (Group 2a simulations), and which held the initial number of saplings at specified levels from 50 to 600 ha−1, showed an asymptotic trend in sustainability with increasing sapling density. Maximum index values were reached when stands contained approximately 300 saplings·ha−1 (Figure 7a). Because of stochastic variation in basal area prior to the simulation experiment, initial ‘starting values’ of basal area for all-aged stands were somewhat higher than the long-term average, and so the final maximum index values were slightly less than 1.0 on average. Additional experiments that placed a limit on the number of saplings but did not add more trees than predicted by CANOPY’s recruitment mechanism (to avoid biologically unreasonable sapling densities) produced similar results under all species mixtures tested (Group 2b–d; Figure 7b).
Equilibrium diameter distributions for pure maple stands with fixed numbers of saplings had shallower slopes as the initial number of saplings was decreased, but all were descending monotonic in form (Figure 8). Higher initial densities of saplings resulted in higher equilibrium densities of trees less than 30 cm DBH. Mortality rates, however, were correspondingly higher in high-density stands, especially for the smaller trees. For all stands with sapling densities >150 ha−1, size distributions for trees above 40 cm DBH converged to similar form.
Controlled experiments that started from all-aged stands, applying constant q-ratios to the 2–22 cm trees (Group 3 simulations), demonstrated that q-ratios of less than about 2.2 resulted in stands with low sustainability index values averaging only 0.3–0.4 (Figure 9). Results were similar for mixed hardwood stands without hemlock recruitment and for stands that included mixed hemlock-hardwood recruitment.
Iterative experiments that controlled q-ratios in the 2–7, 7–12, and 12–17 cm diameter classes (Group 4 simulations) showed that a variable q-ratio—as high as 3.7 in the smaller classes—was necessary to maintain target tree densities in the medium diameter classes (Table 4). Predicted minimum sapling numbers were also generally close to the mean number of saplings in the field data (Figure 6c), with only about 20% of the stands carrying large excesses. Observed numbers of saplings in all-aged stands classified as steady state based on structural criteria [24] were even higher, averaging 686 ha−1 (Table 4).
4. Discussion
4.1. Characteristics and Dynamics of Sustainable Size Distributions
Results suggested that the following types of size distributions were not generally sustainable in this forest type and range of habitat conditions: (1) flat distributions; (2) shallow descending monotonic curves; and (3) unimodal curves. While a flat or shallow descending distribution could be sustainable if mortality rates are sufficiently low (e.g., [42]), the simulations in this study suggest that observed mortality rates in CANOPY’s regional calibration data set were too high to sustain such distributions under the range of disturbance regimes and stand densities tested in these experiments. Results imply that descending monotonic curves should not always be assumed to indicate sustainable populations in the absence of specific knowledge of mortality and recruitment rates. Likewise, we could find no evidence that unimodal distributions could represent alternative stable states for these species under the conditions examined. All sustainable and stable size distributions in this study were steeply descending in form.
The relationships in Figure 3, Figure 6, and Figure 8 suggest underlying feedback mechanisms in these forests that cause stand structure to trend toward a stable size distribution in the absence of moderate or severe disturbance. When basal area is relatively high, recruitment decreases (Figure 6a) and mortality increases, driving overall stand density downward over time (Figure 8). But when basal area is low, the density of saplings tends to increase in the absence of recruitment limitations (Figure 6a). In this study, these countervailing trends balanced, with a demographic sustainability index of 1.0, at 37 m2 of basal area and 320 saplings (2–6 cm DBH) per hectare (Figure 6d,e). These values correspond with the mean of field observations (Figure 6b,c), suggesting that the existing landscape-level size distribution is, on average, close to CANOPY’s predicted stable structure. Stands with varied initial structures all converged toward a common simulated size distribution on the same habitat and site productivity level (Figure 3a). All-aged stands in the field data likewise appeared to converge toward a common size distribution (e.g., the eight mixed hardwood stands on ATD habitat shown in Figure 3d).
Some authors have suggested that relatively low and constant q-ratios are sustainable and typical of natural stands, and they have used the negative exponential function (with implied uniform mortality rates for all size classes) to assess demographic stability (e.g., [16,43]). In low-density, multi-cohort stands of shade-intolerant pines (Pinus ponderosa Laws.), O’Hara [44] provided simulation evidence that constant q-ratios of less than 1.5, or even linearly decreasing numbers of trees, may be sustainable in actively managed forests in a summer-dry climate. Q-ratios in mesic stands of shade-tolerant species with dense canopies, however, can be quite high. In old-growth northern hardwood stands of the Sylvania Wilderness in upper Michigan, q-ratios of the 5–10 cm class averaged 6.5 [45]. In the present study, mean q-ratios in the field data for all-aged stands ranged from 4.5 in the sapling classes to 1.6 for the smaller overstory trees (Table 4). Any q-ratio greater than 2.3 in the smaller size classes appeared to be sustainable in CANOPY simulations, suggesting that ratios as high as six may reflect more saplings than ordinarily needed to sustain the population.
Nevertheless, in this study, variable and relatively high q-ratios were necessary in the smaller size classes (<20 cm) to maintain a stable, uneven-aged size distribution in unmanaged stands. Constant q-ratios of 1.3 are used commonly in silvicultural guidelines for northern hardwoods managed by the selection system [46,47,48], and they do provide a reasonable approximation to the form of a natural size distribution over the range of diameters typically regulated in managed stands (e.g., 15–60 cm DBH). Although our experiments did not include overstories managed by single-tree selection, when a q of 1.3 was applied to the 2–22 cm DBH classes, stands had long-term sustainability index values of only 0.3. The resulting stand basal areas were only ~12 m2·ha−1, well below the recommended minimum level for fully-stocked managed stands. Given the inability of these sapling densities to restore full stocking to such sparsely-stocked stands, it seems unlikely that selection harvesting in the overstory under a constant q of 1.3 would improve matters and reverse this trend. Previous simulations of single-tree selection harvesting using CANOPY indicated that with a constant q of 1.3 in trees >12 cm DBH, the resulting stands developed understories below that threshold size with much higher q-ratios [22]. The main concern regarding use of a low and uniform q-ratio would be in cases where small trees in mature, uneven-aged stands are thinned and removed for products such as bioenergy (e.g., [49,50]), which could compromise population sustainability.
Rubin et al. [43] argued for a more general use of a constant q-ratio and challenged the validity of alternative models, even for equilibrium populations in old-growth stands. However, the arguments include no direct supporting evidence on mortality or growth rates from either stand-level field data in all-aged stands or simulations based on demographic field data. CANOPY experiments suggest that a rotated sigmoid size distribution (sensu Goff and West [10]) with variable q-ratios may be required across the full range of size classes, as in a forest managed for old-growth characteristics [51]. Rotated sigmoid size distributions have been widely reported in old-growth, uneven-aged stands of various shade-tolerant species (e.g., [14,52,53,54,55,56]), including those in the present study areas [45,57,58].
While mortality rates have sometimes been reported to be nearly size-invariant (e.g., Kohyama et al. [9] in Malaysia), mortality-size trends in late-successional temperate forests have been more commonly U-shaped, with higher mortality rates for small and large trees [6,17,52,59,60,61]. This is also the case for the northern hardwood permanent plot records, spanning 54 years, in CANOPY’s calibration data set [18,36]. These U-shaped mortality-size trends are consistent with the observed rotated sigmoid structure in old-growth stands. The steep decrease in mortality rates for trees in the 15–25 cm DBH classes as trees reach the canopy layer corresponds to the substantial decrease in q-ratios for trees in those classes, and the rise in mortality rates for large trees coincides with an abrupt increase in q-ratios for trees >65 cm DBH. In forests with U-shaped mortality-size trends, elevated mortality in small and large trees compared against a fixed baseline with size-invariant morality may not necessarily indicate a forest health problem.
4.2. Sustainability of Shade-Tolerant vs. Gap-Phase Species
Overstory populations of shade-tolerant species tended to be sustainable both at the level of individual plots and at the landscape scale. Sugar maple had high values of the sustainability index (average plot index >1.2 and landscape-scale index >0.95) under all conditions tested. The more varied outcomes for hemlock likely reflect several factors, including inherent differences in seedling biology between these two late-successional species. CANOPY predicts that under historic baseline conditions with late 20th/early 21st century climate, hemlock on Acer-Tsuga-Dryopteris habitats would gradually increase in importance over a span of >500 years under a regime of single-tree gap dynamics and low deer populations (sustainability index of 1.6–2.3). However, under simulations of the natural disturbance regime, average-plot sustainability of hemlock decreased to 1.2, and landscape-scale sustainability decreased to 0.8. The model suggests that historically, hemlock increasingly dominated stands under a regime of small treefall gaps, but this trend was held in check by the periodic occurrence of more intense canopy disturbance (see also similar conclusions from field data in [62]). Permanent plots and historical land-survey records likewise suggest that hemlock can maintain or increase dominance under disturbance regimes in which large openings and stand-replacing disturbances are infrequent [15,63,64]. But mature hemlock is also known to undergo high mortality after sudden crown exposure and drought [65,66], and hemlock seedling establishment is often poor in large windthrow openings because of limited seed dispersal, paucity of mineral soil and other ‘safe sites’ for establishment, and high mortality [31,67]. With its typically dense and tall layer of advance regeneration, sugar maple is more insulated from these influences.
Most gap-phase species were sustainable when the aggregate population was simulated at the landscape scale, but often not at the level of individual plots. For example, yellow birch and red maple (the most abundant of these species) had sustainability less than 0.6 on ~80% of individual plots under all conditions tested. This appears to reflect the shifting-mosaic nature of recruitment of many gap-phase species. Typical size distributions of gap-phase species in the upper Michigan data set contain occasional spikes of recruitment, but the majority of stands lack adequate recruitment. In 57% of field plots where yellow birch occurred, the mean density of birches <25 cm DBH (in 4 cm size classes) was less than the mean density per size class ≥25 cm DBH. In 83% of these cases, density of small birches was at least 20% lower than density per size class of large birches. On these plots, the understory would be unable to sustain the overstory under current conditions even in the absence of any mortality.
The differing outcomes of alternate recruitment models of landscape-scale sustainability for yellow birch under the natural disturbance regime (Group 1c vs. 1d simulations) probably reflect substrate limitations in some of the model calibration data. Abundant yellow birch recruitment in unmanaged forests often requires not only openings larger than single treefall gaps, but also mounds with exposed mineral soil and rotted woody debris [68]. Birch abundance often declines in old-growth stands after many decades of only small-gap formation [15,63] and in younger managed forests lacking required seedbed conditions [69,70,71]. While some CANOPY calibration plots on the Acer-Tsuga-Maianthemum habitat type had good yellow birch sapling recruitment, few plots on the predominant Acer-Tsuga-Dryopteris type had the all the required factors for good birch recruitment in recent years. This probably caused CANOPY to underestimate birch establishment at the landscape scale over the longer time frame of this study. In contrast, the Group 1d simulations did not utilize the CANOPY recruitment equations but simply held constant the initial observed sapling densities of each species in the 70 primary forest plots. Some of these plots had good birch recruitment after a heavy windstorm 29 years earlier and after other more moderate disturbances. The primary forest plots thus had a greater range of natural disturbance and seedbed conditions, as well as a much larger (~18 x) total sample area for saplings, than the CANOPY recruitment calibration data. Consequently, the Group 1d simulations (Figure 5) probably provide better assessments of landscape-level sustainability of gap-phase species under those environmental conditions.
4.3. Potential Applications
A simulation approach could be useful in conservation planning to identify stands and species with potentially unsustainable populations. Sustainability estimates could be used to prioritize management activity, focusing any interventions (e.g., planting operations, population control of herbivores, insect pests, invasive plants, etc.) on sites where they are most needed and most likely to be effective. Such indices could easily be integrated into an Adaptive Management approach, as these already make prominent use of models [72,73]. Advantages of the ratio index in this paper include its biological interpretability and consistent meaning for different species, sites, and geographic regions; its ability to quantify different degrees of sustainability (including increasing populations); and its flexibility in applying to various temporal and spatial scales. A suitable forest model can also predict the future size distribution (e.g., Figure 2 and Figure 3 in this paper) rather than basal area alone. This is important because over a limited time span of a few decades, size increases of surviving trees often cause a net basal area increase even if no new recruitment is occurring (e.g., Quercus spp., [74,75]). In the present study, this was the case on the three hemlock-dominated permanent plots, where hemlock basal area increased even though no new hemlock sapling recruitment had occurred for more than 70 years because of intensive deer browsing [76].
In this paper, we used a complex, individual-tree model with many components, (e.g., simulation of the natural disturbance regime, sapling height growth, lateral crown growth, and monitoring of gap size) to provide the raw data for making projections. However, less complex individual-tree models or even whole-stand models, such as those that utilize non-spatial forest inventory data (e.g., [77,78]), might also be suitable in some situations. The minimum essential requirements for projecting size distributions are models capable of simulating recruitment, growth, and mortality in response to varying stand density levels.
Long-term sustainability in this study was evaluated for existing species under dynamics of the historic natural disturbance regime (growth and mortality calibration data from the mid 20th to early 21st centuries and disturbance regime data from the early 19th to late 20th centuries). Climate change and the oncoming complex of invasive and exotic pests will likely have a profound impact on these forest dynamics. For example, under background mortality, CANOPY predicted an average demographic sustainability index of 0.9 for hemlock in an old-growth stand with 70% hemlock basal area but no infestation of the exotic hemlock woolly adelgid (Adelges tsugae). In a simulation including a single adelgid infestation that killed 25% of the live hemlocks (as in Eschtruth et al. [79]), the predicted mean sustainability index was reduced to 0.74. When a persistent infestation was assumed, such that hemlock mortality was 25% in each decade (cf. Orwig et al. [80]), the mean index value was further reduced to 0.07. To provide more specific future predictions, however, the recruitment, growth, and mortality functions would need to be recalibrated periodically under changing environmental conditions to take into account interactive effects of multiple stressors. The large number of individual stressors and the complexity of interactions pose daunting challenges. One of the more feasible approaches to deal with this complexity may involve ‘scenario modeling.’ In this approach, the best current and future estimates of demographic functions for each tree species would reflect the cumulative impact of numerous environmental stressors, even if impacts and interactions of individual factors are not well understood at the time and are constantly changing.
5. Conclusions
Forest simulation models that include regeneration subroutines can provide insights into the long-term demographic sustainability of tree species, an issue not easily investigated by other methods. Advantages of the model-generated demographic sustainability index in this paper include biological interpretability across species, habitats, and geographic locations, as well as a consistent meaning across different temporal and spatial scales.
The simulations in this study point to sapling density as a key controlling variable that determines whether or not the overstory basal area can be sustained at its current level. In these northern hardwood stands, the current overstory basal area could not be sustained if the pooled-species sapling density dropped substantially below 300 trees per hectare. For both shade-tolerant and gap-phase species, size distributions needed to be steeply descending in form with variable q-ratios in order to avoid net decreases in basal area. Sapling mortality rates were too high, even in canopy gaps, for ‘flat’ or unimodal or shallow descending size distributions to sustain current species importance. Likewise, in the majority of individual stands, gap-phase species did not have sufficient numbers of saplings to sustain their current importance. Simulations suggested that in ~40%–80% of the randomly-selected stands, basal area of gap-phase species would be reduced by at least 40% under background levels of gap formation. However, nearly all gap-phase species had steeply descending size distributions at the landscape scale because of recruitment following episodic disturbance. Simulations predicted that these species would maintain their current importance in these study areas at the landscape scale under present environmental conditions.
While the risks to forest health caused by exotic organisms that kill overstory trees are readily apparent, this study also highlights the potential risks caused by historically novel factors capable of reducing sapling density. Such factors include exotic insects and diseases that can attack young trees (e.g., hemlock woolly adelgid and white pine blister rust), as well as inhibition of sapling establishment caused by invasive weeds, shrubs, exotic earthworms, excessive deer populations, and climate change.
Acknowledgments
Research funded by the McIntire-Stennis Cooperative Forestry Research Program, Project WIS01514, the Connor Hardwood Research Fund, and the Graduate School, University of Wisconsin-Madison. We thank the Michigan Department of Natural Resources for permission to monitor sample plots and K. Egelhoff for field assistance. Helpful comments on an earlier draft of the manuscript were provided by Ron Gangnon, Stith Gower, David Mladenoff, Monica Turner, and three anonymous reviewers.
Author Contributions
C.G.L. designed the study and wrote the original research proposal. C.R.H. conducted field work, wrote the model computer code, and ran the simulations. Both authors collaborated on the model design, data analysis, and writing of the paper.
Conflicts of Interest
The authors declare no conflicts of interest. The funding sponsors had no role in the design of the study; in the collection, analysis, or interpretation of data; in the writing of the manuscript, or in the decision to publish the results.
References
- Reed, J.M.; Mills, L.S.; Dunning, J.B.; Menges, E.S.; McKelvey, K.S.; Frye, R.; Beissinger, S.R.; Anstett, M.-C.; Miller, P. Emerging issues in population viability analysis. Conserv. Biol. 2002, 16, 7–19. [Google Scholar] [CrossRef]
- Menges, E.S. The application of minimum viable population theory to plants. In Genetics and Conservation of Rare Plants; Falk, D.A., Holsinger, K.E., Eds.; Oxford University Press: New York, NY, USA, 1991. [Google Scholar]
- McGraw, J.B.; Furedi, M.A. Deer browsing and population viability of a forest understory plant. Science 2005, 307, 920–922. [Google Scholar] [CrossRef] [PubMed]
- Obioh, G.I.B.; Isichei, A.O. A population viability analysis of serendipity berry (Dioscoreophyllum cumminsii) in a semi-deciduous forest in Nigeria. Ecol. Model. 2007, 201, 558–562. [Google Scholar] [CrossRef]
- Platt, W.J.; Evans, G.W.; Rathbun, S.L. The population dynamics of a long-lived conifer (Pinus palustris). Am. Nat. 1988, 131, 491–525. [Google Scholar] [CrossRef]
- Fraver, S.; Jonsson, B.G.; Jonsson, M.; Esseen, P. Demographics and disturbance history of a boreal old-growth Picea abies forest. J. Veg. Sci. 2008, 19, 789–798. [Google Scholar] [CrossRef]
- Smith, D.M.; Larson, B.C.; Kelty, M.J.; Ashton, P.M. The Practice of Silviculture: Applied Forest Ecology, 9th ed.; John Wiley and Sons: New York, NY, USA, 1997. [Google Scholar]
- Nyland, R.D. Silviculture: Concepts and Applications, 2nd ed.; Waveland Press: Long Grove, IL, USA, 2007. [Google Scholar]
- Kohyama, T.S.; Potts, M.D.; Kohyama, T.I.; Kassim, A.R.; Ashton, P.S. Demographic properties shape tree size distribution in a Malaysian rain forest. Am. Nat. 2015, 185, 367–379. [Google Scholar] [CrossRef] [PubMed]
- Goff, F.G.; West, D. Canopy-understory interaction effects on forest population structure. For. Sci. 1975, 21, 98–108. [Google Scholar]
- Bin, Y.; Wanhui, Y.; Muller-Landau, H.C.; Wu, L.; Lian, J.; Cao, H. Unimodal tree size distributions possibly result from relatively strong conservatism in intermediate size classes. PLoS ONE 2012, 7, e52596. [Google Scholar] [CrossRef] [PubMed]
- Lorimer, C.G.; Porter, D.J.; Madej, M.A.; Stuart, J.D.; Viers, S.D.; Norman, S.P.; O’Hara, K.L.; Libby, W.J. Presettlement and modern disturbance regimes in coast redwood forests: Implications for the conservation of old-growth stands. For. Ecol. Manag. 2009, 258, 1038–1054. [Google Scholar] [CrossRef]
- Tyrrell, L.E.; Crow, T.R. Structural characteristics of old-growth hemlock-hardwood forests in relation to age. Ecology 1994, 75, 370–386. [Google Scholar] [CrossRef]
- Busing, R.T. Composition, structure and diversity of cove forest stands in the Great Smoky Mountains: A patch dynamics perspective. J. Veg. Sci. 1998, 9, 881–890. [Google Scholar] [CrossRef]
- Woods, K.D. Dynamics in late-successional hemlock-hardwood forests over three decades. Ecology 2000, 81, 110–126. [Google Scholar]
- Cale, J.A.; Teale, S.A.; West, J.L.; Zhang, L.I.; Castello, D.R.; Devlin, P.; Castello, J.D. A quantitative index of forest structural sustainability. Forests 2014, 5, 1618–1634. [Google Scholar] [CrossRef]
- Marks, C.O.; Canham, C.D. A quantitative framework for demographic trends in size-structured populations: Analysis of threats to floodplain forests. Ecosphere 2015, 6, 232. [Google Scholar] [CrossRef]
- Hanson, J.J.; Lorimer, C.G.; Halpin, C.R. Predicting long-term sapling dynamics and canopy recruitment in northern hardwood forests. Can. J. For. Res. 2011, 41, 903–919. [Google Scholar] [CrossRef]
- Halpin, C.R. Long-term Stand Development and Demographic Sustainability of Tree Populations in Northern Hardwood Forests. Ph.D. Thesis, University of Wisconsin-Madison, Madison, WI, USA, 2014. [Google Scholar]
- Halpin, C.R.; Lorimer, C.G. Trajectories and resilience of stand structure in response to variable disturbance severities in northern hardwoods. For. Ecol. Manag. 2016, 365, 69–82. [Google Scholar] [CrossRef]
- Halpin, C.R.; Lorimer, C.G. Long-term trends in biomass and tree demography in northern hardwoods: An integrated field and simulation study. Ecol. Monogr. 2016, 86, 78–93. [Google Scholar] [CrossRef]
- Halpin, C.R. Simulated Long-term Effects of Group Selection on Production, Efficiency, Composition, and Structure in Northern Hardwood and Hemlock-hardwood Forests. Master’s Thesis, University of Wisconsin-Madison, Madison, WI, USA, 2009. [Google Scholar]
- Hanson, J.J.; Lorimer, C.G.; Halpin, C.R.; Palik, B.J. Ecological forestry in an uneven-aged, late-successional forest: Simulated effects of contrasting treatments on structure and yield. For. Ecol. Manag. 2012, 270, 94–107. [Google Scholar] [CrossRef]
- Lorimer, C.G.; Halpin, C.R. Classification and dynamics of developmental stages in late-successional temperate forests. For. Ecol. Manag. 2014, 334, 344–357. [Google Scholar] [CrossRef]
- Kotar, J.; Burger, T.L.; Kovach, J.A. A Guide to Forest Communities and Habitat Types of Northern Wisconsin; Department of Forest Ecology and Management, University of Wisconsin-Madison: Madison, WI, USA, 2002. [Google Scholar]
- Coffman, M.S. Field Guide: Habitat Classification System for Upper Peninsula of Michigan and Northeast Wisconsin; School of Forestry and Wood Products, Michigan Technological University: Houghton, MI, USA, 1980. [Google Scholar]
- Frelich, L.E.; Lorimer, C.G. Natural disturbance regimes in hemlock-hardwood forests of the upper Great Lakes region. Ecol. Monogr. 1991, 61, 145–164. [Google Scholar] [CrossRef]
- Lugo, A.E.; Scatena, F.N. Background and catastrophic mortality in tropical moist, wet, and rain forests. Biotropica 1996, 28, 585–599. [Google Scholar] [CrossRef]
- Vanclay, J.K. A growth model for north Queensland rain forests. For. Ecol. Manag. 1989, 27, 245–271. [Google Scholar] [CrossRef] [Green Version]
- Henry, J.D.; Swan, J.M.A. Reconstructing forest history from live and dead plant material—An approach to the study of forest succession in southwest New Hampshire. Ecology 1974, 55, 772–783. [Google Scholar] [CrossRef]
- Peterson, C.J. Damage and recovery of tree species after two different tornadoes in the same old growth forest: A comparison of infrequent wind disturbances. For. Ecol. Manag. 2000, 135, 237–252. [Google Scholar] [CrossRef]
- Lang, K.D.; Schulte, L.A.; Guntenspergen, G.R. Windthrow and salvage logging in an old-growth hemlock-northern hardwoods forest. For. Ecol. Manag. 2009, 259, 56–64. [Google Scholar] [CrossRef]
- Zhang, Q.; Pregitzer, K.S.; Reed, D.D. Catastrophic disturbance in the presettlement forests of the upper peninsula of Michigan. Can. J. For. Res. 1999, 29, 106–114. [Google Scholar] [CrossRef]
- Schulte, L.A.; Mladenoff, D.J. Severe wind and fire regimes in northern forests: Historical variability at the regional scale. Ecology 2005, 86, 431–445. [Google Scholar] [CrossRef]
- Hanson, J.J. Emulating Natural Disturbance Dynamics in Northern Hardwood Forests: Long-term Effects on Species Composition, Forest Structure, and Yield. Ph.D. Thesis, University of Wisconsin-Madison, Madison, WI, USA, 2009. [Google Scholar]
- Lorimer, C.G.; Dahir, S.E.; Nordheim, E.V. Tree mortality rates and longevity in mature and old-growth hemlock-hardwood forests. J. Ecol. 2001, 89, 960–971. [Google Scholar] [CrossRef]
- Ellison, A.M.; Bank, M.S.; Clinton, B.D.; Colburn, E.A.; Elliott, K.; Ford, C.R.; Foster, D.R.; Kloeppel, B.D.; Knoepp, J.D.; Lovett, G.M.; et al. Loss of foundation species: Consequences for the structure and dynamics of forested ecosystems. Front. Ecol. Environ. 2005, 3, 479–486. [Google Scholar] [CrossRef]
- Holdsworth, A.R.; Frelich, L.E.; Reich, P.B. Effects of earthworm invasion on plant species richness in northern hardwood forests. Conserv. Biol. 2007, 21, 997–1008. [Google Scholar] [CrossRef] [PubMed]
- Dodds, K.J.; Orwig, D.A. An invasive urban forest pest invades natural environments—Asian longhorned beetle in northeastern US hardwood forests. Can. J. For. Res. 2011, 41, 1729–1742. [Google Scholar] [CrossRef]
- Mayer, D.G.; Butler, D.G. Statistical validation. Ecol. Model. 1993, 68, 21–32. [Google Scholar] [CrossRef]
- R Core Team. R: A Language and Environment for Statistical Computing; R Foundation for Statistical Computing: Vienna, Austria, 2013. [Google Scholar]
- Lima, R.A.F.; Muller-Landau, H.C.; Prado, P.I.; Condit, R. How do size distributions relate to currently measured demographic rates? Evidence from over 150 tree species in Panama. J. Trop. Ecol. 2016, 32, 179–192. [Google Scholar] [CrossRef]
- Rubin, B.D.; Manion, P.D.; Faber-Langendoen, D. Diameter distributions and structural sustainability in forests. For. Ecol. Manag. 2006, 222, 427–438. [Google Scholar] [CrossRef]
- O’Hara, K.L. Dynamics and stocking-level relationships of multi-aged Ponderosa pine stands. For. Sci. Monogr. 1996, 42, 1–34. [Google Scholar]
- Goodburn, J.M.; Lorimer, C.G. Population structure in old-growth and managed northern hardwoods: An examination of the balanced diameter distribution concept. For. Ecol. Manag. 1999, 118, 11–29. [Google Scholar] [CrossRef]
- Marquis, D.A. Application of uneven-aged silviculture and management on public and private lands. In Uneven-Aged Silviculture and Management in the United States; USDA Forest Service, Timber Management Research: Washington, DC, USA, 1978; pp. 25–61. [Google Scholar]
- Crow, T.R.; Jacobs, R.D.; Oberg, R.R.; Tubbs, C.H. Stocking and Structure for Maximum Growth in Sugar Maple Selection Stands; Research Paper NC-199; USDA Forest Service, North Central Forest Experiment Station: St. Paul, MN, USA, 1981.
- Leak, W.B.; Solomon, D.S.; DeBald, P.S. Silvicultural Guide for Northern Hardwood Types in the Northeast (Revised); Research Paper NE-603; USDA Forest Service, Northeastern Forest Experiment Station: Broomall, PA, USA, 1987.
- Janowiak, M.K.; Webster, C.R. Promoting ecological sustainability in woody biomass harvesting. J. For. 2010, 108, 16–23. [Google Scholar]
- Aguilar, F.X.; Daniel, M.J.; Narine, L.L. Opportunities and challenges to the supply of woody biomass for energy from Missouri nonindustrial privately owned forestlands. J. For. 2013, 111, 249–260. [Google Scholar] [CrossRef]
- Keeton, W.S. Managing for late-successional/old-growth characteristics in northern hardwood-conifer forests. For. Ecol. Manag. 2006, 235, 129–142. [Google Scholar] [CrossRef]
- Busing, R.T.; Wu, X. Size-specific mortality, growth, and structure of a Great Smoky Mountains red spruce population. Can. J. For. Res. 1990, 20, 206–210. [Google Scholar] [CrossRef]
- Westphal, C.; Tremer, N.; von Oheimb, G.; Hansen, J.; von Gadow, K.; Hardtle, W. Is the reverse J-shaped diameter distribution universally applicable in European virgin beech forests? For. Ecol. Manag. 2006, 223, 75–83. [Google Scholar] [CrossRef]
- Alessandrini, A.; Biondi, F.; Di Filippo, A.; Ziaco, E.; Piovesan, G. Tree size distribution at increasing spatial scales converges to the rotated sigmoid form in two old-growth beech stands of the Italian Apennines. For. Ecol. Manag. 2011, 262, 1950–1962. [Google Scholar] [CrossRef]
- Trotsiuk, V.; Hobi, M.L.; Commarmot, B. Age structure and disturbance dynamics of the relic virgin beech forest Uholka (Ukrainian Carpathians). For. Ecol. Manag. 2012, 265, 181–190. [Google Scholar] [CrossRef]
- Hobi, M.L.; Commarmot, B.; Bugmann, H. Pattern and process in the largest primeval beech forest of Europe (Ukrainian Carpathians). J. Veg. Sci. 2015, 26, 323–336. [Google Scholar] [CrossRef]
- Lorimer, C.G.; Frelich, L.E. A simulation of equilibrium diameter distributions of sugar maple (Acer saccharum). Bull. Torrey Bot. Club 1984, 111, 193–199. [Google Scholar] [CrossRef]
- Janowiak, M.K.; Nagel, L.M.; Webster, C.R. Spatial scale and stand structure in northern hardwood forests: Implications for quantifying diameter distributions. For. Sci. 2008, 54, 497–506. [Google Scholar]
- Runkle, J.R. Canopy tree turnover in old-growth mesic forests of eastern North America. Ecology 2000, 81, 554–567. [Google Scholar] [CrossRef]
- Busing, R.T. Tree mortality, canopy turnover, and woody detritus in old cove forests of the southern Appalachians. Ecology 2005, 86, 73–84. [Google Scholar] [CrossRef]
- Lines, E.R.; Coomes, D.A.; Purves, D.W. Influences of forest structure, climate and species composition on tree mortality across the eastern US. PLoS ONE 2010, 5, e13212. [Google Scholar] [CrossRef] [PubMed]
- Webster, C.R.; Lorimer, C.G. Single-tree versus group selection in hemlock-hardwood forests: Are smaller openings less productive? Can. J. For. Res. 2002, 32, 591–604. [Google Scholar] [CrossRef]
- Woods, K.D. Long-term change and spatial pattern in a late-successional hemlock-northern hardwood forest. J. Ecol. 2000, 88, 267–282. [Google Scholar] [CrossRef]
- Fahey, R.T.; Lorimer, C.G.; Mladenoff, D.J. Habitat heterogeneity and life-history traits influence presettlement distribution of early-successional tree species in a late-successional, hemlock-hardwood landscape. Landsc. Ecol. 2012, 27, 999–1013. [Google Scholar] [CrossRef]
- Graham, S.A. Causes of Hemlock Mortality in Northern Michigan; Bulletin 10, School of Forestry & Conservation, University of Michigan: Ann Arbor, MI, USA, 1943. [Google Scholar]
- Hough, A.F. Silvical Characteristics of Eastern Hemlock (Tsuga canadensis); Station Paper SP-NE-132; USDA Forest Service, Northeastern Forest Experiment Station: Upper Darby, PA, USA, 1960.
- Goerlich, D.L.; Nyland, R.D. Natural regeneration of eastern hemlock: A review. In Proceedings: Symposium on Sustainable Management of Hemlock Ecosystems in Eastern North America; McManus, K.A., Shields, K.S., Souto, D.R., Eds.; General Technical Report NE-267; USDA Forest Service, Northeastern Forest Experiment Station: Newtown Square, PA, USA, 2000; pp. 14–22. [Google Scholar]
- Marx, L.M.; Walters, M.B. Survival of tree seedlings on different species of decaying wood maintains tree distribution in Michigan hemlock-hardwood forests. J. Ecol. 2008, 96, 505–513. [Google Scholar] [CrossRef]
- Shields, J.M.; Webster, C.R.; Nagel, L.M. Factors influencing tree species diversity and Betula alleghaniensis establishment in silvicultural openings. Forestry 2007, 80, 293–307. [Google Scholar] [CrossRef]
- Bolton, N.W.; D’Amato, A.W. Regeneration responses to gap size and coarse woody debris within natural disturbance-based silvicultural systems in northeastern Minnesota, USA. For. Ecol. Manag. 2011, 262, 1215–1222. [Google Scholar] [CrossRef]
- Lambert, J.-B.; Ameztegui, A.; Delagrange, S.; Messier, C. Birch and conifer deadwood favour early establishment and shade tolerance in yellow birch juveniles growing in sugar maple dominated stands. Can. J. For. Res. 2016, 46, 114–121. [Google Scholar] [CrossRef]
- Schreiber, S.G.; Bearlin, A.R.; Nicol, S.J.; Todd, C.R. Adaptive management: A synthesis of current understanding and effective application. Ecol. Manag. Restor. 2004, 5, 177–182. [Google Scholar] [CrossRef]
- Williams, B.K. Passive and active adaptive management: Approaches and an example. For. Ecol. Manag. 2011, 92, 1371–1378. [Google Scholar] [CrossRef] [PubMed]
- Parker, G.R.; Leopold, D.J.; Eichenberger, J.K. Tree dynamics in an old-growth, deciduous forest. For. Ecol. Manag. 1985, 11, 31–57. [Google Scholar] [CrossRef]
- Redmond, M.D.; Wilbur, R.B.; Wilbur, H.M. Recruitment and dominance of Quercus rubra and Quercus alba in a previous oak-chestnut forest from the 1980s to 2008. Am. Midl. Nat. 2012, 168, 427–442. [Google Scholar] [CrossRef]
- Frelich, L.E.; Lorimer, C.G. Current and predicted long-term effects of deer browsing in hemlock forests in Michigan, USA. Biol. Conserv. 1985, 34, 99–120. [Google Scholar] [CrossRef]
- Kaya, I.; Buongiorno, J. Economic harvesting of uneven-aged northern hardwood stands under risk: A Markovian decision model. For. Sci. 1987, 33, 889–907. [Google Scholar]
- Caspersen, J.P.; Vanderwel, M.C.; Cole, W.G.; Purves, D.W. How stand productivity results from size- and competition-dependent growth and mortality. PLoS ONE 2011, 6, e28660. [Google Scholar] [CrossRef] [PubMed]
- Eschtruth, A.K.; Cleavitt, N.L.; Battles, J.J.; Evans, R.A.; Fahey, T.J. Vegetation dynamics in declining eastern hemlock stands: 9 years of forest response to hemlock woolly adelgid infestation. Can. J. For. Res. 2006, 36, 1435–1450. [Google Scholar] [CrossRef]
- Orwig, D.A.; Foster, D.R.; Mausel, D.L. Landscape patterns of hemlock decline in New England due to the introduced hemlock woolly adelgid. J. Biogeogr. 2002, 29, 1475–1487. [Google Scholar] [CrossRef]
Figure 1.
Demographic sustainability index for (a) all species pooled and (b–d) major individual species computed from 30-year permanent plot records compared to CANOPY simulations. Vertical lines denote the range of variation over 20 simulation replicates. Dotted lines indicate the line of perfect agreement between predicted and observed values.
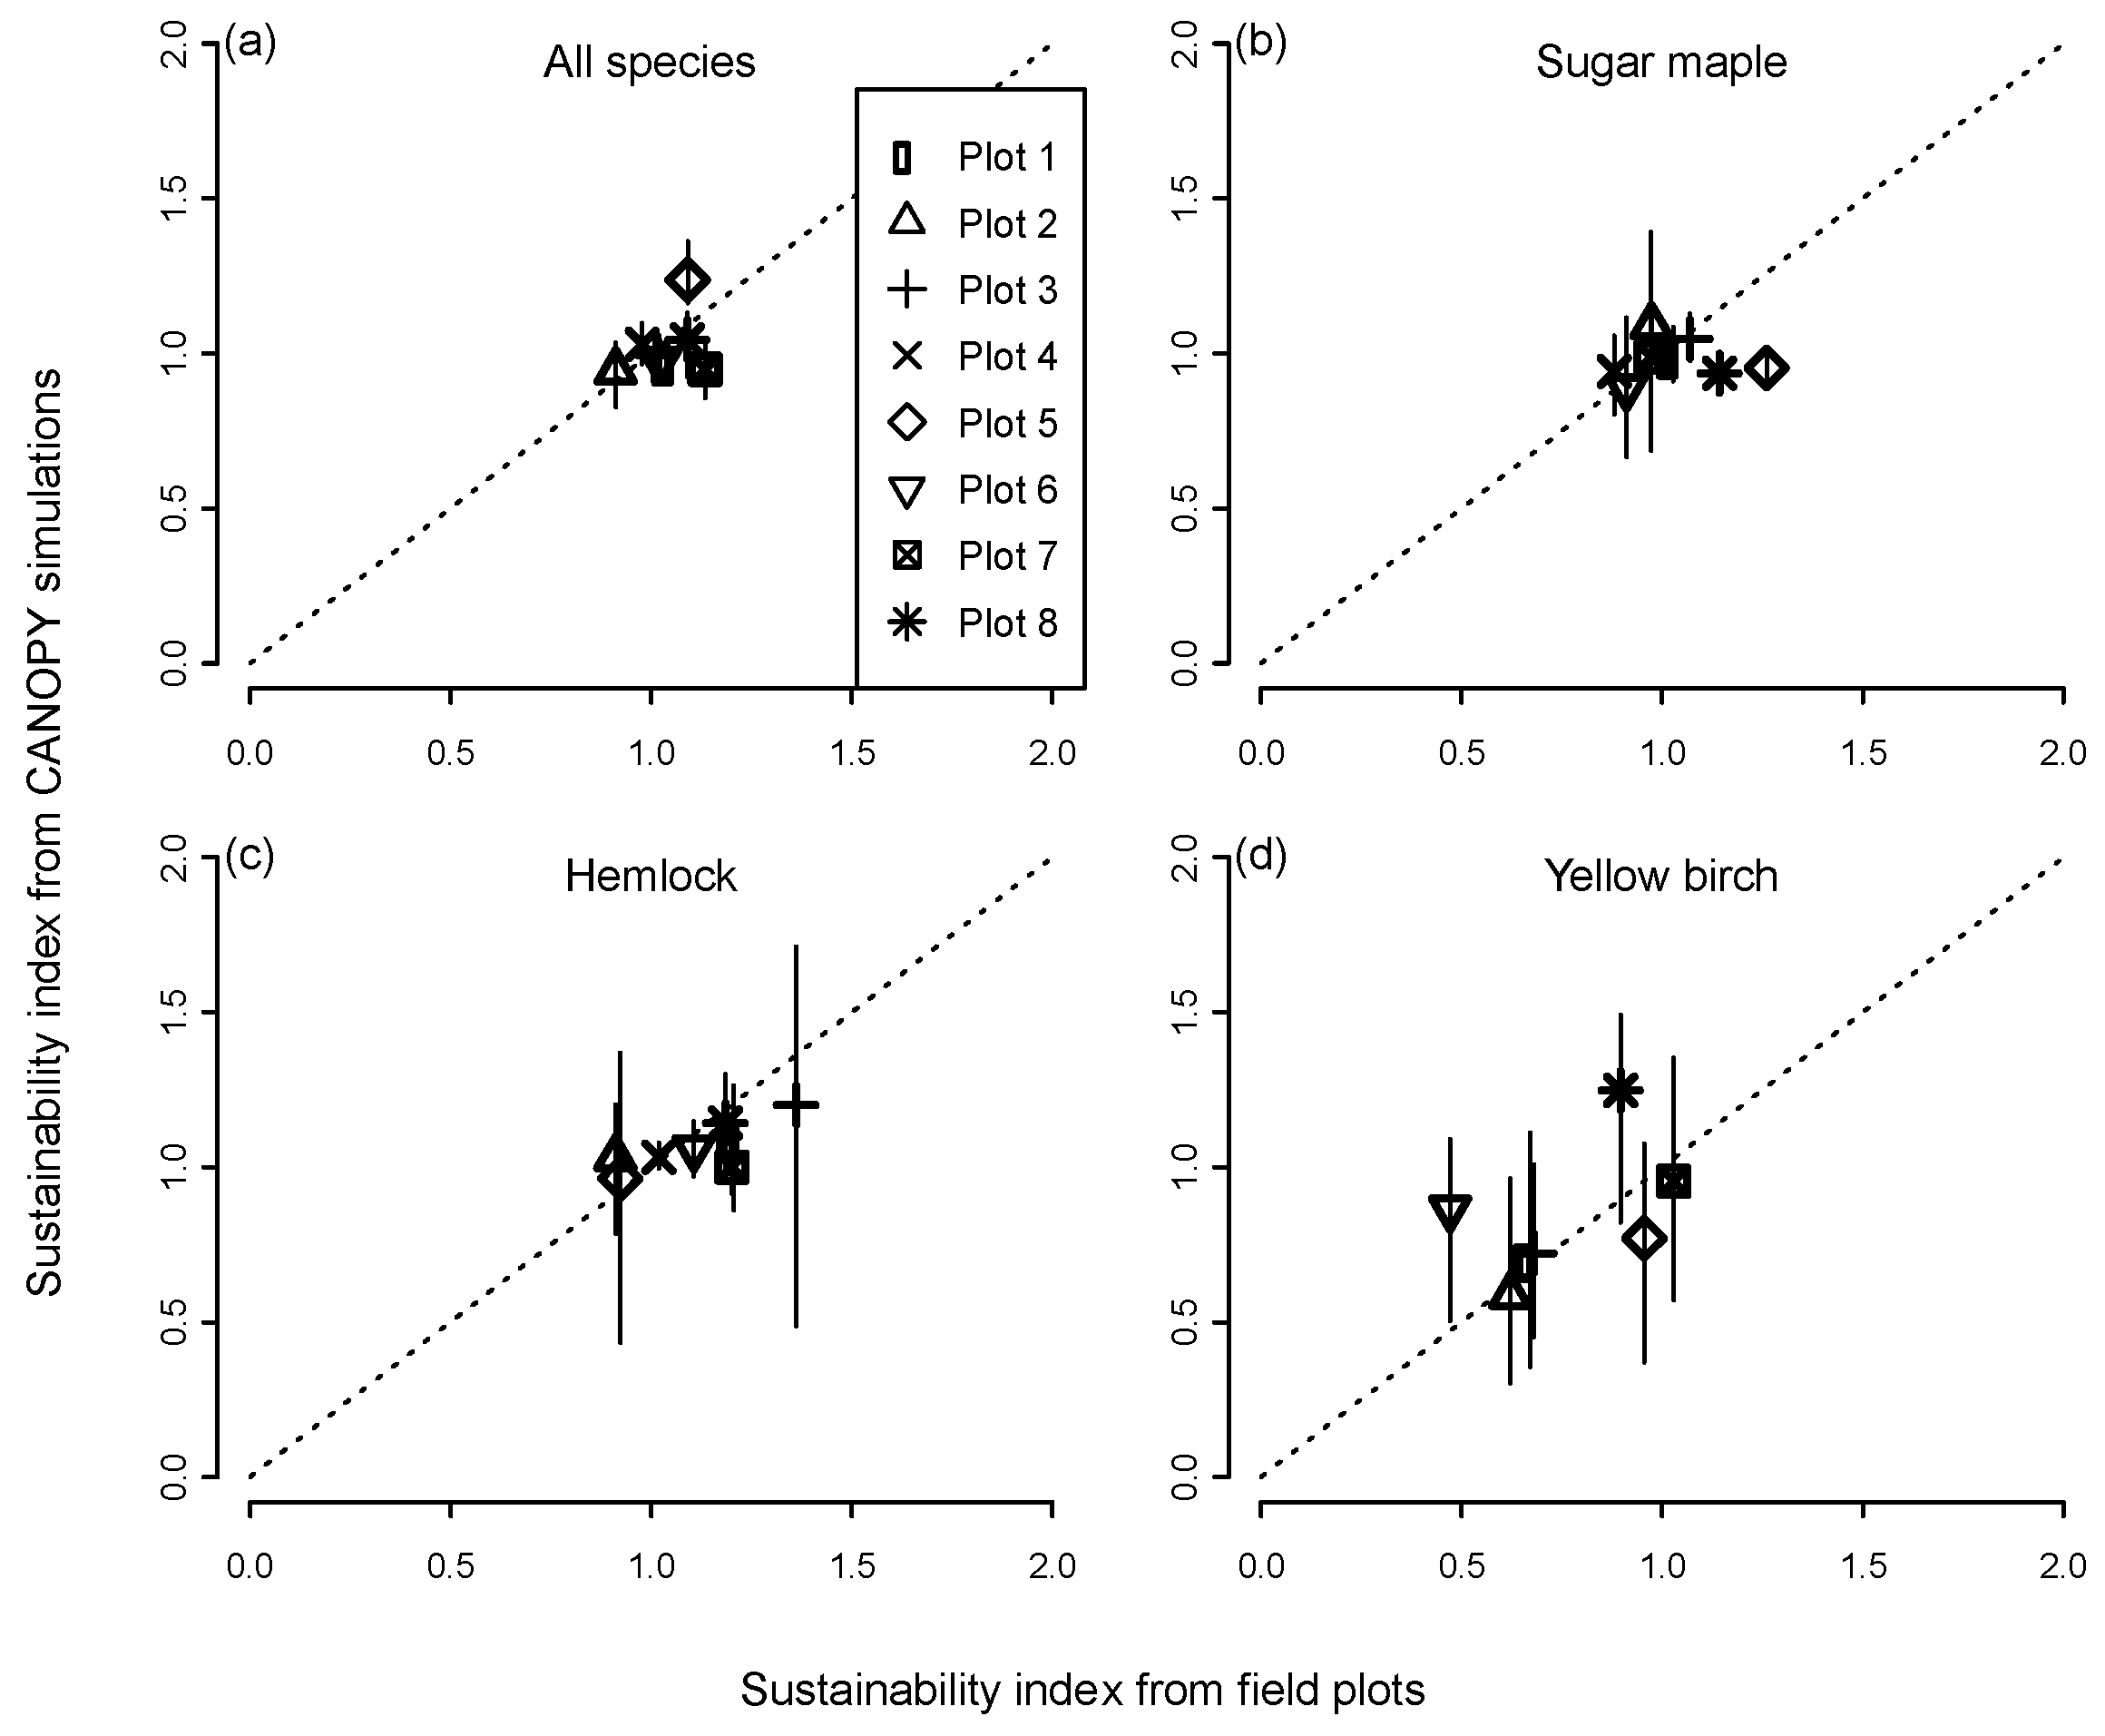
Figure 2.
Predicted size distributions and demographic sustainability indices for five 0.5 ha plots with a variety of initial diameter distributions from the 1981–1984 upper Michigan field survey. Each plot was simulated 10 times for 500 years, with the number of 2–6 cm DBH (diameter at breast height) saplings maintained constant at initial levels (Group 1a simulations). Left column: initial diameter distributions (a, d, g, j, m). Middle column: projected diameter distributions for the five plots in simulation year 500 (b, e, h, k, n. bars = means; whiskers = range of variation for the 10 replicates). Right column: distribution of sustainability index values for the five plots with all species pooled (c, f, I, l, o).
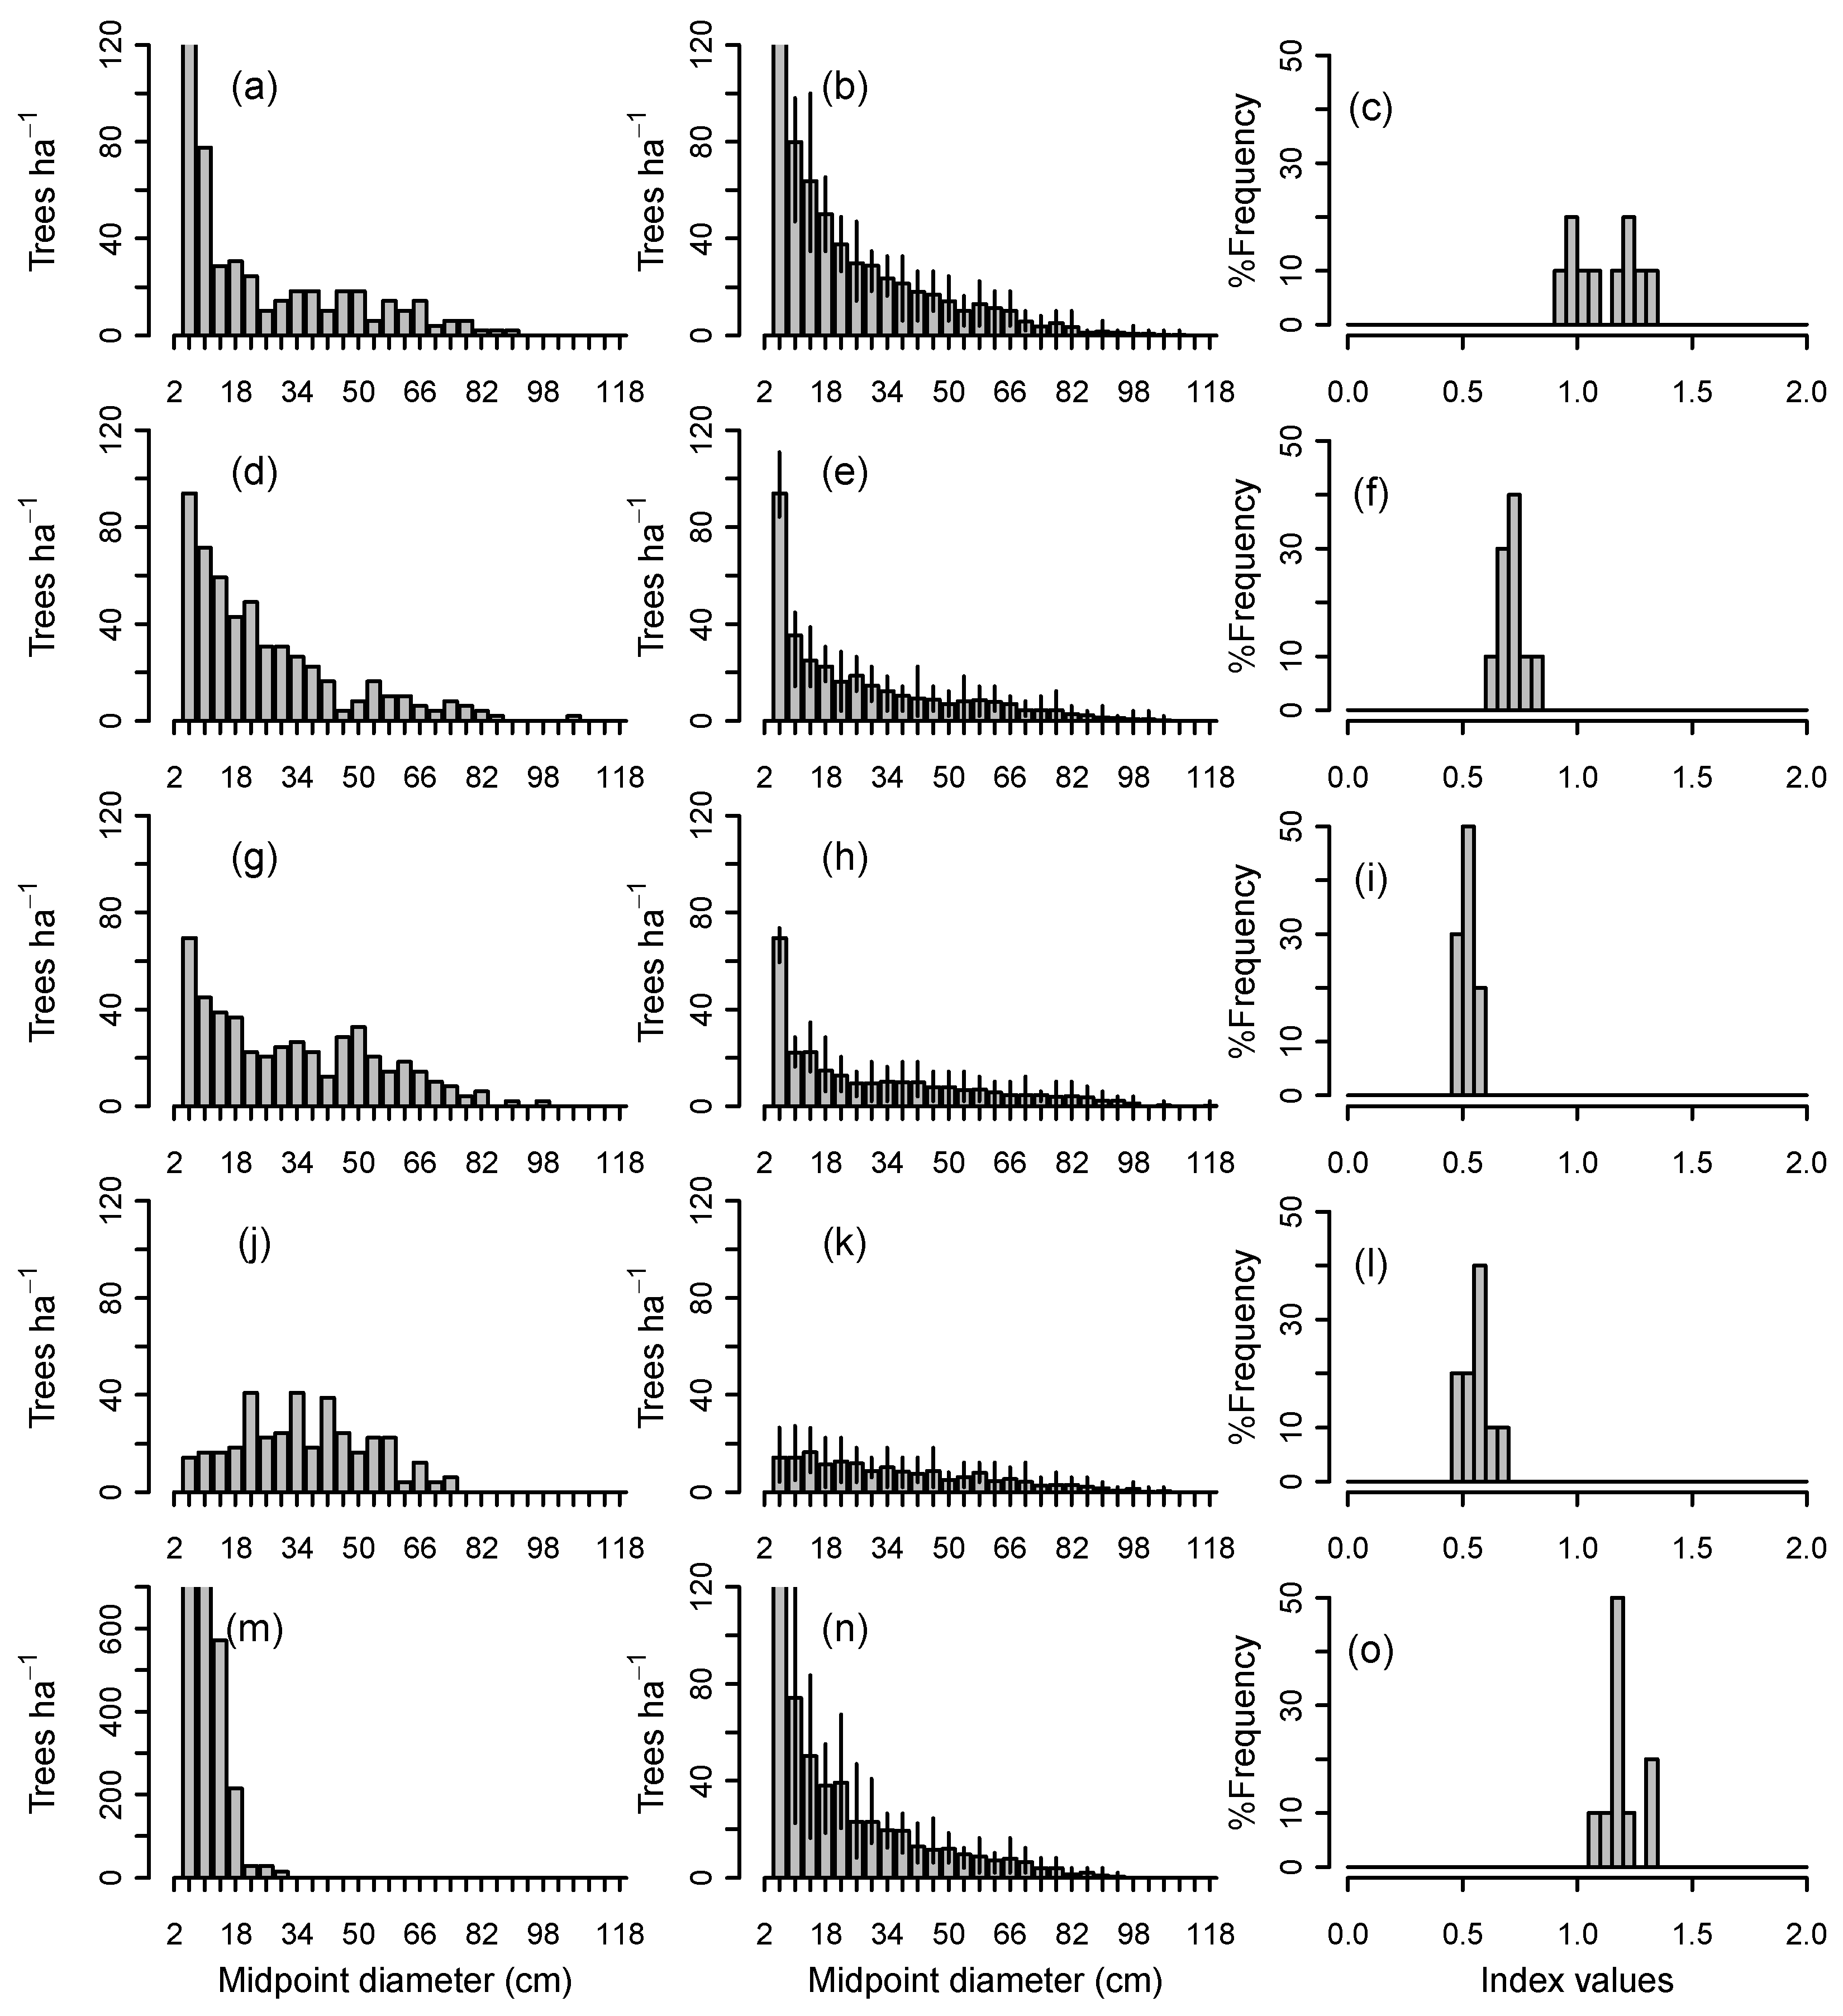
Figure 3.
(a) Predicted diameter distribution in year 500 for the five plots shown in Figure 2 when simulated without any recruitment limitation under background mortality only (Group 1b simulations). Solid lines show the mean of the 10 replicates for each plot. Dashed line gives the mean of all-aged field plots on Acer-Tsuga-Dryopteris (ATD) habitat, with gray band showing the range of variation; (b) Mean simulated densities for trees in the 10–40 cm size classes. For each size class, the five bars show the mean density for each of the five plots and whiskers indicate the range of variation among replicates; (c) 95% confidence band (thick red line) for 1000-year simulations under background mortality of all 70 plots compared to the range of variation among all-aged field plots (gray band). The narrow confidence band in the simulations is due to the large sample size (n = 700 independent observations after 1000 years of simulation), rather than lack of stochastic variation in the model (see panel b); (d) Observed diameter distributions that satisfied minimum structural steady-state criteria (ref. [24]) for mixed hardwoods on ATD habitat. Study area abbreviations: PM—Porcupine Mountains, Syl—Sylvania.
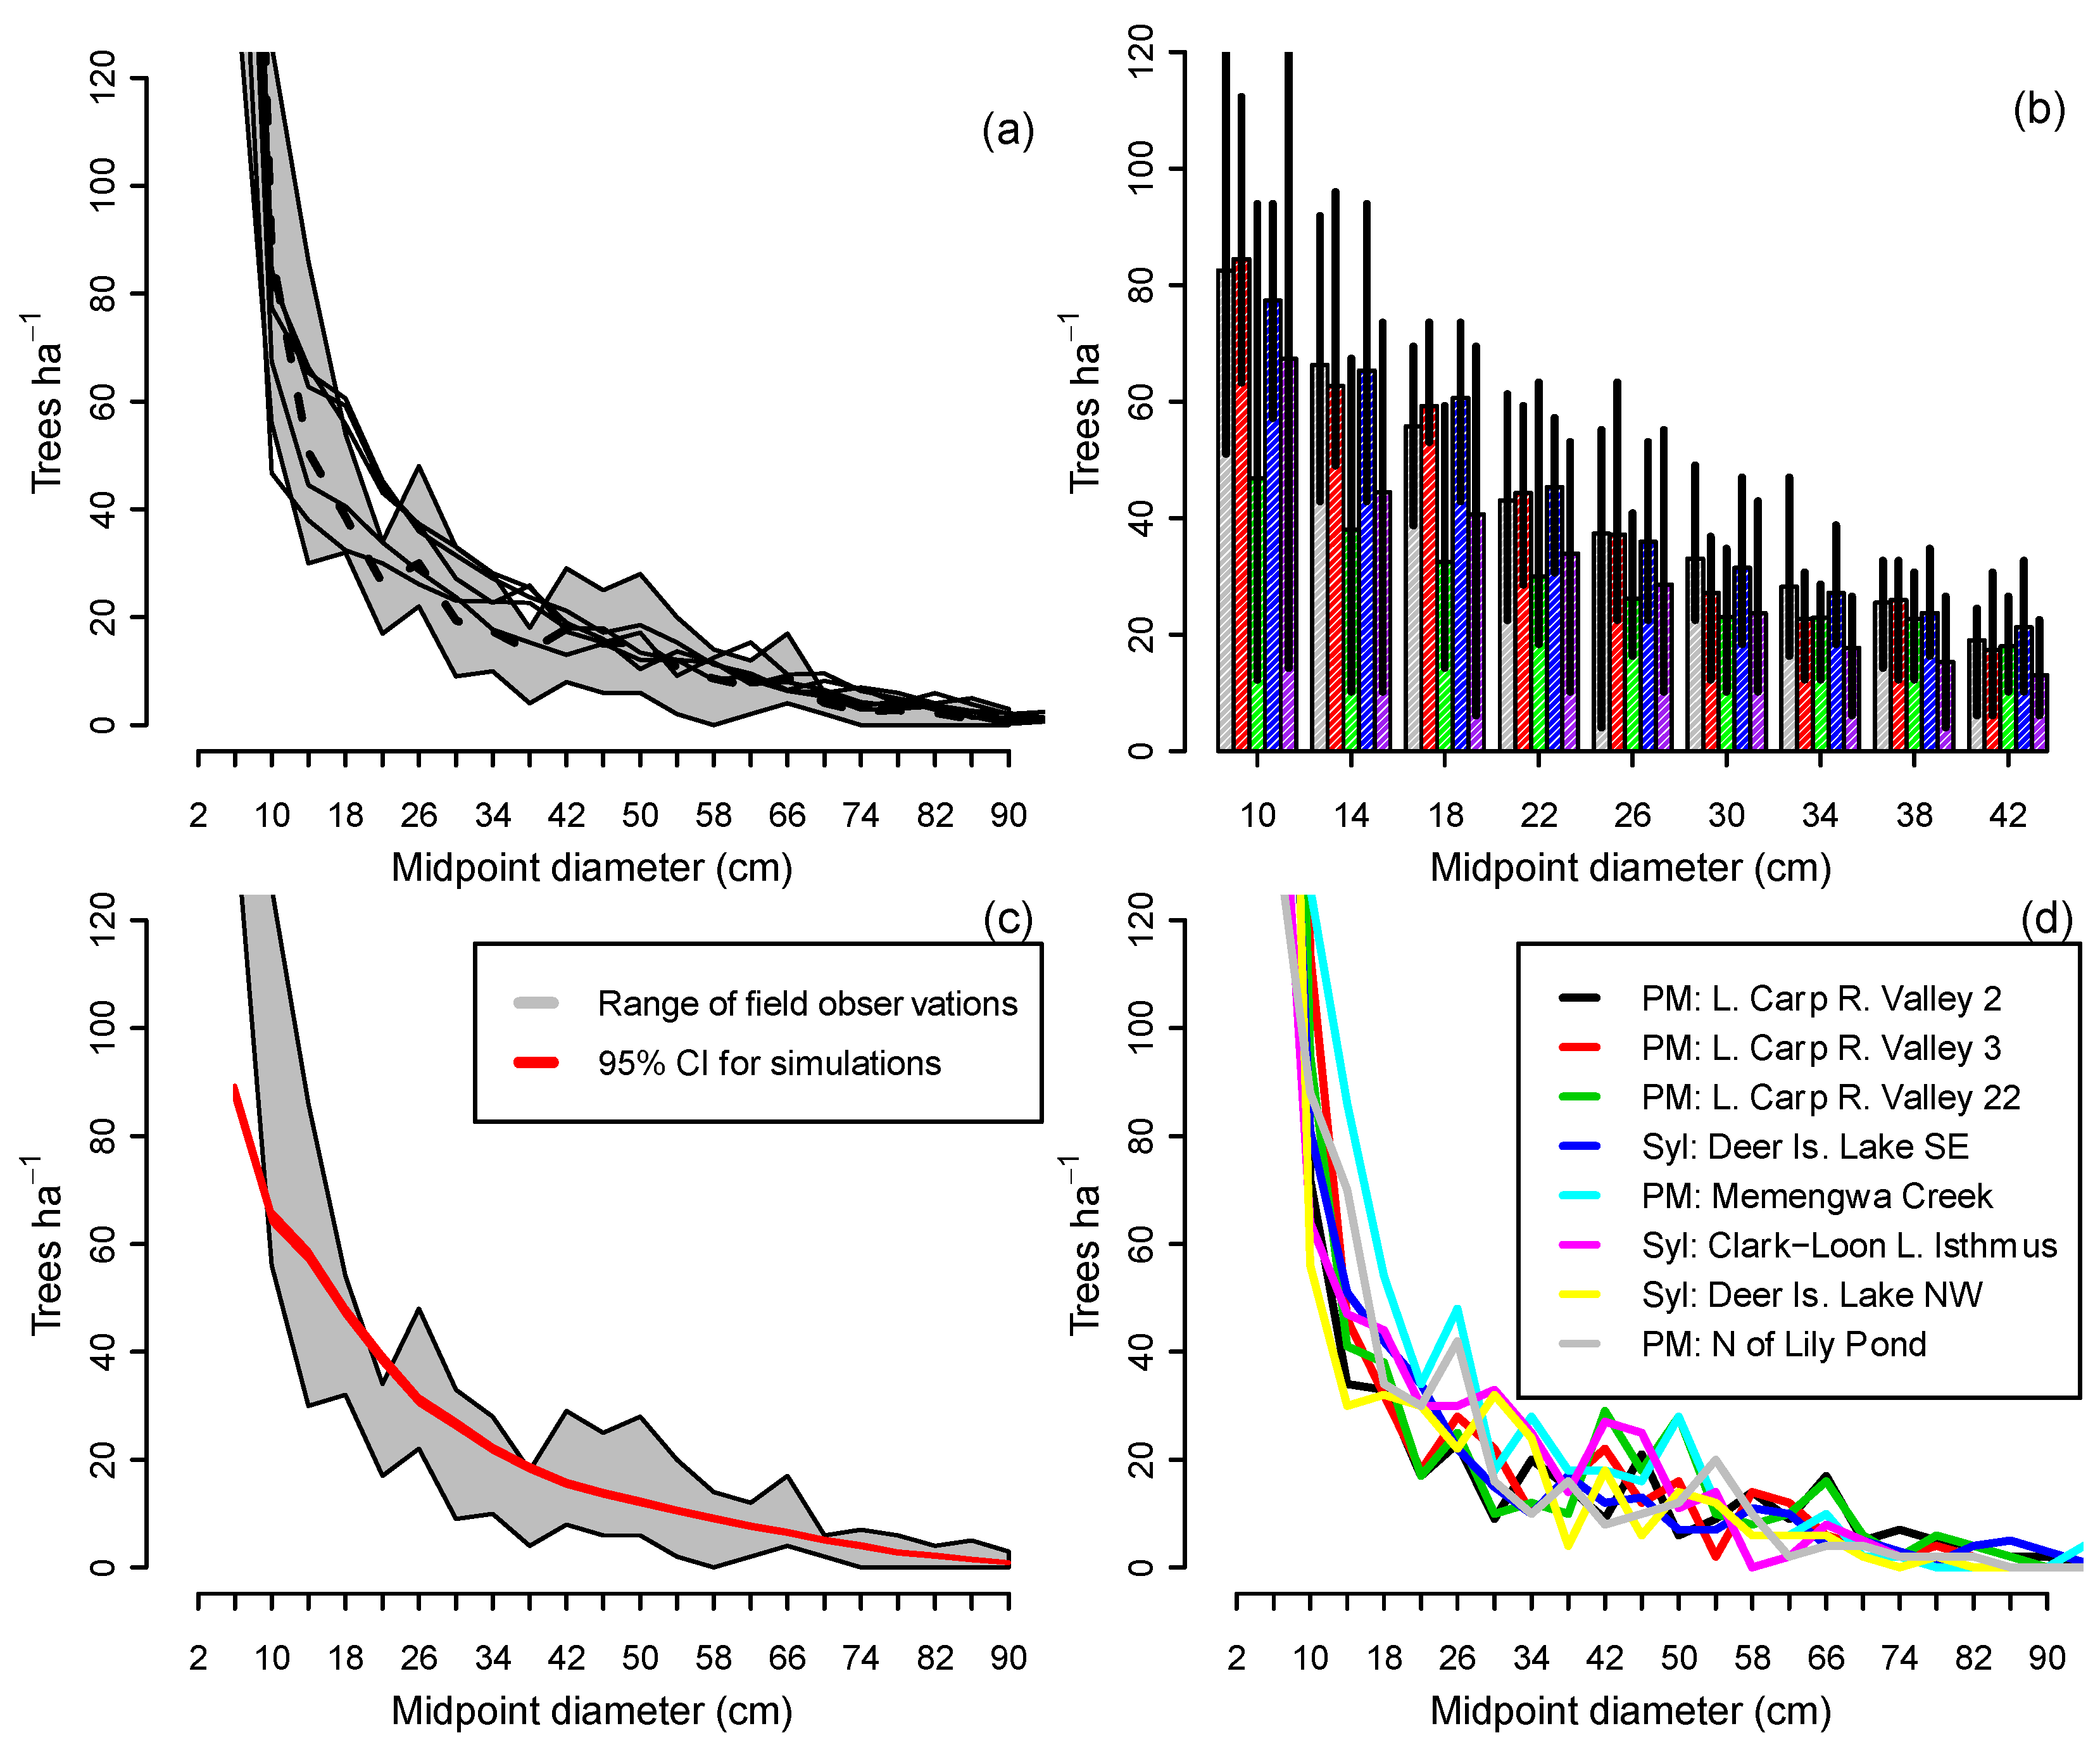
Figure 4.
Observed landscape-level diameter distributions for (a) all species pooled, and (b–h) each of the principal species in the 1981–1984 upper Michigan field survey (70 half hectare plots randomly allocated across 23,000 ha of primary forest). Thick lines give the means among plots, thin lines show a 95% confidence band without a multiple-test correction.

Figure 5.
Demographic sustainability index for each of the principal species (a–f) based on 20 replicated simulations at the landscape scale (pooled measurements of all 70 plots). Simulations were constrained to maintain the initial observed numbers of 2–6 cm DBH saplings of each species in the field data, assuming a disturbance regime of background mortality only (Group 1d simulations).

Figure 6.
Relationships between initial stand basal area, sapling density, and demographic sustainability index. (a) Observed sapling density as a function of stand basal area in the 1981–1984 field survey; (b,c) Frequency distribution of observed stand basal area and sapling density among 0.5 ha plots in the 1981–1984 field survey; (d,e) CANOPY predictions of the effect of initial stand basal area and initial sapling density on demographic sustainability index for pooled species in the 70 field plots. Simulations were run for 500 years, with 10 replicates per plot, and the initial number of 2–6 cm DBH saplings held constant. Species composition of new recruits was determined by CANOPY’s density-dependent recruitment equations. (Group 1a simulations).

Figure 7.
Pooled-species demographic sustainability index values from 1000-year simulation experiments with varying densities of small saplings (Group 2 simulations). (a) Pure maple stand where saplings were added if necessary to maintain the specified sapling density (Group 2a simulations); (b) Stands where the specified sapling density was used as a limit (i.e., additional trees were not added if mortality reduced the population below the specified density; Group 2b–d simulations).

Figure 8.
Predicted diameter distributions in simulation year 1000 of pure maple stands in which the specified densities of 2–6 cm DBH saplings were maintained at constant levels (Group 2a simulations). Data shown are the mean of 20 replicates. Data are grouped by 5 cm classes in this case in order to match q-ratios in the forestry literature.
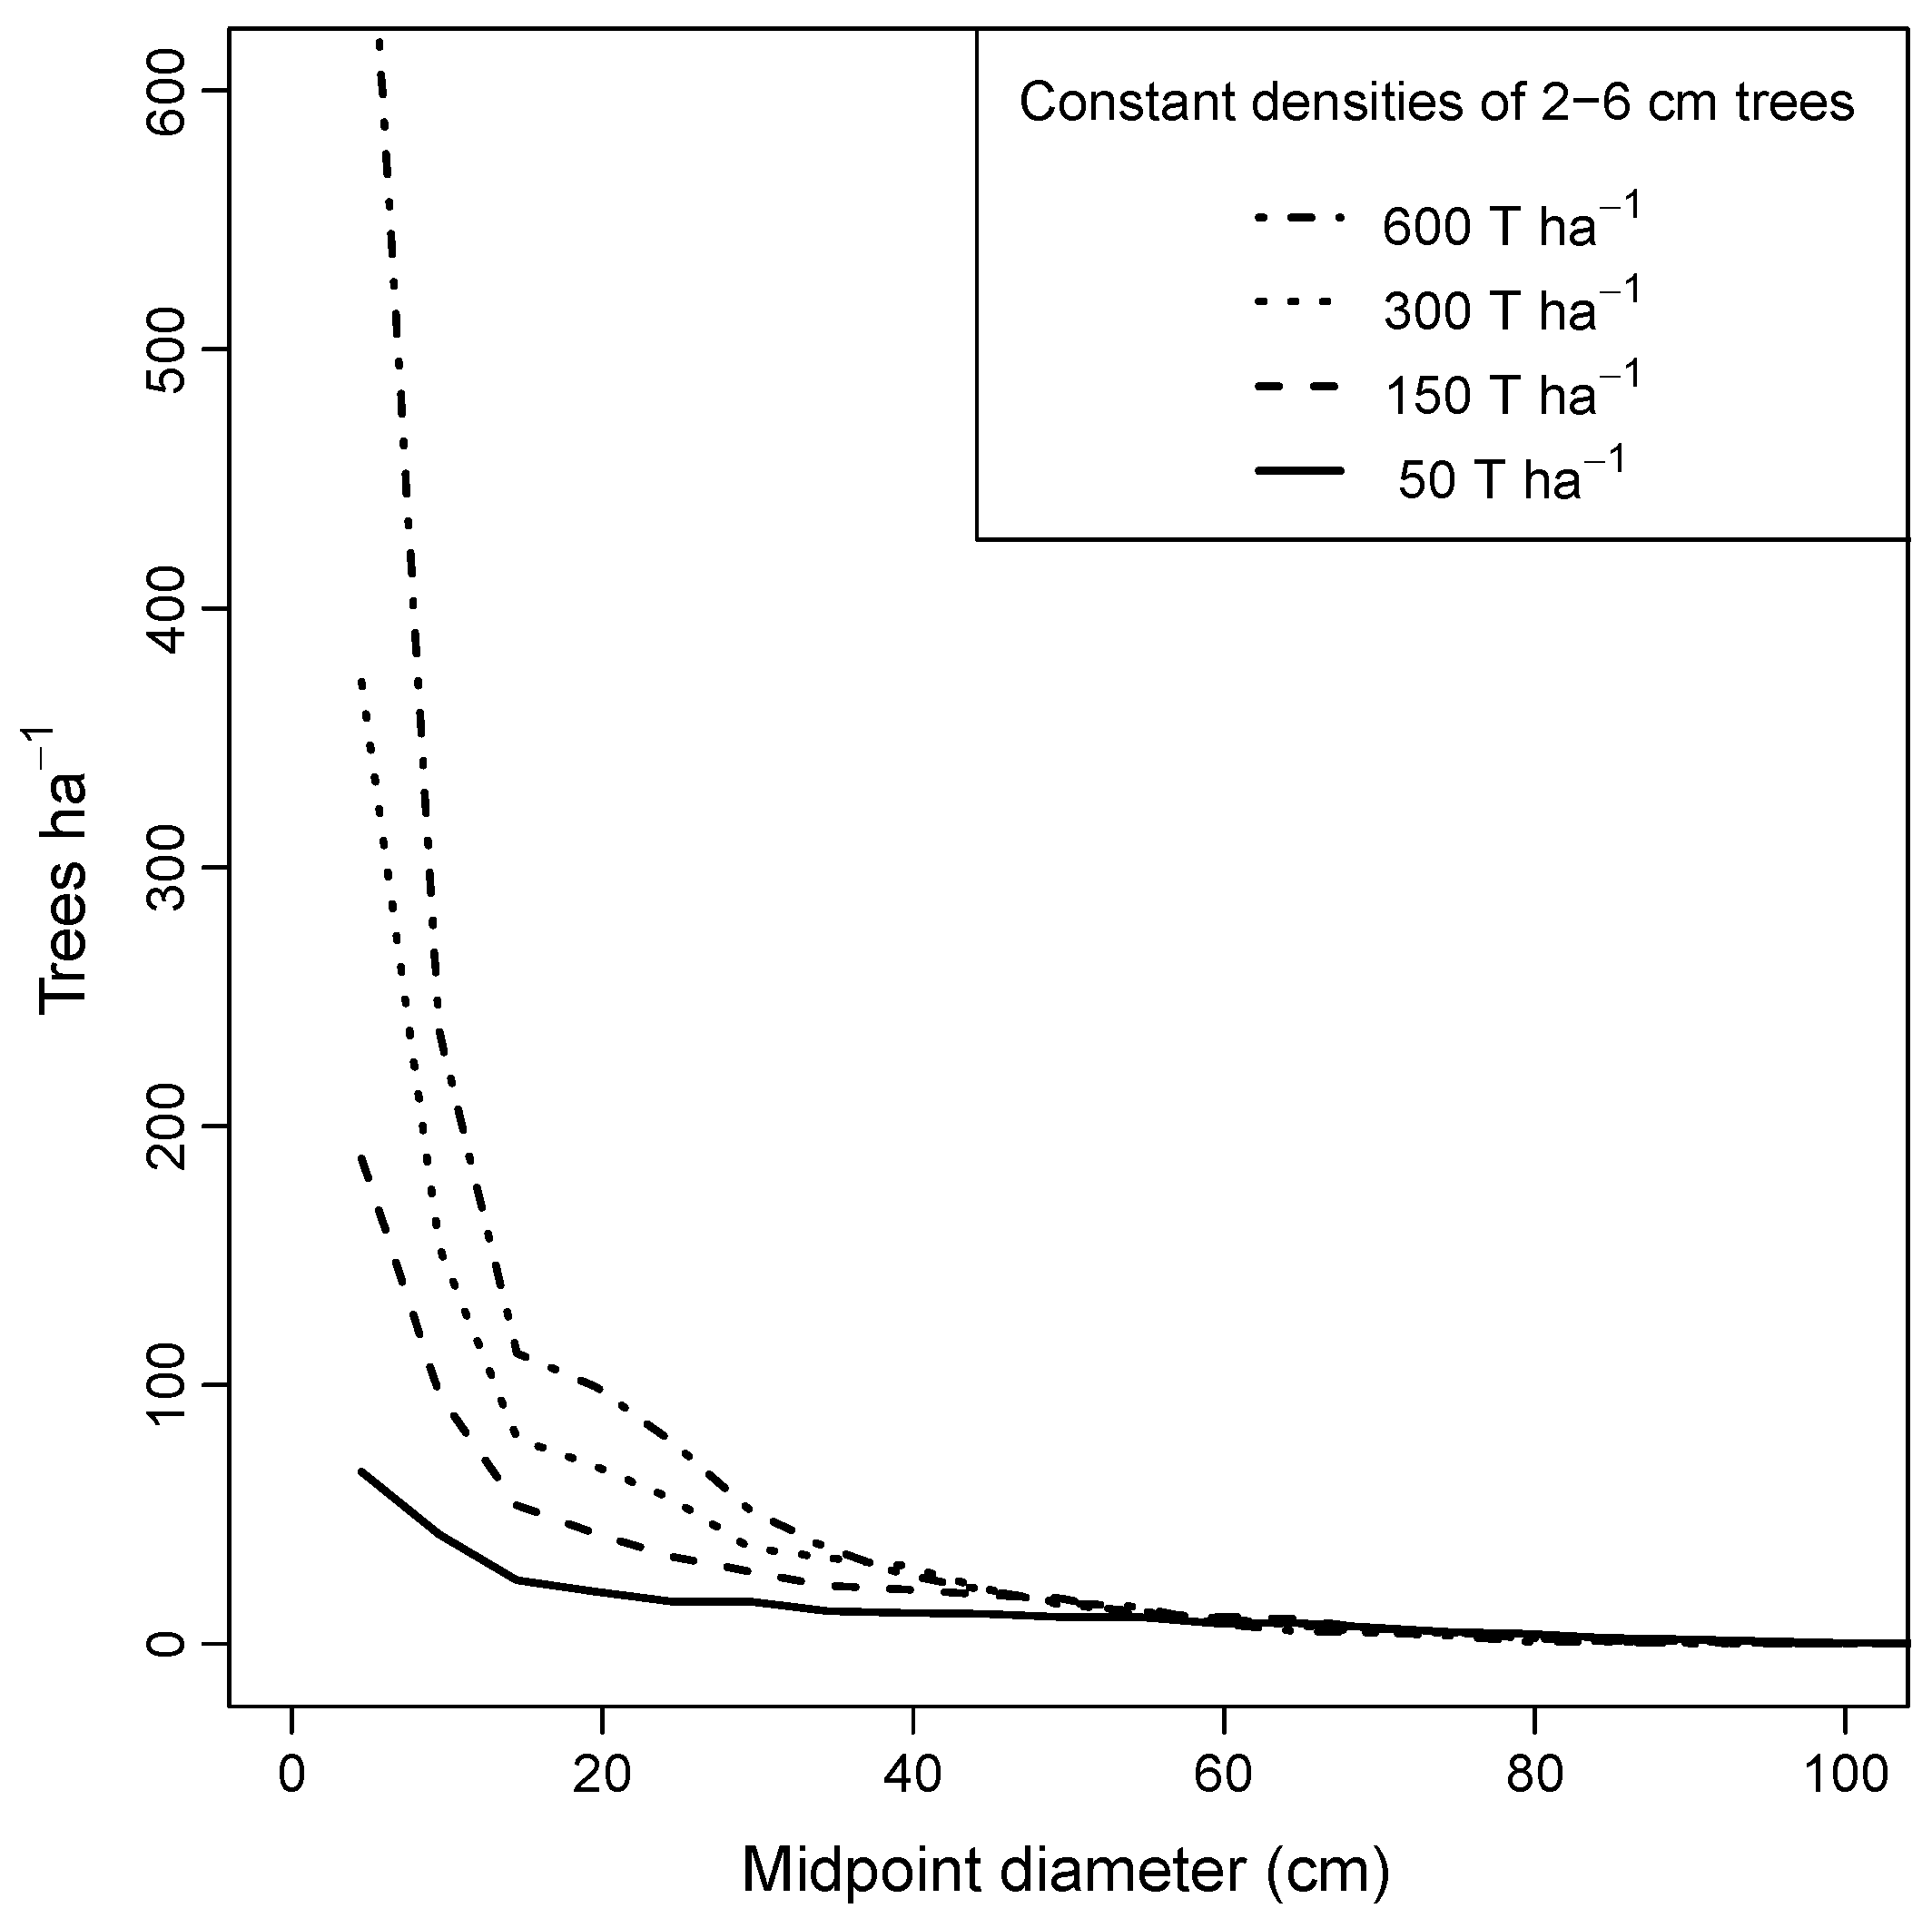
Figure 9.
Pooled-species demographic sustainability index as a function of maximum q-ratio. Q was held constant within a simulation in the 2–22 cm diameter classes. Simulations were conducted for 1000 years and replicated 20 times starting from uneven-aged old-growth stands (Group 3 simulations).
Figure 9.
Pooled-species demographic sustainability index as a function of maximum q-ratio. Q was held constant within a simulation in the 2–22 cm diameter classes. Simulations were conducted for 1000 years and replicated 20 times starting from uneven-aged old-growth stands (Group 3 simulations).


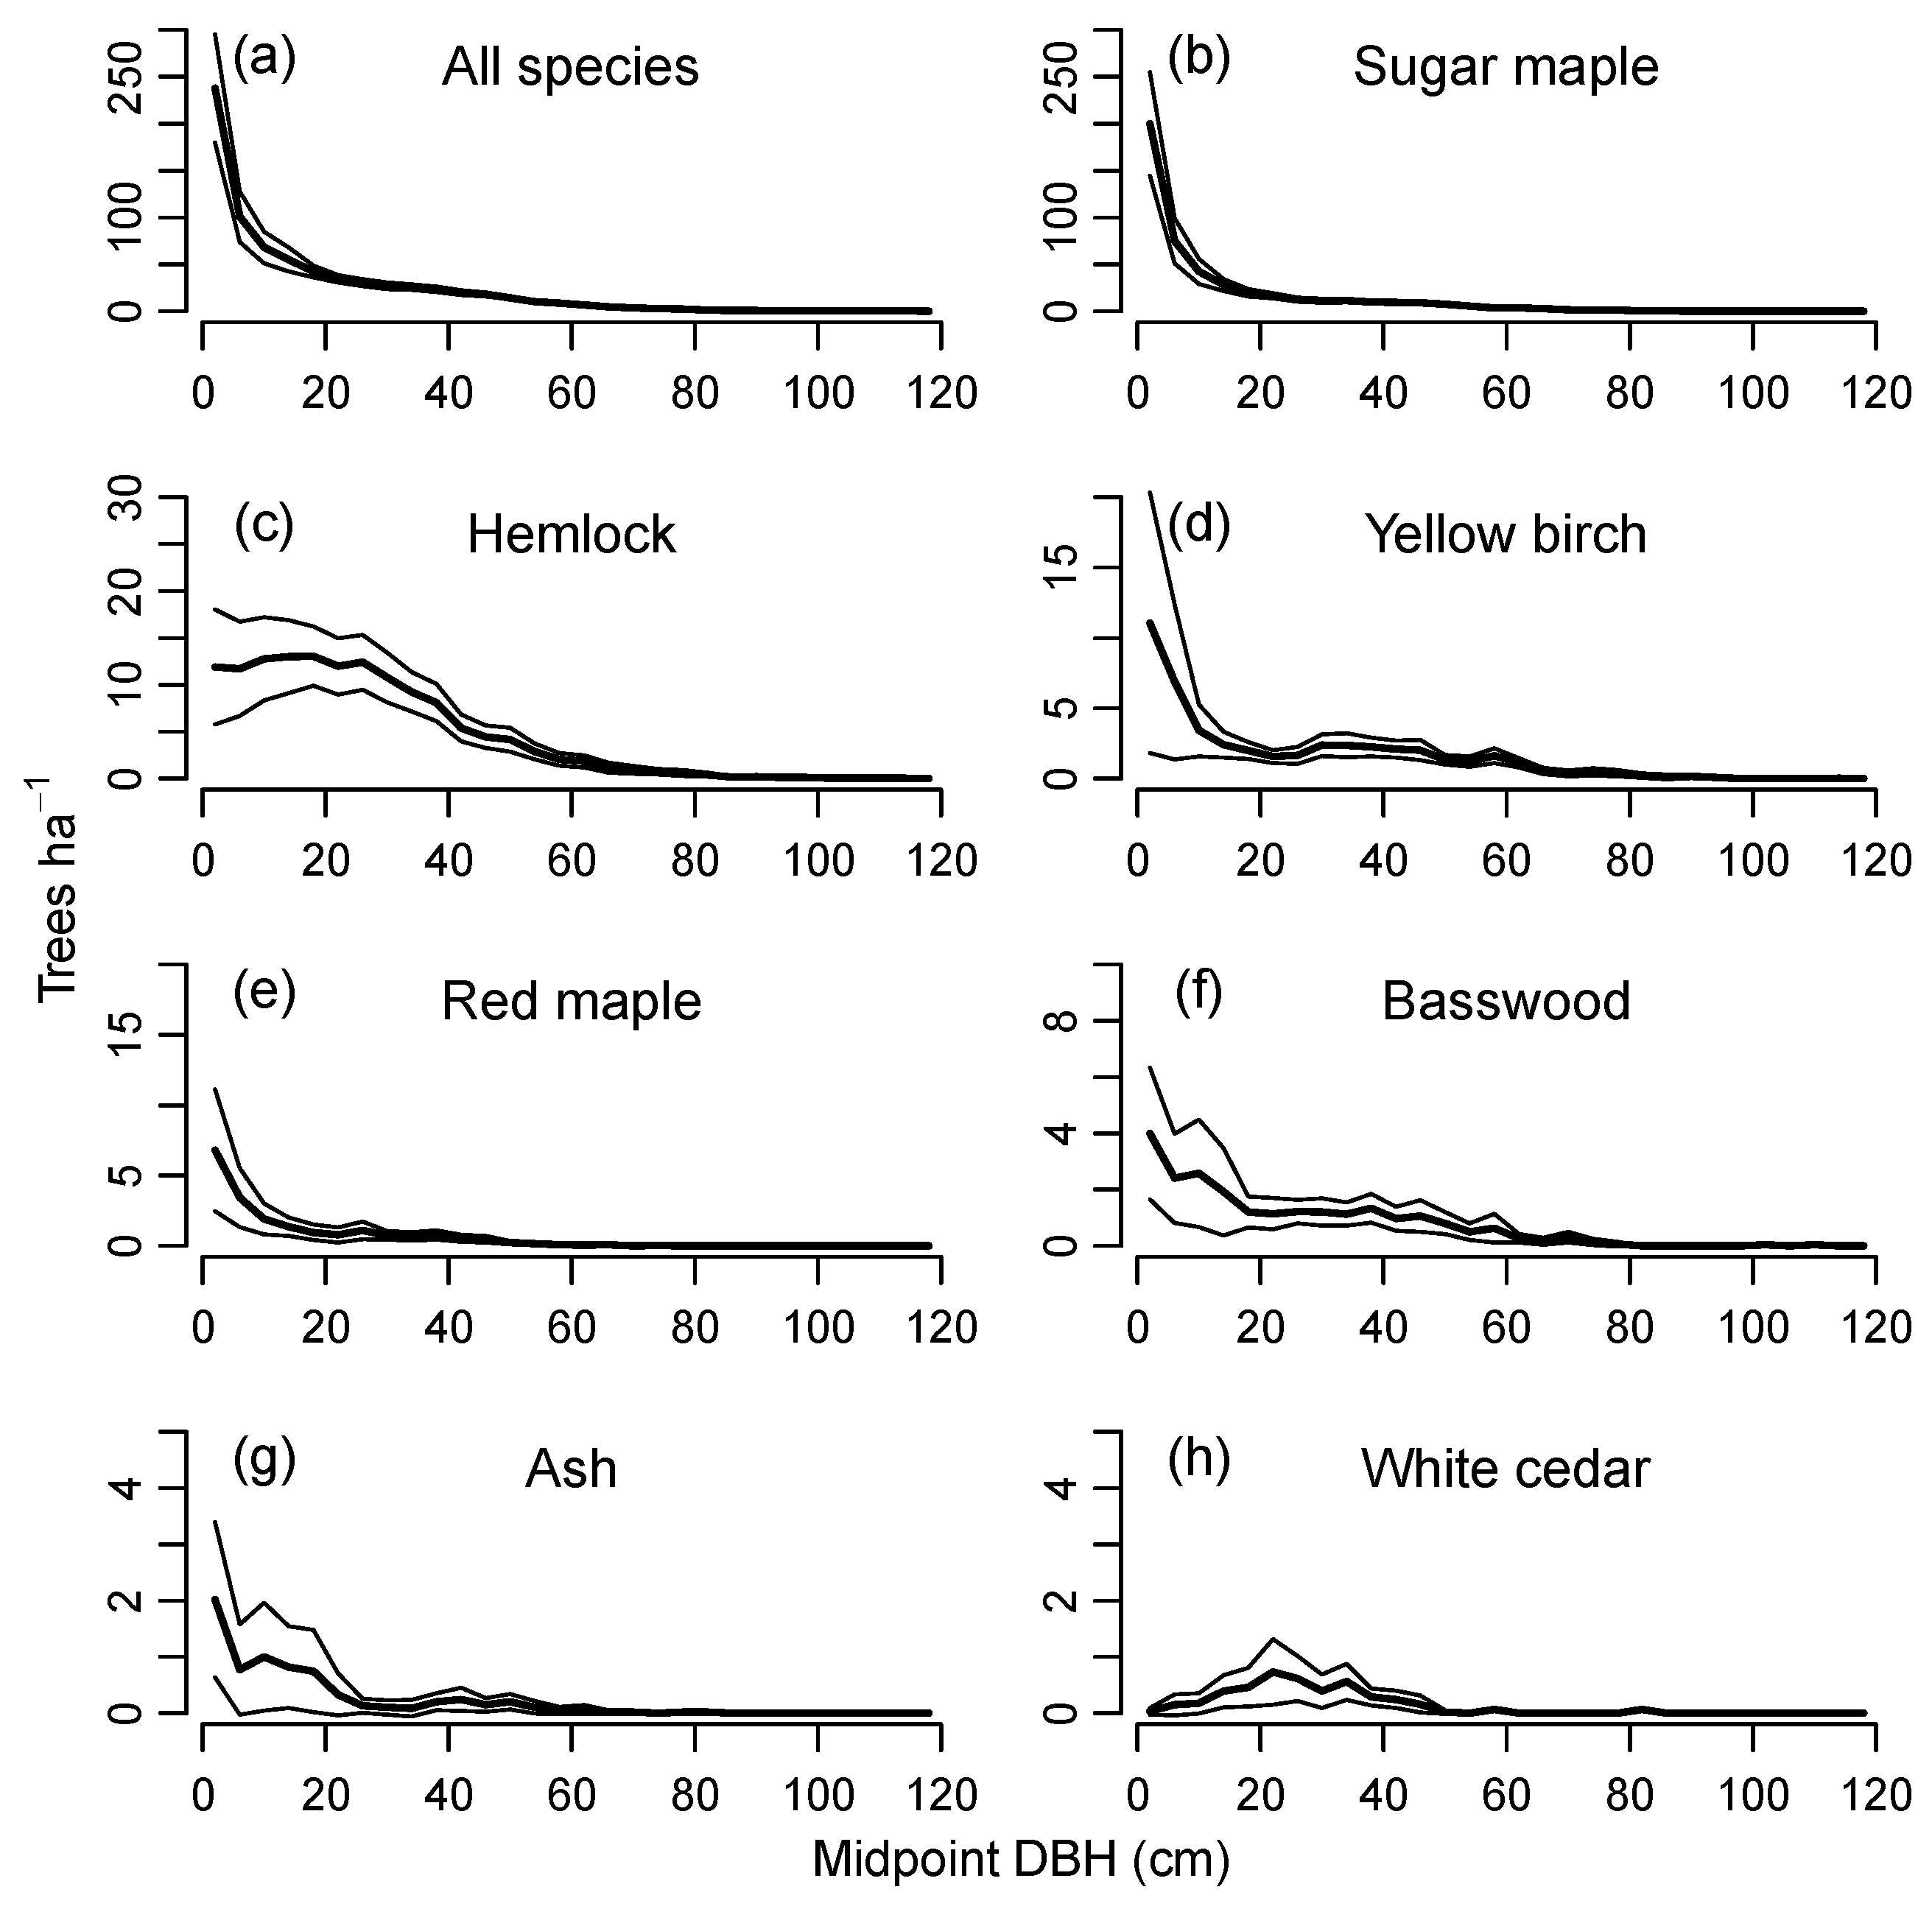
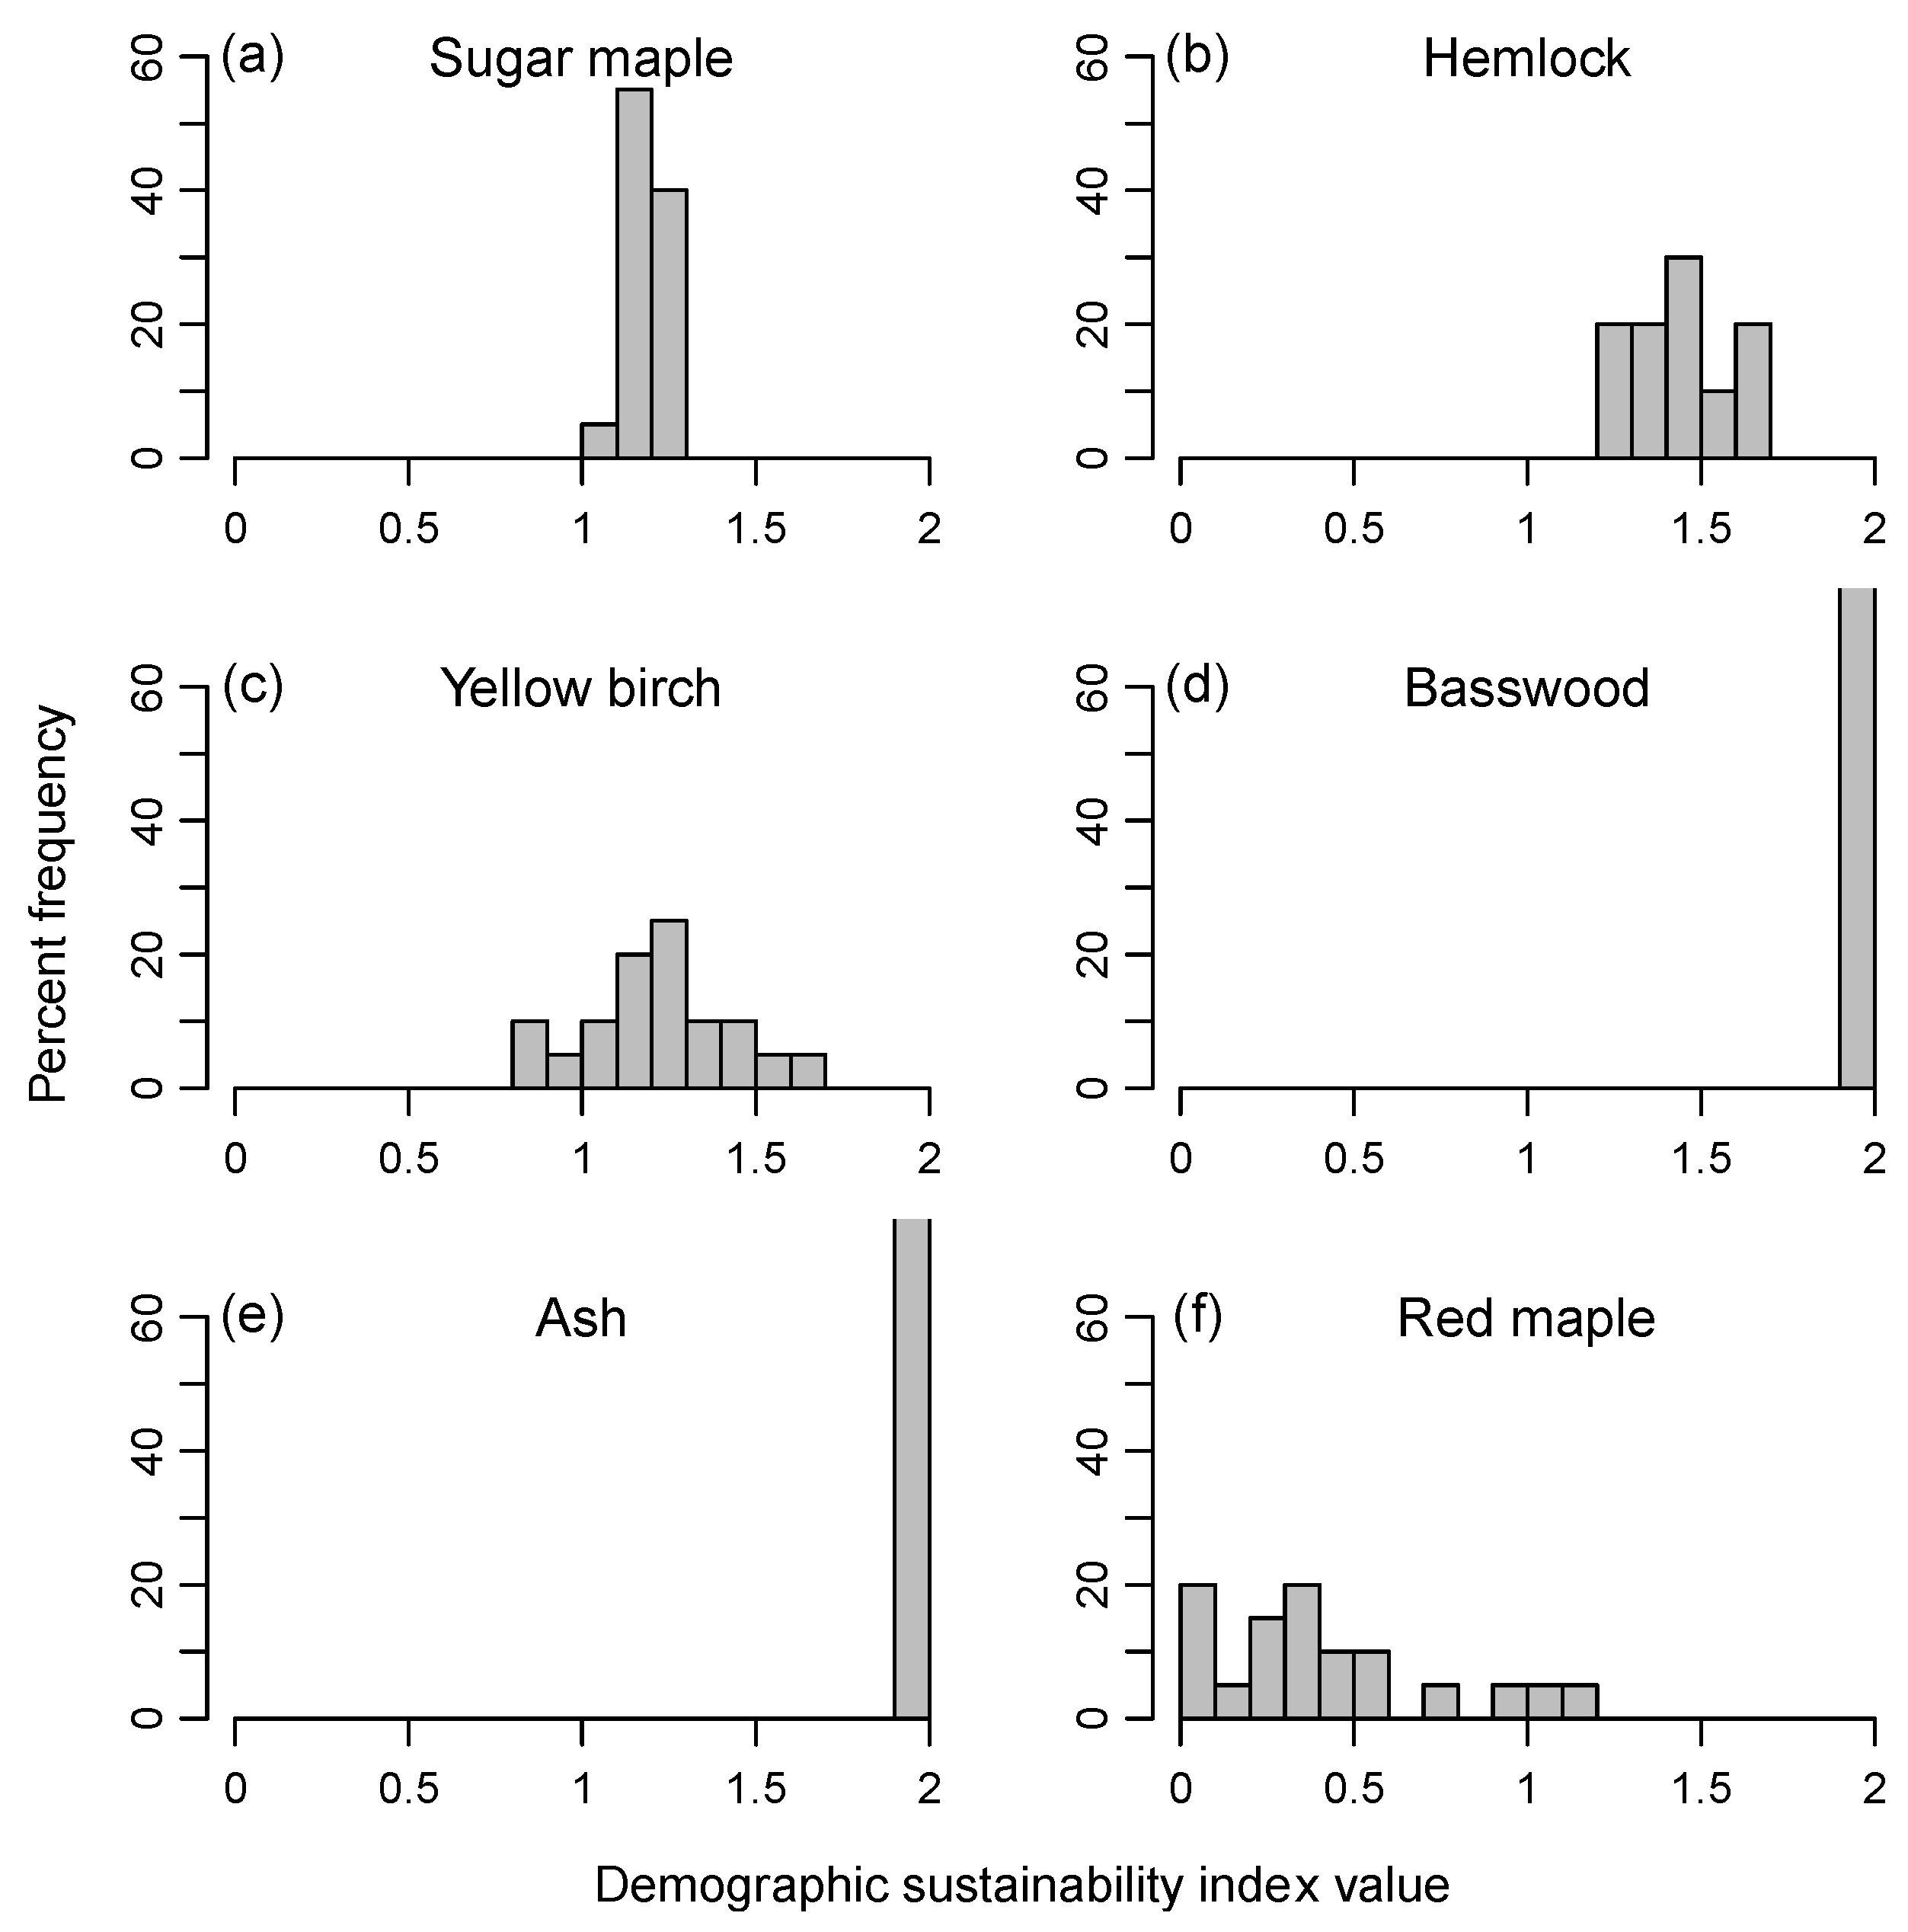
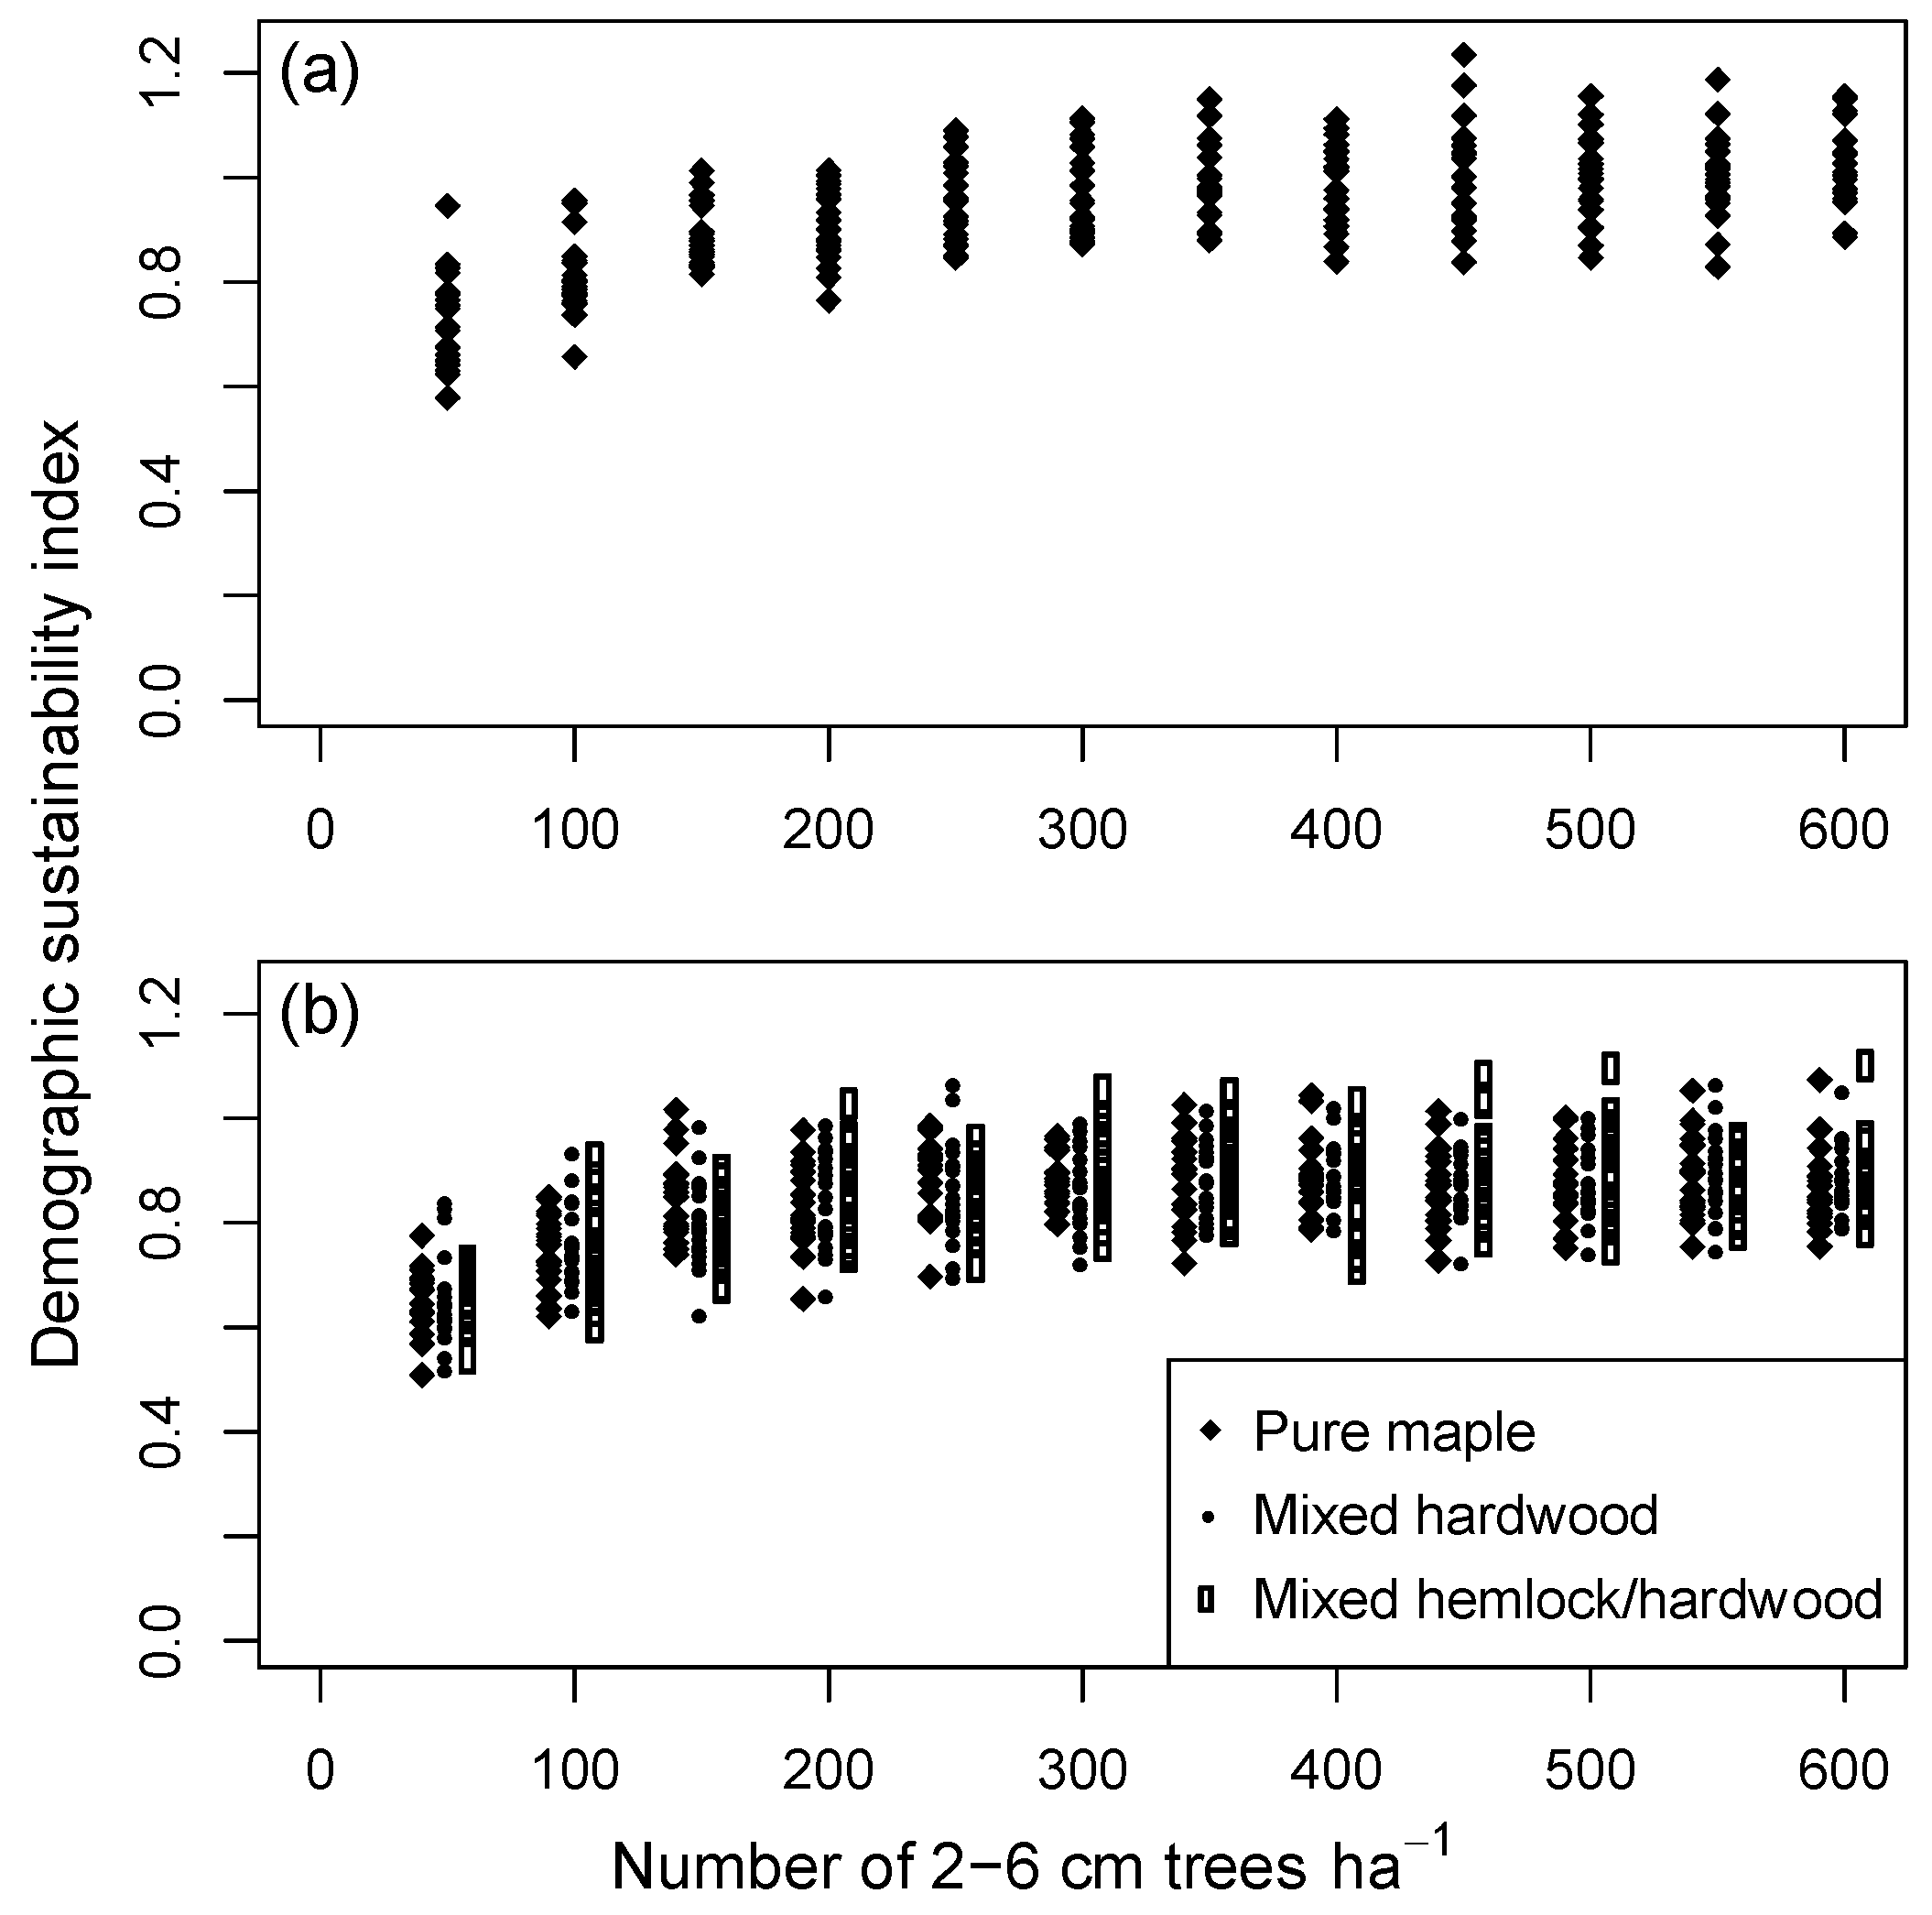
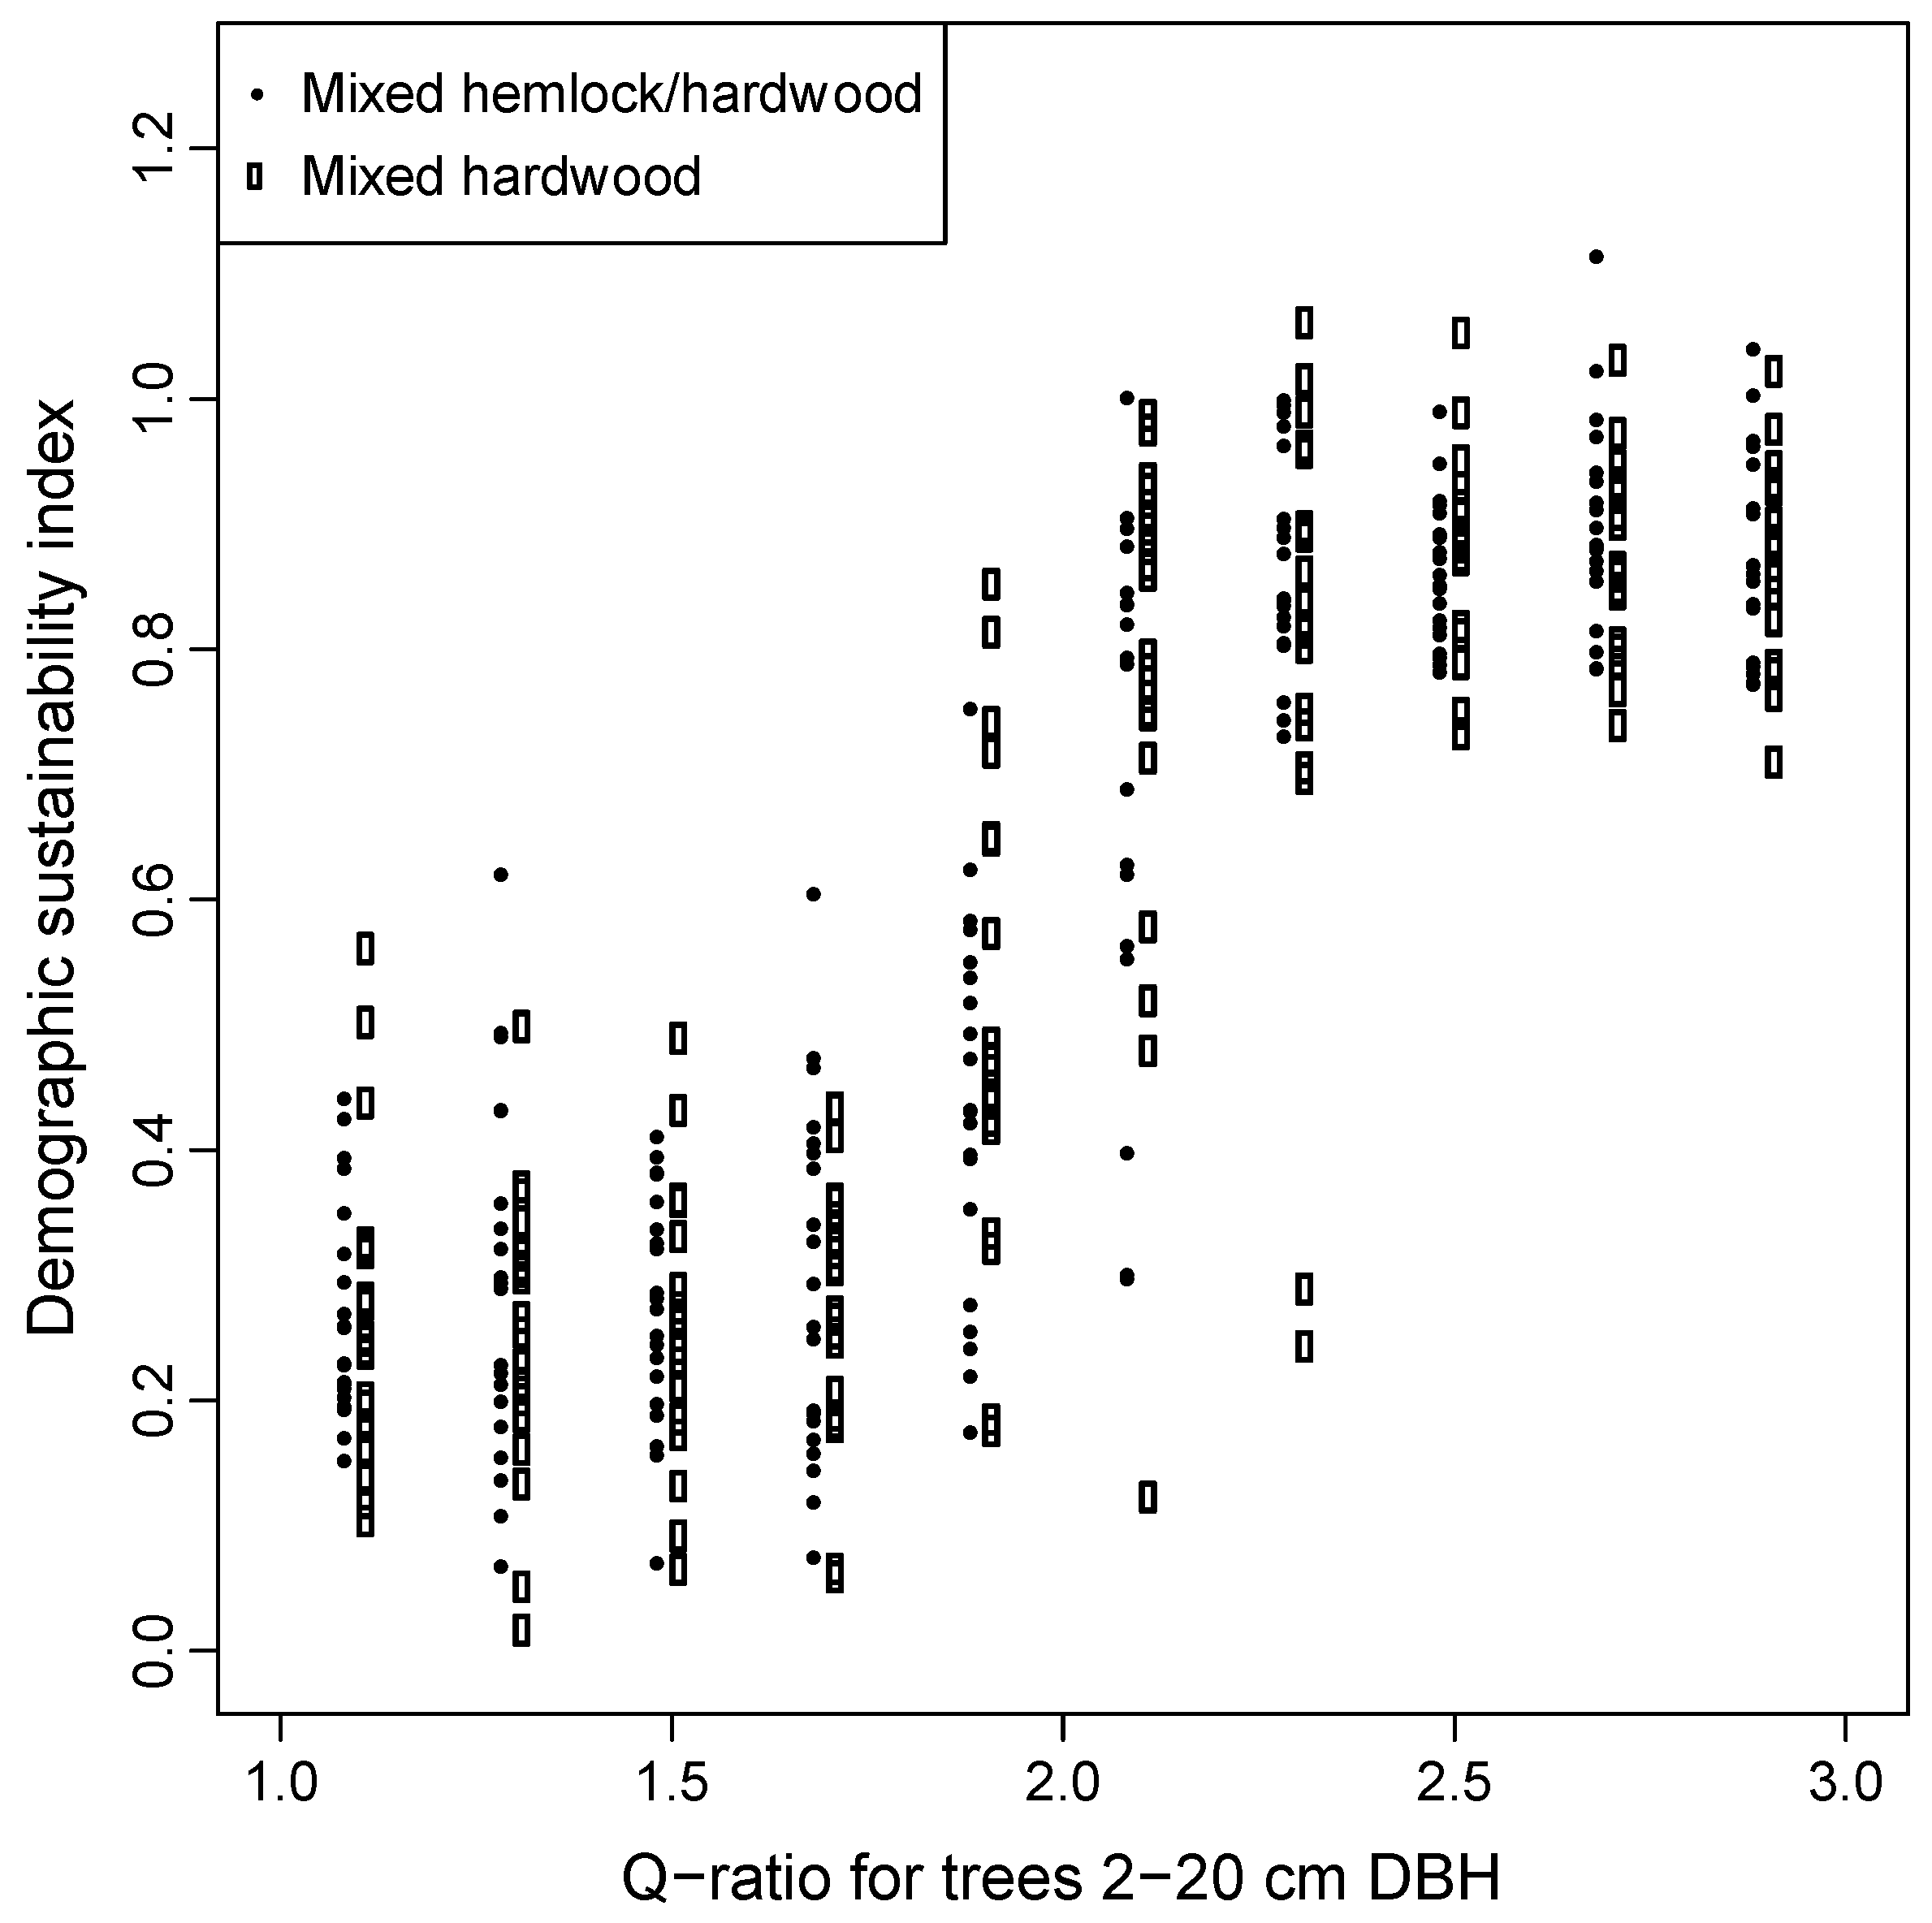
| Simulation number | Recruitment mode | Mortality | Species of recruits | Scale | Data set | Duration (years) |
|---|---|---|---|---|---|---|
| Group 1a | Fixed at initial | Background | Density dep. | Dual 1 | 70 indiv. plots | 500 |
| Group 1b | Density dep. | Background | Density dep. | Dual | 70 indiv. plots | 500 |
| Group 1c | Density dep. | Nat. Disturb. | Density dep. | Dual | 70 indiv. plots | 500 |
| Group 1d | Fixed at initial | Background | Fixed at initial | Landscape | 70 plots pooled 2 | 500 |
| Group 2a | Fixed, prespecified | Background | Sugar maple | Stand | 20 sim. AA plots 3 | 1000 |
| Group 2b | Capped, prespecified | Background | Sugar maple | Stand | 20 sim. AA plots | 1000 |
| Group 2c | Capped, prespecified | Background | Dens. dep, no Hem. | Stand | 20 sim. AA plots | 1000 |
| Group 2d | Capped, prespecified | Background | Density dep. | Stand | 20 sim. AA plots | 1000 |
| Group 3 | Constant q | Background | Density dep. | Stand | 20 sim. AA plots | 1000 |
| Group 4 | Variable q | Background | Density dep. | Stand | 20 sim. AA plots | 1000 |
1 ‘Dual’ refers to plots analyzed individually and pooled at the end of a simulation to represent a landscape. 2 Plots pooled as a unit prior to simulation year 1. 3 AA refers to all-aged, old-growth stands simulated for 1000 years under background mortality.
Table 2.
Summary of demographic sustainability index values from simulations of the 70 upper Michigan field plots, showing the effect of recruitment limitation and disturbance regime (Group 1 simulations). Ten replicates of each plot were simulated for 500 years.
| Simulation group | Percentage of plots by sustainability class | Pop. overall | |||||||
|---|---|---|---|---|---|---|---|---|---|
| <0.2 | <0.4 | <0.6 | <0.8 | <0.9 | 0.9+ | avg. plot 1 | pop. Overall 2 | where present | |
| All spp. pooled | |||||||||
| (1a) Const. 2–6 cm·T·ha−1, BM 3 | 0 | 8 | 23 | 48 | 58 | 42 | 0.82 | 0.83 | NA |
| (1b) Density dependent, BM 4 | 0 | 0 | 0 | 11 | 24 | 76 | 1.02 | 1.08 | NA |
| (1c) Density dependent, HD 5 | 0 | 2 | 16 | 49 | 66 | 34 | 0.82 | 0.85 | NA |
| Sugar maple | |||||||||
| (1a) Const. 2–6 cm·T·ha−1, BM | 1 | 4 | 11 | 24 | 32 | 68 | 1.35 | 1.06 | 1.06 |
| (1b) Density dependent, BM | 4 | 15 | 27 | 39 | 44 | 56 | 1.23 | 0.95 | 0.95 |
| (1c) Density dependent, HD | 1 | 6 | 15 | 27 | 35 | 65 | 1.38 | 1.06 | 1.06 |
| Hemlock | |||||||||
| (1a) Const. 2–6 cm·T·ha−1, BM | 15 | 27 | 40 | 50 | 55 | 45 | 1.31 | 0.72 | 0.71 |
| (1b) Density dependent, BM | 0 | 1 | 4 | 8 | 13 | 87 | 2.28 | 1.65 | 1.64 |
| (1c) Density dependent, HD | 10 | 23 | 38 | 51 | 56 | 44 | 1.16 | 0.82 | 0.81 |
| Yellow birch | |||||||||
| (1a) Const. 2–6 cm·T·ha−1, BM | 57 | 78 | 84 | 88 | 89 | 11 | NA 6 | 0.20 | 0.19 |
| (1b) Density dependent, BM | 48 | 70 | 81 | 86 | 87 | 13 | NA | 0.22 | 0.22 |
| (1c) Density dependent, HD | 59 | 79 | 86 | 89 | 90 | 10 | NA | 0.18 | 0.18 |
| Ash | |||||||||
| (1a) Const. 2–6 cm·T·ha−1, BM | 31 | 41 | 49 | 55 | 59 | 41 | NA | 2.27 | 0.78 |
| (1b) Density dependent, BM | 16 | 31 | 44 | 50 | 53 | 47 | NA | 2.57 | 0.81 |
| (1c) Density dependent, HD | 24 | 37 | 46 | 52 | 57 | 43 | NA | 2.49 | 0.80 |
| Basswood | |||||||||
| (1a) Const. 2–6 cm·T·ha−1, BM | 26 | 37 | 46 | 53 | 55 | 45 | NA | 0.78 | 0.58 |
| (1b) Density dependent, BM | 14 | 27 | 38 | 47 | 51 | 49 | NA | 0.90 | 0.68 |
| (1c) Density dependent, HD | 28 | 45 | 54 | 62 | 64 | 36 | NA | 0.57 | 0.42 |
| Red maple | |||||||||
| (1a) Const. 2–6 cm·T·ha−1, BM | 66 | 78 | 84 | 86 | 88 | 12 | NA | 0.28 | 0.19 |
| (1b) Density dependent, BM | 61 | 73 | 79 | 84 | 85 | 15 | NA | 0.29 | 0.19 |
| (1c) Density dependent, HD | 61 | 74 | 82 | 86 | 87 | 13 | NA | 0.28 | 0.21 |
Abbreviations: BM = background mortality only; HD = simulations under the historic natural disturbance regime. 1 Average demographic sustainability index on plots where the subject species was initially present. New colonizations of plots were omitted to avoid division by zero in computing the sustainability index. 2 Mean sustainability index of all 70 plots pooled (i.e., landscape scale), including plots that initially lacked the subject species. Initial basal areas of the 70 plots were pooled at the beginning of the simulations and final basal areas pooled at the end of the simulations. Higher indices for some gap-phase species in this column relative to those in the final column reflect new colonization of plots initially lacking the species. 3 Constant number of saplings maintained in the 2–6 cm class, but sapling species composition influenced by stand density. 4 Density and composition of new 2–6 cm saplings influenced by overstory density under background mortality. 5 Density and composition of new 2–6 cm saplings influenced by overstory density under the natural disturbance regime. 6 Average plot sustainability values could not be computed for minor species because of their relative rarity on the landscape.
Table 3.
Multiple regressions to predict sustainability index based on simulations of the upper Michigan field data.
| Background mortality | Historic dist. regime | |||||
|---|---|---|---|---|---|---|
| Variable | Const. recruitment 1 | Density-dep recruitment 2 | Density-dep recruitment 3 | |||
| Group 1a | Group 1b | Group 1c | ||||
| Estimate | p | Estimate | p | Estimate | p | |
| All species pooled | ||||||
| (Intercept) | 1.0150 | <0.001 | 0.7190 | <0.001 | 0.5753 | <0.001 |
| 2–6 cm·T·ha−1 | 0.0008 | <0.001 | −0.0002 | <0.001 | −0.0002 | 0.039 |
| Initial BA | −0.0266 | <0.001 | −0.0128 | <0.001 | −0.0165 | <0.001 |
| BA-weighted avg. q | 0.0320 | <0.001 | 0.0249 | 0.072 | ||
| Deviation from SS 4 | −0.0112 | <0.001 | −0.0022 | 0.012 | ||
| Modal DBH | −0.0020 | 0.452 | −0.0030 | <0.001 | −0.0020 | 0.023 |
| R2 | 0.77 | 0.63 | 0.47 | |||
| Sugar maple | ||||||
| (Intercept) | 1.0941 | <0.001 | −1.5188 | <0.001 | 1.2119 | <0.001 |
| 2–6 cm·T·ha−1 | 0.0012 | <0.001 | 0.0010 | <0.001 | 0.0009 | 0.003 |
| Initial BA | −0.0254 | <0.001 | −0.0057 | 0.053 | −0.0204 | <0.001 |
| Avg. q below mode 5 | 0.1478 | <0.001 | 1.4382 | <0.001 | 0.2942 | 0.008 |
| QMD | 0.0391 | <0.001 | 0.0274 | <0.001 | 0.0226 | <0.001 |
| 2–6 cm·SM·ha−1 | −0.0010 | <0.001 | −0.0013 | <0.001 | ||
| Initial SM BA | −0.0397 | <0.001 | −0.0470 | <0.001 | −0.0379 | <0.001 |
| Avg. q below mode for SM | 0.0031 | 0.104 | ||||
| QMD for SM | −0.0170 | <0.001 | −0.0104 | 0.002 | −0.0205 | <0.001 |
| R2 | 0.68 | 0.45 | 0.60 | |||
| Hemlock | ||||||
| (Intercept) | 2.9959 | <0.001 | 1.6742 | <0.001 | −0.2405 | 0.404 |
| 2–6 cm·T·ha−1 | −0.0012 | 0.002 | 0.0004 | 0.071 | 0.0007 | 0.049 |
| Initial BA | 0.0613 | <0.001 | −0.0041 | 0.159 | 0.0148 | 0.012 |
| Avg. q below mode | −0.2965 | 0.071 | −0.7328 | <0.001 | ||
| QMD | −0.1779 | <0.001 | 0.0128 | 0.065 | 0.0284 | 0.012 |
| 2–6 cm·Hem·ha−1 | 0.0056 | 0.003 | ||||
| Initial Hem BA | −0.0649 | <0.001 | −0.0307 | <0.001 | −0.0262 | <0.001 |
| Avg. q below mode for Hem | 0.0115 | 0.049 | −0.0400 | <0.001 | ||
| QMD for Hem | −0.0359 | <0.001 | ||||
| R2 | 0.57 | 0.29 | 0.29 | |||
| Yellow birch | ||||||
| (Intercept) | −0.0820 | 0.740 | 1.0638 | 0.010 | 2.0188 | 0.004 |
| 2–6 cm·T·ha−1 | −0.0011 | 0.004 | ||||
| Initial BA | 0.0501 | <0.001 | −0.0199 | <0.001 | 0.0409 | <0.001 |
| Avg. q below mode | −0.8325 | <0.001 | −1.9549 | <0.001 | ||
| QMD | −0.0682 | <0.001 | −0.0485 | <0.001 | ||
| 2–6 cm·YB·ha−1 | −0.0033 | 0.079 | 0.0042 | 0.026 | ||
| Initial YB BA | −0.0458 | 0.002 | −0.1621 | <0.001 | −0.0614 | <0.001 |
| Avg. q below mode for YB | −0.0473 | <0.001 | −0.0344 | <0.001 | ||
| QMD for YB | −0.0492 | <0.001 | 0.0130 | <0.001 | −0.0371 | <0.001 |
| R2 | 0.34 | 0.27 | 0.34 | |||
Abbreviations: BA = basal area; SS = stands meeting structural steady-state criteria; QMD = quadratic mean diameter; SM = sugar maple, Hem = eastern hemlock; YB = yellow birch. Equation: SI = b0 + b1X1 + b2X2 + … + bnXn. 1 Constant number of saplings maintained in the 2–6 cm diameter class, but species composition influenced by overstory density, under a regime of background mortality only (Group 1a simulations). 2 Composition and density of saplings both influenced by overstory density and composition, under a regime of background mortality only (Group 1b simulations). 3 Sapling recruitment as in footnote 2, but under the historic natural disturbance regime (Group 1c simulations). 4 Sum of squared errors between each stand replicate and the average diameter distribution of stands meeting criteria for steady state, computed for each 4 cm diameter class. 5 Average q-ratio below the mode of the basal area size distribution (sum of basal area in each DBH class).
Table 4.
Determination of minimum tree densities in the three smallest size classes needed to perpetuate the steady-state structure shown in panel 1. In Panels 2–4, the number of trees in the three smallest 5 cm diameter classes were iteratively adjusted to determine the number of trees necessary to sustain the next larger size class (final result in bold). Simulations were conducted for 500 years, with 20 replicates each, starting from steady-state stands on Acer-Tsuga-Dryopteris (ATD) habitat that developed after clearcut under background mortality only (Group 4 simulations). Numbers in parentheses show 95% confidence intervals.
| 1. Simulated SS stand | Steady-state field data | |||
| T·ha−1 | q | T·ha−1 | q | |
| 2–7 cm | 337 | 3.83 | 686 (290–1080) | 4.52 (1.65–7.39) |
| 7–12 cm | 88 | 1.74 | 153 (119–189) | 2.20 (1.84–2.56) |
| 12–17 cm | 51 | 1.05 | 71 (55–86) | 1.60 (1.29–1.91) |
| 17–22 cm | 49 | – | 45 (37–52) | – |
| 2. Number of 12–17 cm trees needed to maintain 49, 17–22 cm trees | ||||
| q | 12–17 cm·T·ha−1 | Predicted 17–22 cm·T·ha−1 | ||
| 1.05 | 51 | 30.1 | (24.9–35.3) | |
| 1.10 | 53 | 35.9 | (30.7–41.2) | |
| 1.15 | 56 | 48.5 | (41.9–55.0) | |
| 3. Number of 7–12 cm trees needed to maintain 56, 12–17 cm trees | ||||
| q | 7–12 cm·T·ha−1 | Predicted 12–17 cm·T·ha−1 | ||
| 1.60 | 90 | 34.5 | (30.3–38.7) | |
| 1.80 | 101 | 45.0 | (39.6–50.4) | |
| 1.90 | 106 | 56.3 | (49.3–62.9) | |
| 4. Number of 2–7 cm trees needed to maintain 106, 7–12 cm trees | ||||
| q | 2–7 cm·T·ha−1 | Predicted 7–12 cm·T·ha−1 | ||
| 3.50 | 370 | 72.3 | (65.5–79.2) | |
| 3.60 | 382 | 88.8 | (79.0–100.6) | |
| 3.70 | 392 | 98.5 | (88.5–108.6) | |
| 3.75 | 398 | 106.7 | (93.7–119.6) | |
© 2017 by the authors. Licensee MDPI, Basel, Switzerland. This article is an open access article distributed under the terms and conditions of the Creative Commons Attribution (CC BY) license ( http://creativecommons.org/licenses/by/4.0/).
Share and Cite
MDPI and ACS Style
Halpin, C.R.; Lorimer, C.G. A Demographic Approach to Evaluating Tree Population Sustainability. Forests 2017, 8, 46. https://doi.org/10.3390/f8020046
AMA Style
Halpin CR, Lorimer CG. A Demographic Approach to Evaluating Tree Population Sustainability. Forests. 2017; 8(2):46. https://doi.org/10.3390/f8020046
Chicago/Turabian StyleHalpin, Corey R., and Craig G. Lorimer. 2017. "A Demographic Approach to Evaluating Tree Population Sustainability" Forests 8, no. 2: 46. https://doi.org/10.3390/f8020046
Note that from the first issue of 2016, this journal uses article numbers instead of page numbers. See further details here.