Article

Elevated Atmospheric CO2 and Warming Stimulates Growth and Nitrogen Fixation in a Common Forest Floor Cyanobacterium under Axenic Conditions

Department of Biology, Western University, London, ON N6A 5B7, Canada
*
Author to whom correspondence should be addressed.
Forests 2017, 8(3), 73; https://doi.org/10.3390/f8030073
Submission received: 17 January 2017 / Revised: 2 March 2017 / Accepted: 3 March 2017 / Published: 8 March 2017
(This article belongs to the Special Issue Ecosystem Feedbacks and Nitrogen Fixation in Forests)

Abstract

:
The predominant input of available nitrogen (N) in boreal forest ecosystems originates from moss-associated cyanobacteria, which fix unavailable atmospheric N2, contribute to the soil N pool, and thereby support forest productivity. Alongside climate warming, increases in atmospheric CO2 concentrations are expected in Canada’s boreal region over the next century, yet little is known about the combined effects of these factors on N fixation by forest floor cyanobacteria. Here we assess changes in N fixation in a common forest floor, moss-associated cyanobacterium, Nostoc punctiforme Hariot, under elevated CO2 conditions over 30 days and warming combined with elevated CO2 over 90 days. We measured rates of growth and changes in the number of specialized N2 fixing heterocyst cells, as well as the overall N fixing activity of the cultures. Elevated CO2 stimulated growth and N fixation overall, but this result was influenced by the growth stage of the cyanobacteria, which in turn was influenced by our temperature treatments. Taken together, climate change factors of warming and elevated CO2 are expected to stimulate N2 fixation by moss-associated cyanobacteria in boreal forest systems.

1. Introduction

Nitrogen (N) fixation is a critical ecosystem-level process that brings unavailable atmospheric N into the biosphere [1]. This process is particularly important in N limited systems such as boreal forests, where N fixation on the forest floor by moss-associated cyanobacteria contributes up to 3 kg N/ha/year to forest-level N budgets [2,3,4,5], and may provide a mechanism for sustaining long-term forest productivity [6,7]. However, the response of moss-associated cyanobacteria and their N fixation activity to global environmental change (e.g., increased temperature, elevated CO2) remains poorly described [8]. While increased temperature has well-delineated effects on N fixation in terrestrial cyanobacteria, the influence of other global change factors is unknown, particularly in the case of elevated atmospheric CO2. Given that CO2 emissions are expected to double by the end of the current century with concomitant increases in temperature [9], determining the response of N fixation to elevated atmospheric CO2 and its interactive effects with other global change factors remains critical to our understanding of whole ecosystem dynamics. While interest in N fixation of forest systems, and moss-associated cyanobacteria specifically, is increasing, few studies focus on the constituent cyanobacteria themselves (however, see [10]), or have documented the interactive effects among global change factors (however, see [11]).
Many terrestrial cyanobacteria species produce specialized heterocyst cells to fix atmospheric nitrogen (N2) to ammonium (NH4+) using the nitrogenase enzyme [12,13]. Hence, changes in cyanobacterial growth, heterocyst density, or the activity of the nitrogenase enzyme, may serve as a mechanism(s) for increased or decreased N fixation under global change. Nitrogen fixation is regulated by temperature where the activity of the nitrogenase enzyme is constrained at low temperature [14], and maximal fixation rates are typically observed between 20 and 30 °C [11]. The only study examining the effects of elevated CO2 on moss-associated cyanobacteria found decreased N fixation rates [15], yet the cyanobacteria responsible for the process were not examined, thus the mechanism for this decrease is unknown. Several studies of isolated (axenic) cyanobacteria from marine environments show that elevated CO2 concentrations can increase [16,17,18] or decrease [19] N fixation through changes in growth rates and nitrogenase activity, however, CO2 in marine systems is confounded by changes in pH, so direct parallels to terrestrial systems cannot be made.
Previous studies have failed to tease apart how CO2 and temperature influence N fixation, and which mechanisms produce a given response in terrestrial cyanobacteria. Furthermore, studies of axenic cultures of terrestrial cyanobacteria are lacking, in general. Here, we examined the interactive effects of two major global change factors on N fixation by the forest floor, moss-associated cyanobacterium Nostoc punctiforme. We use the multicellular cyanobacterium N. punctiforme as a model species to explore the effects of global environmental change on N fixation as this cyanobacterium is terrestrial, heterocystous, and filamentous, and known to associate with mosses [10,20,21], yet can grow in axenic cultures in the lab. We perform two experiments that examine the initial response of N. punctiforme (growth, heterocyst production and activity, and N fixation) to elevated CO2 conditions during an active growth phase (30 days), and then test the interactive effects of elevated CO2 and temperature on established cultures of this forest floor cyanobacterium (90 days). By using a repeated measures approach, and full factorial design in our experiments, we quantify the effect of these global change factors on N fixation over time, including growth and culture development. Using direct measurement of cell densities, cell type ratios, and standardized N fixation rates in both experiments, we suggest a temperature-mediated growth cycle to explain the observed suite of responses.

2. Materials and Methods

Cyanobacteria cultures of moss-associated Nostoc punctiforme were obtained from the Canadian Phycological Culture Centre (Waterloo, Ontario, Canada) (CPCC strain #41 N. punctiforme (Kutz.) Hariot) and maintained in liquid BG-11 media for three months at 18 °C under a 12 h dark:12 h light photoperiod until commencement of the experiments. Cultures from the CPCC are kept frozen until purchased, and therefore have undergone minimal growth and transformations. Liquid media was changed weekly to ensure that N and other nutrients were not depleted, and to grow and maintain a cell density of 4.92 × 10⁵ cells/mL. Microscopic analysis revealed that heterocyst cells were infrequent and made up less than 0.1% of all cells in the inoculum culture. Experiments described below were run on solid noble agar made from N-free media (BG-110) to stimulate heterocyst formation and N fixation activity. Experimental units were 25 mL solid agar in 50 mL falcon tubes covered in cheesecloth to allow air exchange and light penetration. Inoculation densities for both experiments were 30 μL of the inoculum culture; all culture samples were replicated six times for each treatment combination.

2.1. Experiment 1: Culture Growth and N Fixation under Elevated CO2

Growth of cell cultures was assessed using two complementary methods. First, digital image analysis of surface cell spread was used to estimate cyanobacterial cover across the agar surface over 30 days while cultures were incubated under ambient (430 ppm) or elevated (750 ppm) atmospheric CO2 conditions. Ambient CO2 conditions reflect the average atmospheric CO2 levels for the city of London, Ontario, as measured directly during our experiment, while elevated CO2 concentrations were targeted at approximately 2× ambient conditions as predicted to occur in the next 100 years [9]. Growing conditions were in state-of-the-art environmentally controlled greenhouses held with ambient light and photoperiod at 22 °C. Images of the culture surface were captured using an Olympus PEN mini digital camera under auto-focus mode and tripod set-up at approximately 7 cm above the culture. All images were calibrated to the known diameter of the vials (27 mm) to ensure that pixel quantity across images did not alter calculations. Colour images were converted to an 8-bit black and white format, and any pixel noise outside of the agar surface was erased from the image before analysis. Percent cover of cyanobacterial cells was assed using the particle analysis function in ImageJ® with a minimum particle size of five pixels. Cyanobacterial cover was assessed every two days starting at 0 d for each vial using the image analysis protocol. The initial surface area of the agar was 572.56 mm2, and adjustments were made for the semi-destructive core sampling described next.
Cell densities of both vegetative and heterocyst cells were monitored during the experiment through direct cell counts on the agar using micro-core sampling. Micro-core samples (2 mm diameter × 3 mm deep) of agar were collected 5 mm from the centre of each vial, transferred to a 1.5 mL Eppendorf tube containing 0.5 mL distilled water, and dissolved via vortex mixing. Cell counts (vegetative and heterocyst) were enumerated using haemocytometry with cell counts performed under epifluorescence microscopy with a Texas red filter. Cell densities were calculated as the average of two 10 μL aliquots for each sample.
The acetylene reduction assay (ARA) [22] was used to measure N2 fixation rates assuming a rate of three moles C2H4 produced per mole of N2 fixed [23,24]. Vials were capped and 10% of the headspace (2.5 mL) of each vial was replaced with acetylene gas. Vial were incubated for 24 h, prior to 1 mL headspace gas being analysed for ethylene gas (C2H4) using a Shimadzu 2014 gas chromatograph with a flame ionization detector (FID) (250 °C), a Poropak T80/100 packed column (200 °C), and injector (200 °C) with helium (He) used as a carrier gas. The gas chromatograph was calibrated for each sample time using a three-point calibration curve of known quantities of ethylene gas (C2H4). All N fixation measurements were corrected using the average of two blanks containing BG-110 agar without acetylene, and two controls containing both BG-110 agar and acetylene (but no cyanobacteria). Nitrogen fixation measurements are presented as C2H4 produced per vial (μmol C2H4 vial−1). Nitrogen fixation is also presented on a per heterocyst basis as “heterocyst activity” (μmol C2H4 heterocyst−1), and on a surface area basis as “cyanobacterial activity” (μmol C2H4 percent cover−1). Nitrogen fixation (ARA) and cell counts (haemocytometry) were made on day 0, 3, and 5, and subsequently every 5 days until day 30.

2.2. Experiment 2: N Fixation under Elevated Warming and Atmospheric CO2

The effect of increases in temperature and atmospheric CO2 on N fixation was assessed over 90 days using a similar experimental culture system to the one described above. Culture samples were placed under three temperature treatments (11.5, 15.5, and 19.5 °C), and two atmospheric CO2 treatments (430, 750 ppm) in a full-factorial design. Vials were capped with cheesecloth mesh for air exchange, and established for 30 days for growth of the cyanobacterial cultures. Nitrogen fixation was measured every 10 days from day 30 to day 90 using the acetylene reduction assay (ARA) as described above.
At the end of the experiment, all vials were destructively sampled, and densities of heterocyst and vegetative cells were obtained for each vial using micro-core sampling of cyanobacteria from the centre of each vial as described above. Cyanobacteria were suspended in 0.5 mL of distilled water by vortexing and two 10 μL aliquots of cell suspension were assessed for both heterocyst and vegetative cell densities using haemocytometry and epifluorescence microscopy with a Texas red filter at 40× magnification. Cell density measurements were used to provide estimates of biomass and heterocyst-to-vegetative cell ratios, and to standardize N fixation rates at day 90.

2.3. Statistical Analysis

For both experiments, a repeated measures analysis of variance (RM-ANOVA) was used for variables that were measured over 30 (percent cover, cell density, N fixation) and 90 (N fixation) days. At the end of the 90 day experiment, data for vegetative and heterocyst cell densities were analysed using a multivariate analysis of variance (MANOVA). Prior to analysis, parametric assumptions including normality, linearity, and homogeneity of variance were verified. Tukey HSD post-hoc tests were used where results showed a significant treatment effect. All statistical analysis was performed with α = 0.05 using the statistical program R [25].

3. Results

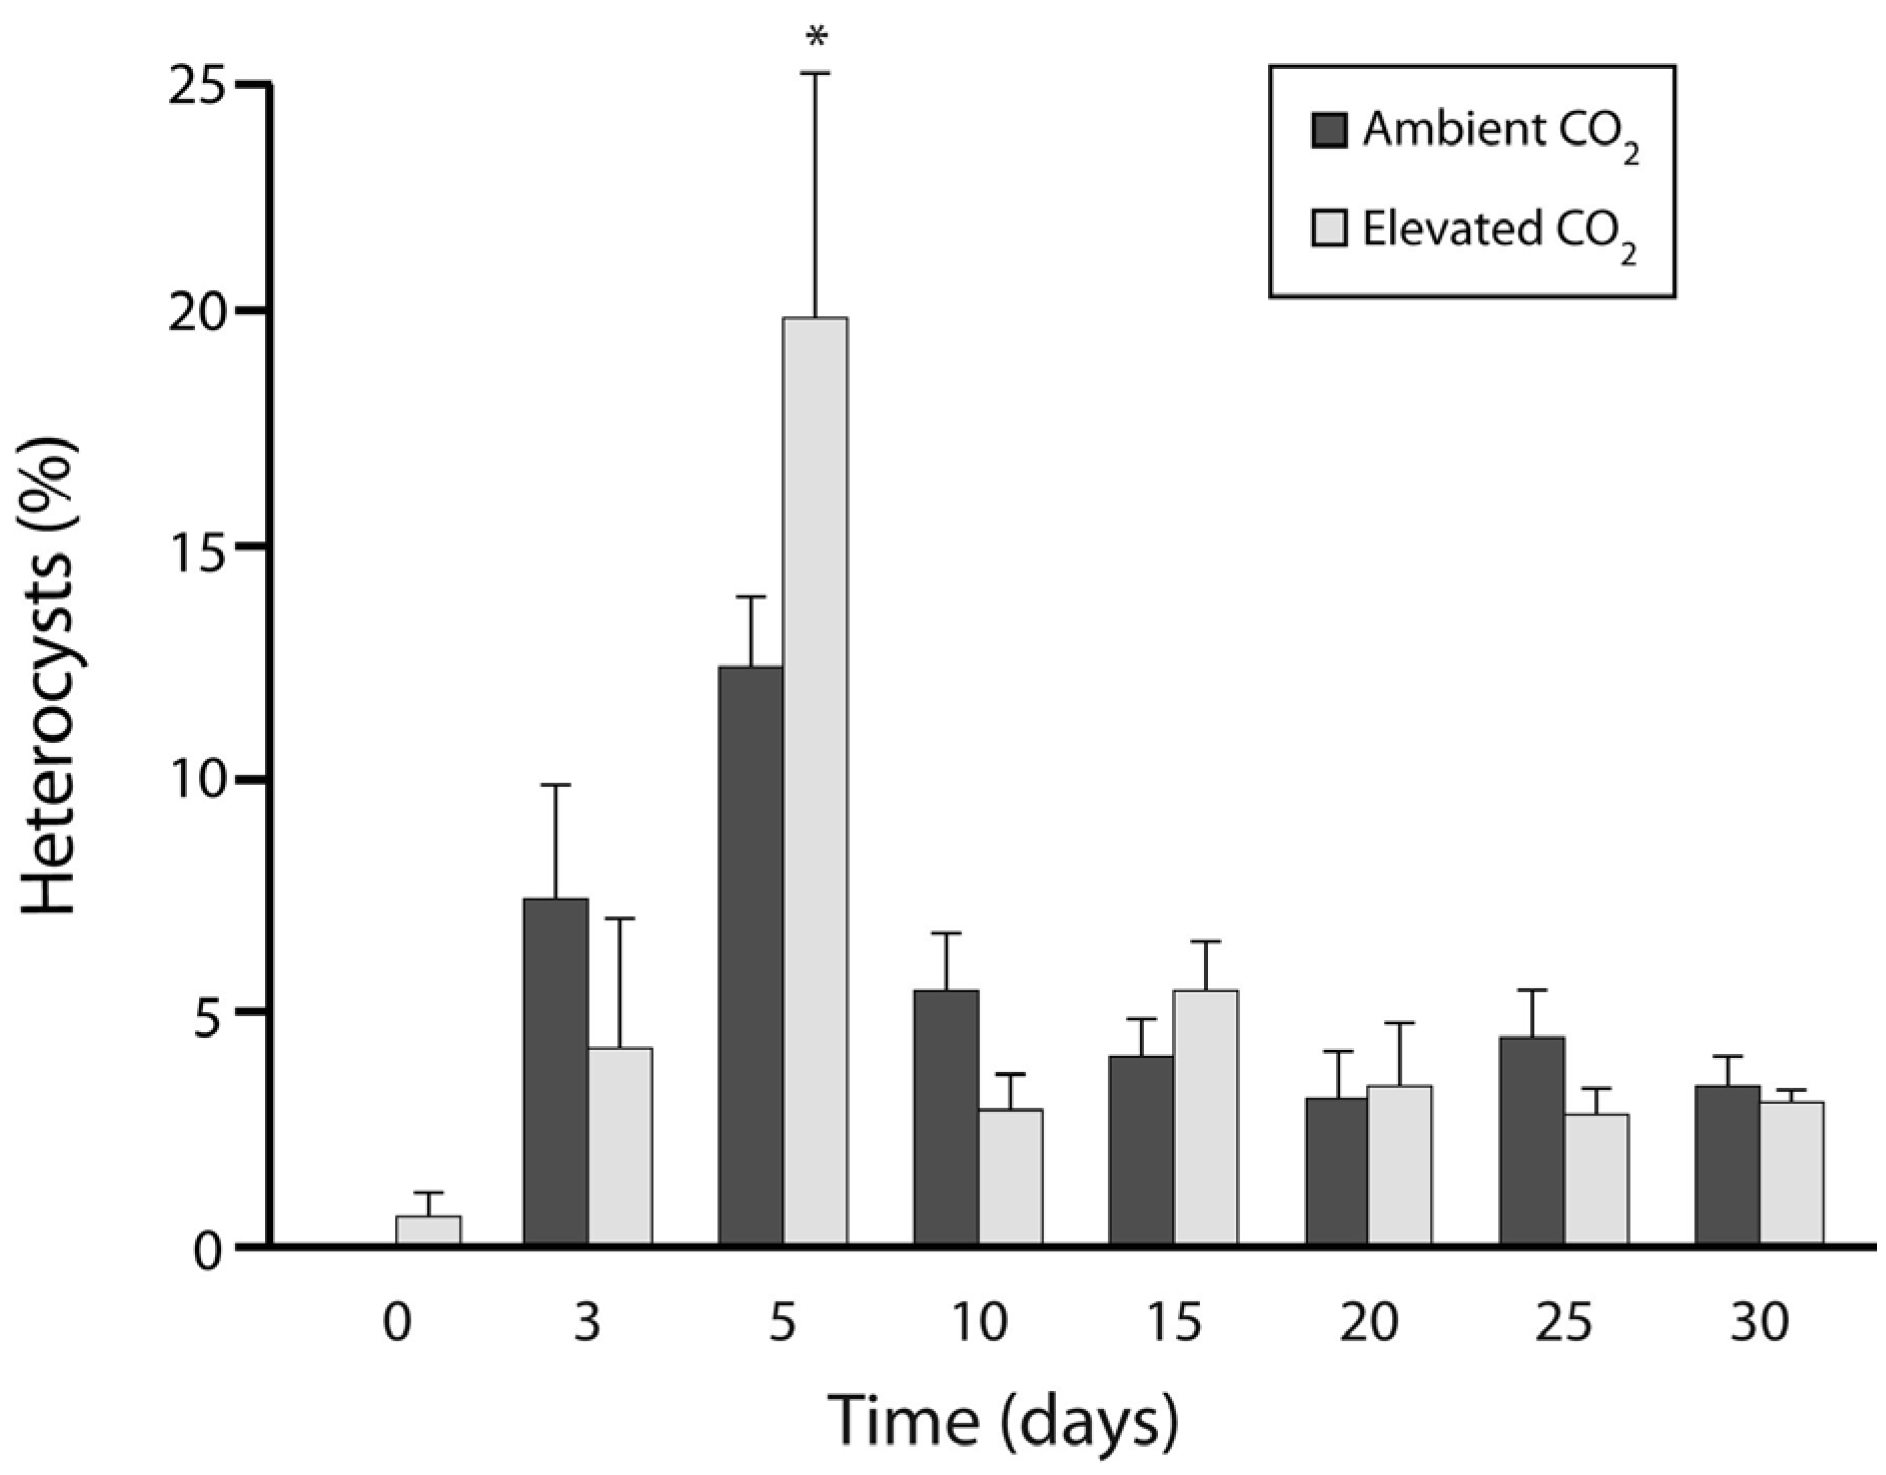
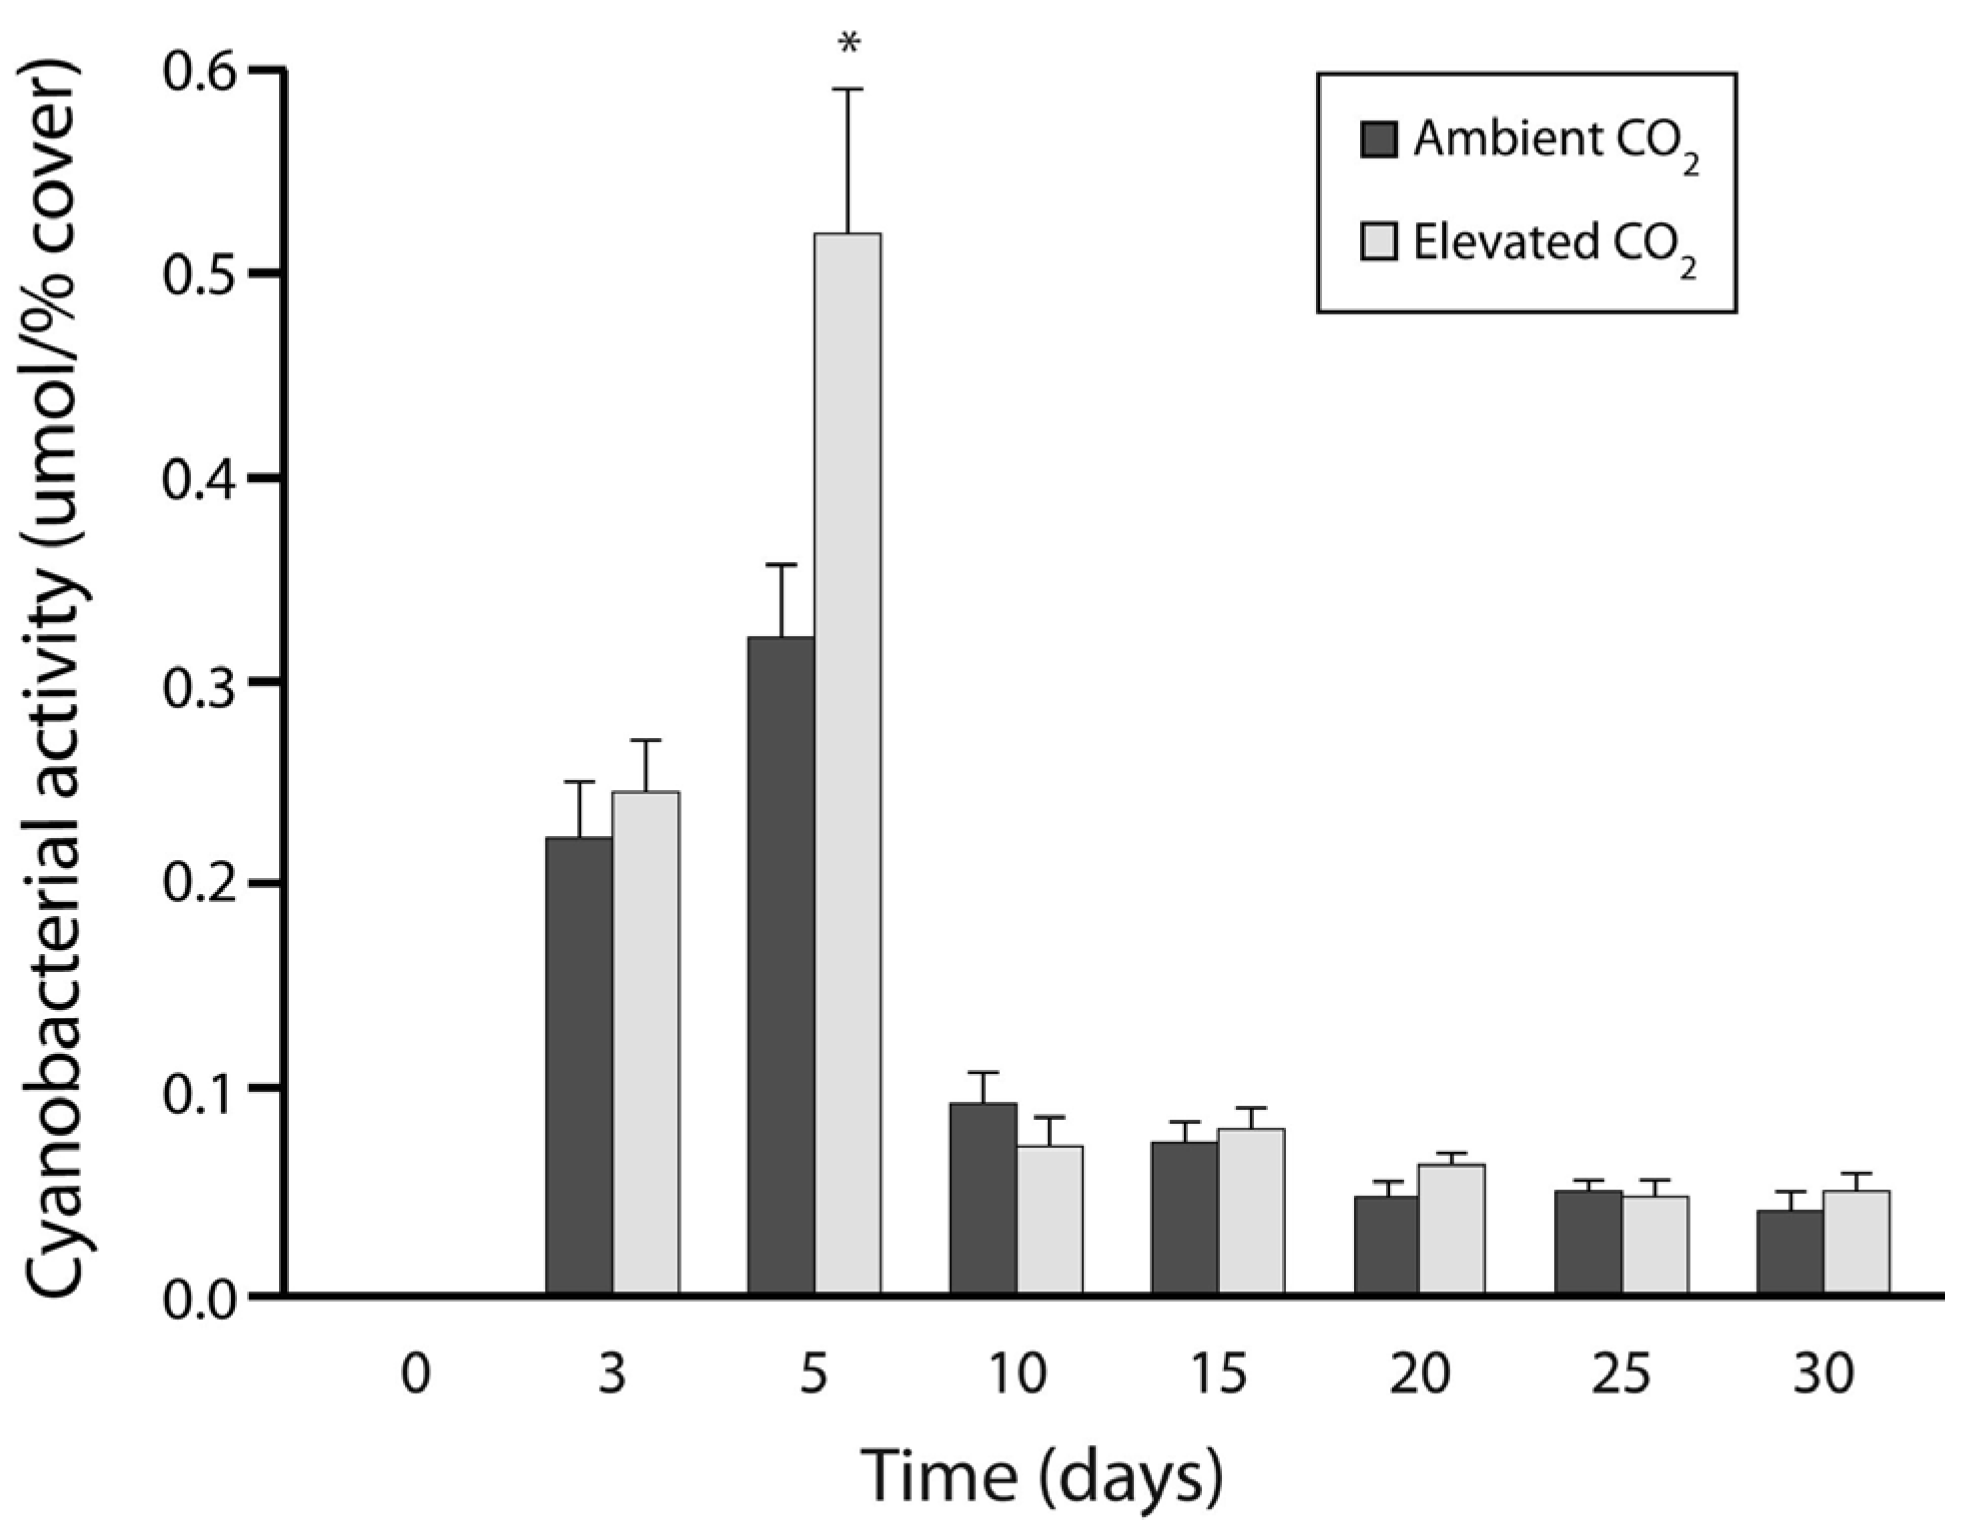
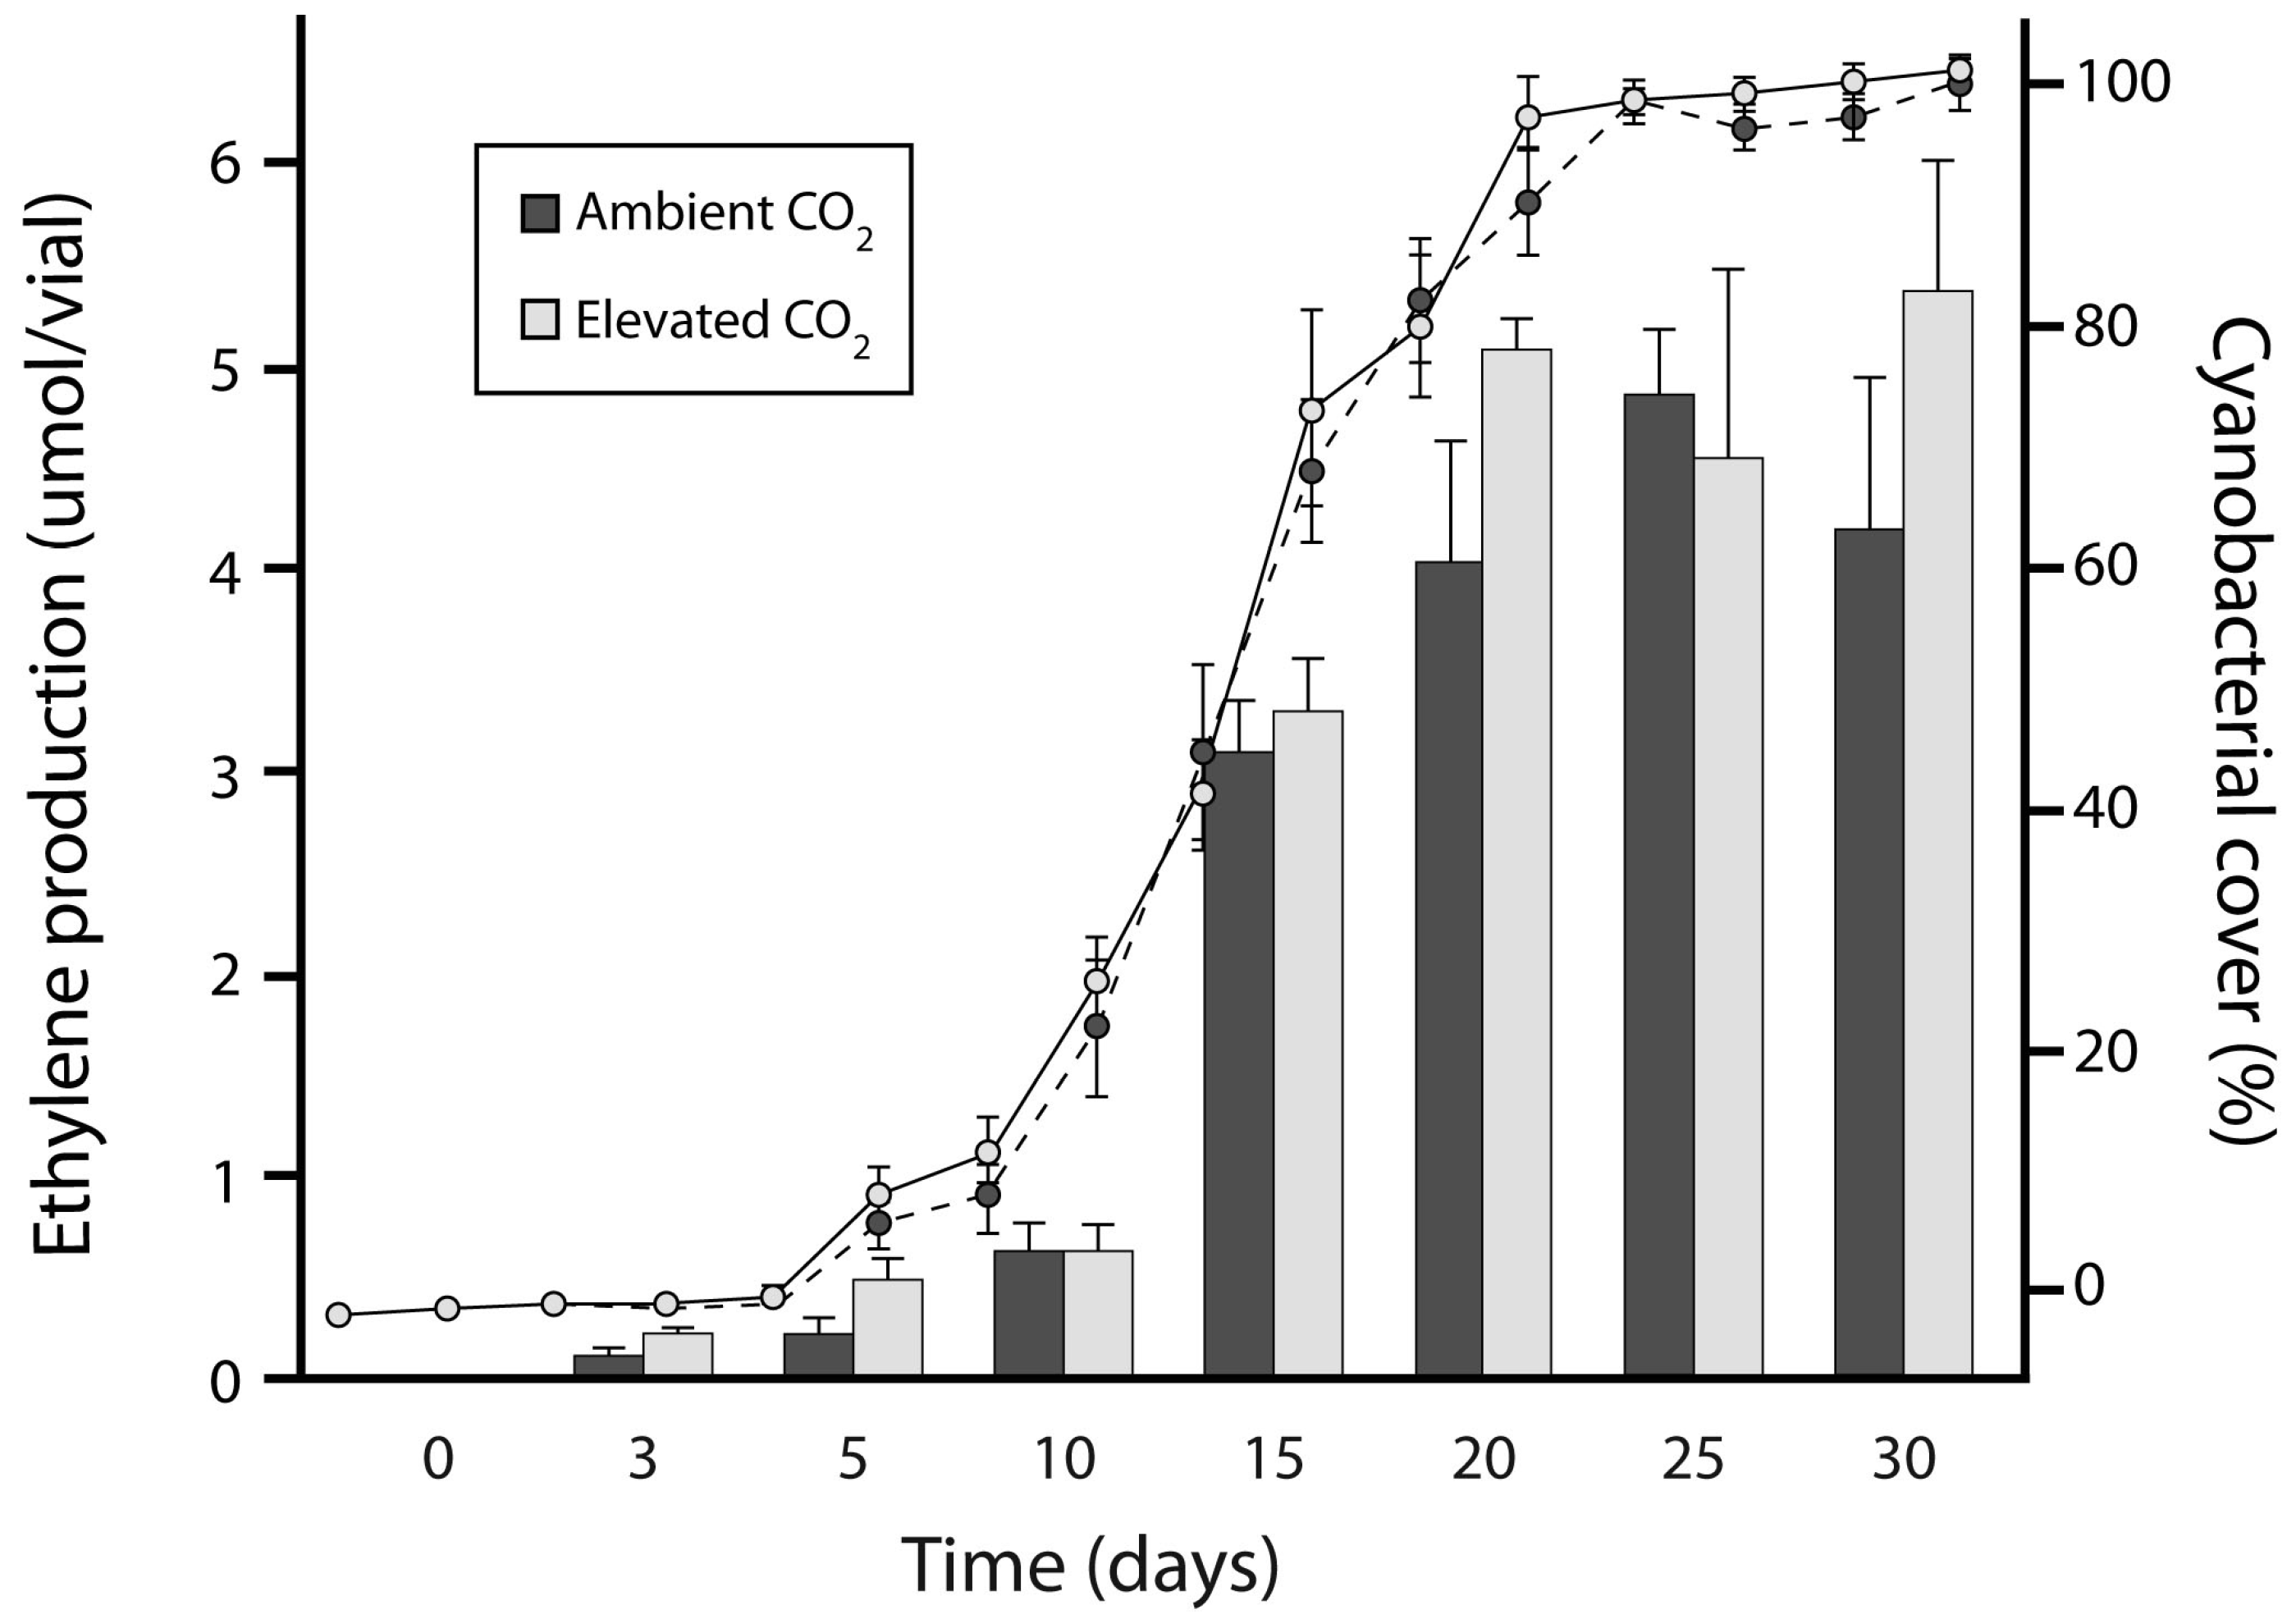
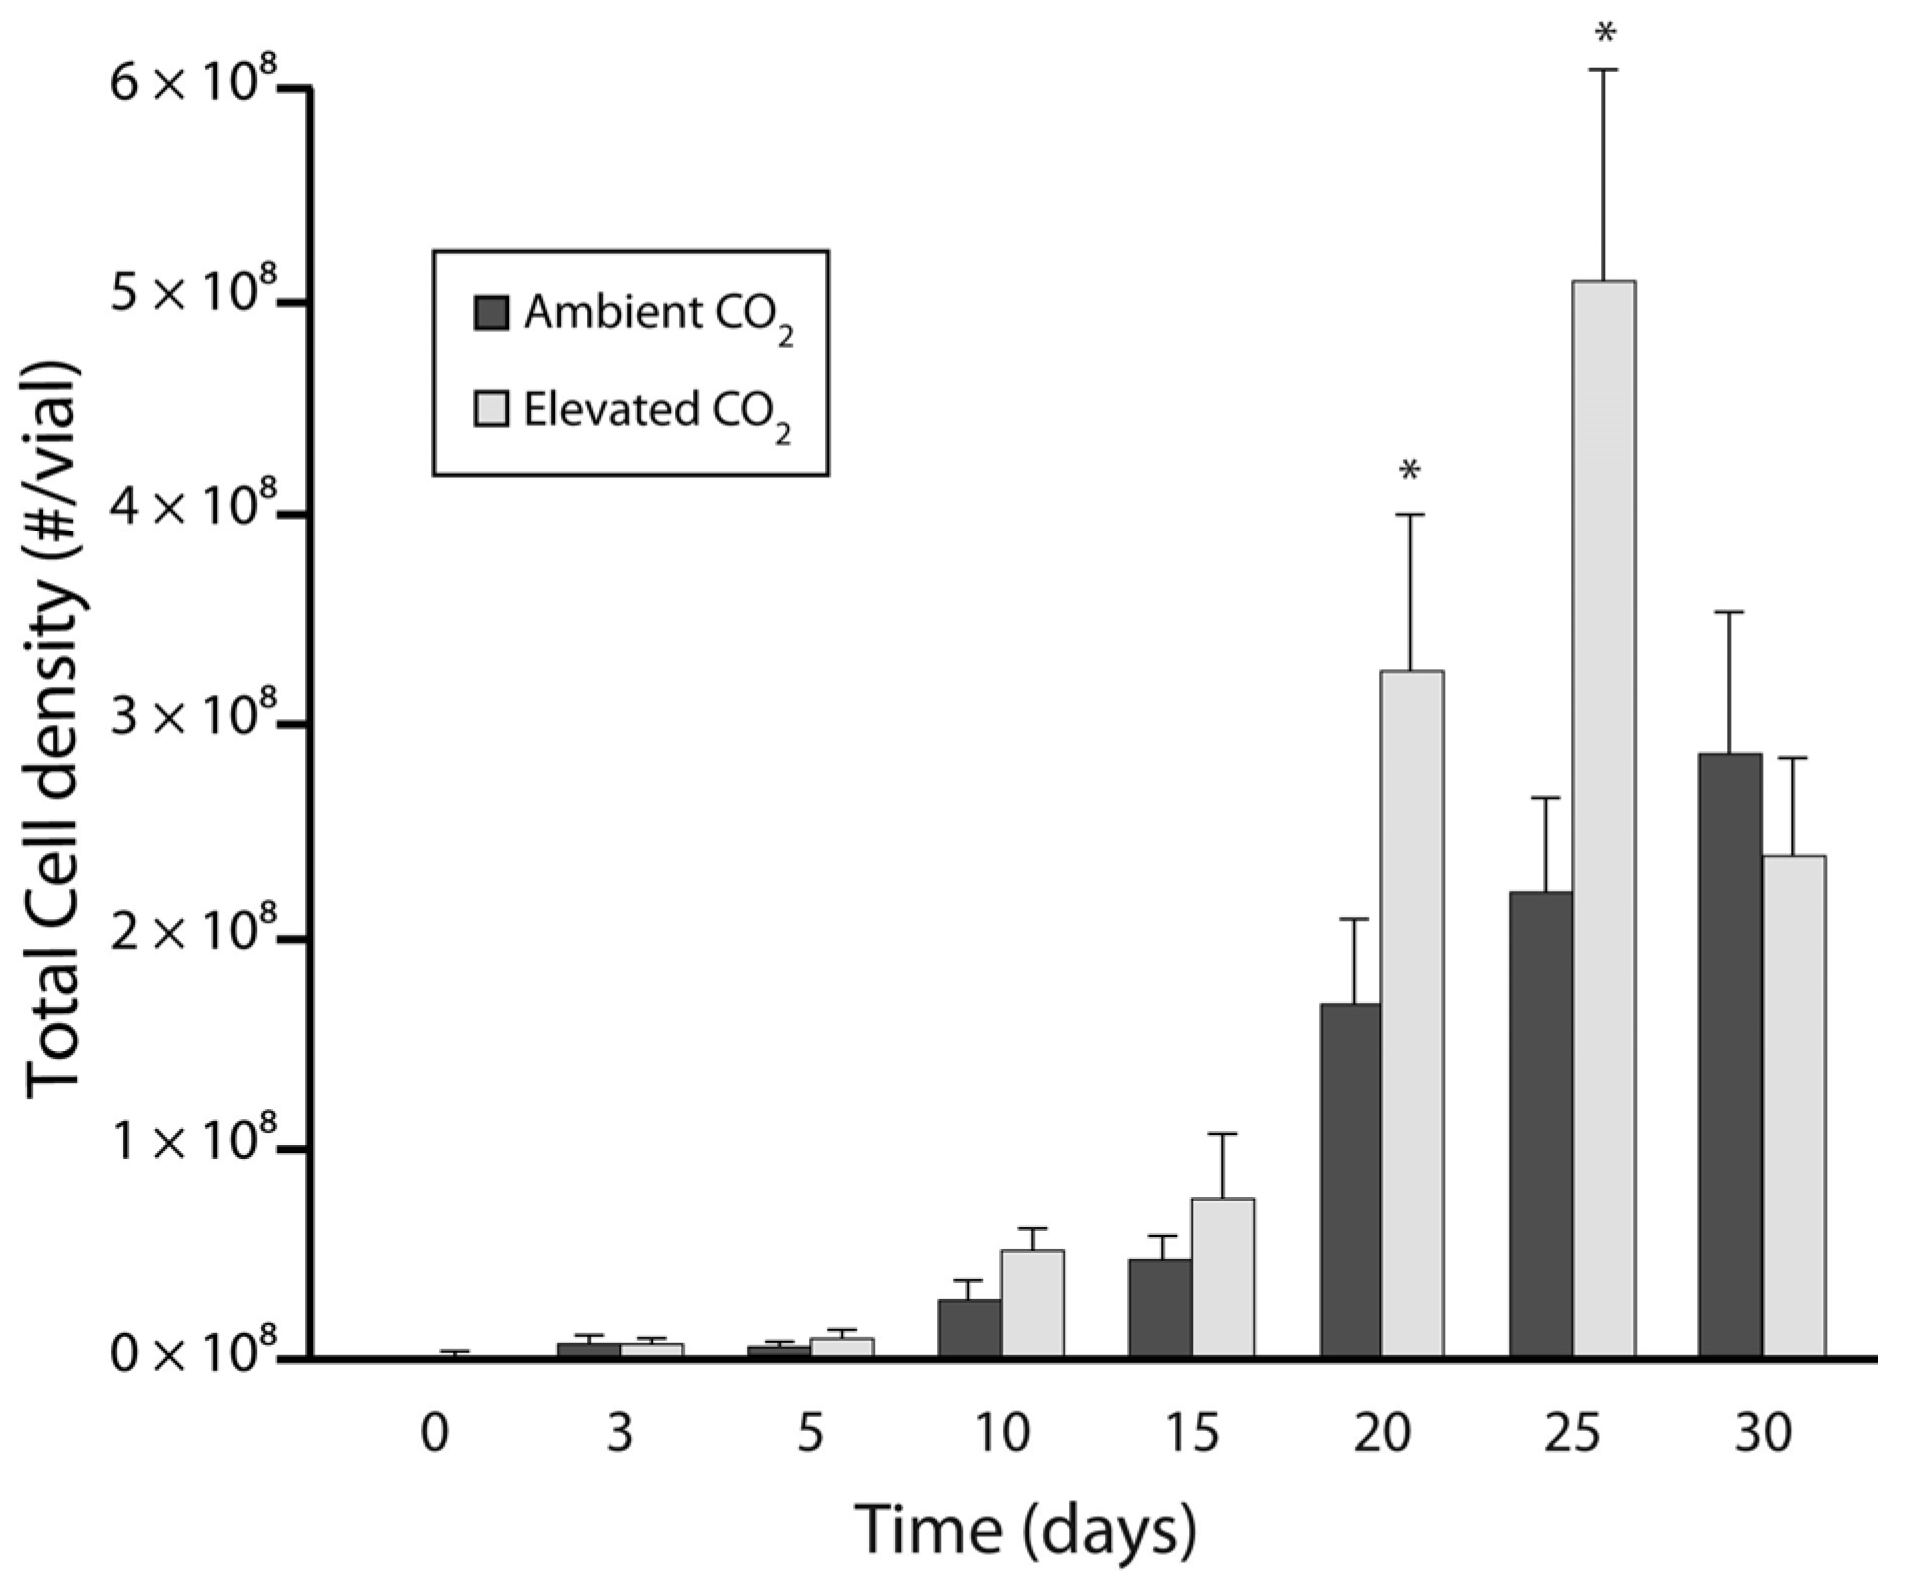
3.1. Experiment 1: Culture Growth and N Fixation under Elevated CO2

Nostoc punctiforme spread to cover the entire agar surface under both ambient CO2 and elevated CO2 by the end of the 30 day experiment with no detectable difference in average cyanobacterial cover (F1,10 = 0.71, p = 0.419; Figure 1). Growth of cyanobacterial cultures over the 30 day period followed a typical bacterial growth curve, with lag, exponential, and stationary phases present leading to a significant sampling time effect (F15,150 = 478.13, p < 0.001), with both ambient and elevated CO2 treatments having the greatest rate of growth between 10 and 20 days. There was no significant interaction between the CO2 treatment × time detected (F15,150 = 0.41, p = 0.974), indicating that the CO2 effect on cyanobacterial cover was consistent across all time points during the growth experiment.
Nitrogen fixation, as measured by ethylene production, did not differ between ambient CO2 and elevated CO2 treatments (F1,10 = 2.04, p = 0.184), although N fixation increased throughout time (F7,70 = 64.74, p < 0.001). No significant interaction effect of CO2 × time was detected (F7,70 = 0.93, p = 0.487). At all sampling times between 0 and 10 d, average N fixation rates were consistently low (below 0.64 μmol·vial−1), with an increase between day 10 and day 20 (Figure 1). Nitrogen fixation and cyanobacterial cover were strongly and positively correlated at all time points, with R values ranging between 0.58 and 0.85 (Pearson’s Correlation: p ≤ 0.05 for all data).
Cyanobacterial abundance measured as the total number of cyanobacteria cells per vial, differed between ambient CO2 and elevated CO2 (F1,10 = 5.44, p = 0.042), such that elevated CO2 had an overall positive effect on cyanobacterial abundance (Figure 2). Cell densities generally increased over time for both CO2 treatments (F7,70 = 25.89, p < 0.001), with maximum cell densities observed under ambient CO2 at 30 days, and under elevated CO2 at 25 days. A significant interaction between CO2 × time (F7,70 = 3.91, p = 0.001) was observed on cyanobacterial abundance, driven by the pairwise differences between ambient and elevated CO2 at days 20 and 25. Vegetative cells followed the same trend as total cells, and ranged between 82% and 100% of the cells in each vial under ambient CO2, and 53% and 100% of the cells in each vial under elevated CO2.
The average number of heterocyst cells were not statistically different under ambient CO2 (3.63 × 10⁶ cells per vial) and elevated CO2 (4.36 × 10⁶ cells per vial), nor were the percent of heterocyst cells in culture (F1,10 = 0.06, p = 0.814; Figure 3). However, heterocyst percent varied among time periods (F7,70 = 13.17, p < 0.001), with the maximum percentage of heterocyst cells at day 5 for both ambient and elevated CO2 treatments occurring at 12% and 20%, respectively. After a steady increase between days 0 and 5, heterocyst percentage decreased to 3% under both ambient and elevated CO2 for the duration of the experiment, however, no statistically significant effect of CO2 × time was observed (F7,70 = 1.62, p = 0.145).
Cyanobacterial activity (N fixation divided by percent cover) was greater under elevated CO2 relative to ambient CO2 conditions (F1,10 = 6.09, p = 0.034), driven by differences in the maximum cyanobacterial activity that occurred on day 5 (Time: F7,70 = 70.42, p < 0.001; CO2 × Time: F7,70 = 4.38, p < 0.001; Figure 4). Cyanobacteria were not active at day 0, and cyanobacterial activity was observed to sharply decline beyond day 5. Heterocyst activity (N fixation per heterocyst cell) was not statistically different between ambient CO2 and elevated CO2 (F1,10 = 0.05, p = 0.841), reaching a peak maximum at day 15 for both ambient CO2 and elevated CO2 treatments (F7,70 = 11.19, p < 0.001); there was no CO2 × time effect observed (F7,70 = 0.91, p = 0.470).

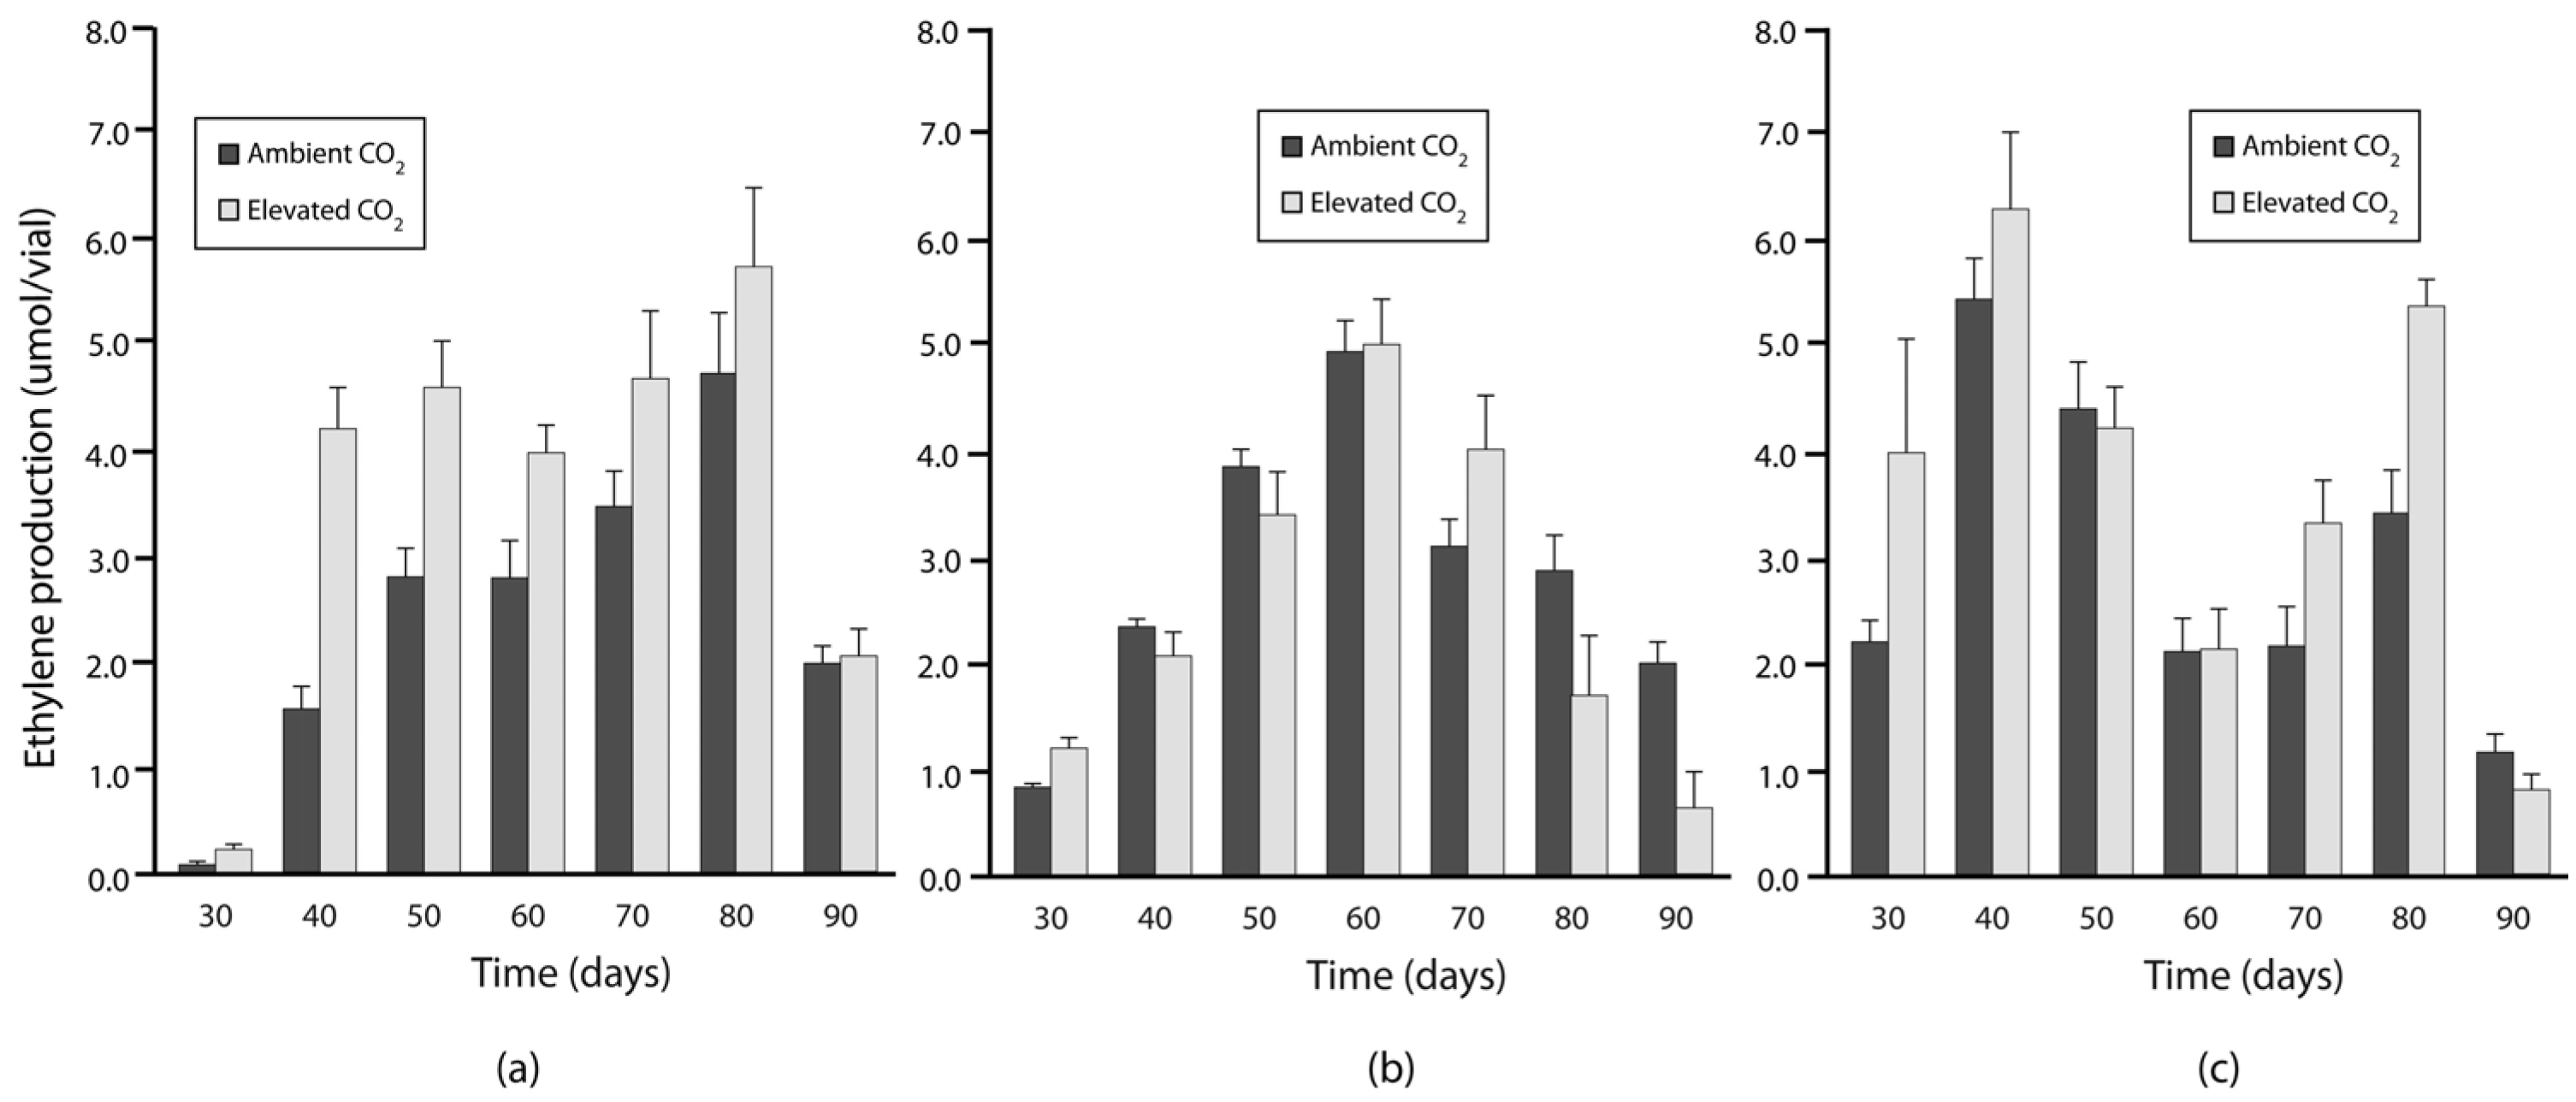
3.2. Experiment 2: N Fixation under Elevated Warming and Atmospheric CO2

Over 90 days of growth under three temperature and two atmospheric CO2 levels, elevated CO2 had a strong positive effect on N fixation rates (Table 1), influenced by both sampling date and temperature (Figure 5). Temperature also influenced N fixation, with overall higher N2 fixation rates observed for 11.5 °C and 19.5 °C than 15.5 °C. A statistically significant CO2 × temperature effect demonstrated a strong positive CO2 effect at 11.5 °C (2.52 μmol·vial−1 versus 3.71 μmol·vial−1), but no CO2 effect at 15.5 °C, and a moderate positive CO2 effect at 19.5 °C. While the CO2 × time interaction was not significant (Table 1), elevated CO2 had an initial positive effect on N fixation that declined over the course of the experiment (Figure 5). Time had a significant effect on N fixation rates, and N fixation rates were significantly affected by temperature × time. Nitrogen fixation peaked at day 80 for 11.5 °C, day 60 for 15.5 °C, and at days 40 and 80 for 19.5 °C. A statistically significant effect three-way interaction of CO2 × temperature × time was detected (Table 1).
There was no significant effect of either temperature or CO2 on cyanobacterial abundance at the end of 90 days (CO2: F1,30 = 0.08, p = 0.790; temperature: F2,30 = 0.88, p = 0.426; CO2 × temperature: F2,30 = 1.08, p = 0.354), or heterocyst percent (CO2: F1,30 = 1.22, p = 0.277; temperature: F2,30 = 0.36, p = 0.698). Heterocyst activity (N fixation per heterocyst cell) was not significantly different between CO2 treatments (F1,30 = 0.59, p = 0.450), or temperature treatments (F2,30 = 1.09, p = 0.349), although heterocyst activity was qualitatively lower at 15.5 °C (1.75 × 10⁻⁷ μmol C2H4 heterocyst−1) compared to 11.5 °C (3.74 × 10⁻⁷ μmol C2H4 heterocyst−1) and 19.5 °C (3.14 × 10⁻⁷ μmol C2H4 heterocyst−1).

4. Discussion

Overall rates of N fixation were highly correlated with the growth of the moss-associated cyanobacteria Nostoc punctiforme cultures under N limited conditions. During this growth phase heterocyst production and N fixation was observed in as little as three days following incubation on N limited agar surfaces, even though cell densities and percent of agar surface cover remained low (Figure 6). Although it is expected that vegetative cells are photosynthetic and supply heterocyst cells with energy and resources for N fixation [13,17,21], vegetative cells are also nutrient depleting, requiring N for growth [12,13,26]. Increases in N. punctiforme growth were first observed after five (percent cover) and 10 days (cell densities), suggesting that early N fixation may be required to fuel growth of moss-associated cyanobacteria. Similarly, the highest heterocyst production and per cell N fixation rate (cyanobacterial activity) occurred just prior to significant growth, again suggesting that investment of cyanobacteria into heterocyst cell production for N fixation is a mechanism to fuel demands of growth under N limited conditions (Figure 6).
Nitrogen fixation accelerated rapidly at day 15, which corresponded to the middle of the exponential growth cycle [17], also suggesting that cyanobacteria produce fixed N to sustain rapid growth of vegetative cells, and cultures grown under elevated CO2 condition had greater cell densities in subsequent days (day 20, day 25) following the exponential growth phase. Several studies have shown that elevated CO2 can enhance N fixation of marine cyanobacteria [16,17,18], but the limited studies of cyanobacterial N fixation from terrestrial systems have demonstrated a negative effect of elevated CO2 on N fixation [15,27]. We show that elevated CO2 conditions stimulated N fixation and heterocyst production, and that cultures under elevated CO2 grew more quickly than under ambient CO2 conditions. The temperature treatments, however, suggest that the cyanobacteria do not remain in a stationary phase, rather grow and then possibly cycle or decline, with rates of growth being dependent on temperature conditions. Across our three temperature treatments, low temperature treatments (11.5 °C) exhibited increases in N fixation rate over 90 days of experimental treatment with elevated CO2 treatments having greater N fixation across all time points. In comparison, the moderate temperature treatment (15.5 °C) exhibited a unimodal (increase then decrease) in N fixation over 90 days, with no clear trend of elevated CO2 effects, while the warm (19.5 °C) temperature treatment exhibited a bimodal peak in N fixation with elevated CO2 treatments having greater N fixation during peak N fixation days (days 3, 40, days 70, 80). Taken together, these results suggest that growth cycles of exponential and stationary growth occur more rapidly under warmer conditions, and that N fixation is a key factor in supporting the active growth stages. Previous studies demonstrated that CO2 can have a beneficial effect on N fixation at elevated temperatures for marine species [28], yet we suggest that the stimulatory effect of CO2 on N fixation is growth stage dependent, which is influenced by temperature. We observed the most significant difference in N fixation under CO2 conditions at lower temperatures likely because these cultures experienced a longer (slower, cumulative effect) exponential growth phase than warmer treatments. While no differences in vegetative cell production between the CO2 or temperature treatments were observed at the end of the experiment, this was probably due to all mesocosms converging on a stationary growth phase under the different temperature treatments at the end of the experiment.
The mechanism of increased growth under elevated CO2 conditions is presumed to be by stimulating photosynthesis, but we do not have any direct evidence to support this. Additionally, it is possible that increased growth was aided by a carbon-concentrating mechanism (CCM). It is unknown whether N. punctiforme utilizes a CCM, although it has been shown to have genes associated with a carbon-concentrating capacity [12]. While the presence of CCM is shown to enhance growth under CO2 limited conditions [29], high CO2 is expected to suppress the CCM system because it is energetically expensive. However, there is the possibility of a CCM in Nostoc as a mechanism to help fuel growth, which could be one explanation of the increased growth rate under elevated CO2 conditions.
Many forest systems with high densities of moss on the forest floor, particularly boreal systems, are predicted to experience increases in temperature over the next century, with increases ranging from 2 °C to 8 °C [9]. This warming is likely to have a positive effect on forest floor cyanobacteria growth and N fixation as long as temperatures remain within or below the enzymatic optimum temperature for N fixation (between 20 °C and 30 °C) [14]. With that said, increases in temperature might have a negative effect on moss host plants that could reduce forest-wide densities of N fixing cyanobacteria [11,30,31], thus extrapolating the stimulatory effects of increased temperature and CO2 on forest floor, moss-associated cyanobacterial N fixation to the forest level is difficult [32]. Another reason for this is because the fate of the N fixed by terrestrial cyanobacteria is still unclear. Recent studies suggest that moss-associated cyanobacteria have true symbiotic relationships with their moss hosts and exchange N for carbon-based energy sources (e.g., sugars) [33,34], however, the exact mechanisms of such are still undetermined. Similarly, whether fixed N is transferred directly to the forest ecosystem at large, or whether it is retained within the cyanobacteria (or moss) biomass has been difficult to disentangle. Lindo et al. [8] outline three potential pathways that N fixed by forest floor cyanobacteria can enter the vascular plants of the forest ecosystems: (1) through forest fire and release from biomass; (2) transfer to mosses and subsequent leaking during wet-dry cycles or moss litter decomposition; or (3) direct uptake by mycorrhizae present in the moss layer of the forest floor if the transfer of N from cyanobacteria to mosses is a “leaky” pathway [35,36,37,38].

5. Conclusions

Our study suggests there is a greater N demand by forest floor cyanobacterium with greater growth under warming and elevated CO2 conditions, and that the cumulative overall amounts of N fixed will be greater under warmer and elevated CO2 conditions even when controlling for faster cycling of growth phases. However, whether this translates into greater N availability for N limited forest ecosystems in general will depend on the exact relationship between the cyanobacteria and the moss-associated host, which is still unknown.

Acknowledgments

We are grateful to Charmaine Dean, Dean of the Western Faculty of Science, for supporting our use of the Biotron, funding from the Natural Sciences and Engineering Research Council of Canada (NSERC) Discovery Grant program (ZL) (#418241-2012). We thank we thank Norm Hüner, Sheila Macfie, and Brian Branfireun for helpful comments and feedback.

Author Contributions

Z.L. and D.A.G. conceived and designed the experiments; D.A.G. performed the experiments; Z.L. and D.A.G. analysed the data and wrote the manuscript.

Conflicts of Interest

The authors declare no conflict of interest.

References

  1. Vitousek, P.M.; Cassman, K.; Cleveland, C.; Crews, T.; Field, C.B.; Grimm, N.B.; Horwarth, R.W.; Marino, R.; Martinelli, L.; Rastetter, E.B.; et al. Towards an ecological understanding of biological nitrogen fixation. Biogeochemistry 2002, 57, 1–45. [Google Scholar] [CrossRef]
  2. Zielke, M.; Solheim, B.; Spjelkavik, S.; Olsen, R.A. Nitrogen fixation in the high arctic: Role of vegetation and environmental conditions. Arct. Antarct. Alp. Res. 2005, 37, 372–378. [Google Scholar] [CrossRef]
  3. DeLuca, T.H.; Zackrisson, O.; Gentili, F.; Sellstedt, A.; Nilsson, M.-C. Ecosystem controls of nitrogen fixation in boreal feather moss communities. Oecologia 2007, 152, 121–130. [Google Scholar] [CrossRef] [PubMed]
  4. DeLuca, T.H.; Zackrisson, O.; Gundale, M.J.; Nilsson, M.-C. Ecosystem feedbacks and nitrogen fixation in boreal forests. Science 2008, 320, 1181. [Google Scholar] [CrossRef] [PubMed]
  5. Sorensen, P.L.; Michelsen, A. Long-term warming and litter addition affects nitrogen fixation in a subarctic heath. Glob. Chang. Biol. 2011, 17, 528–537. [Google Scholar] [CrossRef]
  6. Rousk, K.; Jones, D.L.; DeLuca, T.H. Moss-cyanobacteria associations as biogenic sources of nitrogen in boreal forest ecosystems. Front. Microbiol. 2013, 4, 1–10. [Google Scholar] [CrossRef] [PubMed] [Green Version]
  7. Lindo, Z.; Whiteley, J.A. Old trees contribute to bio-available nitrogen through canopy bryophytes. Plant Soil 2011, 342, 141–148. [Google Scholar] [CrossRef]
  8. Lindo, Z.; Nilsson, M.-C.; Gundale, M.J. Bryophyte-cyanobacteria associations as regulators of northern latitude carbon balance in response to global change. Glob. Chang. Biol. 2013, 19, 2022–2035. [Google Scholar] [CrossRef] [PubMed]
  9. Intergovernmental Panel on Climate Change (IPCC). Intergovernmental Panel on Climate Change Fourth Assessment Report; Cambridge University Press: New York, NY, USA, 2007. [Google Scholar]
  10. Gentili, F.; Nilsson, M.-C.; Zackrisson, O.; DeLuca, T.H.; Sellstedt, A. Physiological and molecular diversity of feather moss associative N2-fixing cyanobacteria. J. Exp. Bot. 2005, 56, 3121–3127. [Google Scholar] [CrossRef] [PubMed]
  11. Gundale, M.J.; Nilsson, M.-C.; Bansal, S.; Jäderlund, A. The interactive effects of temperature and light on biological nitrogen fixation in boreal forests. New Phytol. 2012, 194, 453–463. [Google Scholar] [CrossRef] [PubMed]
  12. Meeks, J.C.; Elhai, J.; Thiel, T.; Potts, M.; Larimer, F.; Lamerdin, J.; Predki, P.; Atlas, R. An overview of the genome of Nostoc punctiforme, a multicellular, symbiotic cyanobacterium. Photosynth. Res. 2001, 70, 85–106. [Google Scholar] [CrossRef] [PubMed]
  13. Dixon, R.; Kahn, D. Genetic regulation of biological nitrogen fixation. Nat. Rev. Microbiol. 2004, 2, 621–631. [Google Scholar] [CrossRef] [PubMed]
  14. Houlton, B.Z.; Wang, Y.P.; Vitousek, P.M.; Field, C.B. A unifying framework for dinitrogen fixation in the terrestrial biosphere. Nature 2008, 454, 327–330. [Google Scholar] [CrossRef] [PubMed]
  15. Smith, V.R. Effects of abiotic factors on acetylene reduction by cyanobacteria epiphytic on moss at a subantarctic island. Appl. Environ. Microbiol. 1984, 48, 594–600. [Google Scholar] [PubMed]
  16. Hutchins, D.A.; Fu, F.-X.; Zhang, Y.; Warner, M.E.; Feng, Y.; Portune, K.; Bernhardt, P.W.; Mulholland, M.R. CO2 control of Trichodesmium N2 fixation, photosynthesis, growth rates, and elemental ratios: Implications for past, present, and future ocean biogeochemistry. Limnol. Oceanogr. 2007, 52, 1293–1304. [Google Scholar] [CrossRef]
  17. Levitan, O.; Rosenberg, G.; Setlik, I.; Setlikova, E.; Grigel, J.; Klepetar, J.; Prasil, O.; Berman-Frank, I. Elevated CO2 enhances nitrogen fixation and growth in the marine cyanobacterium Trichodesmium. Glob. Chang. Biol. 2007, 13, 531–538. [Google Scholar] [CrossRef]
  18. Sohm, J.A.; Webb, E.A.; Capone, D.G. Emerging patterns of marine nitrogen fixation. Nat. Rev. Microbiol. 2011, 9, 499–508. [Google Scholar] [CrossRef] [PubMed]
  19. Czerny, J.; Barcelos e Ramos, J.; Riebesell, U. Influence of elevated CO2 concentrations on cell division and nitrogen fixation rates in the bloom-forming cyanobacterium Nodularia spumigena. Biogeosciences 2009, 6, 1865–1875. [Google Scholar] [CrossRef] [Green Version]
  20. Dodds, W.K.; Gudder, D.A.; Mollenhauer, D. The ecology of Nostoc. J. Phycol. 1995, 31, 2–18. [Google Scholar] [CrossRef]
  21. Meeks, J.C.; Elhai, J. Regulation of cellular differentiation in filamentous cyanobacteria in free-living and plant-associated symbiotic growth states. Microbiol. Mol. Biol. Rev. 2002, 66, 94–121. [Google Scholar] [CrossRef] [PubMed]
  22. Hardy, R.W.F.; Holsten, R.D.; Jackson, E.K.; Burns, R.C. The acetylene-ethylene assay for N2 fixation: Laboratory and field evaluation. Plant Physiol. 1968, 43, 1185–1207. [Google Scholar] [CrossRef] [PubMed]
  23. DeLuca, T.H.; Zackrisson, O.; Nilsson, M.-C.; Sellstedt, A. Quantifying nitrogen fixation in feather moss carpets of boreal forests. Nature 2002, 419, 917–920. [Google Scholar] [CrossRef] [PubMed]
  24. Leppänen, S.M.; Salemaa, M.; Smolander, A.; Mäkipää, R.; Tiirola, M. Nitrogen fixation and methanotrophy in forest mosses along a N deposition gradient. Environ. Exp. Bot. 2013, 90, 62–69. [Google Scholar] [CrossRef]
  25. R Core Team. R: A Language and Environment for Statistical Computing; R Foundation for Statistical Computing: Vienna, Austria, 2012; Available online: http://www.R-project.org/ (accessed on 23 January 2017).
  26. Campbell, E.L.; Summers, M.L.; Christman, H.; Martin, M.E.; Meeks, C.J. Global gene expression patterns of Nostoc punctiforme in steady-state dinitrogen grown heterocyst-containing cultures and at single time points during the differentiation of akinetes and hormogonia. J. Bacteriol. 2007, 189, 5247–5256. [Google Scholar] [CrossRef] [PubMed]
  27. Hungate, B.A.; Stiling, P.D.; Dijkstra, P.; Johnson, D.W.; Ketterer, M.E.; Hymus, G.J.; Hinkle, C.R.; Drake, B.G. CO2 elicits long-term decline in nitrogen fixation. Science 2004, 304, 1291. [Google Scholar] [CrossRef] [PubMed]
  28. Chinnasamy, S.; Ramakrishnan, B.; Bhatnagar, A.; Goyal, S.K.; Das, K.C. Carbon and nitrogen fixation by Anabaena fertilissima under elevated CO2 and temperature. J. Freshw. Ecol. 2009, 24, 587–596. [Google Scholar] [CrossRef]
  29. Zarzycki, J.; Axen, S.D.; Kinney, J.N.; Kerfeld, C.A. Cyanobacterial-based approaches to improving photosynthesis in plants. J. Exp. Bot. 2013, 64, 787–798. [Google Scholar] [CrossRef] [PubMed]
  30. Sorensen, P.L.; Lett, S.; Michelsen, A. Moss-specific changes in nitrogen fixation following two decades of warming, shading, and fertilizer addition. Plant Ecol. 2012, 213, 695–706. [Google Scholar] [CrossRef]
  31. Lang, S.I.; Cornelissen, J.H.C.; Shaver, G.R.; Ahrens, M.; Callaghan, T.V.; Molau, U.; Ter Braak, C.J.F.; Hölzer, A.; Aerts, R. Arctic warming on two continents has consistent negative effects on lichen diversity and mixed effects on bryophyte diversity. Glob. Chang. Biol. 2012, 18, 1096–1107. [Google Scholar] [CrossRef]
  32. Jean, M.-E.; Cassar, N.; Setzer, C.; Bellenger, J.-P. Short-term N2 fixation kinetics in a moss-associated cyanobacteria. Environ. Sci. Technol. 2012, 46, 8667–8671. [Google Scholar] [CrossRef] [PubMed]
  33. Berg, A.; Danielsson, A.; Svensson, B.H. Transfer of fixed-N from N2-fixing cyanobacteria associated with the moss Sphagnum riparium results in enhanced growth of the moss. Plant Soil 2013, 362, 271–278. [Google Scholar] [CrossRef]
  34. Bay, G.; Nahar, N.; Oubre, M.; Whitehouse, M.J.; Wardle, D.A.; Zackrisson, O.; Nilccon, M.-C.; Rasmussen, U. Boreal feather mosses secrete chemical signals to gain nitrogen. New Phytol. 2013, 200, 54–60. [Google Scholar] [CrossRef] [PubMed]
  35. Carleton, T.J.; Read, D.J. Ectomycorrhizas and nutrient transfer in conifer feather moss ecosystems. Can. J. Bot. 1991, 69, 778–785. [Google Scholar] [CrossRef]
  36. Kauserud, H.; Mathiesen, C.; Ohlson, M. High diversity of fungi associated with living parts of boreal forest bryophytes. Botany 2008, 86, 1326–1333. [Google Scholar] [CrossRef]
  37. Davey, M.L.; Nybakken, L.; Kauserud, H.; Ohlson, M. Fungal biomass in the phyllosphere of bryophytes and vascular plants. Mycol. Res. 2009, 113, 1254–1260. [Google Scholar] [CrossRef] [PubMed]
  38. Davey, M.L.; Heegaard, E.; Halvorsen, R.; Ohlson, M.; Kauserud, H. Seasonal trends in the biomass and structure of bryophyte associated fungal communities explored by 454 pyrosequencing. New Phytol. 2012, 195, 844–856. [Google Scholar] [CrossRef] [PubMed]
Figure 1. Cyanobacterial growth (circles) and N fixation (bars) as measured by the ethylene (C2H4) produced of N. punctiforme cultures over 30 days. Samples were grown on 27 mm diameter agar vials over 30 days under ambient (430 ppm) and elevated (750 ppm) atmospheric CO2 conditions. All data are plotted as mean ± SD.
Forests 08 00073 g001
Figure 2. Density of cyanobacterial cells during grown of N. punctiforme over 30 days under ambient (430 ppm) and elevated (750 ppm) atmospheric CO2 conditions. All data are plotted as mean ± SD; pairwise differences are shown using an asterisk symbol (*).
Forests 08 00073 g002
Figure 3. Percent of nitrogen fixing heterocyst cells in cyanobacterial cultures of N. punctiforme over 30 days. Samples were grown on 27 mm diameter agar vials under ambient (430 ppm) and elevated (750 ppm) atmospheric CO2 conditions. All data are plotted as mean ± SD; pairwise differences are shown using an asterisk symbol (*).
Forests 08 00073 g003
Figure 4. Cyanobacterial activity of N. punctiforme as measured by the ethylene (C2H4) produced per percentage cover of cultures. Samples were grown on 27 mm diameter agar vials over 30 days under ambient (430 ppm) and elevated (750 ppm) atmospheric CO2 conditions. All data are plotted as mean ± SD; pairwise differences are shown using an asterisk symbol (*).
Forests 08 00073 g004
Figure 5. Nitrogen fixation of axenic N. punctiforme as measured by the ethylene (C2H4) produced over 90 days. Vials were grown at (a) 11.5 °C showing maximum N2 fixation at day 80; (b) 15.5 °C showing maximum N fixation at day 60; (c) 19.5 °C showing maximum N2 fixation at day 40 and day 80. All data are plotted as mean ± SD.
Forests 08 00073 g005
Figure 6. Timeline of growth and N fixation events for the cyanobacterium N. punctiforme grown under axenic conditions. During the lag phase of growth, the cyanobacteria produces heterocyst cells alongside vegetative cell growth; heterocyst cell production occurs within 1–3 days. The maximum rate of heterocyst production occurs while the cyanobacteria is still in lag phase, but just before exponential growth, which is characterized by the highest growth rate and maximal per cell heterocyst N fixation activity. Once the cyanobacteria reach the stationary phase, overall N fixation is highest due to the greatest amounts of total heterocyst cells.
Forests 08 00073 g006
Table 1. Results of repeated-measures Analysis of Variance tests used for the effects of elevated CO2 and temperature treatments over 90 day incubation periods for rates of N fixation by axenic cultures of N. punctiforme.
Treatment Effect (Degrees of Freedom)F Statisticp Value
CO2 (1,30)21.77<0.001
temperature (2,30)9.77<0.001
CO2 × temperature (2,30)4.710.017
time (6,180)53.83<0.001
time × CO2 (6,180)1.410.204
time × temperature (12,180)30.95<0.001
time × CO2 × temperature (12,180)2.340.008

