Article

Genetic Diversity of Walnut (Juglans Regia L.) in the Eastern Italian Alps

1
Dipartimento di Scienze AgroAlimentari, Ambientali e Animali, University of Udine, Via delle Scienze 208, 33100 Udine, Italy
2
Dipartimento di Scienze della Vita, University of Trieste, Via Licio Giorgieri 5, 34127 Trieste, Italy
3
Department of Agrifood Production and Environmental Science, University of Florence, P. le delle Cascine 18, 50144 Florence, Italy
4
Institute of Biosciences and BioResources, Division of Florence, National Research Council, Via Madonna del Piano 10, 50019 Sesto Fiorentino (Firenze), Italy
*
Author to whom correspondence should be addressed.
Forests 2017, 8(3), 81; https://doi.org/10.3390/f8030081
Submission received: 16 January 2017 / Revised: 27 February 2017 / Accepted: 9 March 2017 / Published: 16 March 2017

Abstract

:
Juglans regia L. is distributed primarily across temperate and subtropical regions of the Northern Hemisphere. During the last glaciation, the species survived in refugial areas that in Europe included the Balkans and the Italian peninsula, two areas joined by a corridor represented by the Friuli Venezia Giulia region, where two germplasm reservoirs met and likely intercrossed during re-colonization after the last glaciation. In this work, two hundred and fifteen wild accessions native to the area were sampled, georeferenced, and genotyped with 20 microsatellite loci selected from the literature. The local accessions of this study displayed moderate genetic diversity with 80 alleles identified. The number of alleles/loci was 4.0 (4.7 alleles for the genomic SSRs (Simple Sequence Repeats) and 2.7 alleles per EST (Expressed Sequence Tag)-derived SSR, on average). An analysis of molecular variance (AMOVA) revealed that most of the molecular diversity was between individuals (nearly 98% of variation explained). The model-based clustering algorithms implemented either in STRUCTURE and GENELAND software revealed two clusters: The first one encompassed most of the samples and showed a great genetic admixture throughout the five sampling areas defined on the base of orographic characteristics of the region. The second cluster represented a small island with three samples traced back to an introduction from Russia at the beginning of the 20th century.

1. Introduction

Persian walnut (Juglans regia L.) is one of approximately 21 species in the genus Juglans L. [1]. The genus originated in the late Paleocene, diversified during the Eocene [2], and maintained its presence in the area between the 45° and 65° paleolatitudes during evolution of the climate to cooler conditions [3]. Juglans regia L. is nowadays distributed primarily across the temperate and subtropical regions of the Northern Hemisphere from Central Asia to the Mediterranean basin [4]. Because of the presence of large walnut (J. regia L.) forests in countries of Central Asia such as Kyrgyzstan, Uzbekistan, and Tajikistan, and the large phenotypic diversity recorded in those countries, Vavilov considered Central Asia to be the primary center of diversity of the species [5], but the subject is still debated [6]. It is likely that prior to the Pleistocene glaciations the species had a wide distribution in Eurasia, but during the glacial periods the distribution was contracted to refugial areas in China, the Himalayan slopes, Southern-Central Asia, the Balkans, and the Iberian and Italian peninsulas [7,8,9,10]. Following the last glaciation, recolonization of the species’ original areas of diffusion and other neighboring areas with compatible climates has likely masked the preglacial centers of origin of this species. Yet, this spontaneous spread was accompanied 2000 years ago by artificial diffusion through human silvo-pastoral practices, as has been demonstrated in the Fergana Valley where walnut forest stands are a mosaic of natural and planted trees [9,11,12,13]. Nevertheless, disregarding the problem of the original center of diffusion of the species, and considering only the recent spread after the last glacial maximum (LGM), the Southern Balkan and Italian peninsulas were two likely reservoirs of germplasm from which the species recolonized northern latitudes [7]. However, the severe reduction in the walnut populations in these reservoirs that has been claimed by some authors would have favored the re-introduction of the species from Western Asia [14]. The above-mentioned peninsulas, which are separated from each other by the Adriatic Sea, are joined to the north by a corridor represented by the Friuli Venezia Giulia Region and neighboring areas such as Istria. These are known to be areas where different germplasm populations, which had retreated during the last glaciation, came into contact again, thus creating new genetic diversity. The botanical richness of these regions evidences the intermingling of the flora of the two glacial refuges [15]. Walnut fossils are commonly found in the Neolithic sites of northeastern Italy [16]. Therefore, a wide genetic diversity is expected in the corridor represented by the Friuli Venezia Giulia region, so a wide exploration of wild walnut was undertaken in that area by sampling 215 old trees propagated by seed alone according to information collected from local people. The genetic diversity was investigated with 20 Simple Sequence Repeat (SSR) markers selected from the literature.

2. Materials and Methods

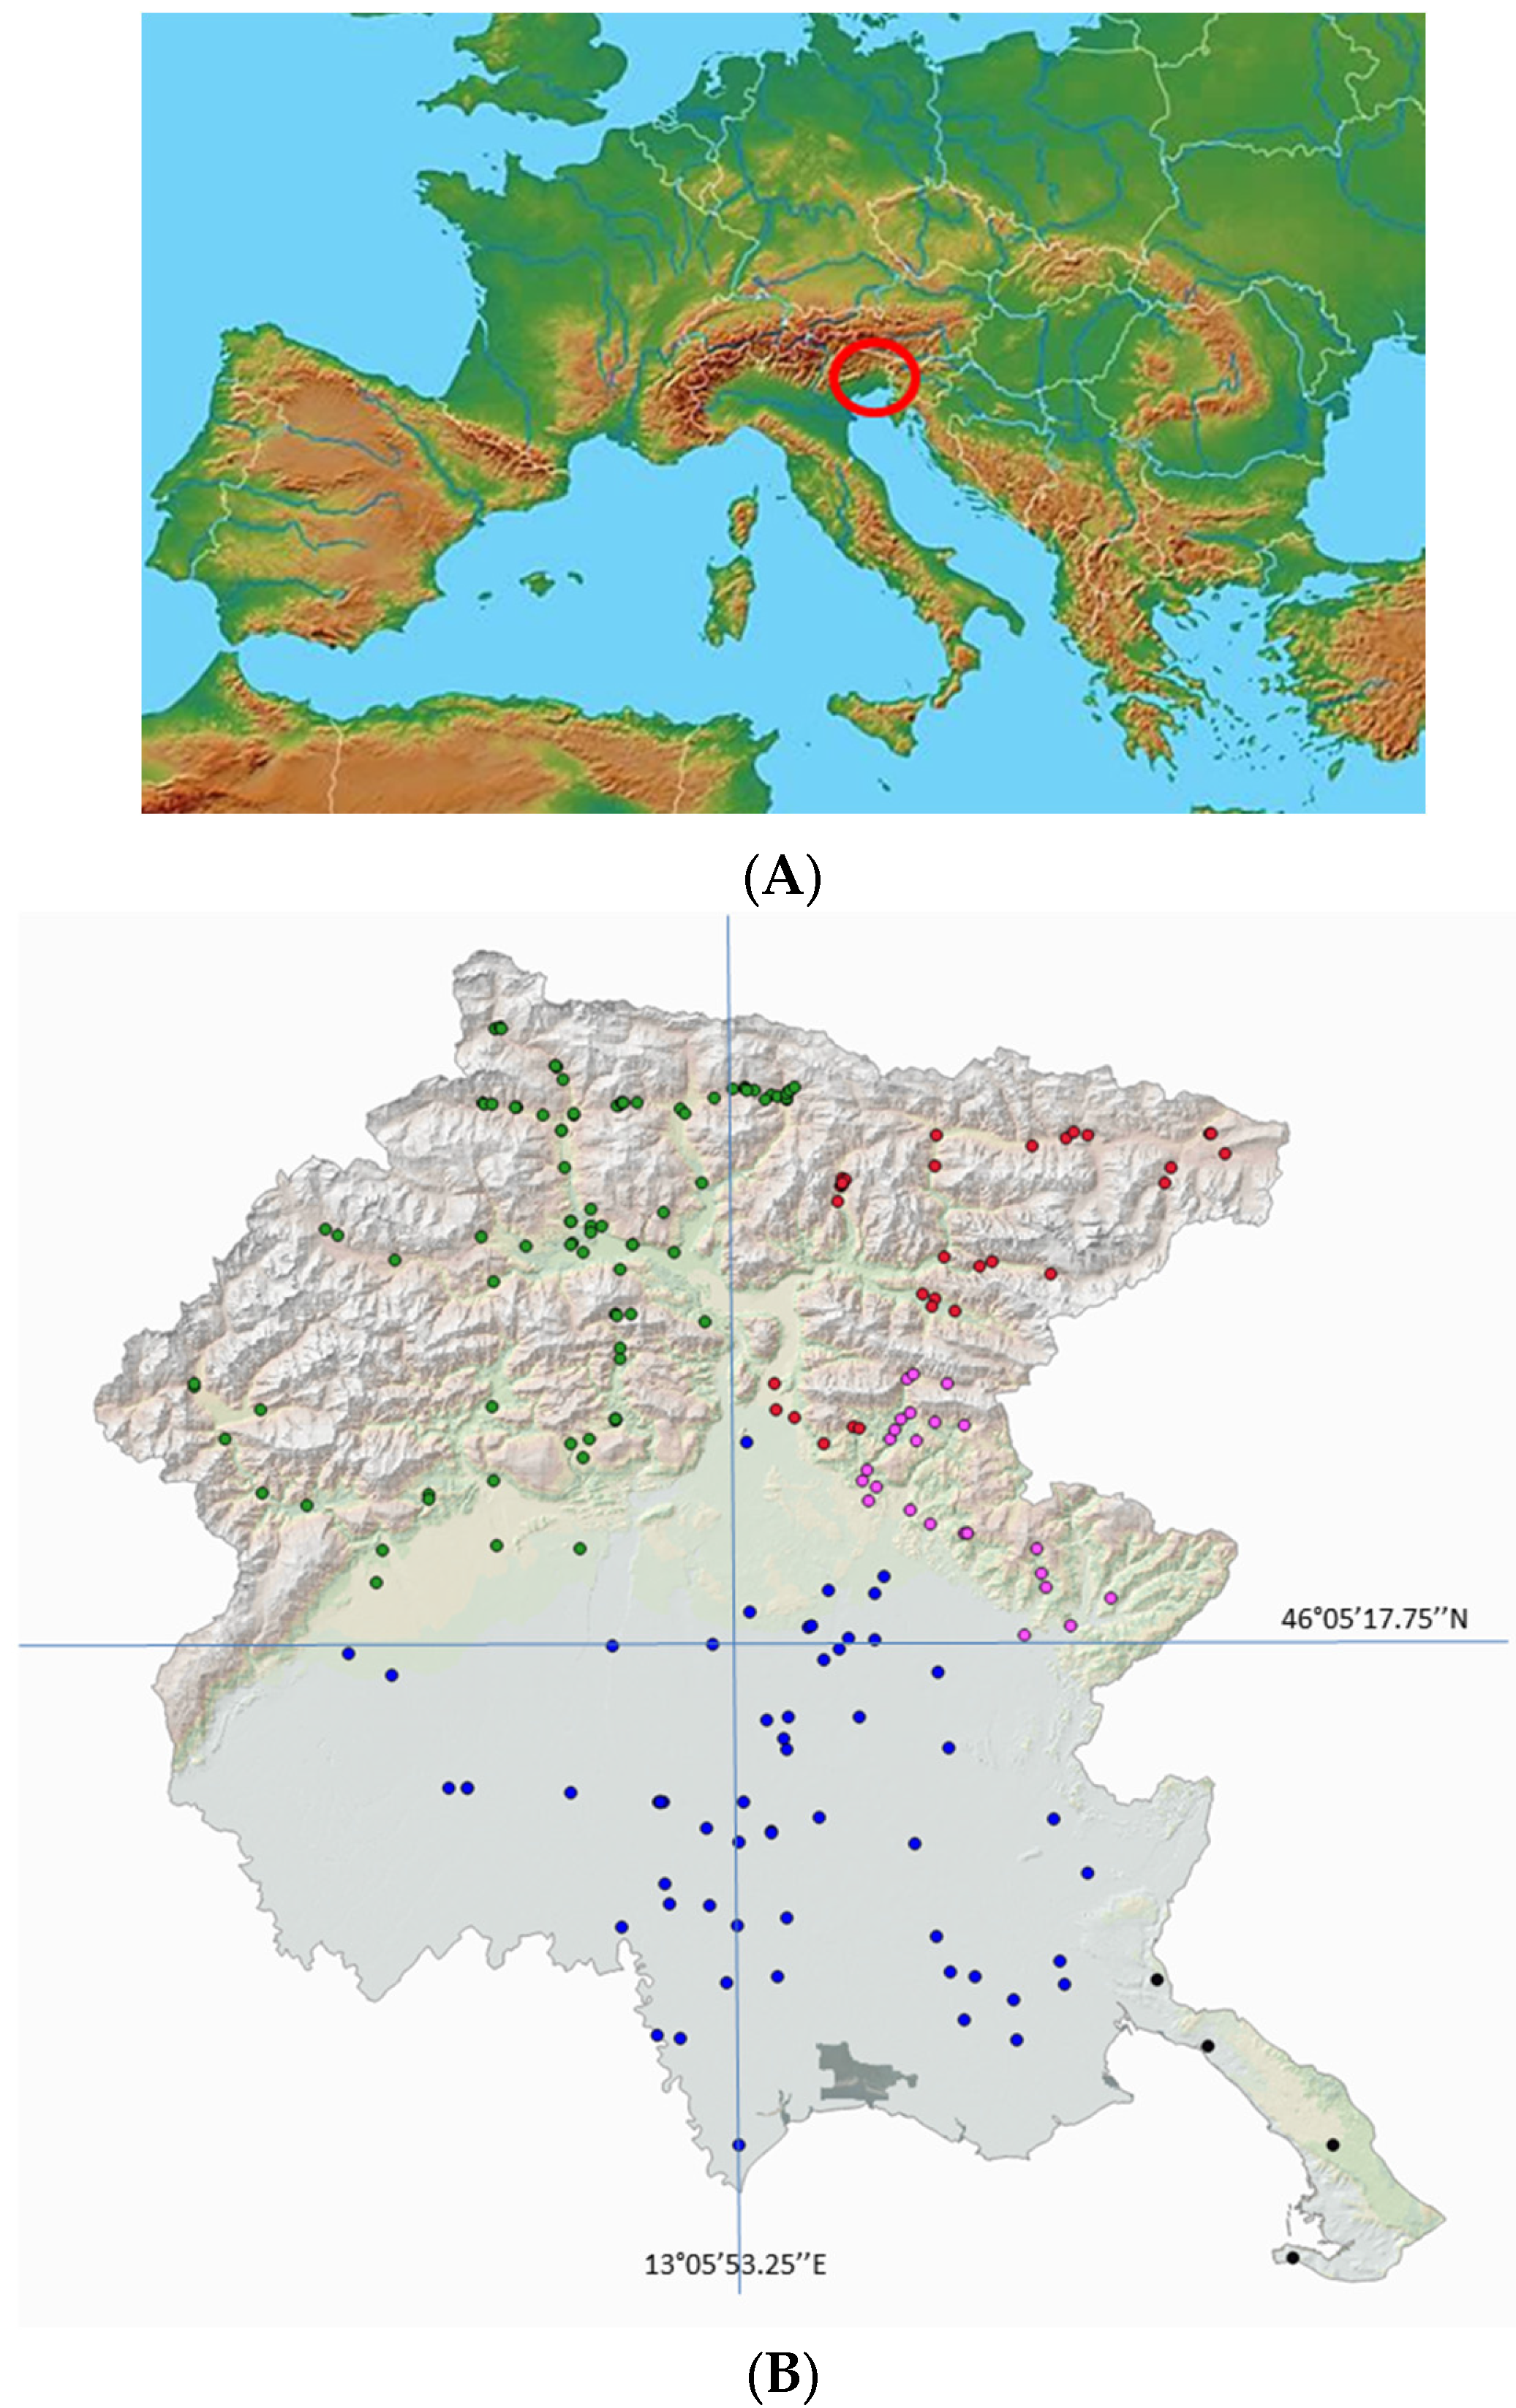
2.1. Plant Materials

The work plan aimed to sample walnut trees (Juglans regia L.) originating from seedlings in the Friuli Venezia Giulia region. To achieve a good representation of the native walnut population, the region was initially split into geographically homogeneous areas, represented by the eastern Alpine highlands (‘Alpi Giulie’, pop 1), the western Alpine highlands (‘Alpi Carniche’, pop 2), the Friuli plains (pop 3), the valleys of the Torre and Natisone rivers (pop 4), and the Trieste karst (pop 5) (Figure 1). At each location, the trees sampled were among the oldest individuals in the area. In some areas that were poorly populated, additional younger trees were sampled when their seed origins were known with confidence. A total of 215 accessions were collected. The list of the accessions analyzed is reported in the Supplementary Material (Table S1).

2.2. DNA Extraction

Leaves were collected from young shoots at the beginning of the season or mature leaves later in the season. DNA was extracted using the DNeasy 96 Plant Mini Kit (Qiagen GmbH, Hilden, Germany) according to the manufacturer’s protocol.

2.3. SSR Genotyping

A review of the SSRs present in the literature [10,12,17,18,19,20,21,22,23,24,25,26] suggested the selection of twenty-two SSR markers, which were tested initially in a small panel of accessions. The control of amplification, the goodness of signal recorded by the automatic sequencer, and the number and quality of the true peaks suggested that only 20 of those SSR markers be retained for the analysis of the whole set of accessions. Furthermore, the neutrality of selected loci was checked with the Ewens-Watterson Test (1000 permutations) [27] using PopGene software [28]. Markers from different literature sources are collectively reported in Table 1 with primers and annealing temperatures for the convenience of the reader.
The forward primers were tailed by adding a 19-base M13 oligo sequence (M13 tail) labeled with FAM or HEX dye to the 5′ end [29,30]. The PCR reaction was carried out in a 10 μL solution containing 10 ng genomic DNA, 1 × Mg-free PCR buffer solution, 0.20 mM·dNTPs (Deoxynucleotide Triphosphates), 3.0 mM·MgCl2, 0.10 pmol forward primer, 0.30 pmol reverse primer, 0.30 pmol M13-labeled primer, 1.0 U AmpliTaq Gold DNA polymerase (Applied Biosystems, Foster City, CA, USA), and dH2O. Amplification was performed in a 9700 Thermal Cycler (Applied Biosystems) with the following cycles: 10 min at 94 °C followed by 30 cycles of 30 s at 94 °C, 45 s at 57 °C, 45 s at 72 °C; eight cycles of 30 s at 94 °C, 45 s at 53 °C, 45 s at 72 °C; and a final extension cycle of 30 min at 72 °C. The PCR products were separated in an ABI 3730 DNA automatic sequencer (Applied Biosystems) and fragments sized by means of the GeneScan™ 500 LIZ® Size Standard (Applied Biosystems). Data were analyzed and alleles called with GeneMarker software version 2.2.0 (SoftGenetics, College Station, TX, USA).

2.4. Data Analysis

2.4.1. Genetic Variation and Related Metrics

Diversity parameters were estimated for each SSR locus, including the number of alleles, the number of unique genotypes, observed heterozygosity (Ho), expected heterozygosity or gene diversity (GD), polymorphism information content (PIC), and the major allele frequency (MAF). The parameters were calculated with PowerMarker v3.25 software [31]. The Hardy-Weinberg equilibrium (HW) and the probability of identity (PID) for both unrelated genotypes and full sibs [32] were calculated using Cervus (http://www.fieldgenetics.com) [33,34]. The estimation of the expected frequency of null alleles (Fnull) was calculated in Cervus using an iterative algorithm (10 iterations) based on the observed and expected frequencies of the various genotypes [35]. The kinship coefficient (Fij) was estimated according to J. Nason as described in [36] using SPAGeDi 1.5 [37], and statistical significance was determined by Jackknifed after 20,000 permutation estimators [38].

2.4.2. The Comparison among Populations

Genetic diversity was measured for each population across all loci by calculating the actual (A) and the effective (Ne) number of alleles/loci, observed (Ho) and expected heterozygosity (He), using GenAlEx 6.3 software [39]. Allelic richness (Rs) was calculated by using the rarefaction method with HP-Rare software [40,41]. The estimates of Rs were standardized on a minimum sample size of six individuals.

2.4.3. Distance-Based Clustering

Distance matrixes of pairwise combinations of populations and individual accessions were calculated for co-dominant data by the Codom-Genotypic distance option in GenAlEx 6.1 software [39,42]. The matrixes generated were used for subsequent PCA and analysis of molecular variance (AMOVA) analyses with 999 permutations. A Mantel test, as implemented in GenAlEx, was performed using genetic and geographical distances to test for isolation by distance [43]. Cluster analysis was carried out on genetic distances by the neighbor joining method [44] using MEGA 6 software [45]. The results were visualized in the form of a circular tree using TreeView v1.6.6 [46].

2.4.4. Model-Based Clustering

We applied the model-based clustering algorithm implemented in the software, STRUCTURE [47]. STRUCTURE was run independently 20 times for each K value (range 1–20) using 250,000 iterations for burn-in and 1,000,000 iterations for MCMC (Markov chain Monte Carlo). We used the admixture model option with the correlated allele frequencies [48]. Parameters were set to their default values, as advised in the package documentation [49]. All accessions were treated as having unknown origin (USEPOPINFO = 0). The inference of true K (number of populations) was calculated based on the second order rate of change of the likelihood (∆K) [50]. The STRUCTURE results were processed using STRUCTURE HARVESTER web version v0.6.94 (http://taylor0.biology.ucla.edu/ structureHarvester/) [51].

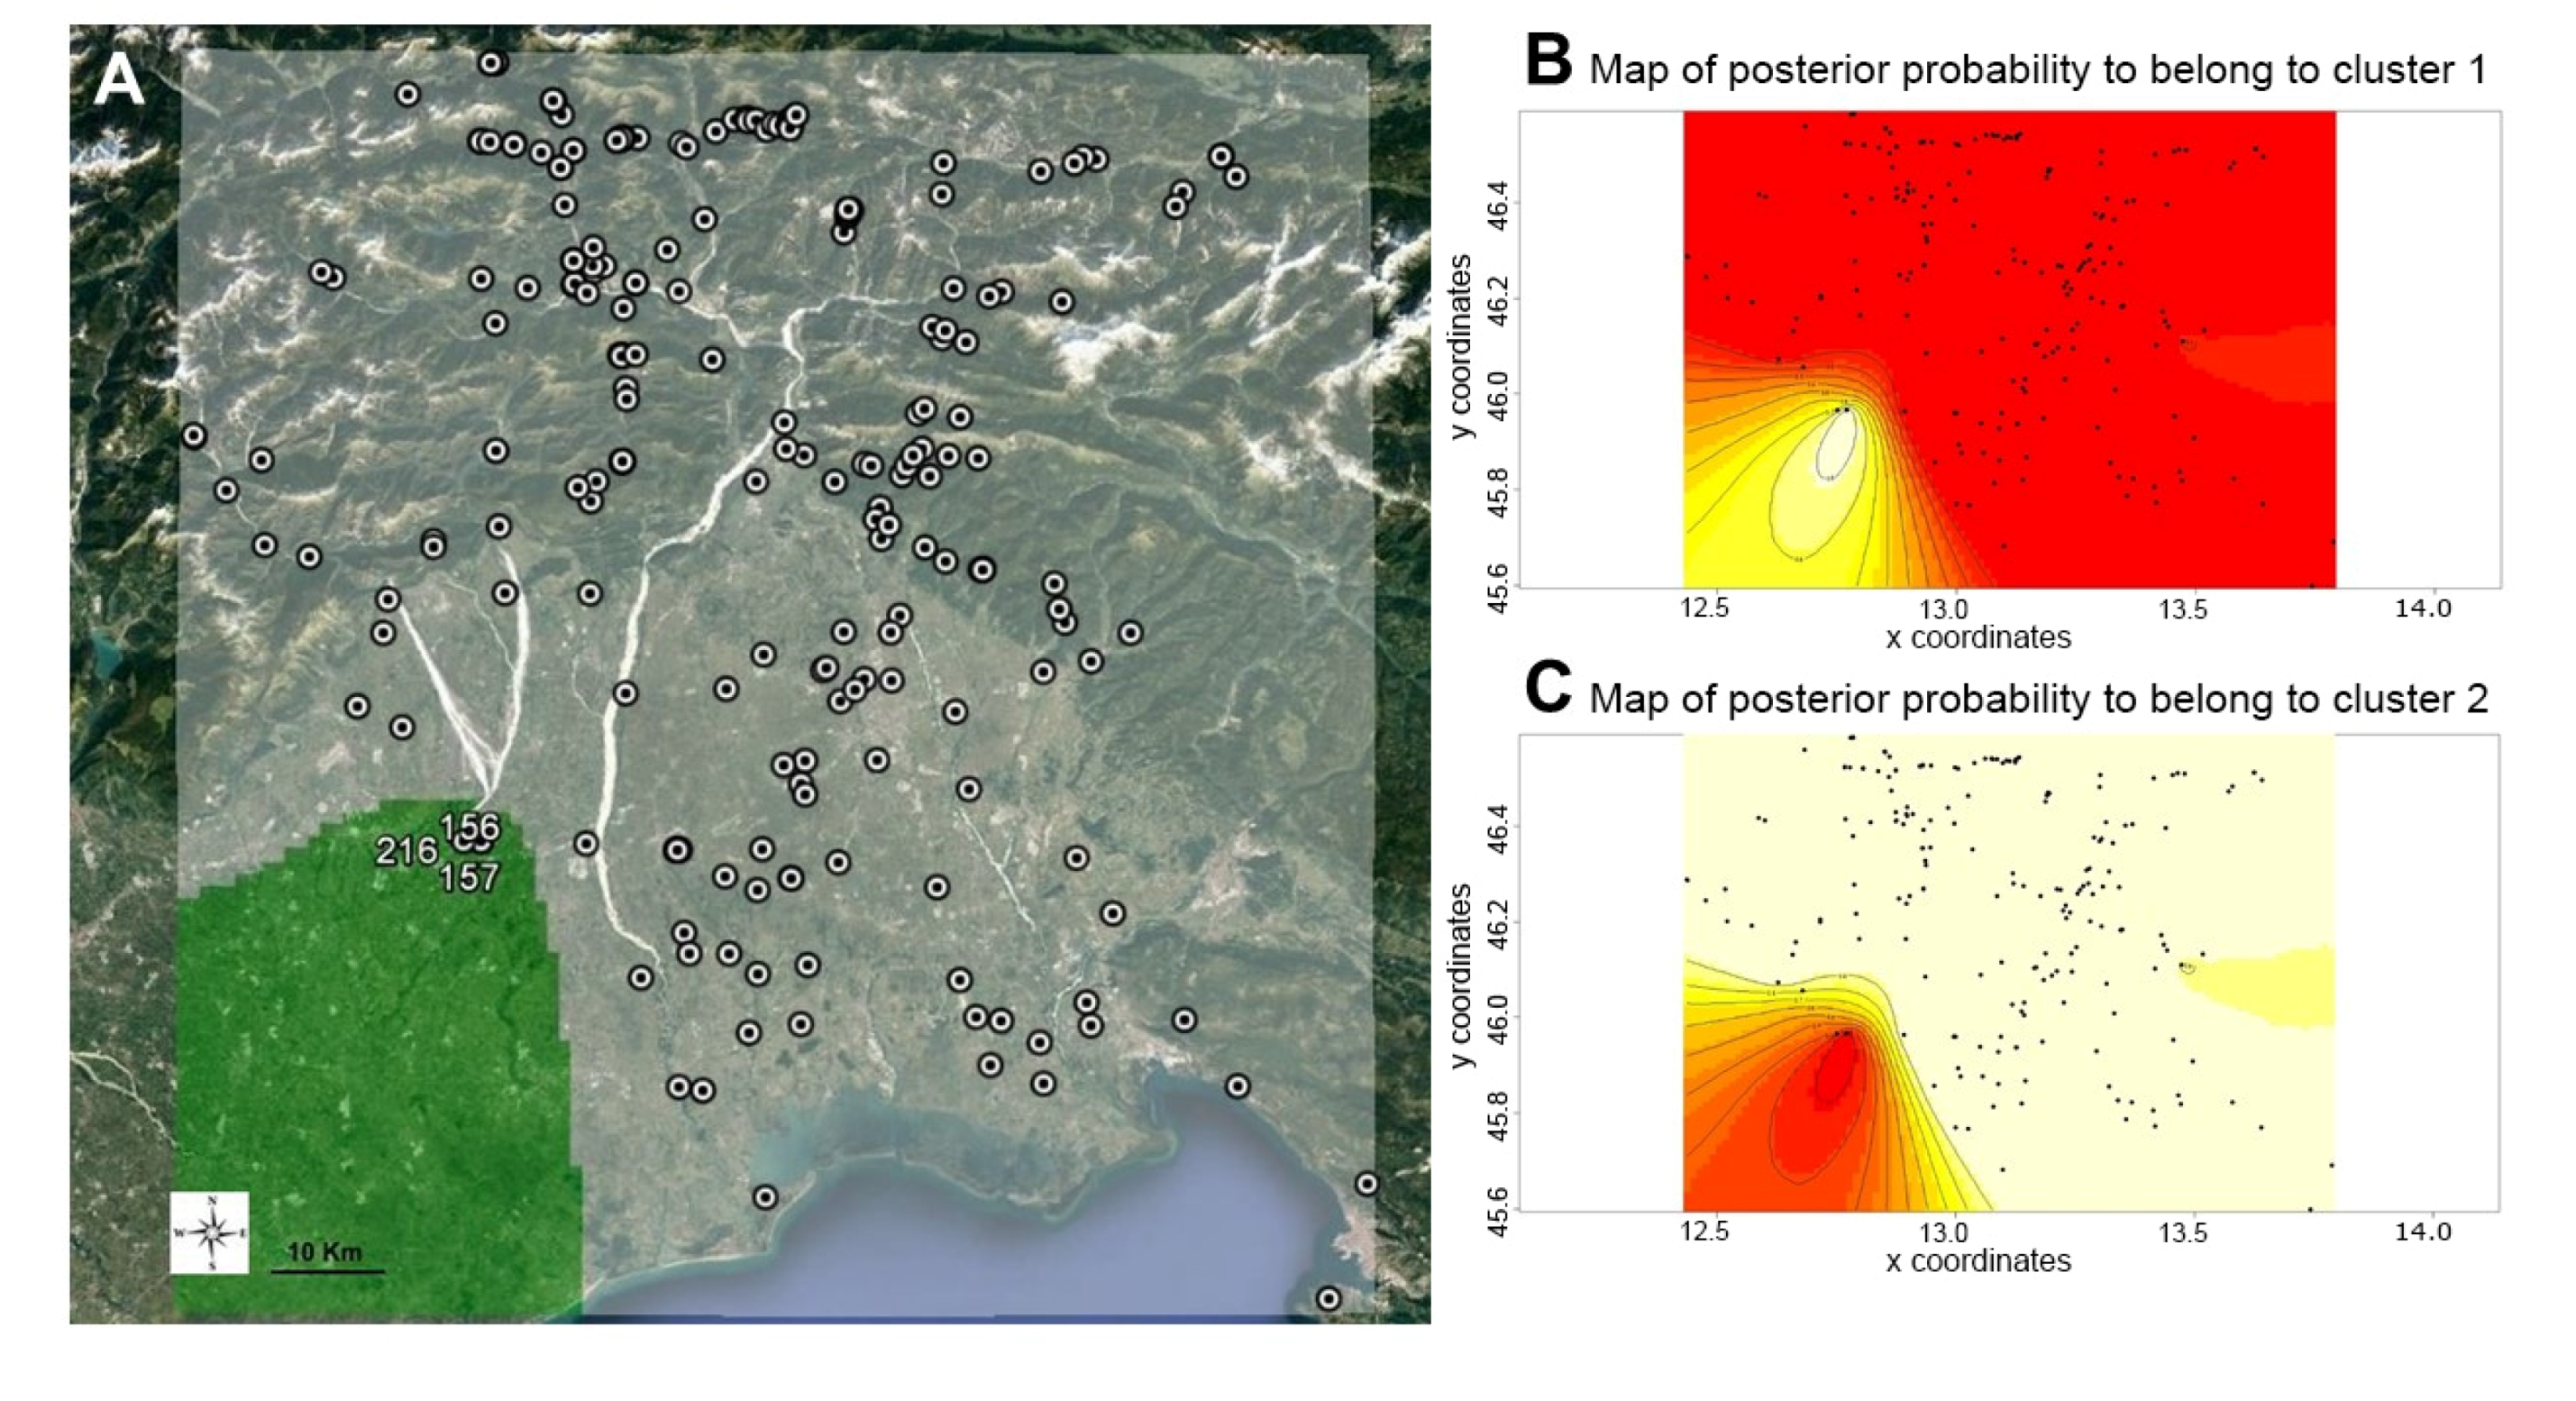
2.4.5. Landscape Genetics

We also inferred population structure using a Bayesian Monte Carlo Markov Chains method implemented in the Geneland package, version 4.0.5 [52], under the R Language and Environment for Statistical Computing software, as described by Guillot et al. [53,54,55] and Guillot [56]. Twenty independent Markov Chain Monte Carlo runs were performed by Geneland with the following settings: 1,000,000 iterations with 100 thinning intervals and a burn-in period of 250,000, using the correlated allele frequencies model. The maximum number of populations was unknown and hence treated as simulated variable along the MCMC simulations allowed to vary between 1 and 10. The run displayed a clear mode at K = 2 which was thus the maximum a posteriori estimate of K, confirming the number of sub-populations (K) estimated by the empirical statistic K [50]. Therefore, we did a second run with the maximum number of populations set to 2. A map of posterior probabilities (membership) was obtained by inputting PostProcessChain and PostTessellation functions into Geneland by tessellating the landscape at a resolution of 1 m. The posterior probabilities of population memberships were plotted on Google maps as reported in the Geneland package version 4.0.5. Null alleles were also calculated with Geneland 4.0.5 [52], but are not reported here.

3. Results and Discussion

3.1. SSR Marker Polymorphism and Genetic Metrics

Several SSR markers of walnut reported in the literature were unable to provide reliable outputs, despite their repeated citation. Lack of polymorphism, multilocus amplification, a large frequency of null alleles, strong peak stuttering, and inconstant amplifications were the main drawbacks. After a preliminary amplification test, twenty markers that provided good amplifications and clear fragment separation were selected and used to genotype the whole set of samples. The allelic profiles of the collected accessions are reported in the Supplementary Material (Table S1). The number of alleles per locus ranged from two to nine (mean 4.0). The observed heterozygosity (Ho) ranged from 0.051 to 0.712 (mean 0.462), and the genetic diversity ranged from 0.059 to 0.745 (mean 0.516), which in most cases closely followed the observed heterozygosity. The polymorphism information content (PIC) ranged from 0.058 to 0.698 (mean 0.438), which also followed the observed and expected heterozygosity (Table 2). Contig_721 and Contig_1692 were the two least informative markers due to the very high frequency of the major allele (0.97 and 0.96, respectively). Generally speaking, SSR markers derived from genomic libraries were more informative and discriminated better among accessions compared to those derived from EST (Expressed Sequence Tag) libraries, with the mean number of alleles being 4.7 vs. 2.7, the observed heterozygosity 0.558 vs. 0.367, the gene diversity 0.589 vs. 0.381, and the PIC 0.505 vs. 0.313, respectively (Table 2). In spite of this low polymorphism of EST-derived markers, the cumulative probability of identity (PID), which is the probability that two individuals would share by chance the same profile over all loci, was appreciably low, ranging from 2.93 × 10⁻¹¹ for unrelated individuals to 1.075 × 10⁻⁵ for full sibs (Table 2). The estimated frequency of null alleles was below 12%, except in the case of WGA349 where the frequency was rather higher (a. 23%). The estimates provided by Cervus and Geneland were similar in magnitude but different in values due to the different algorithms adopted by the two packages. It is noteworthy that the null allele frequency is estimated indirectly because the value simply indicates an excess of homozygotes, which are not necessarily linked to the presence of null alleles. For this we took the estimate of null alleles as a warning about the use of a given marker in genotyping individuals. None of the 215 accessions showed identical profiles to any other accession of the dataset (data not shown).

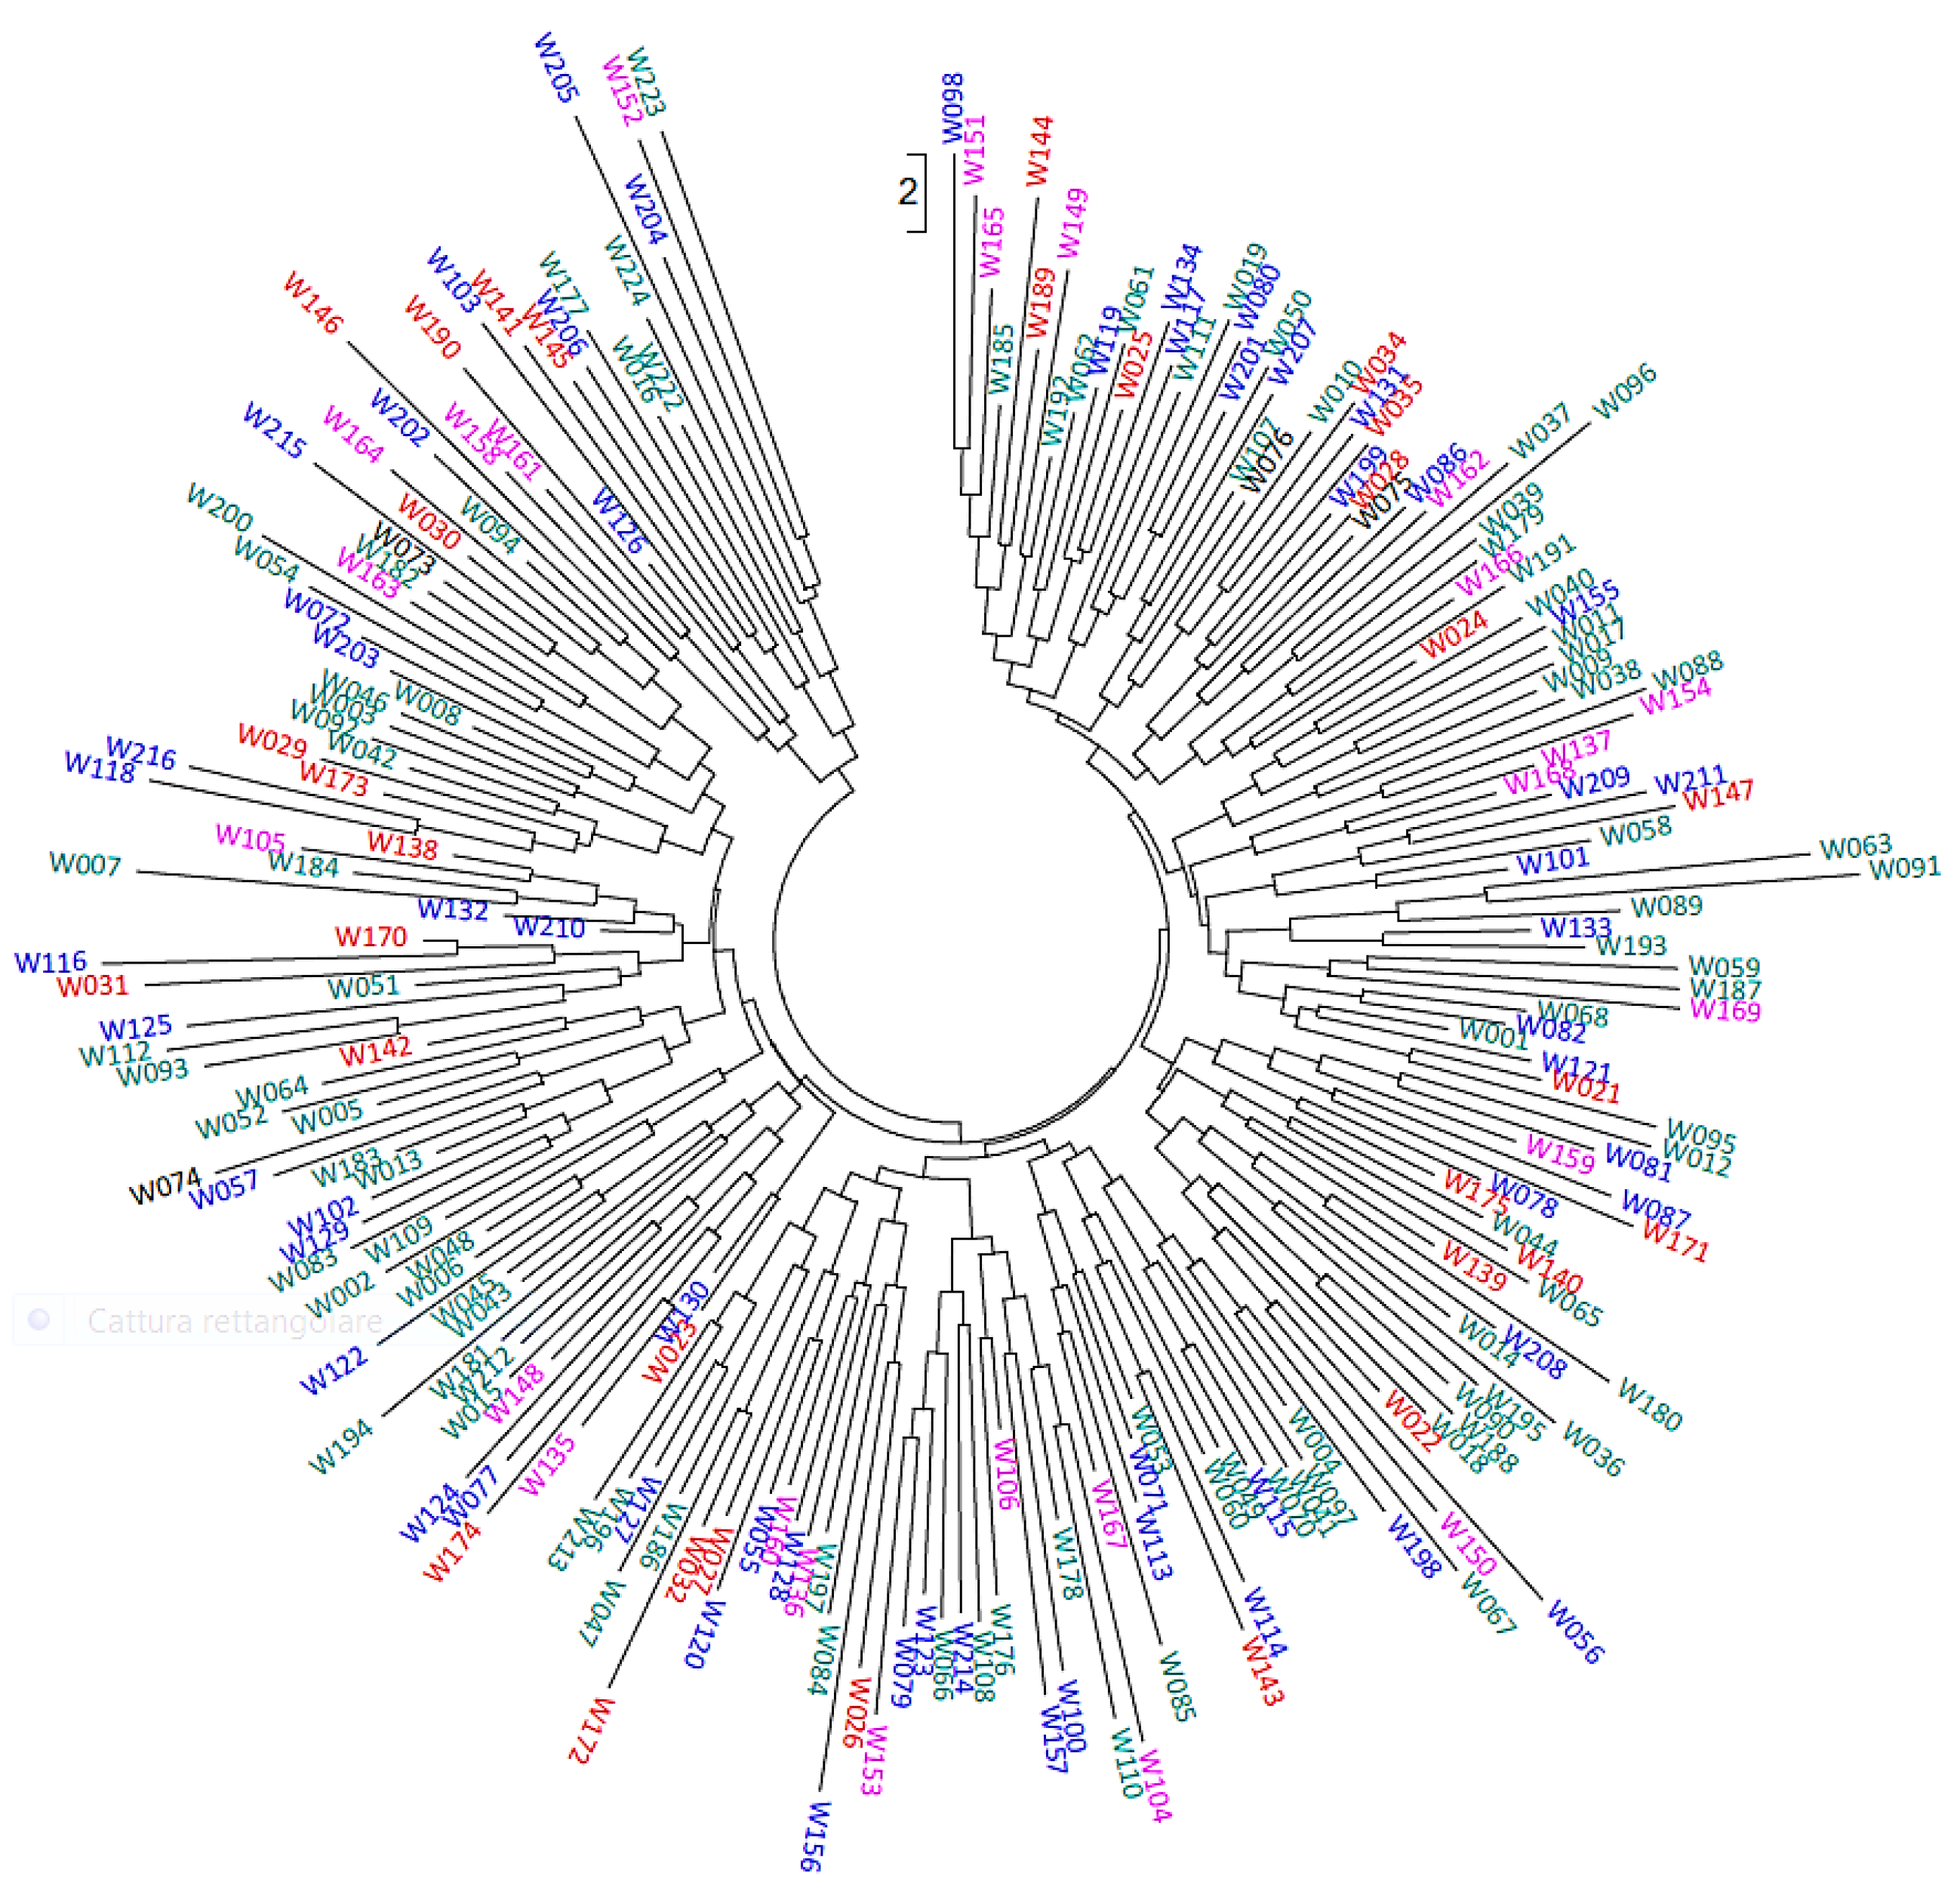
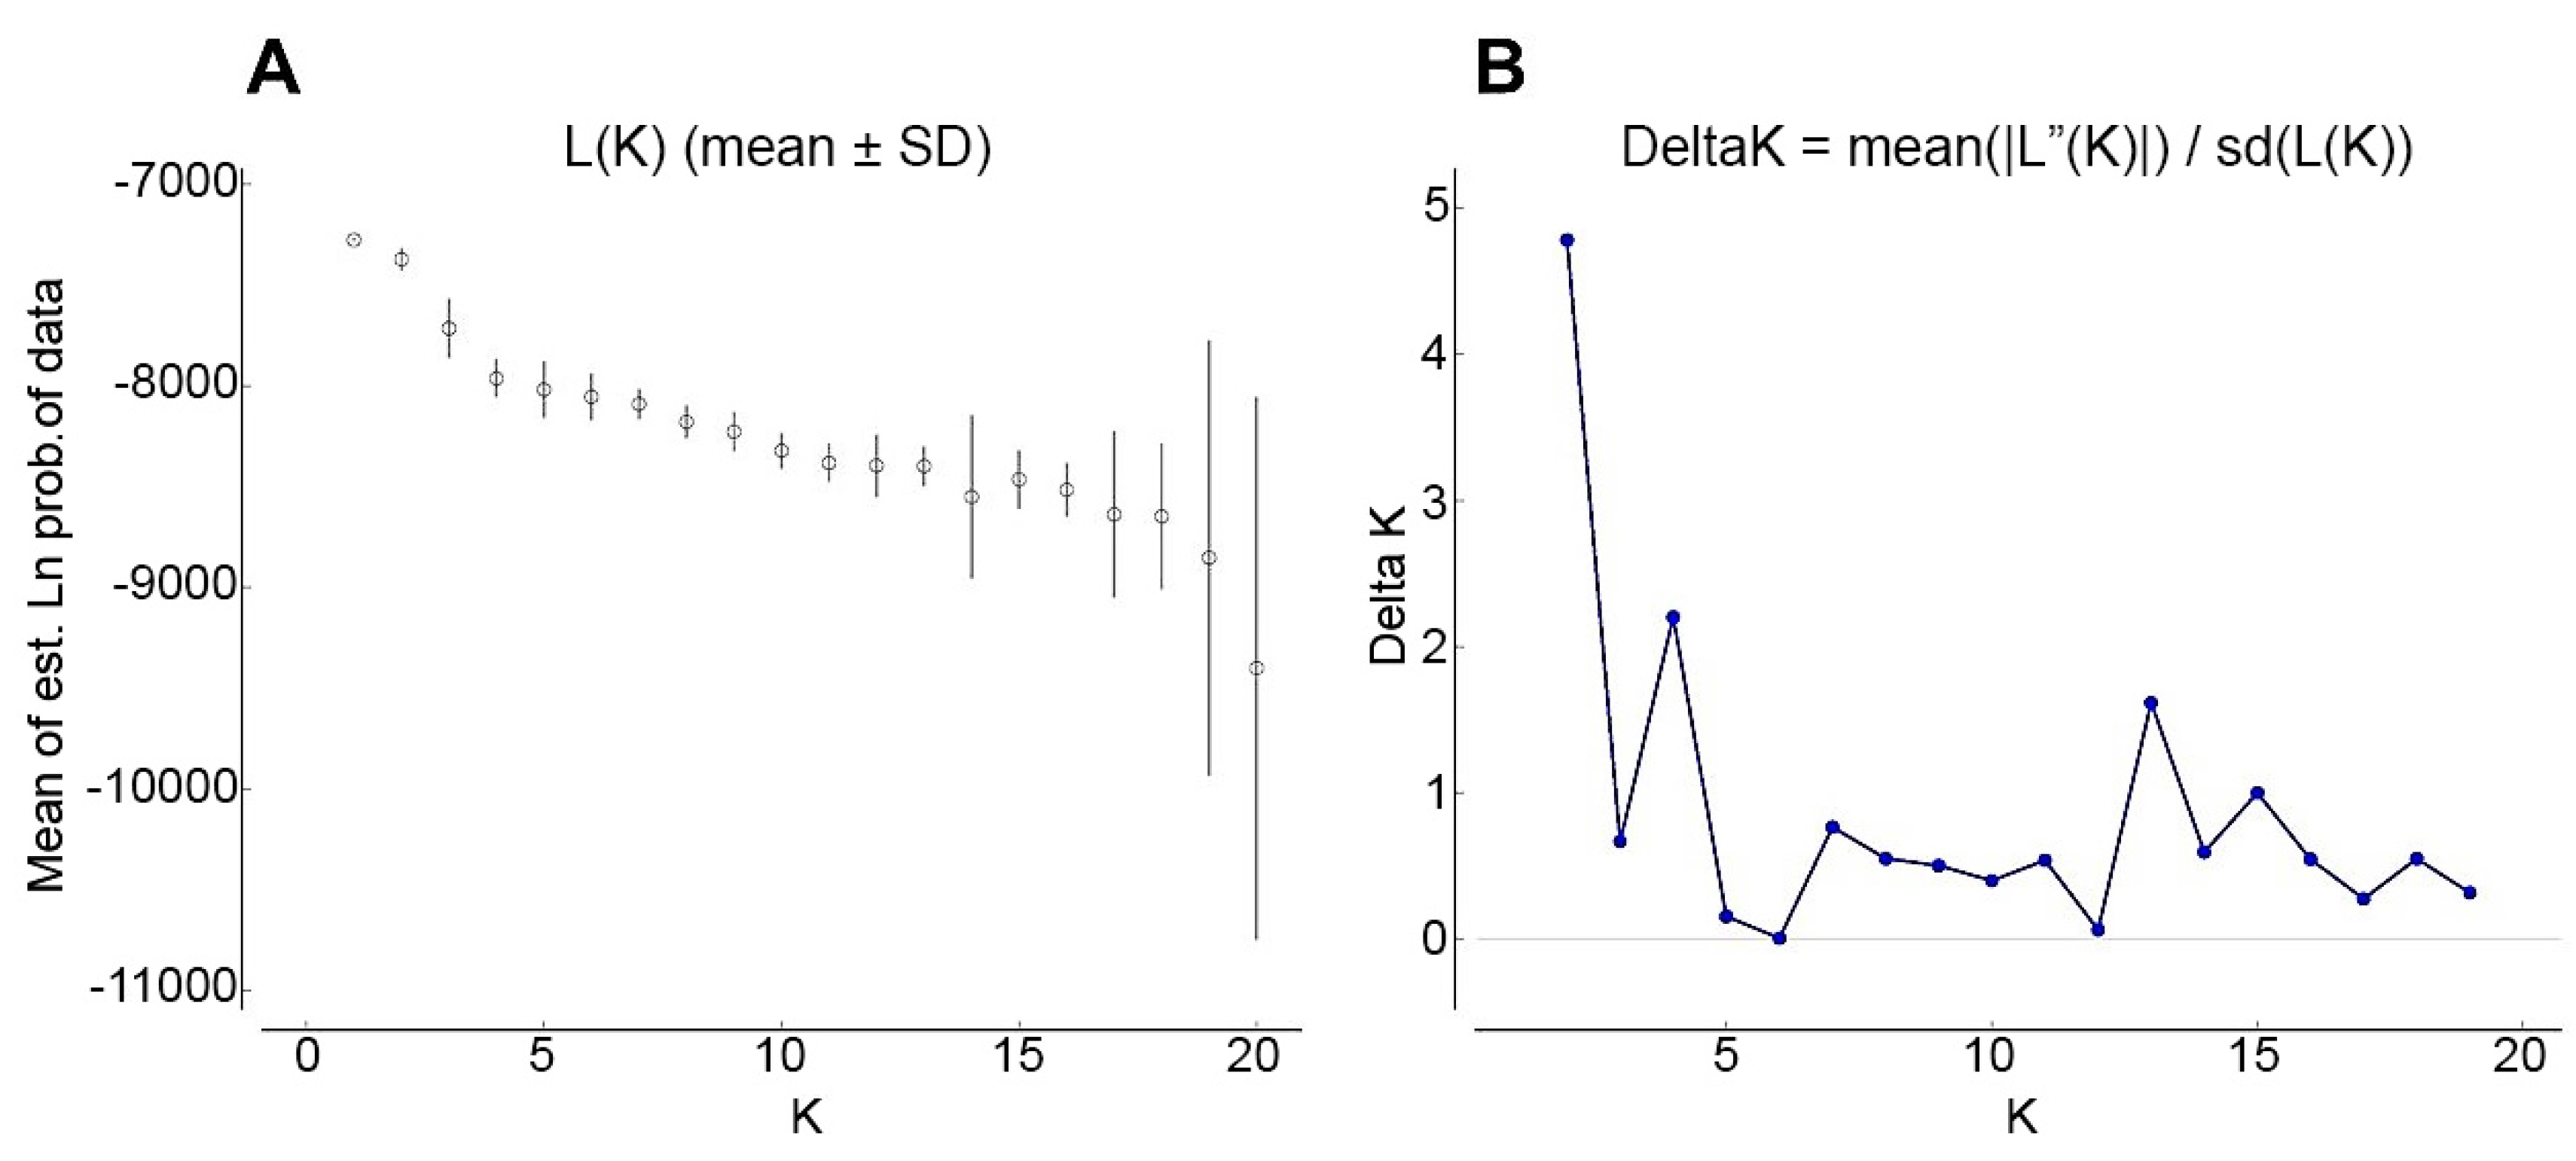
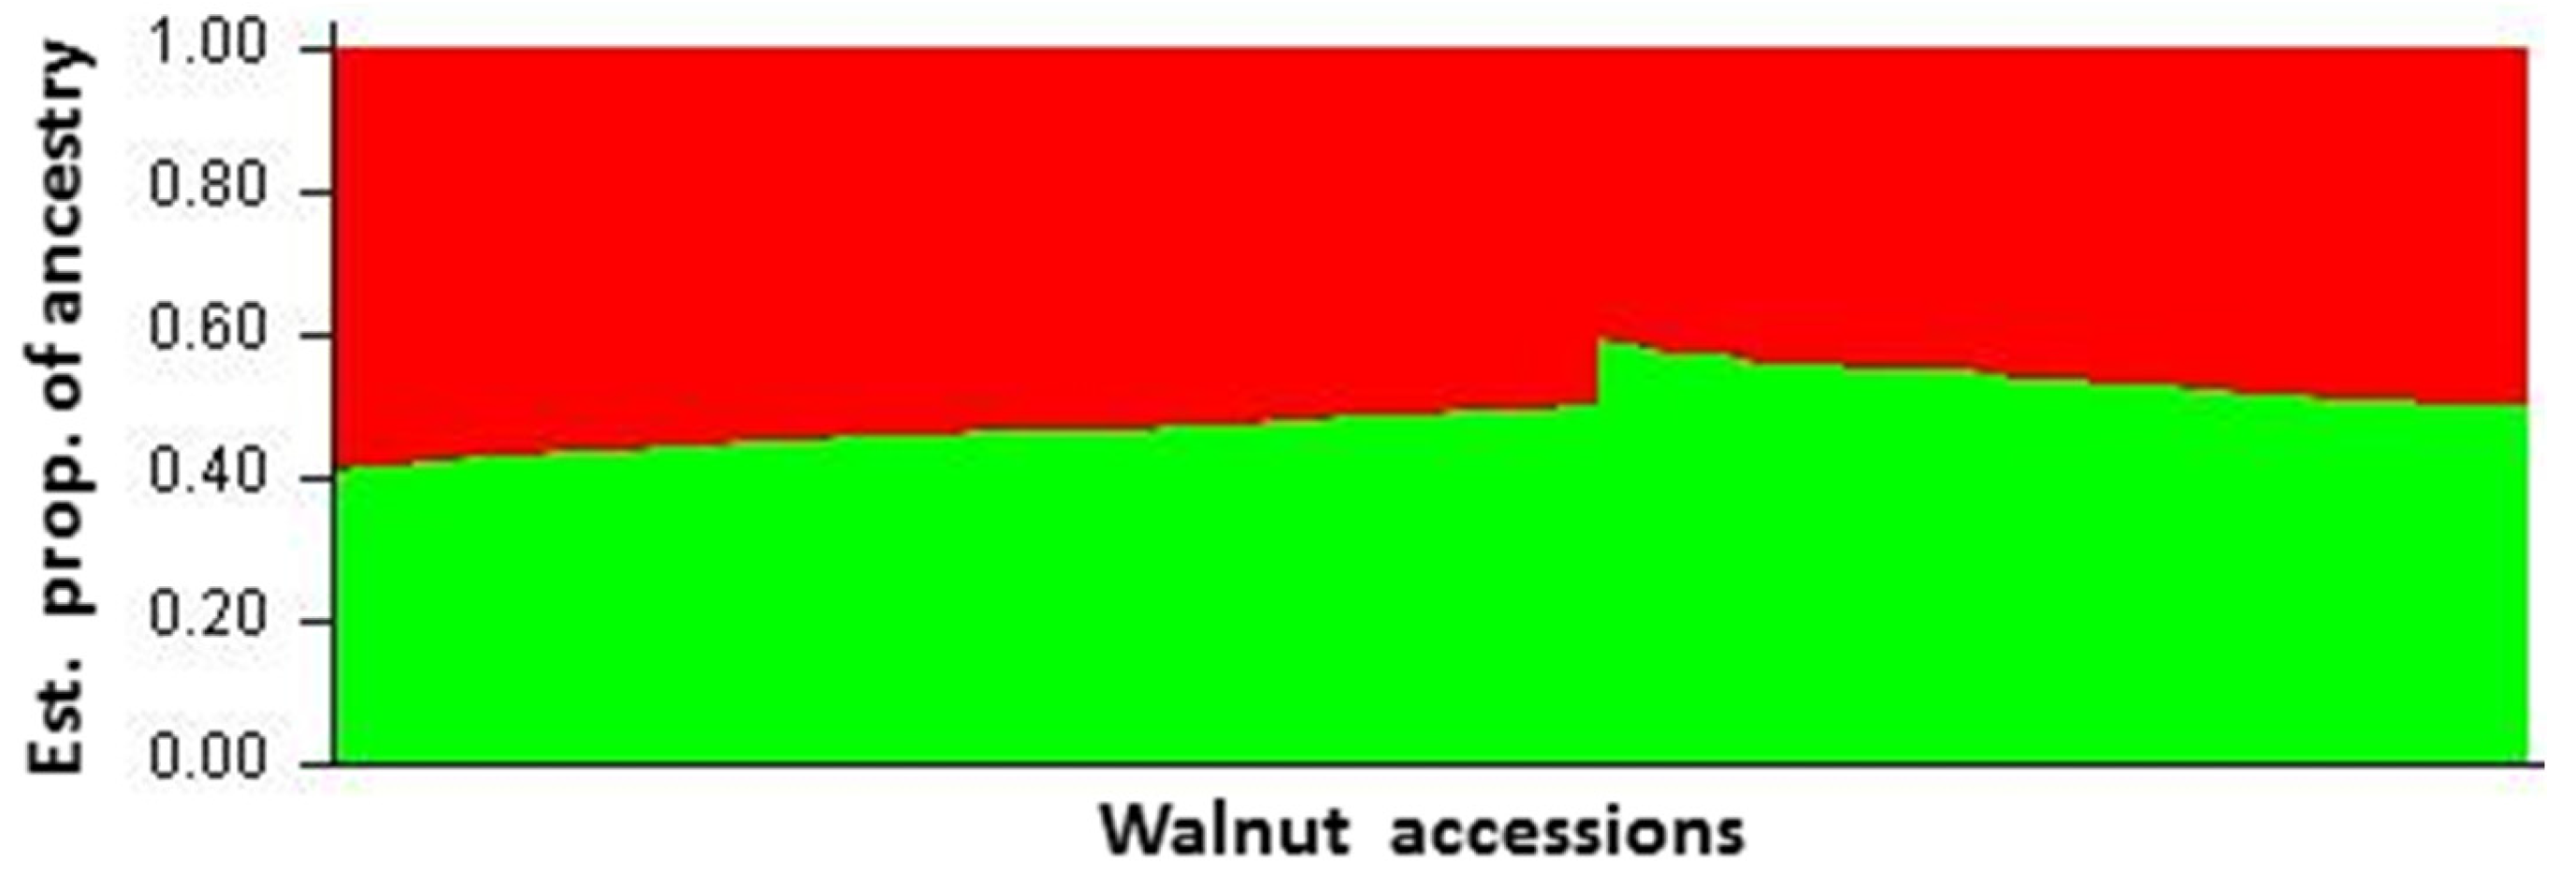
3.2. Hierarchical and Model-Based Clustering of Walnut Accessions

The clusters that could be identified in the tree topology, according to the level of similarity selected (Figure 2), did not group individuals according to their geographical origin. Frequently, accessions sampled from adjacent locations were clustered far away from each other. Although such evidence has already been reported for Italian walnut germplasm [24], it is not easy to explain such an unexpected outcome. From the evidence of the current study it would seem likely that the accession clustering is the result of the traditional ways that walnuts have been distributed across the region. In previous centuries, and especially in the 19th and 20th centuries, fruits collected in the alpine valleys were traditionally sold in markets across the entire region during local festivals. We have found traces of this traditional nut market in local books and leaflets (cited in [57]). The analysis of molecular variance (AMOVA) confirmed that the differences between the populations accounted for only 2.12% of the entire variance, while the variability within populations accounted for 97.87% (Table 3). The Mantel test did not reveal any significant correlation between geographic and genetic distances among accessions (data not shown). The pairwise comparisons of populations for FST did not show any apparent subdivision of the whole population in the study (Table 4), thus confirming the large genetic admixture observed with other analyses. A further analysis carried out by splitting the whole population into the five geographic sub-populations confirmed that the whole population should be correctly treated as a non-subdivided population. The only new information obtained from such an analysis was the existence of private alleles, that is alleles carried by a single individual accession (Table 5). The existence of accessions with private alleles could have the significance of an incipient genetic isolation of those accessions from the original population or sub-population, but when private alleles of a single accessions are one or very few, as this is the case, no prediction can be made on the evolution of population fragmentation. The situation could not be permanent and gene flow could change by the modification of the genetic and geographical barriers. The genetic structure was investigated by two further approaches: the first one based on the Bayesian cluster analysis implemented in STRUCTURE [47] and a second one represented by the spatial clustering model as implemented in Geneland. The advantage of using spatial vs. non-spatial clustering models lies in the ability to obtain more accurate results when the number of loci is relatively small and data are characterized by low levels of genetic differentiation [52,53]. In the first case, the analysis strongly supported two clusters with K = 2 corresponding to the maximum ∆K (delta K) (Figure 3A,B). We did not find any apparent common feature, such as the geographic origin, among the samples belonging to the same cluster (Figure 4). The results of Geneland analyses were consistent with STRUCTURE by clearly showing that the same two distinct clusters can be identified in the study area (Figure 4 and Figure 5A). In addition, Geneland indicated that the genetic differentiation between the two subpopulations (clusters 1 and 2) is small (FST = 0.033), thereby showing a similar genetic structure. In particular, cluster 1 showed a higher FIS value (0.21) with respect to cluster 2 (0.05), indicating a higher deficit of heterozygotes in the cluster 1. It is noteworthy that cluster 1 is composed of the individuals W156, W157, and W216 (Figure 5B,C). The kinship coefficient (Fij) between W156 and W157 was 0.25, indicating a full sib origin. The W216 individual has a Fij equal to 0.02 with individual W157, and a negative value with all the other individuals analyzed. Therefore, even if the relationship between the W216 and W157 individuals is very low, this is sufficient to explain the presence of W216 in cluster 1.

4. Conclusions

Considering the large number of accessions collected in the sampling area, we are confident that we have sampled a good representation of the genetic diversity of walnuts in the Friuli Venezia Giulia region. If we exclude the EST-derived markers, which showed very low polymorphism, the genetic metrics observed in the 13 genomic markers of the study were similar to those reported by Pollegioni et al. [24]. These authors reported that the common markers analyzed in 456 walnut trees sampled in Italy were substantially comparable with earlier reports that considered large regional or national sampling [18,22]. As stated by other authors, the genetic diversity of J. regia investigated primarily on a national or regional scale across Eurasia has revealed low levels of genetic differentiation among populations and no robust geographic patterns of genetic diversity [10,12,24], and this has been reinforced by the current work, even though it was carried out on a limited geographical scale. The reasons for such moderate genetic diversity are not easily determined. One hypothesis is that the reservoirs of walnut genetic diversity in Europe were largely eroded during the last glacial maximum [14]; the second hypothesis, which is not in contrast with the first one, rules out that the re-introduction of walnut from the Western Asia by humans suffered a bottleneck [12], and has not been mitigated by the few generations that have passed in the intervening 2000 years. Historians report a well-developed walnut industry in the sub-alpine arch surrounding the Friuli plain. The people of Carnia and the Torre and Natisone valleys attended local festivals bringing and selling their nuts collected from the wild or grown in their courtyards from heirloom seed [57]. Walnut seeds were for human consumption, but they were occasionally planted at the birth of children in looking ahead to their eventual marriages, at which time the trees were cut to craft furniture for the new family. This dispersal of seeds could explain the inability of the dendrogram of genetic distances among accessions to group samples according to neighborhood, but instead it distributed the local samples into numerous clusters that did not represent any of the geographical areas identified at the time of planning the study. The walnut admixture we report as a result of human traditions and heirloom management has a strong homology with the kin groups or ‘households’ reported for the walnut population structure of germplasm studied in Tibetan villages by Gunn et al. [10].

Supplementary Materials

The following are available online at www.mdpi.com/1999-4907/8/3/81/s1, Table S1: Database of the accessions and their molecular profiles at 20 SSR markers analyzed in this study. The 19 bp of the primer pigtail have been removed to make the SSR fragment sizes comparable with those in the literature. Missing data are reported as 0 (zero).

Acknowledgments

The authors would like to thank Giorgio Comuzzo, Riccardo De Infanti, Renato Frezza, Luca Gos, Michela Cesarina Mason, and Tiziano Cattaruzzi for participating in collecting samples. The authors are also grateful to local communities for assistance in identifying the oldest trees and for the stories of individual trees that they often reported. The research was partially supported by the Banca del Germoplasma Autoctono Vegetale Regionale (Bank of the Regional Plant Autochthonous Germplasm) del Friuli Venezia Giulia.

Author Contributions

M.V., L.P., and R.T. conceived and designed the experiments; M.V., C.C., S.R., L.P., and R.M. performed the DNA genotyping and the first control on data; M.V., L.P., P.E., G.C., D.P., C.V., and R.T. analyzed the data; M.V., L.P., G.C., C.V., and R.T. wrote the paper. All authors contributed to the revision of the manuscript and approved the version submitted.

Conflicts of Interest

The authors declare no conflict of interest.

References

  1. Manning, W.E. The classification within the Juglandaceae. Ann. MO. Bot. Gard. 1978, 65, 1058–1087. [Google Scholar] [CrossRef]
  2. Manchester, S.R. The fossil history of the Juglandaceae. In Monographs in Systematic Botany; Missouri Bot Garden: St. Louis, MO, USA, 1987; Volume 21, pp. 1–137. [Google Scholar]
  3. Willis, K.J.; McElwain, J.C. The Evolution of Plants; Oxford University Press: New York, NY, USA, 2002; p. 378. [Google Scholar]
  4. McGranahan, G.H.; Leslie, C. Walnuts (Juglans). In Genetic Resources of Temperate Fruit and Nut Crops; Moore, J.N., Ballington, J.R., Eds.; International Society for Horticultural Science: Wageningen, The Netherlands, 1991; pp. 907–951. [Google Scholar]
  5. Vavilov, N.I. The wild relatives of fruit trees of the Asian part of the USSR and Caucasus and problems of origin of fruit trees. Tr. Po Prikl. Bot. Genet. Sel. 1931, 23, 343–360. (In Russian) [Google Scholar]
  6. Molnar, T.J.; Zaurov, D.E.; Capik, J.M.; Eisenman, S.W.; Ford, T.; Nikolyi, L.V.; Funk, C.R. Persian walnuts (Juglans regia L.) in Central Asia. Annu. Rep. North Nut. Grow Assoc. 2011, 101, 56–69. [Google Scholar]
  7. Carrión, J.S.; Sanchez-Gomez, P. Palynological data in support of the survival of walnut (Juglans regia L.) in the western Mediterranean area during last glacial times. J. Biogeogr. 1992, 19, 623–630. [Google Scholar] [CrossRef]
  8. Figueiral, I.; Terral, J. Late Quaternary refugia of Mediterranean taxa in the Portuguese Estremadura: Charcoal based palaeovegetation and climatic reconstruction. Quat. Sci. Rev. 2002, 21, 549–558. [Google Scholar] [CrossRef]
  9. Beer, R.; Kaiser, F.; Schmidt, K.; Ammann, B.; Carraro, G.; Grisa, E.; Tinner, W. Vegetation history of the walnut forests in Kyrgyzstan (Central Asia): Natural or anthropogenic origin? Quat. Sci. Rev. 2008, 27, 621–632. [Google Scholar] [CrossRef]
  10. Gunn, B.F.; Aradhya, M.; Salick, J.M.; Miller, A.J.; Yongping, Y.; Lin, L.; Xian, H. Genetic variation in walnuts (Juglans regia and J sigillata; Juglandaceae): Species distinctions, human impacts, and the conservation of agrobiodiversity in Yunnan, China. Am. J. Bot. 2010. [Google Scholar] [CrossRef] [PubMed]
  11. Epple, C. A vegetation study in the walnut and fruit-tree forests of Southern Kyrgyzstan. Phytocoenologia 2001, 31, 571–604. [Google Scholar] [CrossRef]
  12. Pollegioni, P.; Woeste, K.E.; Chiocchini, F.; Olimpieri, I.; Tortolano, V.; Clark, J.; Hemery, G.E.; Mapelli, S.; Maria, E.M. Landscape genetics of Persian walnut (Juglans regia L.) across its Asian range. Tree Genet. Genomes 2014. [Google Scholar] [CrossRef]
  13. Pollegioni, P.; Woeste, K.E.; Chiocchini, F.; Del Lungo, S.; Olimpieri, I.; Tortolano, V.; Clark, J.; Hemery, G.E.; Mapelli, S.; Malvolti, M.E. Ancient Humans Influenced the Current Spatial Genetic Structure of Common Walnut Populations in Asia. PLoS ONE 2015. [Google Scholar] [CrossRef] [PubMed]
  14. Bottema, S. The Holocene history of walnut, sweet-chestnut, manna-ash and plane tree in the Eastern Mediterranean. Pallas 2000, 52, 35–59. [Google Scholar]
  15. Poldini, L. Atlante Corologico Delle Piante Vascolari Nel Friuli-Venezia Giulia: Inventario Floristico Regionale; Arti Grafiche Friulane: Udine, Italy, 1991; p. 899. [Google Scholar]
  16. Rottoli, M.; Castiglioni, E. Prehistory of plant growing and collecting in northern Italy, based on seed remains from the early Neolithic to the Chalcolithic (c. 5600–2100 cal b.c.). Veg. Hist. Archaeol. 2009, 18, 91–103. [Google Scholar] [CrossRef]
  17. Woeste, K.; Burns, R.; Rhodes, O.; Michler, C. Thirty polymorphic nuclear microsatellite loci from black walnut. J. Hered. 2002, 93, 58–60. [Google Scholar] [CrossRef] [PubMed]
  18. Dangl, G.S.; Woeste, K.; Ardhya, M.K.; Koehmstedt, A.; Simon, C. Characterization of 14 microsatellite markers for genetic analysis and cultivar identification of walnut. J. Am. Soc. Hortic. Sci. 2005, 130, 348–354. [Google Scholar]
  19. Foroni, I.; Rao, R.; Woeste, K.; Gallitelli, M. Characterization of Juglans regia L. through SSR markers and evaluation of genetic relationships among cultivars and the ‘Sorrento’ landrace. J. Hortic. Sci. Biotechnol. 2005, 80, 49–53. [Google Scholar] [CrossRef]
  20. Wang, H.; Pei, D. Genetic diversity and structure of walnut populations in Central and Southwestern China revealed by microsatellite markers. J. Am. Soc. Hortic. Sci. 2008, 133, 197–203. [Google Scholar]
  21. Pollegioni, P.; Woeste, K.; Mugnozza, G.S.; Malvolti, M.E. Retrospective identification of hybridogenic walnut plants by SSR fingerprinting and parentage analysis. Mol. Breed. 2009, 24, 321–335. [Google Scholar] [CrossRef]
  22. Zhang, R.; Zhu, A.D.; Wang, X.L.; Yu, J.; Zhang, H.R.; Gao, J.S.; Cheng, Y.J.; Deng, X.X. Development of Juglans regia SSR Markers by Data Mining of the EST Database. Plant Mol. Biol. Rep. 2010, 28, 646–653. [Google Scholar] [CrossRef]
  23. Ebrahimi, A.; Fatahi, R.; Zamani, Z. Analysis of genetic diversity among some Persian walnut genotypes (Juglans regia L.) using morphological traits and SSRs markers. Sci. Hortic. 2011, 130, 146–151. [Google Scholar] [CrossRef]
  24. Pollegioni, P.; Woeste, K.; Olimpieri, I.; Marandola, D.; Cannata, F.; Malvolti, M.E. Long-term human impacts on genetic structure of Italian walnut inferred by SSR markers. Tree Genet. Genomes 2011, 7, 707–723. [Google Scholar] [CrossRef]
  25. Ruiz-Garcia, L.; Lopez-Ortega, G.; Fuentes Denia, A.; Frutos Tomas, D. Identification of a walnut (Juglans regia L.) germplasm collection and evaluation of their genetic variability by microsatellite markers. Span. J. Agric. Res. 2011, 9, 179–192. [Google Scholar] [CrossRef]
  26. Zhang, Z.Y.; Han, J.W.; Jin, Q.; Wang, Y.; Pang, X.M.; Li, Y.Y. Development and characterization of new microsatellites for walnut (Juglans regia). Genet. Mol. Res. 2013, 12, 4723–4734. [Google Scholar] [CrossRef] [PubMed]
  27. Manly, B.F.J. The Statistics of Natural Selection on Animal Populations; Chapman and Hall: London, UK, 1985; pp. 272–282. [Google Scholar]
  28. Yeh, F.C.; Boyle, T.E. Population genetic analysis of co-dominant and dominant markers and quantitative traits. Belg. J. Bot. 1997, 129, 129–157. [Google Scholar]
  29. Schuelke, M. An economic method for the fluorescent labeling of PCR fragments. Nat. Biotechnol. 2000, 18, 233–234. [Google Scholar] [CrossRef] [PubMed]
  30. Boutin-Ganache, I.; Raposo, M.; Raymond, M.; Deschepper, C.F. M13-tailed primers improve the readability and usability of microsatellite analyses performed with two different allele-sizing methods. Biotechniques 2001, 31, 24–28. [Google Scholar] [PubMed]
  31. Liu, K.; Muse, S.V. PowerMarker: An integrated analysis environment for genetic marker analysis. Bioinformatics 2005, 21, 2128–2129. [Google Scholar] [CrossRef] [PubMed]
  32. Waits, L.P.; Luikart, G.; Taberlet, P. Estimating the probability of identity among genotypes in natural populations: Cautions and guidelines. Mol. Ecol. 2001, 10, 249–256. [Google Scholar] [CrossRef] [PubMed]
  33. Marshall, T.C.; Slate, J.; Kruuk, L.E.B.; Pemberton, J.M. Statistical confidence for likelihood-based paternity inference in natural populations. Mol. Ecol. 1998, 7, 639–655. [Google Scholar] [CrossRef] [PubMed]
  34. Kalinowski, S.T.; Taper, M.L.; Marshall, T.C. Revising how the computer program CERVUS accommodates genotyping error increases success in paternity assignment. Mol. Ecol. 2007, 16, 1099–1106. [Google Scholar] [CrossRef] [PubMed]
  35. Kalinowski, S.T.; Taper, M.L. Maximum likelihood estimation of the frequency of null alleles at microsatellite loci. Conserv. Genet. 2006. [Google Scholar] [CrossRef]
  36. Loiselle, B.A.; Sork, V.L.; Nason, J.; Graham, C. Spatial genetic structure of a tropical understory shrub, Psychotria officinalis (Rubiaceae). Am. J. Bot. 1995, 82, 1420–1425. [Google Scholar] [CrossRef]
  37. Hardy, O.J.; Vekemans, X. SPAGeDi: A versatile computer program to analyse spatial genetic structure at the individual or population levels. Mol. Ecol. Notes 2002, 2, 618–620. [Google Scholar] [CrossRef]
  38. Sokal, R.R.; Rohlf, F.J. Biometry: The Principles and Practice of Statistics in Biological Research, 3rd ed.; W.H. Freeman, and Company: New York, NY, USA, 1995; 887p. [Google Scholar]
  39. Peakall, R.; Smouse, P.E. GENALEX 6: Genetic analysis in Excel. Population genetic software for teaching and research. Mol. Ecol. Notes 2006, 6, 288–295. [Google Scholar] [CrossRef]
  40. Kalinowski, S.T. Counting alleles with rarefaction: Private alleles and hierarchical sampling designs. Conserv. Genet. 2004, 5, 539–543. [Google Scholar] [CrossRef]
  41. Kalinowski, S.T. HP-Rare: A computer program for performing rarefaction on measures of allelic diversity. Mol. Ecol. Notes 2005, 5, 187–189. [Google Scholar] [CrossRef]
  42. Peakall, R.; Smouse, P.E. GenAlEx 6.5: Genetic analysis in Excel. Population genetic software for teaching and research—An update. Bioinformatics 2012, 28, 2537–2539. [Google Scholar] [CrossRef] [PubMed]
  43. Mantel, N.A. The detection of disease clustering and a generalized regression approach. Cancer Res. 1967, 27, 209–220. [Google Scholar] [PubMed]
  44. Saitou, N.; Nei, M. The neighbor-joining method: A new method for reconstructing phylogenetic trees. Mol. Biol. Evol. 1987, 4, 406–425. [Google Scholar] [PubMed]
  45. Tamura, K.; Stecher, G.; Peterson, D.; Filipski, A.; Kumar, S. MEGA6: Molecular Evolutionary Genetics Analysis Version 6.0. Mol. Biol. Evol. 2013, 30, 2725–2729. [Google Scholar] [CrossRef] [PubMed]
  46. Page, R.D. TreeView: An application to display phylogenetic trees on personal computers. Comput. Appl. Biosci. 1996, 12, 357–358. [Google Scholar] [PubMed]
  47. Pritchard, J.K.; Stephens, M.; Donnelly, P. Inference of population structure from multi-locus genotype data. Genetics 2000, 155, 945–959. [Google Scholar] [PubMed]
  48. Falush, D.; Stephens, M.; Pritchard, J.K. Inference of population structure using multilocus genotype data: Linked loci and correlated allele frequencies. Genetics 2003, 164, 1567–1587. [Google Scholar] [PubMed]
  49. Pritchard, J.K.; Wen, W.; Falush, D. Documentation for Structure Software: Version 2.3; Department of Human Genetics, University of Chicago: Chicago, IL, USA, 2010; p. 38. [Google Scholar]
  50. Evanno, G.; Regnaut, S.; Goudet, J. Detecting the number of clusters of individuals using the software STRUCTURE: A simulation study. Mol. Ecol. 2005, 14, 2611–2620. [Google Scholar] [CrossRef] [PubMed]
  51. Earl, D.A.; vonHoldt, B.M. STRUCTURE HARVESTER: A website and program for visualizing STRUCTURE output and implementing the Evanno method. Conserv. Genet. Res. 2012, 4, 359–361. [Google Scholar] [CrossRef]
  52. Guillot, G.; Leblois, R.; Coulon, A.; Frantz, A.C. Statistical methods in spatial genetics. Mol. Ecol. 2009, 18, 4734–4756. [Google Scholar] [CrossRef] [PubMed]
  53. Guillot, G.; Estoup, A.; Mortier, F.; Cosson, J.F. A spatial statistical model for landscape genetics. Genetics 2005, 170, 1261–1280. [Google Scholar] [CrossRef] [PubMed]
  54. Guillot, G.; Mortier, F.; Estoup, A. Geneland: A computer package for landscape genetics. Mol. Ecol. Notes 2005, 5, 712–715. [Google Scholar] [CrossRef]
  55. Guillot, G.; Santos, F.; Estoup, A. Analysing georeferenced population genetics data with Geneland: A new algorithm to deal with null alleles and a friendly graphical user interface. Bioinformatics 2008, 24, 1406–1407. [Google Scholar] [CrossRef] [PubMed]
  56. Guillot, G. Inference of structure in subdivided populations at low levels of genetic differentiation. The correlated allele frequencies model revisited. Bioinformatics 2008, 24, 2222–2228. [Google Scholar] [CrossRef] [PubMed]
  57. Youssef, J.; Nassimbeni, P.L. La frutticoltura nel Friuli-Venezia Giulia. Origine, situazione e prospettive (Fruit-growing in Friuli-Venezia Giulia. Origin, situation and prospects) (IN ITALIAN). Frutticoltura 1977, 39, 19–45. [Google Scholar]
Figure 1. (A) General map with a red circle representing the region of study; (B) Explosion of the sampling areas, for the color code see the legend below.
Forests 08 00081 g001

ColorGeographic Area
Forests 08 00081 i001Western Alpine Highlands
Forests 08 00081 i002Eastern Alpine Highlands
Forests 08 00081 i003Torre Natisone Valleys
Forests 08 00081 i004Friuli Plains
Forests 08 00081 i005Trieste Karst
Figure 2. UPGMA (Unweighted Pair Group Method with Arithmetic Mean)-based circular dendrogram showing genetic similarities between the 215 walnut (Juglans regia L.) accessions analyzed as listed in the Supplementary Material, Table S1. Accessions from the same geographic area have the same color (see the legend in Figure 1B for association of the colors with the geographical areas).
Forests 08 00081 g002
Figure 3. Inference of K, the most probable number of clusters, using STRUCTURE software, based on microsatellite analysis of 215 walnut samples. (A) Plot of mean likelihood L(K) and variance per K value from STRUCTURE on a dataset containing 215 individuals genotyped for 20 polymorphic microsatellite loci over 20 runs for each K value; (B) Plot of the ad hoc statistic ΔK, which is based on the rate of change of the log-likelihood as K is increased) [50] ΔK tends to peak at the value of K that corresponds to the highest level of hierarchical substructure. The modal value of this distribution is the true K, here two clusters.
Forests 08 00081 g003
Figure 4. Population structure inference for 215 walnut (Juglans regia L.) accessions as assigned using STRUCTURE [47] and the admixture option for K = 2 (see text for details). Vertical bars represent individual accessions. The length of segment color in each vertical bar represents the proportion contributed by each of the two populations in the model (represented by different colors) to that individual.
Forests 08 00081 g004
Figure 5. Results of Geneland analysis of 215 walnut (Juglans regia L.) accessions for K = 2. (A) Map of estimated population membership plotted on Google maps, with cluster 1 in green and cluster 2 in white. The accession IDs of the three individuals in cluster 1 are recorded (see text for details); (B) and (C) are maps of posterior probabilities of cluster 1 and cluster 2, respectively. Contour lines represent posterior probabilities of belonging to cluster 1 (B) and 2 (C).
Forests 08 00081 g005
Table 1. List of the 20 Simple Sequence Repeat (SSR) markers selected from the literature for this study.
SSR CodeRepeat ArrayForward PrimerReverse PrimerTanneal (°C) (a)Reference
WGA001(GA)5GCA(GA)3GCA(GA)3attggaagggaagggaaatgcgcgcacatacgtaaatcac48–58Dangl et al., 2005 [18]
WGA004(GT)5,(GA)15,(GA)11tgttgcattgacccacttgttaagccaacatggtatgcca50–58Woeste et al., 2002 [17]
WGA009(GA)16catcaaagcaagcaatgggccattgctctgtgattggg48–58Dangl et al., 2005 [18]
WGA027(GA)30aaccctacaacgccttgatgtgctcaggctccacttcc51–55Woeste et al., 2002 [17]
WGA069(GA)4ATATAA(GA)16ttagttagcaaacccacccgagatgcacagaccaaccctc45–58Woeste et al., 2002 [17]
WGA071(GA)6,(G)12acccgagagatttctgggatggacccagctcctcttctct45Woeste et al., 2002 [17]
WGA072(CT)14aaaccacctaaaaccctgcaacccatccatgatcttccaa55–58Woeste et al., 2002 [17]
WGA089(GT)13(GA)21acccatctttcacgtgtgtgtgcctaattagcaatttcca53–58Dangl et al., 2005 [18]
WGA118(GA)18(GT)11tgtgctctgatctgcctccgggtgggtgaaaagtagcaa55–62Dangl et al., 2005 [18]
WGA225(AG)14caatccctctcctgggcagtgttccactgaccacttccan.r.Dangl et al., 2005 [18] (b)
WGA321(GA)14tccaatcgaaactccaaaggtgtccaaagacgatgatgga50–58Dangl et al., 2005 [18]
WGA331(GA)13tccccctgaaatcttctcctcggtggtgtaaggcaaatg53–58Dangl et al., 2005 [18]
WGA349(CT)14gtggcgaaagtttattttttgcacaaatgcacagcagcaaacn.r.Dangl et al., 2005 [18] (b)
WGA376(AG)2AA(AG)6gccctcaaagtgatgaacgttcatccatatttacccctttcgn.r.Dangl et al., 2005 [18] (b)
Contig_40(CTGT)5tgggctgagctggattgccgttccaccgtcatggtttccacg59Zhang et al., 2010 [22]
Contig_156(TTTG)6tgcaagagtggcgcaggcactgtggtagcctaatctcatggctcg60Zhang et al., 2010 [22]
Contig_642(CAG)7tgaaaggttttggcctccaatggtgagatcatgggctgcctgtagg59Zhang et al., 2010 [22]
Contig_721(CTT)8accccttggtttgaactgcgacagatccaactttcgcgtggaac57Zhang et al., 2010 [22]
Contig_1528(CCT)7ccgaagagatcctaagctcaaccgaggtggaaatgatggtggggtg59Zhang et al., 2010 [22]
Contig_1681(TTC)8agagatttctccaggaaggctcctctggtggccaacgatagccga62Zhang et al., 2010 [22]
Contig_1692(CCA)6caatggtcagtttccgtccgatccgagctcgaatacttctcgtcg58Zhang et al., 2010 [22]
(a) The annealing temperature from the literature, n.r. = not reported; (b) The core repeat for these markers was recovered from the NCBI (National Center of Biotechnology Information) database of walnut sequences.
Table 2. Genetic metrics of the 20 SSR markers tested on the whole set of walnut accessions: number of alleles, allele size ranges, number of genotypes, observed heterozygosity (Ho), gene diversity (GD), polymorphism information content (PIC), major allele frequency without null alleles (MAF), Hardy-Weinberg equilibrium (HW), estimated frequency of null alleles (Fnull), and probability of identity (PID) for unrelated individuals and full-sibs.
SSR MarkerSamples nAlleles nSize Range bp (b)Genotypes nHoGDPICMAFHWFnullPID UnrelatedPID Full-Sibs
Genomic SSR
WGA0042152228–23830.6190.4820.3650.60**−0.1250.3850.606
WGA0092153229–24560.6190.6390.5610.40NS+0.0160.2080.483
WGA0272122206–21030.5330.4880.3680.58NS−0.0460.3820.602
WGA0692099160–182180.6560.7450.6980.32NS+0.0630.1110.406
WGA0712093205–20940.4980.5030.3810.54NS+0.0020.3690.591
WGA0722145128–14260.4110.4670.3680.64NS+0.0580.3830.613
WGA0892154212–22070.7120.6730.5990.33NS−0.0290.1800.459
WGA1182157185–207110.5810.5810.4900.48NS−0.0040.2670.527
WGA2251943190–20260.5670.6440.5660.40NS+0.0630.2040.480
WGA3212155223–245120.6420.6740.6080.41NS+0.0250.1720.457
WGA3312144273–27960.4810.4840.3730.60NS+0.0030.3770.603
WGA3492056262–276110.4050.6460.5910.51***+0.2260.1800.473
WGA3762048231–256170.5250.6340.5940.56*+0.0940.1740.477
Mean 4.7 8.50.5580.5890.5050.49
 EST-derived SSR
Contig_402153210–22340.3490.3400.2860.79NS−0.0050.4900.703
Contig_1562152300–31330.4330.4930.3710.56NS+0.0640.3790.599
Contig_6422152262–28130.4880.4940.3710.56NS+0.0040.3790.598
Contig_7212153369–39040.0510.0590.0580.97ND+0.0680.8870.942
Contig_15282153154–16360.5530.5620.4630.50NS+0.0080.2900.542
Contig_16812154197–21090.6190.6470.5760.46NS+0.0230.1960.476
Contig_16922152208–21120.0740.0720.0690.96ND−0.0100.8640.930
Mean 2.7 4.40.3670.3810.3130.69
 General Mean (a)4.0 6.40.4620.5160.4380.59 2.93E-111.07E-5
(a) In the case of probability of Identity (PID) the reported value is the combined non-exclusion probability; (b) The fragment sizes do not include the 19 pigtail bases.
Table 3. Analysis of Molecular Variance (AMOVA) of five walnut populations analyzed with 20 SSRs.
Source of Variationd.f.Variance Components% Variation
Among populations428.182.12
Among individuals2101296.9197.87
Total2141325.09
Table 4. Pairwise Genetic distances (FST) between sampling locations (the number of samples is provided in brackets), d.f. = degrees of freedom
PopulationWAHEAHTNVFPTK
Western Alpine Highlands (WAH) (95)
Eastern Alpine Highlands (EAH) (32)0.005
Torre-Natisone Valley (TNV)(25)0.0080.012
Friuli Plains (FP) (59)0.0050.0050.010
Trieste Karst (TK) (4)0.0460.0420.0520.048
Table 5. Genetic diversity within the five populations of Persian walnut (between brackets the no. of samples) collected in the Friuli Venezia Giulia Region assessed with 20 SSR loci. A = no. of alleles, Ne = effective no. of alleles, Rs = allelic richness, Ho = observed heterozygosity, GD = gene diversity, Pa = private alleles (the private allele length is listed in brackets).
PopulationANeRsHoGDPa
Western Alpine Highlands (95)3.0502.2572.250.4830.506WGA118 (220), WGA331 (298)
Eastern Alpine Highlands (32)3.2002.2792.290.4890.511WGA069 (178, 198), WGA118 (212), WGA331 (294), WGA376 (268)
Torre-Natisone Valley (25)2.9502.3012.290.5190.514WGA072 (156), WGA118 (222)
Friuli Plains (59)3.4002.2562.270.4880.515WGA069 (186, 188), WGA071 (224), WGA072 (148), WGA349 (284, 291)
Trieste Karst (4)2.3501.9782.230.5540.431WGA376 (257)

