Article

Spatial Patterns of Canopy Disturbance, Structure, and Species Composition in a Multi-Cohort Hardwood Stand

Department of Geography, University of Alabama, Tuscaloosa, AL 35487, USA
*
Author to whom correspondence should be addressed.
Forests 2017, 8(3), 93; https://doi.org/10.3390/f8030093
Submission received: 27 January 2017 / Revised: 15 March 2017 / Accepted: 17 March 2017 / Published: 21 March 2017
(This article belongs to the Special Issue Successional Dynamics of Forest Structure and Function)

Abstract

:
Multi-cohort stands are increasingly recognized and valued because of their biological functioning, biological diversity, and resistance and resiliency to perturbations. These forest ecosystems are epitomized by multiple age classes, and often contain multiple canopy layers, a range of tree size classes, and large amounts of woody debris. Disturbance history reconstructions in multi-cohort stands provide an understanding of the processes that create these systems. In this study, we documented structure and composition, and used dendroecological techniques to reconstruct disturbance history on a 1 ha plot in a multi-cohort hardwood stand in the Fall Line Hills of Alabama. The stand was dominated by Quercus alba L. and Liriodendron tulipifera L. Mingling index and stem maps indicated that most species were well dispersed throughout the stand, with the exception of L. tulipifera and Carya tomentosa (Poiret) Nuttal, which were relatively clustered. The oldest trees in the stand established in the 1770s, however, the largest recruitment event occurred ca. 1945 in conjunction with a stand-wide canopy disturbance. We posit that spatial heterogeneity of canopy removal during this event was largely responsible for the observed compositional and spatial complexity documented in the stand. In addition to the 1945 event, we recorded another stand-wide canopy disturbance in 1906 and 84 gap-scale disturbance events from 1802 to 2003. The conditions documented in the stand can be used as a benchmark to guide the creation and maintenance of complex multi-cohort stand characteristics, an increasingly popular management goal.

1. Introduction

Traditional forest management practices have often been criticized for creating overly homogenous stands and reducing ecosystem complexity [1,2,3,4]. When ecosystem complexity is reduced through the removal of compositional and structural diversity, it may become more susceptible to degradation following environmental perturbations [5]. In contrast, ecosystems with high levels of complexity, such as late-successional or multi-cohort forest stands, often have comparatively high levels of resistance and resilience to environmental perturbations [6,7]. Contemporary societal pressures such as alien species introductions, urbanization, fragmentation, and poor land management practices have caused many forested ecosystems to deviate from the natural processes (i.e., disturbance regimes) that create and maintain complex stand characteristics [8]. Accordingly, restoring these processes with appropriate management efforts may be necessary to promote complexity and associated ecosystem functions [4,6,9]. Indeed, promoting structural diversity is an increasingly popular management goal [10,11] and spatial patterns of biomass and light are important considerations of complexity enhancement projects [12,13].
In forest ecosystems, complexity is often epitomized by multiple age classes, multiple canopy layers, a range of tree size classes, and large amounts of woody debris [14,15,16]. By understanding the natural processes and patterns that create these features, managers gain better insight into the silvicultural prescriptions necessary to create compositionally and structurally diverse stand conditions [17]. Development and succession in forest ecosystems is often shaped by mortality-inducing disturbance events through alteration of niche space. Accordingly, reconstructions of the historical disturbance regime, along with forest inventory data, can elucidate patterns of stand development [18,19,20,21], and inform managers wishing to create specific compositions and structures.
In the eastern United States, the rarity of multi-cohort hardwood stands (i.e., those with trees establishing in multiple age classes based on Oliver and Larson [22]) often precludes the ability to inform management efforts designed to enhance their presence on the landscape. Most hardwood stands in the eastern USA established following logging activity in the early to mid-1900s, and thus, many are even-aged and have not developed a multi-cohort condition with associated complex features [22,23,24]. The issue is further complicated by variability in composition, structure, and developmental processes of these ecosystems across different biophysical settings [25]. This study presents the first analysis of spatiotemporal patterns of canopy disturbance in a multi-cohort hardwood stand in the Alabama Fall Line Hills. We hypothesize that our findings are representative of hardwood stands throughout much of the southeastern USA and indeed Quercus stands of the temperate zone, and thus can be used as a reference for planning forest restoration efforts for stands situated in similar biophysical settings.
The specific objectives of this study were to: (1) quantify the spatial patterns of stand structure and species composition in a multi-cohort hardwood stand; (2) reconstruct the frequency, magnitude, and extent of past canopy disturbance events in the stand; (3) examine the relationships between past canopy disturbances and contemporary spatial patterns of stand structure and composition; and (4) provide management recommendations for the promotion of multi-cohort stand characteristics for sites in similar biophysical settings.

2. Study Area and Methods
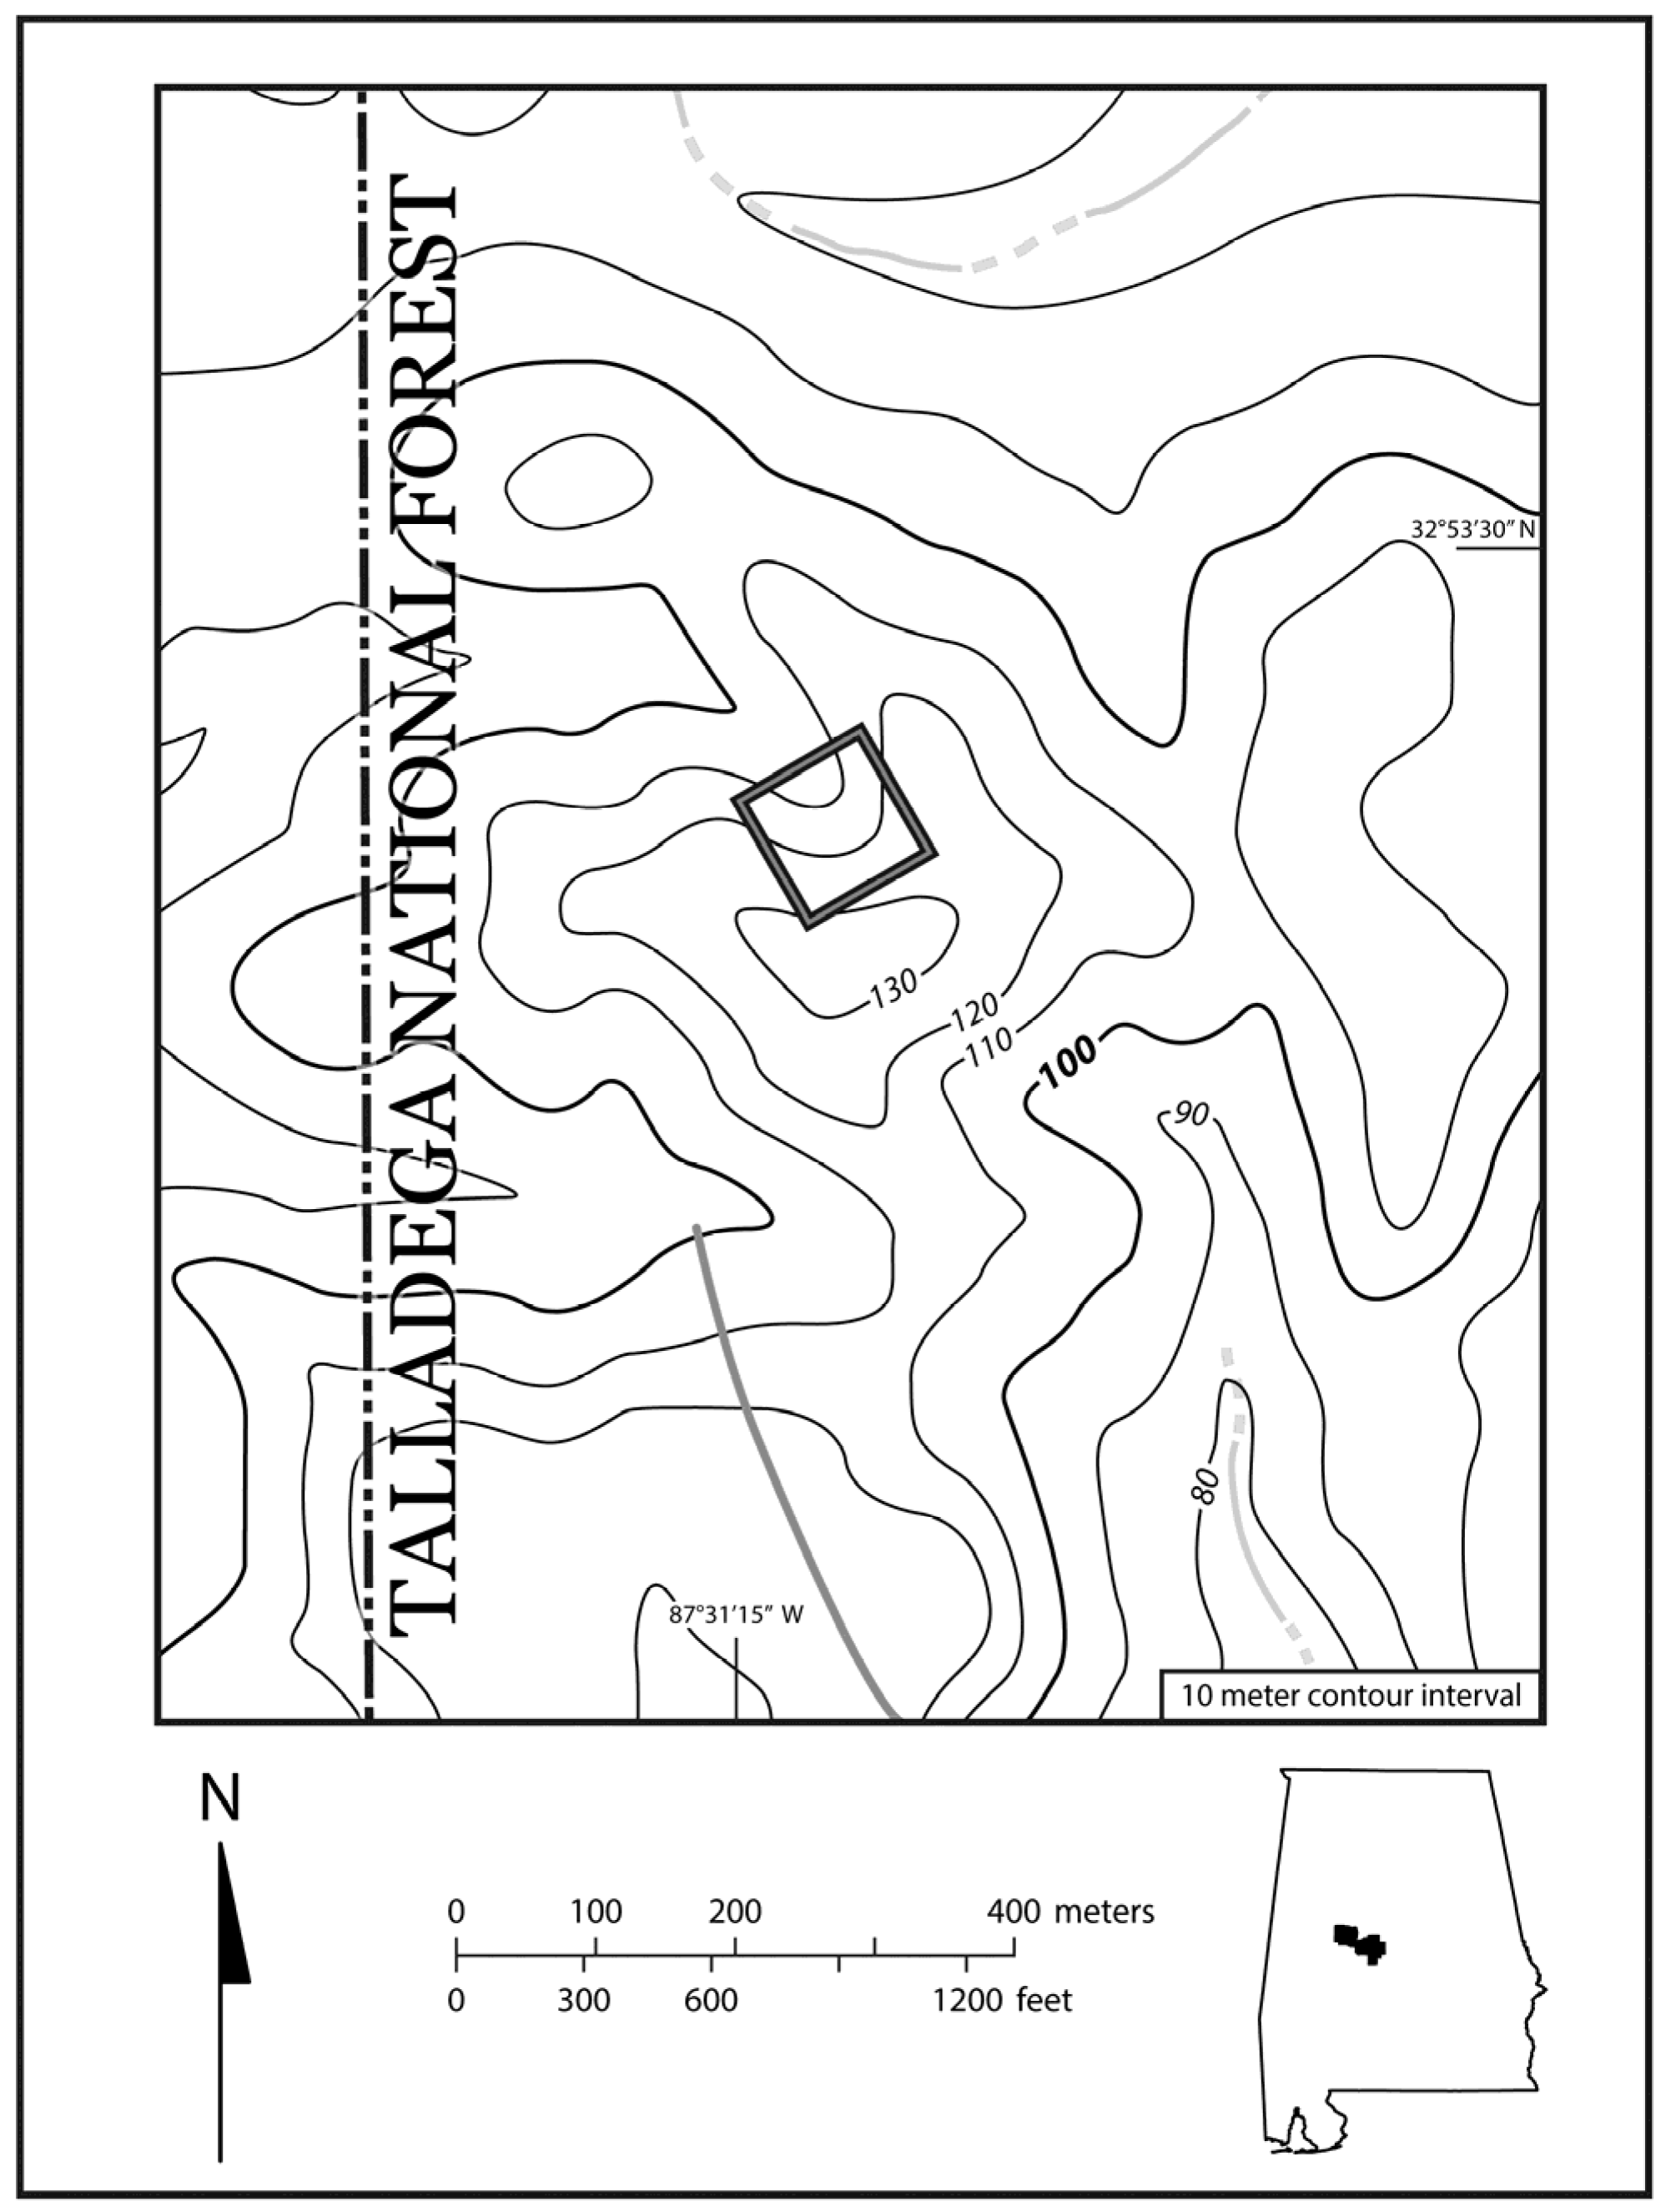
2.1. Study Site

The study was conducted on the Oakmulgee Ranger District of the Talladega National Forest in Hale County of western Alabama, USA (Figure 1). The Oakmulgee Ranger District is located in the Fall Line Hills physiographic province [26], a region that constitutes a transition zone between the Coastal Plain and Appalachian Highlands [27,28]. The area was first settled by Europeans in the 1820s, extensively logged in the early 1900s, and acquired by the United States Forest Service (USFS) in 1943 [29]. The region has a humid mesothermal climate characterized by long, hot summers and short, mild winters [30]. The annual temperature of the study area averages 17 °C with the highest mean monthly temperature of 27 °C in July and the lowest mean monthly temperature of 7 °C in January [31]. Annual precipitation of the region averages 1367 mm with the highest mean monthly precipitation of 140 mm in February and the lowest mean monthly precipitation of 87 mm in October [31]. The typical frost-free period spans March to November [31]. Soils of the study area are classified in the Maubila series which is typically very deep and moderately well drained [32].
The study site occurs within a 16 ha tract that is not contiguous with other USFS lands in the region, rendering it difficult to manage. Accordingly, the USFS has no recorded management history for the study site. In March and April 2015 the tract was surveyed for “old-growth” characteristics, and was deemed to meet USFS standards for old growth based on the documented variables, however, signs of human disturbance such as old roads and cut stumps were also noted. We suspect that the stand experienced some minor anthropogenic activity in the past such as grazing, burning, or selective timber harvesting, however, no evidence of broad-scale commercial activities or recent localized activities was present at the site.

2.2. Field Methods

Ground reconnaissance was used to locate the specific position of the 1 ha study plot. Complex forest characteristics (e.g., large trees at wide spacing and multiple canopy layers) were the primary criteria for plot selection. A 100 × 100 m permanent study plot was established with the top edge running roughly parallel to the slope contour on a primarily northeast facing aspect. The plot was subsequently divided into 10 × 10 m sections, creating a grid of 100 contiguous subplots. Within each subplot we recorded species, diameter at breast height (dbh, approximately 1.4 m above the surface), and crown class for all trees (woody stems ≥ 5 cm dbh). Crown classes were dominant, codominant, intermediate, and overtopped, and were based on the amount and direction of intercepted light [22]. We stem mapped the 1 ha plot by measuring the distance and azimuth to each tree from the southwest corner of every subplot using a hypsometer and sighting compass. Snags (standing dead trees with crowns largely intact) ≥ 5 cm dbh were identified to the lowest taxonomic level possible, measured for dbh, and placed into one of five decay classes as defined by the Forest Inventory and Analysis program of the USFS [33]. To reconstruct canopy disturbance history, stand age, and recruitment pulses, we used increment borers to extract cores from all Quercus stems ≥ 5 cm dbh, the nearest stem to the center of each subplot ≥ 5 cm dbh and <20 cm dbh, and all other stems ≥ 20cm dbh. Quercus stems were cored twice parallel to slope to reduce error associated with using a single sample per tree to reconstruct canopy disturbance history [34]. To quantify the regeneration layer, seedlings and saplings were tallied by species within 10 m2 nested circular plots (r = 1.78 m) at the center of each subplot. Seedlings were defined as woody stems < 1 m tall; saplings were defined as woody stems ≥ 1 m tall and <5 cm dbh. To assess light structure, we took one hemispherical canopy photograph at the center of each subplot using an Olympus Stylus TG-3 digital camera fitted with a fisheye lens and mounted on a self-leveling tripod unit 1.4 m above the ground. The camera was specially calibrated for use with WinSCANOPY software (WinScanopy, Regent Instruments, Quebec City, Quebec, Canada).

2.3. Laboratory and Analytical Methods

The tree, seedling, and sapling layers were analyzed using standard descriptors. For each tree species we calculated density (stems·ha−1), relative density (contribution to total trees), dominance (basal area, m2·ha−1), relative dominance (contribution to total basal area), and relative importance (mean of relative density and relative dominance). For seedlings and saplings, we calculated density and relative density. For each layer we calculated Shannon diversity (H’) and Pielou’s evenness (J’). For analysis of age, diameter, and crown class structures, species were placed into one of five taxonomic groups: Carya, F. pennsylvanica, L. tulipifera, others, and Quercus. Taxonomic groups were created based on species density and dominance and silvical characteristics.
All tree cores were processed for dating using the methods outlined in Stokes and Smiley [35]. The cores were air dried, glued to wooden mounts with vessel cells vertically aligned, and sanded with progressively finer abrasives to reveal the cellular structure [36]. After processing, all tree rings were dated to calendar year of establishment. Pith estimators were used to estimate date of establishment if cores included ring curvature but lacked pith. Tree-ring series from canopy Quercus trees (codominant and dominant crown classes) were used to reconstruct disturbance history as this genus was abundant on the study site and has been used in other studies to successfully document canopy disturbance history (e.g., [37,38,39,40]). All canopy Quercus trees (n = 36) were cored twice, however, two cores had excessive rot and could not be accurately dated and measured, resulting in a final sample size of 70 tree-ring series. After these cores were dated, raw-ring width was measured using a Velmex measuring stage interfaced with Measure J2X software (VoorTech Consulting, Holderness, NH, USA). COFECHA software (Richard L. Holmes, Tuscon, AZ, USA) was used to run segmented time series correlation analysis on each series to ensure accurate dating. If segments fell below a pre-determined threshold (r = 0.32, p > 0.01) they were flagged by the program and visually re-inspected. Dating on flagged segments was adjusted if necessary.
After the canopy Quercus series were deemed to be accurately dated and annual growth rings were measured, we used dendroecological techniques to quantify the frequency and magnitude of canopy disturbance events. Identifying pulses of increased growth within tree-ring series is the primary method for assessing canopy disturbance [20,37,41,42]. Release events were determined to be periods in which raw-ring width was ≥25% (minor) or ≥50% (major) of the 10-year preceding and superseding mean [37], sustained for a minimum of three years [39,40,43]. Because we utilized two cores per tree, analyses were combined to create a single composite disturbance history for each individual. Stand-wide canopy disturbance events were defined as synchronous releases experienced by at least 25% of the analyzed trees that were a minimum of 10 years old during the event [37,39].
Stem mapping and spatial analyses were performed in ArcMap v10.2 (Esri, Redlands, CA, USA). We used a handheld GPS (Garmin, Olathe, KS, USA) to record coordinates for the southwest corner of the plot and used trigonometric equations to determine the coordinates for each tree. The stem map was used to assess spatial patterns of canopy disturbance, age structure, species composition, and relationships between these variables. To quantify patterns of spatial composition, the mingling index (Mi) was calculated for each individual stem. The Mi is a spatial complexity metric that measures the level of species interspersion within the stand by comparing the species of each stem with the species of the four nearest stems [44,45,46,47]. The Mi was not calculated for stems falling within 5 m of the plot boundary to reduce edge-bias [48]. The value of Mi ranges from 0 to 1 (0 for stems whose four nearest neighbors are of the same species, 1 if they are all different species), therefore a low value indicates more species homogeneity and a high value indicates more species heterogeneity at fine spatial scales. Species-specific Msp values were calculated by averaging the Mi values of individuals for each species respectively. To further analyze spatial clustering of species at the stand scale, the proportion of a given species within the sampling size (Psp) was compared to the mingling complement (1 − Msp) for that species [49,50]:
M = P s p 1 M s p
When a species is interspersed randomly within a stand, the value of 1 − Msp approaches Psp for the given species [49]. Thus, a value of M approaching 1 indicates a random spatial distribution for the species, and a value approaching 0 indicates spatial clustering.
Hemispherical canopy photographs were analyzed using WinSCANOPY software to determine canopy openness for each subplot. WinSCANOPY classifies each pixel as canopy or sky and calculates canopy openness by quantifying the number of pixels unobstructed by vegetation, and adjusting these values to account for angular distortion created by the fish-eye lens and zenith angle. All photographs were analyzed by one individual to eliminate user bias [51].

3. Results

3.1. Species Composition

Tree layer species richness was 26, diversity (H’) was 2.62, and evenness (J’) was 0.80. Tree density was 504 stems·ha−1 and total basal area was 26.6 m2·ha−1 (Table 1). Quercus alba and Liriodendron tulipifera were the most important species with relative importance values (RIV) of 21.3 and 20.9, respectively. Liriodendron tulipifera was the most abundant species (83 stems·ha−1) and Q. alba was the most dominant species (7.1 m2·ha−1). Together they comprised 32% of all stems and 52% of total basal area. The next most important species were Carya tomentosa (RIV: 10.0), Fraxinus pennsylvanica (RIV: 9.6), and Carya glabra (RIV: 7.2). The remaining 21 species all had RIVs less than 5, and comprised 38% of all stems and 25% of total basal area.
We documented 2471 seedlings (24,710 stems·ha−1) and 176 saplings (1760 stems·ha−1) in the regeneration layer (Table 2). Seedling species richness, diversity, and evenness were 33, 2.23, and 0.64, respectively. The most abundant species was Q. alba comprising 45.7% of all seedlings. Carya glabra (8.1%), Celtis occidentalis (5.9%), and Halesia carolina (5.2%) were the only other species to have relative abundances greater than 5% in the seedling layer. Sapling species richness, diversity, and evenness were 20, 2.08, and 0.69, respectively. Halesia carolina was the most abundant species comprising 45.5% of all saplings followed by Callicarpa americana (10.2%), F. caroliniana (8.5%), C. occidentalis (6.8%), and Q. alba (4.5%). The regeneration layer featured three species with canopy potential that were not recorded in the tree layer: C. occidentalis, Quercus falcata, and Quercus nigra. The most abundant species of the tree layer, L. tulipifera, comprised 0.1% of seedlings and 0.6% of saplings.
We recorded 23 snags greater than 5 cm dbh across the study site, of which 22 were identified to species. Mean snag dbh was 12.4 cm ± 2.6 (SE) with a maximum of 51 cm for a Pinus echinata individual. This and another P. echinata individual (42.6 cm dbh) were the only snags with a dbh greater than 20 cm. We assigned 16 snags to decay class I, six to decay class II, and one to decay class III. The identifiable snags represented nine species, with the most abundant being Cornus florida (n = 8). No other species represented more than three snags.

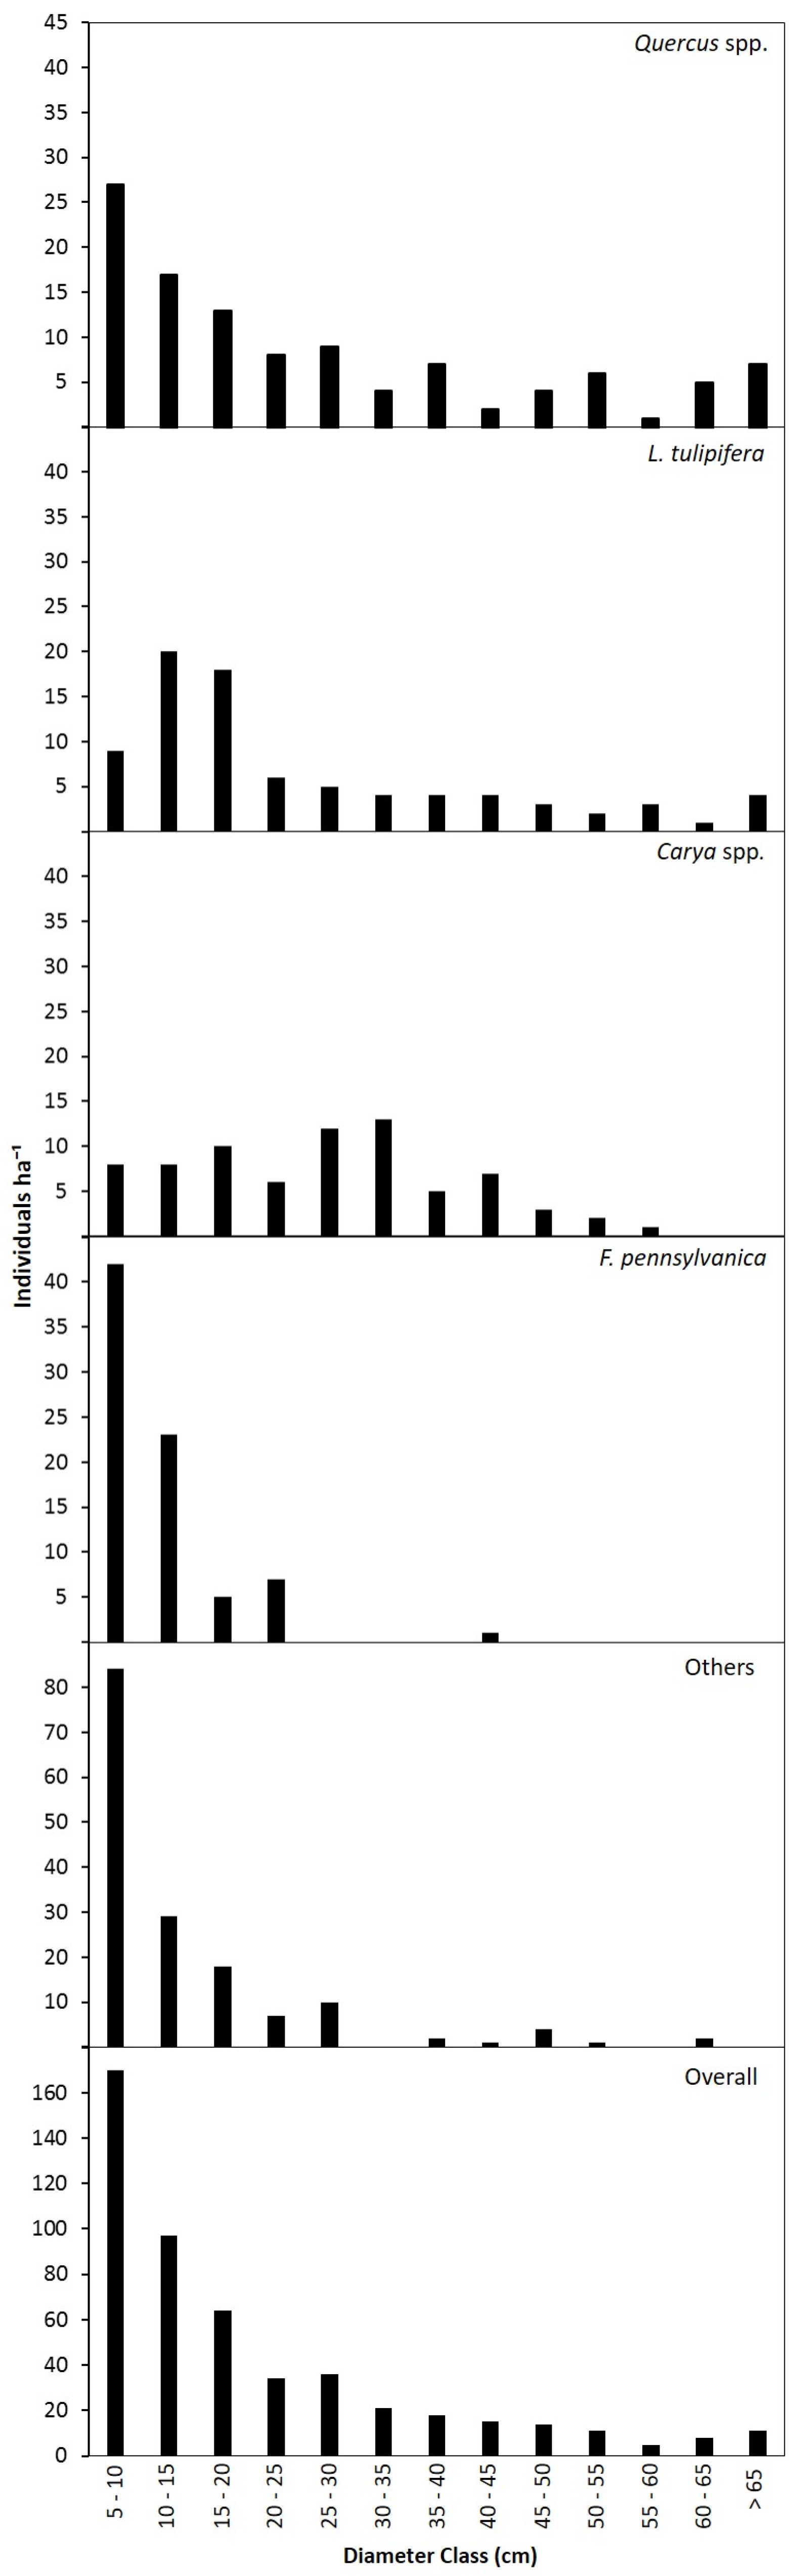
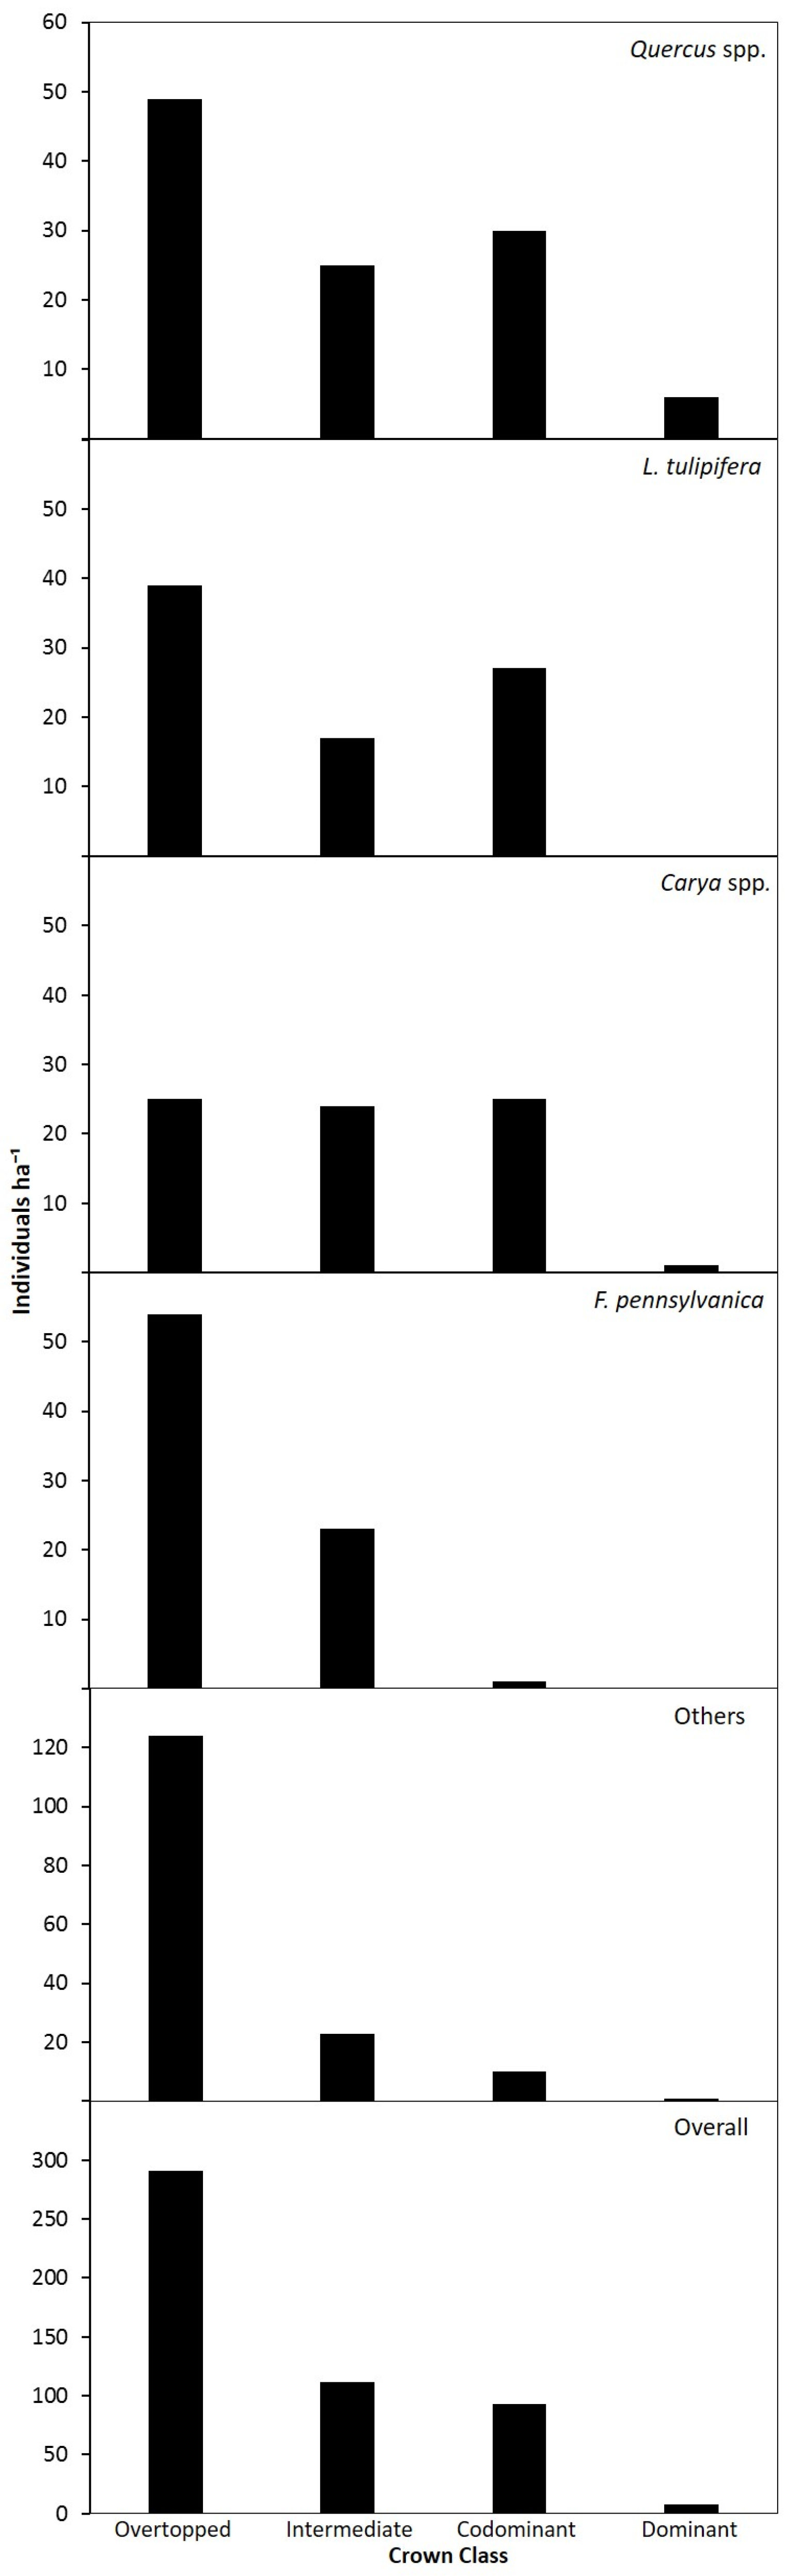
3.2. Canopy and Diameter Structure

We recorded 101 stems occupying the upper canopy (dominant or codominant crown class). Three groups occupied most of these positions: Quercus (n = 36), L. tulipifera (n = 27), and Carya (n = 26), together comprising 88% of the stems in codominant and dominant crown classes (Figure 2). Quercus alba (n = 6), C. glabra (n = 1), and P. echinata (n = 1) were the only species documented in dominant canopy positions. The intermediate crown class featured 112 stems fairly evenly distributed amongst five taxonomic groups: Quercus (n = 25), Carya (n = 24), F. pennsylvanica (n = 23), others (n = 23), and L. tulipifera (n = 17). We recorded 291 stems in overtopped canopy positions with the most abundant species being F. pennsylvanica (n = 54), Q. alba (n = 42), L. tulipifera (n = 39), Oxydendrum arboreum (n = 29), and Frangula caroliniana (n = 26). Mean canopy openness per subplot was 14.6% ± 1.5% (SE) with a minimum of 6.8% and a maximum of 23.1%.
The diameter structure of all trees showed an inverse J-shape from small to large size classes (Figure 3). The mean q-factor was 1.34 ± 0.1 (SE) with a maximum of 1.88 between the 15–20 cm and 20–25 cm size classes and a minimum of 0.63 between the 55–60 cm and 60–65 cm size classes. The quadratic mean diameter (QMD) of the stand was 26 cm. Quercus species were documented in all size classes and exhibited decreased abundance with increased size class in most cases, approximating the stand’s inverse J-shape distribution. Liriodendron tulipifera showed a uniform diameter distribution with apices in the 10–15 cm and 15–20 cm size classes. Liriodendron tulipifera represented the two largest diameter trees with diameters of 84.5 cm and 82.7 cm. Carya exhibited a mostly uniform distribution, peaking in the 30–35 cm diameter class. Fraxinus pennsylvanica was the most abundant species less than 25 cm dbh (n = 77); only one individual was greater than 25 cm dbh.

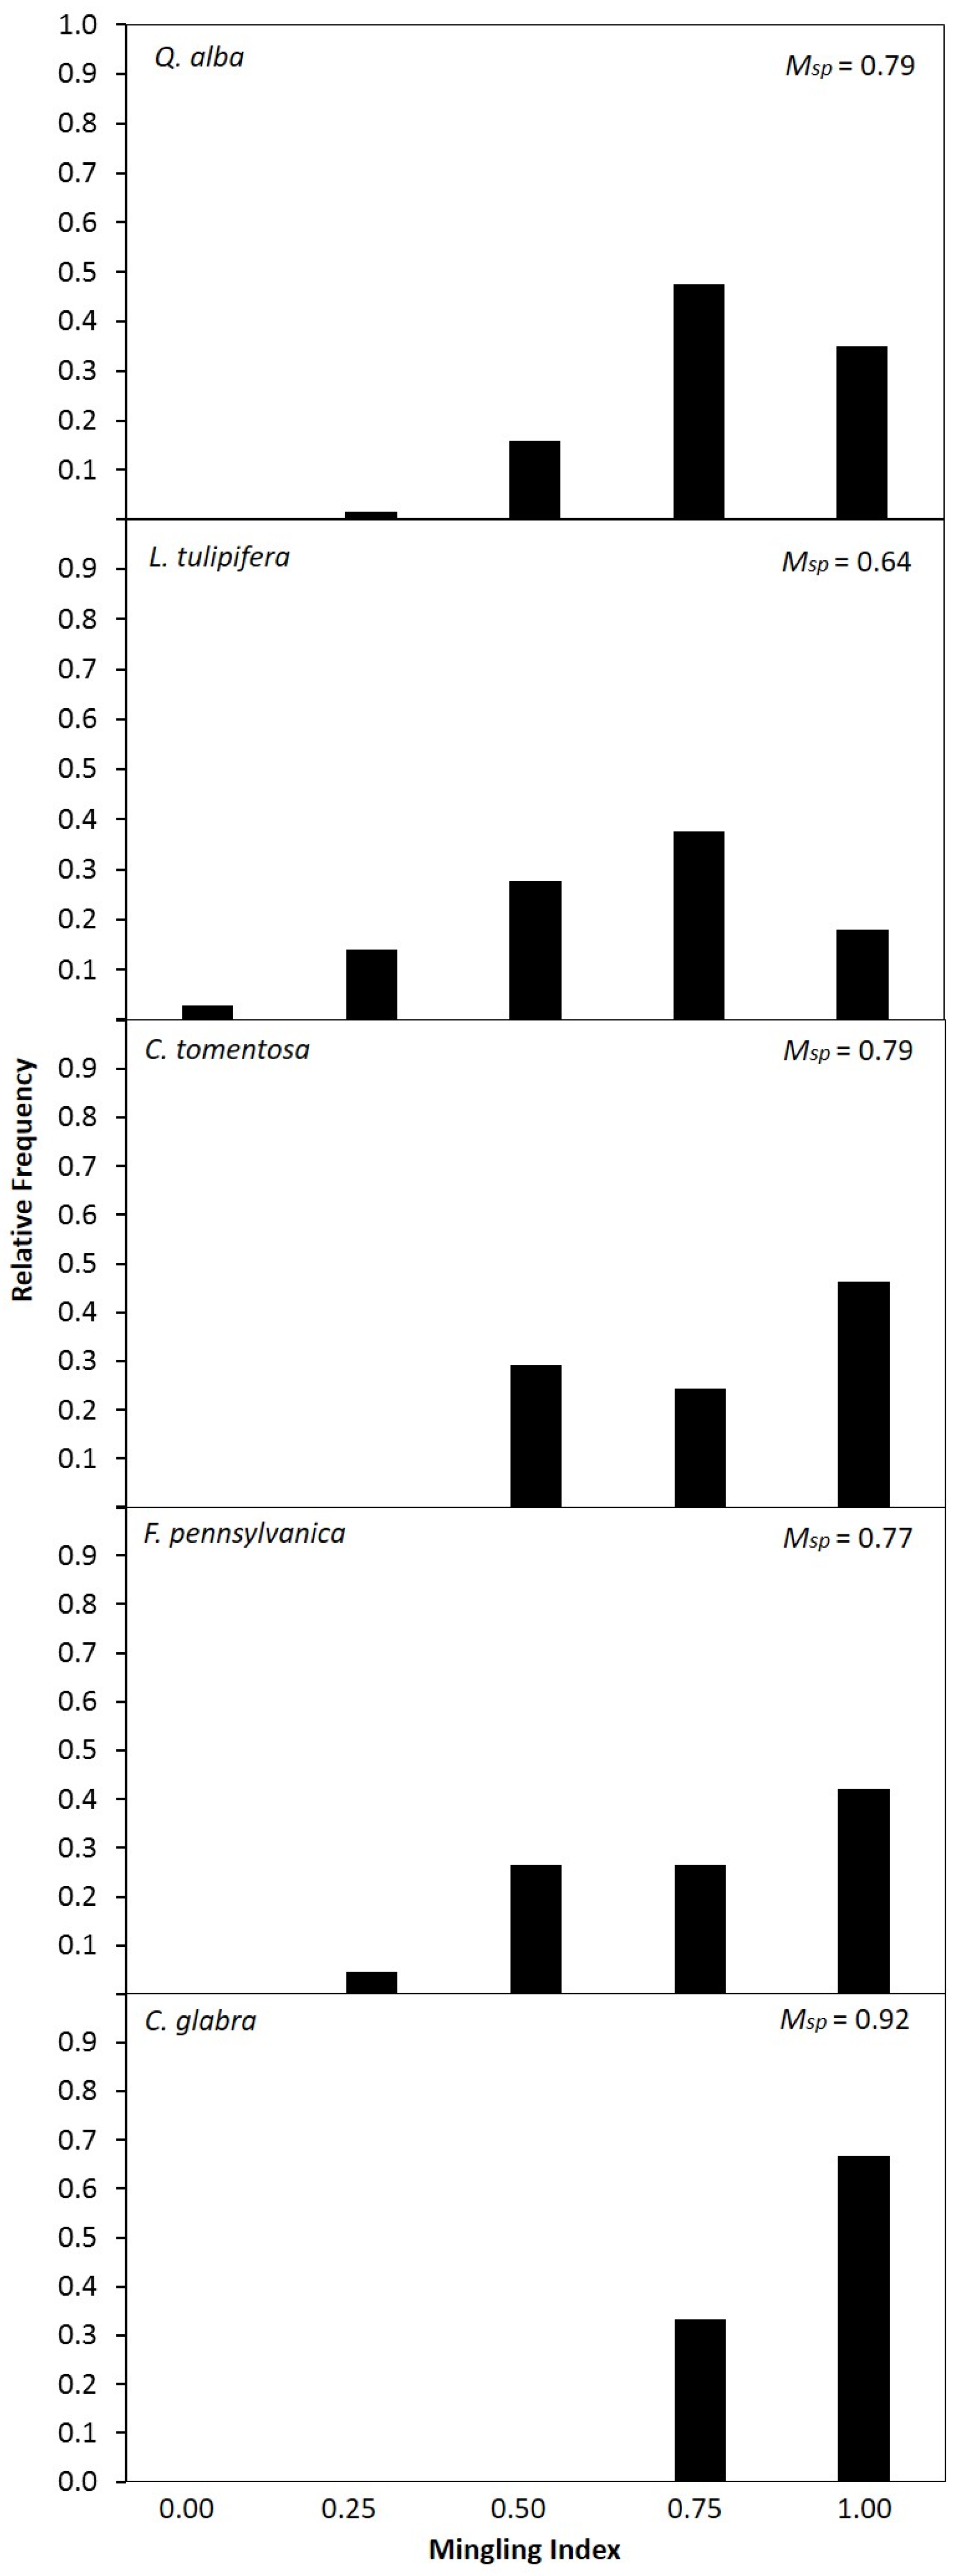
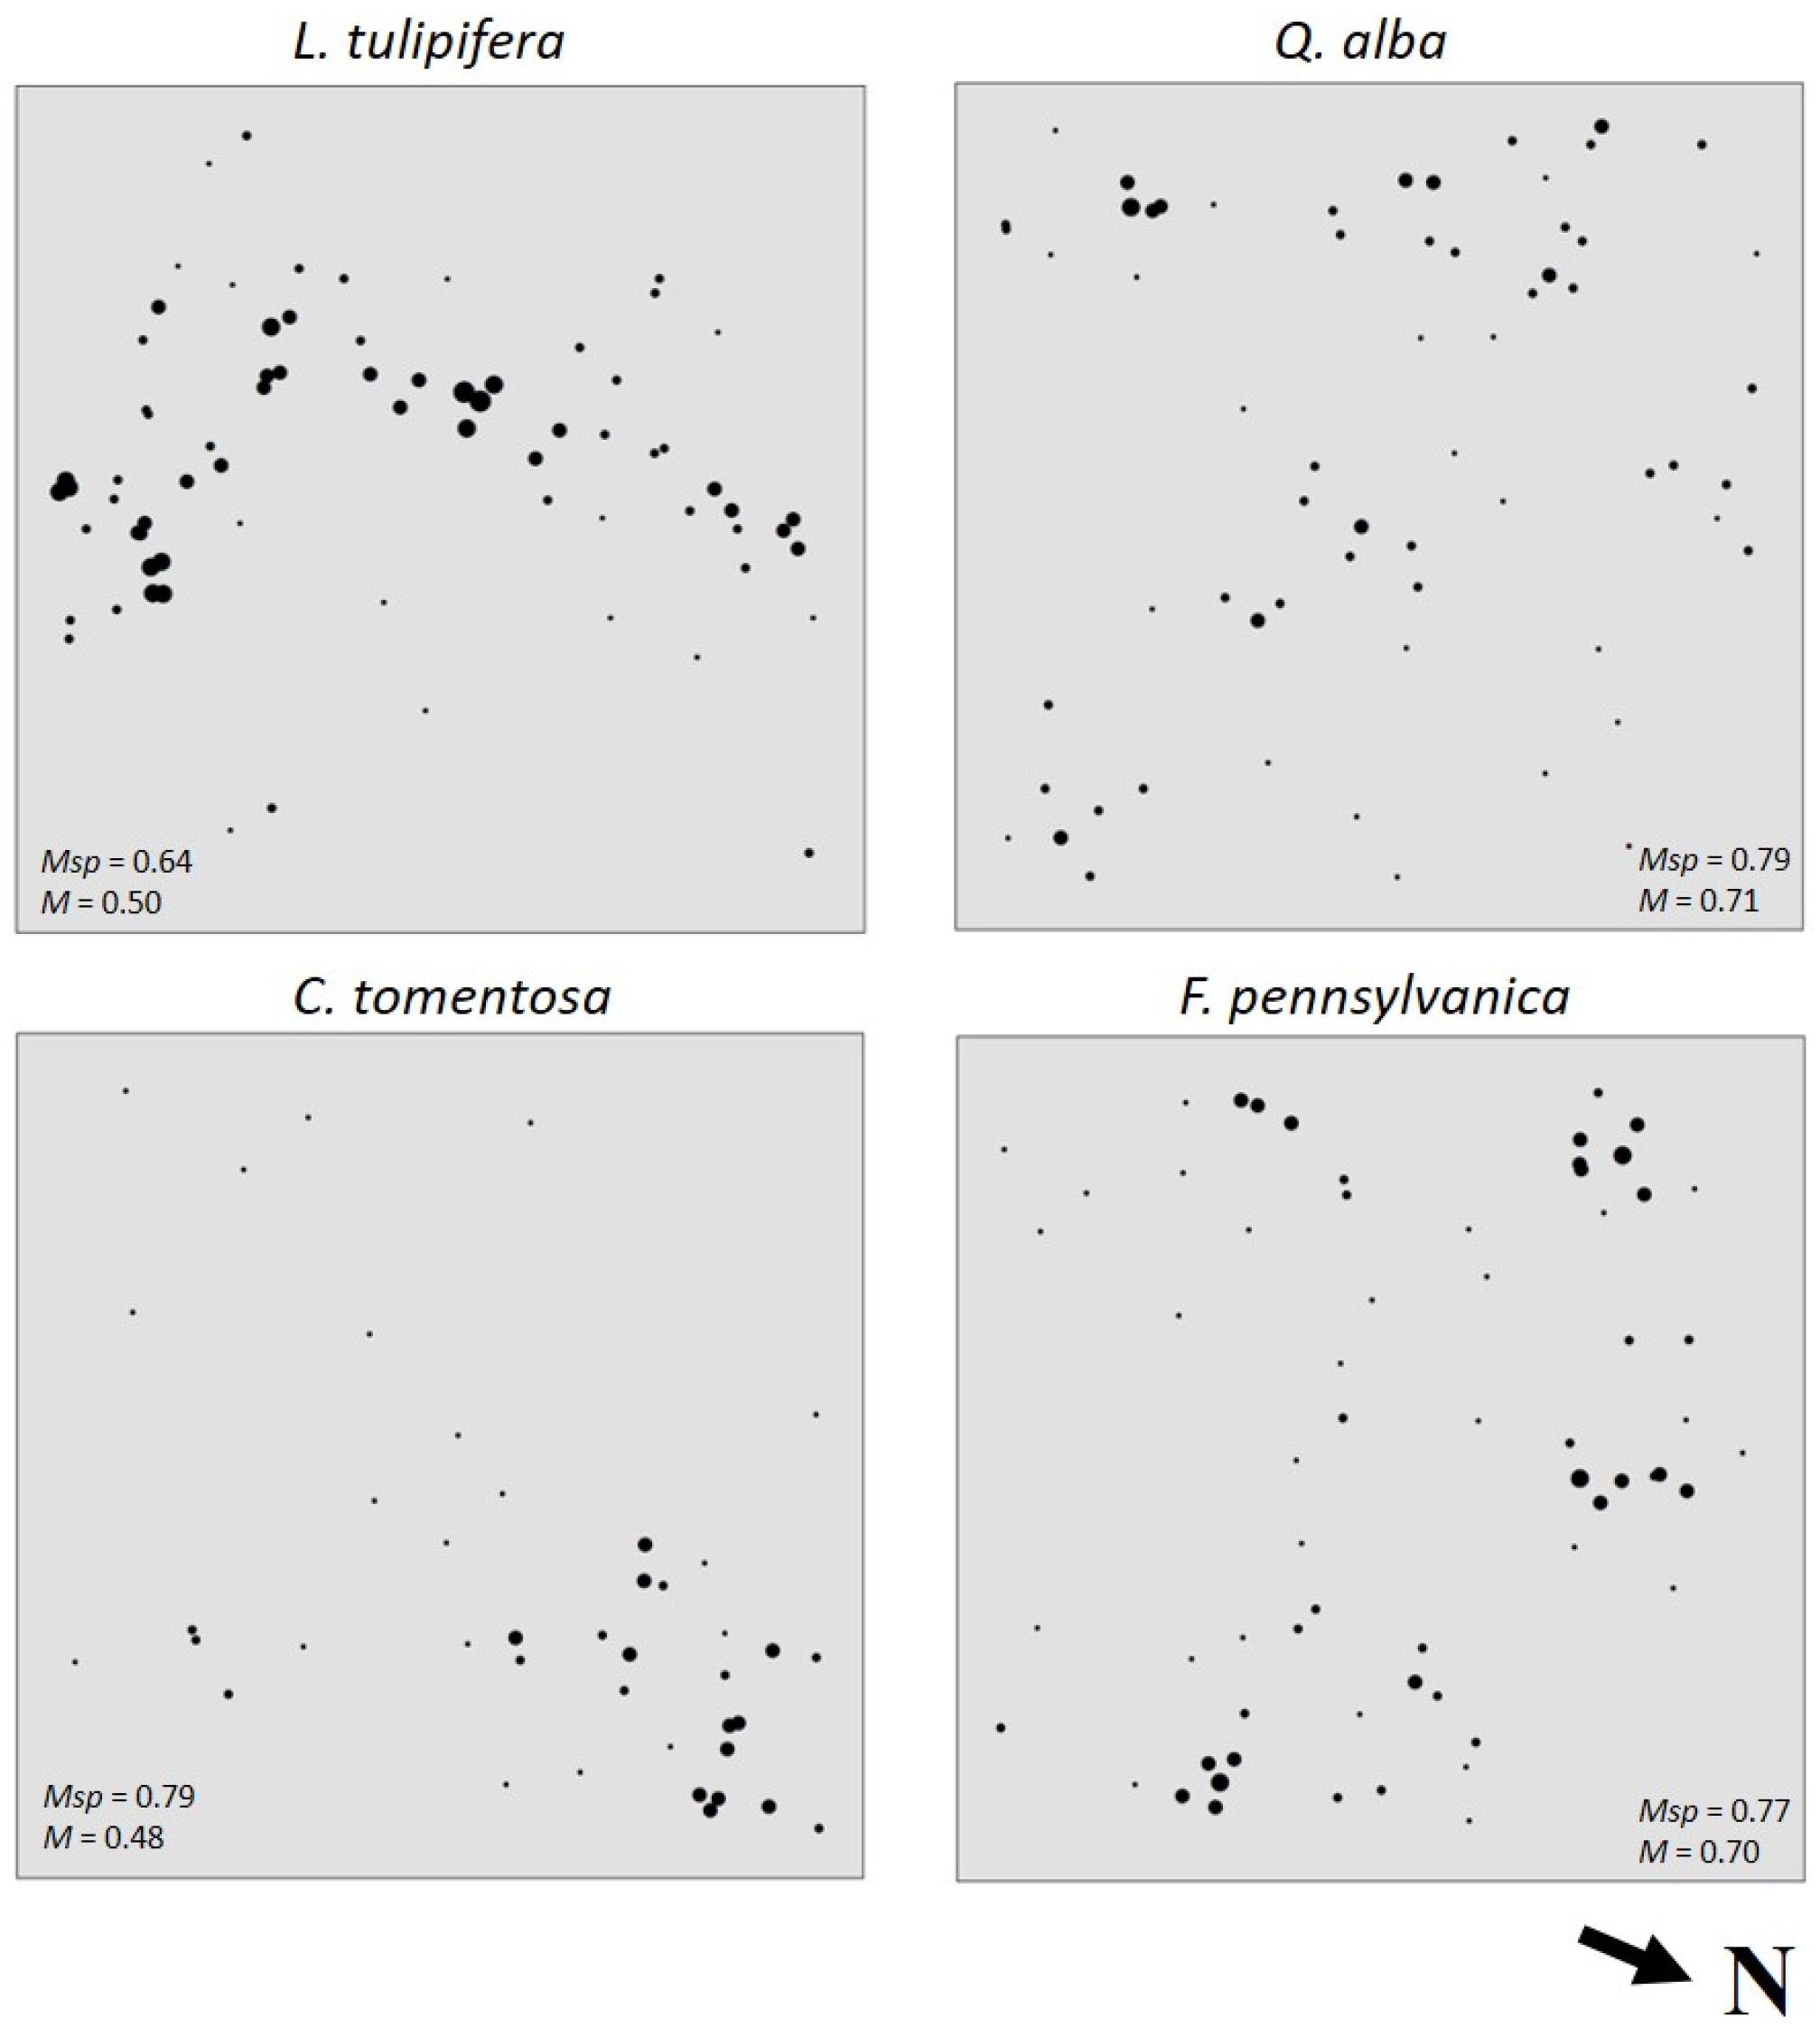
3.3. Species Intermingling and Spatial Patterns

The Mi was calculated for 410 trees after excluding those within the 5 m buffer zone at the edge of the plot. The average of all Mi values for the stand was 0.89 ± 0.03 (SE). Among the five most important species, C. glabra had the highest Msp at 0.92 (Figure 4). Liriodendron tulipifera had the lowest Msp within this group at 0.64. Quercus alba, C. tomentosa, and F. pennsylvanica had Msp values of 0.79, 0.79, and 0.77, respectively. The M value (formulated by comparing the proportion of each species within the 410 tree sample size with Msp) was lowest for C. tomentosa and L. tulipifera with values of 0.48 and 0.50, respectively (Table 3). Quercus alba, F. pennsylvanica, and C. glabra had M values of 0.71, 0.70, and 0.63, respectively.
Stem maps were constructed to visually assess spatial patterns in species composition (Figure 5). Liriodendron tulipifera and C. tomentosa both appeared in relatively large spatial clusters. Most L. tulipifera stems occurred in a cluster spanning the center portion of the plot, whereas C. tomentosa was clustered in the northern corner. Quercus alba and F. pennsylvanica both occurred in relatively small spatial clusters, and were more dispersed throughout the stand.

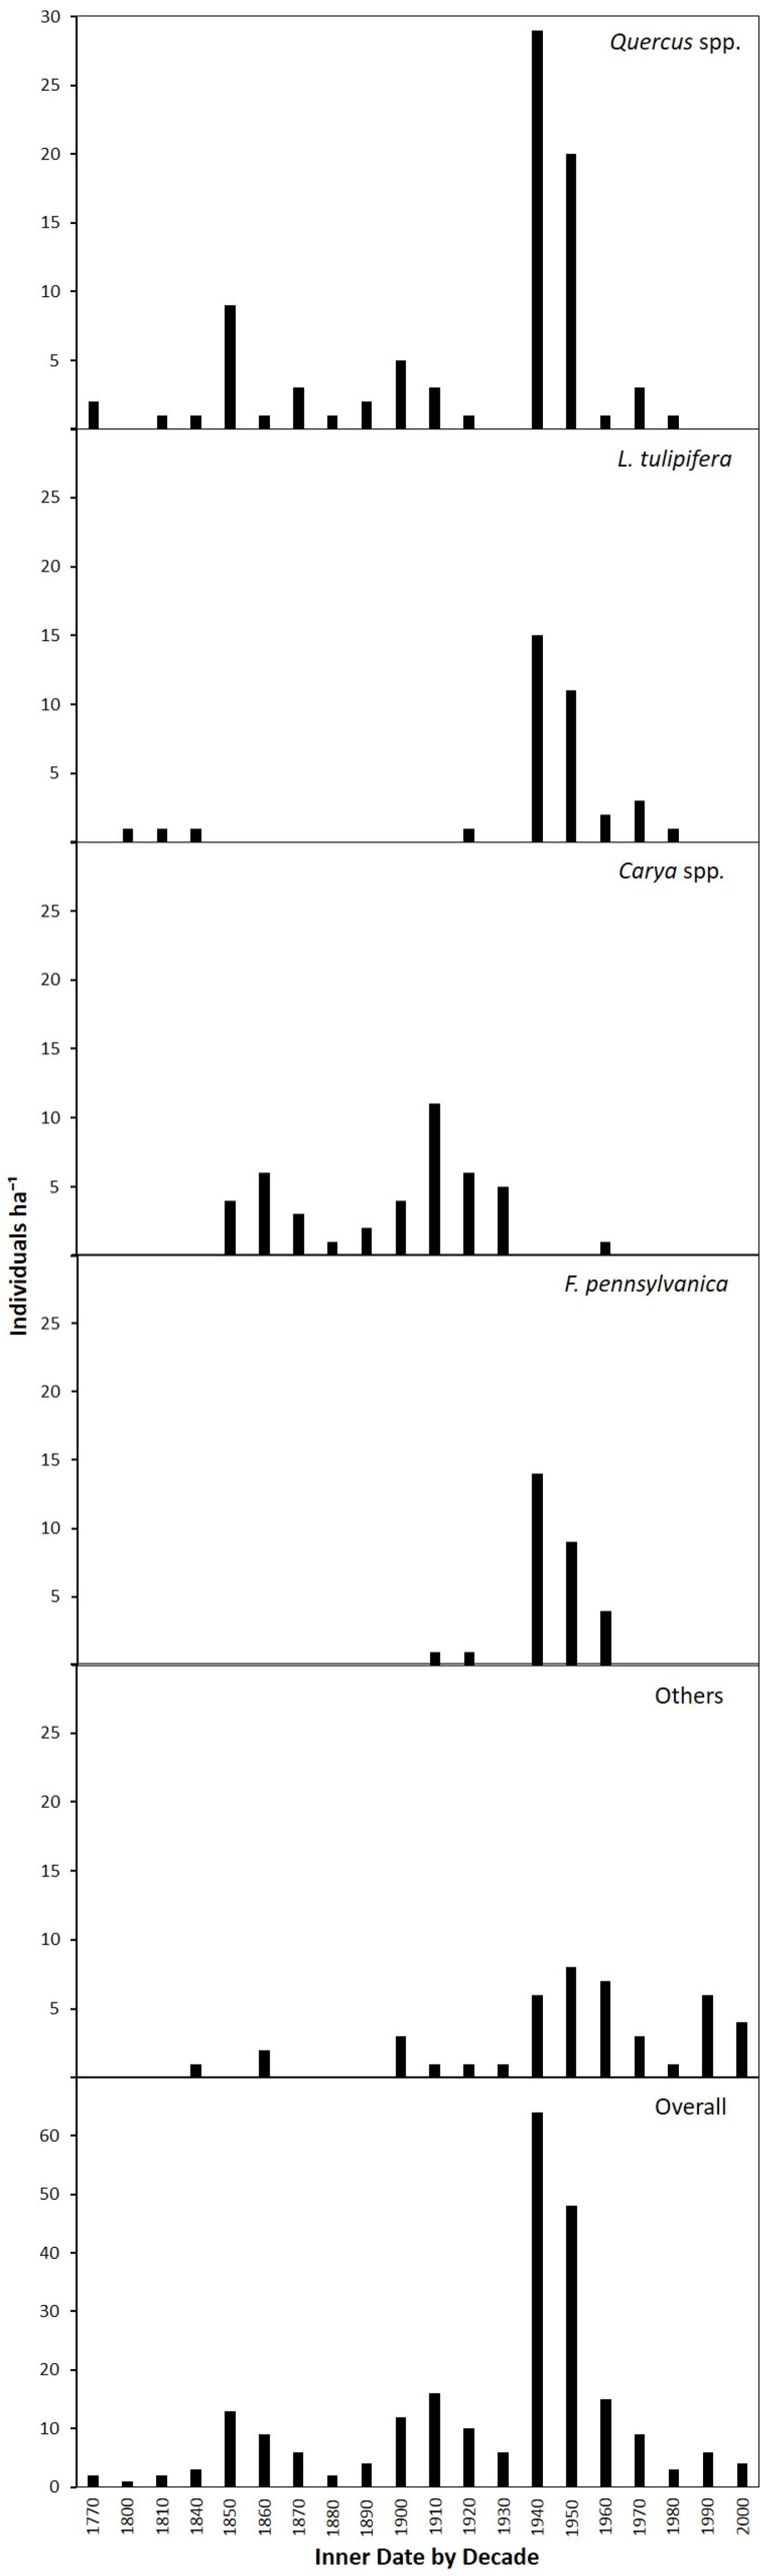
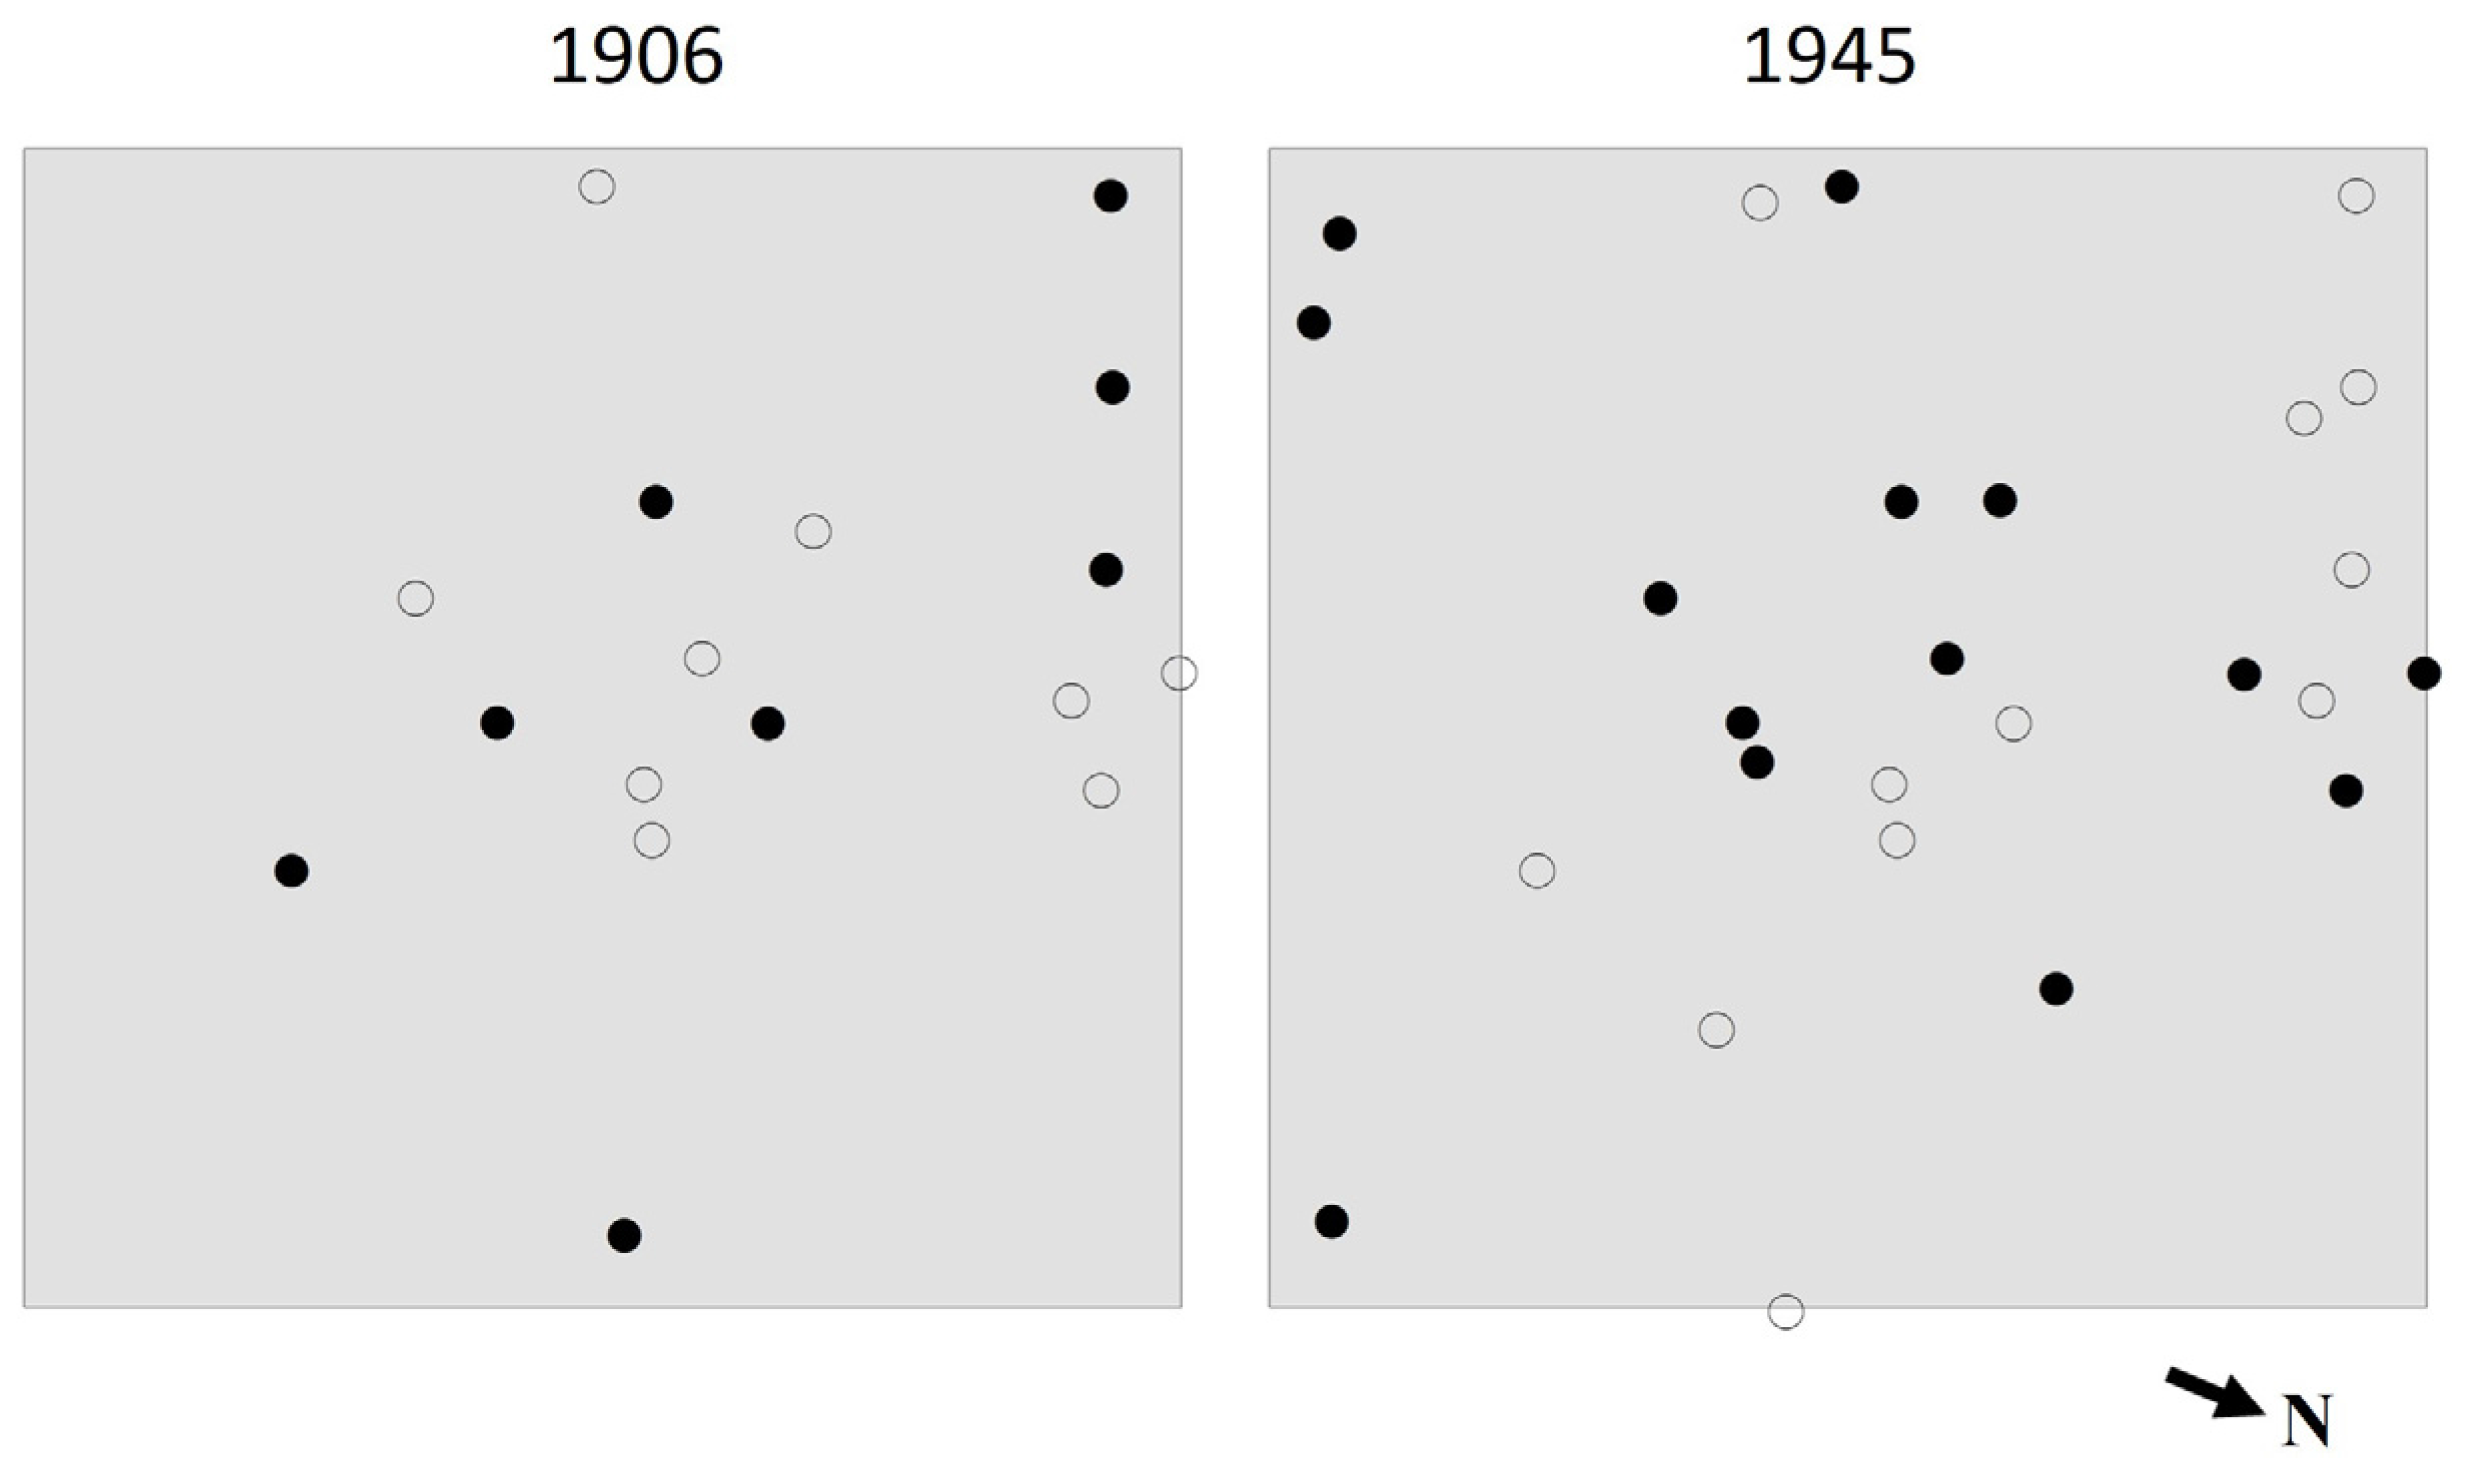
3.4. Age Structure and Canopy Disturbance History

Inner pith dates at breast height were recorded for 235 trees (Figure 6). We documented two trees dating prior to 1800, a Q. alba and a Q. stellata with inner dates of 1774 and 1776, respectively. We documented 42 trees representing seven species with inner dates prior to 1900: Q. alba (n = 16), C. glabra (n = 10), C. tomentosa (n = 6), L. tulipifera (n = 3), Nyssa sylvatica (n = 3), Q. stellata (n = 3), and Quercus rubra (n = 1). Quercus establishment was continuous from the 1840s to the 1980s, with at least one individual establishing in every decade except the 1930s. Quercus establishment spiked in the 1940s and 1950s with 59% of dated individuals establishing in these decades. Four L. tulipifera individuals established prior to the 1940s with 72% of individuals establishing in the 1940s and 1950s. Carya establishment was continuous from the 1850s to the 1930s, and spiked in the 1910s. Only one Carya individual established after the 1930s. Fraxinus pennsylvanica establishment spiked in the 1940s with only two individuals exhibiting inner dates prior to this decade. The age structure for all trees showed a tri-modal distribution with a major peak in the 1940s representing the establishment of 27% of all dated stems. Smaller peaks were apparent in the 1850s and 1910s representing 6% and 7% of dated stems, respectively.
We analyzed 70 tree-ring series from 36 Quercus individuals to recreate canopy disturbance history. In total, 104 release events were detected; 81 (78%) being classified as minor and 23 (22%) as major. Thirty-two individuals (89%) experienced at least one release event with 27 individuals (75%) experiencing multiple release events. The most release events recorded for an individual was seven experienced by a Q. stellata with an inner date of 1776. Mean release events per individual was 3.0 ± 0.5 (SE) with a mean release duration of 4.6 years ± 0.5 (SE). Release initiations were often recorded in consecutive years with the longest periods of consecutive initiations occurring from 1903 to 1907 and 1942 to 1946. The mean return interval between release initiations was 4.1 years ± 0.6 (SE). Two stand-wide release events were documented during stand development. These events were initiated in 1906 (simultaneous release in 50% of trees at least 10 years of age) and 1945 (44% of trees). The highest decadal release to sample size volume occurred in the 1900s when 16 of 18 trees (89%) at least 10 years of age experienced a release event. This was followed by the 1940s in which 70% of the samples experienced a release. From the 1850s, the decadal release to sample size percentage exhibited an oscillating pattern with peaks occurring in the 1850s, 1880s, 1900s, 1920, and 1940s. The mean percent of trees released during those decades was 37%. From the 1950s decadal release to sample size percentage was more consistent with a mean of 20%, peaking in the 1980s at 28%.
Stem maps were used to visually assess spatial patterns of the two stand-wide release events (Figure 7). For both the 1906 and 1945 events, Quercus trees experiencing release were relatively well dispersed throughout the stand. The stem map of the 1906 event showed Quercus trees that were not released during the event to be relatively well interspersed with trees that were released. The 1945 event exhibited relatively less interspersion, particularly near plot center where a cluster of six Quercus trees experiencing release was not interspersed by any unreleased individuals. Analysis of establishment dates and stem maps revealed that the 1945 stand-wide disturbance initiated a large recruitment event, and strongly shaped the contemporary species composition and spatial patterns observed in the stand. In total, 37% of dated stems established in the decade following 1945. This included 61% of L. tulipifera, 55% of F. Pennsylvanica, and 51% of Quercus stems. Only 6% of dated stems in the present stand established in the decade following the 1906 event.

4. Discussion

4.1. Forest Composition

The woody plant community was composed of species that tend to occur on both xeric (e.g., Q. stellata) and mesic sites (e.g., F. grandifolia). Species richness was highest in the seedling layer, however, the tree layer was the most diverse. We attributed this to low evenness in the seedling layer, as nearly half of all seedlings were Q. alba. Tree species richness has the potential to increase, as three species with the ability to reach the canopy were recorded in the regeneration layer but not in the tree layer. The sapling layer exhibited both the lowest species richness and diversity.
The most abundant species of the tree layer, L. tulipifera, was disproportionately underrepresented in the regeneration layer with only three seedlings (30 ha−1) and one (10 ha−1) sapling recorded. However, L. tulipifera is a light-seeded species that is often considered disturbance obligate because of its low shade tolerance [52], and without high-light gap environments we would not expect large numbers of L. tulipifera in the seedling and sapling layers. The three most dominant species other than L. tulipifera (C. glabra, C. tomentosa, and Q. alba) ranked in the top four of seedling density for species with canopy potential. Under the current disturbance regime, the stand will likely maintain Quercus dominance, as Quercus was well represented in the seedling layer and the diameter distribution for Quercus trees showed an inverse J-shape. Although Quercus saplings were not abundant (i.e., Quercus bottleneck), we note that Quercus competition in the regeneration layer was largely from woody plants that lack canopy potential. Although Carya was well represented in the seedling layer, it may decline in dominance as trees exhibited a uniform diameter distribution with relatively few small stems to recruit to larger size classes. Our age structure analysis also indicated a lack of Carya establishment after the 1930s. Of note, we recorded only one Acer rubrum tree and two (20 ha−1) A. rubrum seedlings. Quercus stands throughout the eastern USA have been experiencing a shift in dominance from Quercus to Acer [53,54,55,56], however, this stand showed no signs of transition as Quercus seedlings far exceeded those of Acer. The Quercus to Acer transition has yet to be observed this far south in the eastern USA, but has been reported just 150 km north of our study site on the Bankhead National Forest [57,58]. We posit that the lack of an apparent Quercus to Acer transition may be related to climatic factors [55], or lack of local Acer seed source.
The third most abundant species in the stand, F. pennsylvanica, is experiencing widespread mortality throughout its range in eastern North America induced by the invasive Agrilus planipennis Fairmaire (emerald ash borer, EAB). EAB is established in several counties throughout bordering states Tennessee and Georgia, and EAB was first detected in Alabama in 2016 [59]. Models differ in predicting the extent of EAB invasion in the southeastern United States [60], however, if EAB does invade the stand it has the potential to extirpate the F. pennsylvanica population. Total F. pennsylvanica mortality would increase light in the understory, however, only one F. pennsylvanica individual is currently occupying an upper canopy positon. Therefore, total mortality of F. pennsylvanica would likely be less severe on future species composition than a disturbance event removing more upper canopy trees.

4.2. Forest Structure

To our knowledge, no other study has quantified late-successional multi-cohort hardwood stand structure in the Fall Line Hills region. These structures are known to vary widely across different biophysical settings. Accordingly, it remains difficult to classify stands by comparing structural measures from disparate locations. The stand studied here does, however, approximate some of the structural measures found in other late-successional multi-cohort hardwood forests in the eastern USA. For example, basal area of the stand (26.6 m2·ha−1) was within the range of 25–35 m2·ha−1 typically reported for other late-successional hardwood forests [15,40,61,62]. The stand also contained seven trees greater than 75 cm dbh, which matches the minimum recommendation of Parker [59] for late-successional stands of the Central Hardwood Region of the eastern USA. Tree density ≥10 cm dbh was 379 stems·ha−1. Parker [61] reported a range of 161–427 stems·ha−1 for this size class while others reported densities of 250 [15], 252 [40], and 363 [63] stems·ha−1 in late-successional hardwood stands in the region. Other structural measures differed from commonly reported values of late-successional stands in the eastern USA. For example, QMD of the stand (26 cm) was slightly below the range of 29–42 cm reported in late-successional stands in the Central Hardwoods Region [40], however, this metric can vary widely according to site productivity and disturbance history. We recorded a density of 23 snags·ha−1 greater than 5 cm dbh and only two snags greater than 30 cm dbh. These measures were low compared to the recommendation of 10 snags·ha−1 greater than 30 cm dbh for late-successional hardwood stands by Martin [15].

4.3. Species Intermingling and Spatial Patterns

The average of all Mi values for the stand (0.89) was quite high, likely because of relatively high species richness and spatial dispersion. Liriodendron tulipifera had relatively low values for Msp and M, indicating that this species was spatially clustered at the neighborhood and stand scales. Stem mapping substantiated these values by showing a clustered pattern of L. tulipifera stems in a linear pattern across the center of the plot (Figure 5), closely matching the 1945 disturbance event (Figure 7). Carya tomentosa had the lowest M value of the five most dominant species, and stem mapping revealed a relatively large cluster of this species in the northern corner of the plot. Despite similar values of M for these two species, C. tomentosa had a considerably higher value of Msp. This is likely because the C. tomentosa cluster was interspersed with more heterospecific trees than the L. tulipifera cluster. Quercus alba and F. pennsylvanica had relatively higher M values, and stem mapping revealed that these species were more evenly dispersed throughout the stand and were in smaller spatial clusters. The M value is sensitive to the size of spatial clusters, as large conspecific clusters have less edge per area than smaller conspecific clusters. This results in less spatial proximity to heterospecific trees and lower Mi values for stems within larger conspecific clusters [49]. Thus, the interpretation of relatively low M values resulting from few large conspecific clusters, and relatively high M values resulting from several small conspecific clusters or highly dispersed individuals appears to be accurate for this stand.

4.4. Canopy Disturbance History and Stand Development

Results of the disturbance history reconstruction indicated that stand structure and composition were shaped by frequent gap-scale canopy disturbances and two stand-wide or intermediate-severity canopy disturbances. Of the 104 release events detected, we attributed 84 to gap-scale events. These events, which kill one or a small group of trees, typify most disturbances in hardwood forests of the eastern USA [41,64,65,66]. The intermediate-severity events, occurring in 1906 and 1945, were larger than gap-scale disturbances, as multiple trees experienced simultaneous release throughout the stand. The events were not severe enough to be stand-initiating, as residual trees survived and not all residual trees experienced release. Intermediate-severity disturbances are typified by exogenous events such as wind storms or ice that kill many, but not all, canopy trees within a stand. Although we cannot state with certainty what events resulted in these two intermediate-severity disturbances, a tornado outbreak across Mississippi and Alabama occurred in February of 1945 and impacts were documented in the broader region. In 1905, an extratropical storm impacted east Mississippi and west Alabama and perhaps strong winds associated with this event resulted in the intermediate-severity event. Although signs of past logging operations were not present in the stand, the possibility of canopy disturbance caused by such activities also cannot be ruled out. Some authors suggest that intermediate-severity disturbance events can create structural heterogeneity that epitomizes complex forests at a faster rate than gap-scale events alone [3,58,67]. The return interval for stand-wide disturbance in forests of the eastern USA is reported to be ca. 30 to 50 years [37,62,68]. The 39-year interval between the 1906 and 1945 stand-wide disturbance events falls within this range, however, the stand endured 70 years since the 1945 event. Although stand age and structure may influence its predisposition to disturbance [22], stochastic factors (e.g., extreme weather events) also shape the return interval of stand-wide disturbances, thus creating a broad range of variability.
Our analyses indicated that the 1945 intermediate-severity disturbance strongly shaped the contemporary species composition and spatial patterns observed in the stand. The disturbance likely resulted in the large spatial cluster of L. tulipifera stems across the center of the plot, as many of the trees in this area established immediately following 1945. Liriodendron tulipifera is highly shade intolerant and requires large canopy gaps to establish [52]. Therefore, we posit that the 1945 disturbance removed a large number of canopy trees from the area occupied by the present-day cluster. Dendroecological analysis and stem mapping revealed a cluster of Quercus trees being released from this same area during the event, corroborating the likelihood of a sizable canopy removal from this area of the stand. Areas of the stand with more shade-tolerant species establishing or experiencing release ca. 1945 likely experienced canopy removal, as our stem maps indicated releases throughout the stand, but not to the extent of areas presently dominated by L. tulipifera. This apparent spatial heterogeneity of canopy removal in the stand during the 1945 event could be the result of heterogeneity in pre-disturbance composition and structure, the spatial extent of the disturbance agent itself, or a combination of the two. Compositional diversity following the event may also be partly explained by spatial heterogeneity in the advanced regeneration and understory tree layer prior to 1945. For example, stems in the northern corner of the stand, presently dominated by C. tomentosa, largely established from the 1910s to the 1930s, and were likely released from the understory following the 1945 event. The spatial arrangement of F. pennsylvanica in small spatial clusters indicates that this species responded well to gap-scale disturbances. Additionally, the recent influx of this species into the stand suggests a potential shift in recent disturbance regime such as lack of intermediate-severity disturbance and potentially fire exclusion.
The patterns we observed in the stand indicated that the condition of the stand immediately before the 1945 disturbance event and the spatial heterogeneity of canopy removal during the event were largely responsible for the observed structural complexity and compositional diversity of the stand. Although less apparent in the present legacy, the 1906 intermediate-severity disturbance event and numerous gap-scale events likely introduced heterogeneity into stand structure and composition, which influenced the outcome of the 1945 event. While our stem maps displayed areas of the stand that experienced canopy removal, care must be taken when using these maps to assess the true spatial extent of disturbances. Canopy removal events could be underestimated, as some areas of the stand may not have featured any Quercus stems capable of being released by these events, and mortality of Quercus stems may have occurred during or in subsequent years following the event. Also, some Quercus trees may have been present near a canopy removal point and may not have experienced release if they already occupied a high canopy position, and/or were of advanced age and incapable of a rapid growth response following adjacent canopy removal.

5. Conclusions

The contemporary stand condition featured multiple age classes and a relatively high degree of spatial, structural, and compositional heterogeneity similar to that of other late-successional multi-cohort stands in the eastern USA. Systems with high complexity such as this typically contain higher levels of biodiversity, promote resiliency, and maintain ecosystem function [4]. Accordingly, the benefits of emulating natural disturbance regimes to promote forest complexity are becoming well-known [9]. To optimize the effects of these management operations, silvicultural prescriptions must be informed by quantifications of the historical disturbance regime (e.g., spatial extent, frequency, and magnitude) in the appropriate biophysical settings [17].
Silvicultural treatments in similarly situated hardwood stands designed to enhance structural complexity can be patterned after the historical canopy disturbance regime documented in this study. Although it remains difficult to gauge the true spatial extent and magnitude of each discrete canopy disturbance, broad generalizations can be drawn from the disturbance reconstruction and contemporary stand condition. We documented two intermediate-severity disturbance events during stand development. The establishment of stems following 1945 throughout the stand indicates that the entire 1 ha study area was affected by an intermediate-severity disturbance event sufficiently severe to allow for an establishment pulse of a shade-intolerant species (L. tulipifera). The return interval of these events appears to be from ca. 40 years to more than 70 years. The spatial and compositional patterns of the stems that established following this event indicated that the impact of the disturbance was not spatially uniform across the stand. Accordingly, the effects of a canopy disturbance such as this can be emulated using group selection harvests in irregular spatial patterns with some relatively large gaps, and some relatively small gaps or may be approximated by other treatments that promote intra-stand heterogeneity such as variable retention harvesting and perhaps variable density thinning. Such treatments will create multiple niches through a heterogeneous light regime, thus promoting spatial and compositional diversity. The timing of these entries may be patterned after the return interval of natural intermediate-severity disturbances. These broader-scale canopy disturbances were superimposed over a disturbance regime characterized by frequent gap-scale events. In this region, single tree selection is not often practiced. One reason is that such a system typically promotes shade-tolerant species and it is usually moderately tolerant Quercus species that are more highly desired.
Quercus regeneration failure has been reported from Quercus-dominated stands throughout the eastern USA [53,54,55,56]. Managers that wish to maintain a strong Quercus component in stands with an abundance of shade-tolerant stems in the understory must acknowledge that strict adherence to natural disturbance processes in silvicultural systems may not perpetuate Quercus dominance. Often compromises must be made to meet management objectives. In many Quercus stands, a natural disturbance-based approach will accelerate succession toward shade-tolerant species [69,70]. In these successional stands, competition reduction measures are likely required to promote Quercus recruitment. The history of fire is unknown for our study site, however, fires are believed to have been a common disturbance agent in Quercus dominated forests of the eastern USA for millennia [71]. Although these fire histories are site specific [72], it is possible the stand was burned, and perhaps frequently, by Native Americans and later graziers from stand initiation until federal acquisition. Regardless, competition reduction by fire, chemical, or mechanical treatments may release Quercus seedlings to larger size classes. The removal of shade-tolerant competition may be outside the natural disturbance regime, but is required to prepare the regeneration layer for canopy tree harvesting. The multi-cohort stand studied here, as is common in mature Quercus stands, had an abundance of Quercus seedlings, but before any overwood is removed Quercus advanced reproduction must be in place (typically > 1100 Quercus stems ≥ 1.4 m height ha−1). Once advanced Quercus reproduction is in place the overwood could be removed in manners patterned after the natural canopy disturbance events documented here. Group shelterwoods with reserves, for example, could be used to remove wood products and retain the legacies of historical natural canopy disturbances.

Acknowledgments

We thank the USDA Forest Service, Oakmulgee Ranger District for funding this project and for logistical support. We also thank Keith Dunlap, Jonathan Davis Goode, Clint Irons, and Cole Senn for assistance with field data collection and laboratory procedures.

Author Contributions

S.A.F., J.S.K. and J.L.H. conceived and designed the study; S.A.F. and J.S.K. led field data collection and data analysis; S.A.F., J.S.K. and J.L.H. wrote the paper.

Conflicts of Interest

The authors declare no conflict of interest.

References

  1. Hansen, A.J.; Spies, T.A.; Swanson, F.J.; Ohmann, J.L. Conserving biodiversity in managed forests. BioScience 1991, 41, 382–392. [Google Scholar] [CrossRef]
  2. Aplet, G.H. Beyond even-vs. uneven-aged management: Toward a cohort-based silviculture. J. Sustain. For. 1994, 2, 423–433. [Google Scholar] [CrossRef]
  3. Hanson, J.J.; Lorimer, C.G. Forest structure and light regimes following moderate wind storms: Implications for multi-cohort management. Ecol. Appl. 2007, 17, 1325–1340. [Google Scholar] [CrossRef] [PubMed]
  4. Puettmann, K.J.; Coates, K.D.; Messier, C. A Critique of Silviculture: Managing for Complexity; Island Press: Washington, DC, USA, 2009. [Google Scholar]
  5. Folke, C.; Carpenter, S.; Walker, B.; Scheffer, M.; Elmqvist, T.; Gunderson, L.; Holling, C.S. Regime shifts, resilience, and biodiversity in ecosystem management. Annu. Rev. Ecol. Evol. Syst. 2004, 35, 557–581. [Google Scholar] [CrossRef]
  6. O'Hara, K.L.; Ramage, B.S. Silviculture in an uncertain world: Utilizing multi-aged management systems to integrate disturbance. Forestry 2013, 86, 401–410. [Google Scholar] [CrossRef]
  7. Halpin, C.R.; Lorimer, C.G. Trajectories and resilience of stand structure in response to variable disturbance severities in northern hardwoods. For. Ecol. Manag. 2016, 365, 69–82. [Google Scholar] [CrossRef]
  8. Shifley, S.R.; Moser, W.K.; Nowak, D.J.; Miles, P.D.; Butler, B.J.; Aguilar, F.X.; DeSantis, R.D.; Greenfield, E.J. Five anthropogenic factors that will radically alter forest conditions and management needs in the northern United States. For. Sci. 2014, 60, 914–925. [Google Scholar] [CrossRef]
  9. Long, J.N. Emulating natural disturbance regimes as a basis for forest management: A North American view. For. Ecol. Manag. 2009, 257, 1868–1873. [Google Scholar] [CrossRef]
  10. Keeton, W.S. Managing for late-successional/old-growth characteristics in northern hardwood-conifer forests. For. Ecol. Manag. 2006, 235, 129–142. [Google Scholar] [CrossRef]
  11. O’Hara, K. Multiaged Silviculture: Managing for Complex Forest stand Structures; Oxford University Press: Oxford, UK, 2014. [Google Scholar]
  12. Churchill, D.J.; Larson, A.J.; Dahlgreen, M.C.; Franklin, J.F.; Hessburg, P.F.; Lutz, J.A. Restoring forest resilience: From reference spatial patterns to silvicultural prescriptions and monitoring. For. Ecol. Manag. 2013, 291, 442–457. [Google Scholar] [CrossRef]
  13. Dickinson, Y.; Pelz, K.; Giles, E.; Howie, J. Have we been successful? Monitoring horizontal forest complexity for forest restoration projects. Restor. Ecol. 2016, 24, 8–17. [Google Scholar] [CrossRef]
  14. Oliver, C.D. Forest development in North America following major disturbances. For. Ecol. Manag. 1980, 3, 153–168. [Google Scholar] [CrossRef]
  15. Martin, W.H. Characteristics of old-growth mixed mesophytic forests. Nat. Areas J. 1992, 12, 127–135. [Google Scholar]
  16. Johnson, P.S.; Shifley, S.R.; Rogers, R. The Ecology and Silviculture of Oaks, 2nd ed.; CABI: Oxfordshire, UK, 2009. [Google Scholar]
  17. Seymour, R.S.; White, A.S.; de Maynadier, P.G. Natural disturbance regimes in northeastern North America: Evaluating silvicultural systems using natural scales and frequencies. For. Ecol. Manag. 2002, 155, 357–367. [Google Scholar] [CrossRef]
  18. Henry, J.D.; Swan, J.M.A. Reconstructing Forest History from Live and Dead Plant Material—An Approach to the Study of Forest Succession in Southwest New Hampshire. Ecology 1974, 55, 772–783. [Google Scholar] [CrossRef]
  19. Oliver, C.D.; Stephens, E.P. Reconstruction of a Mixed-Species Forest in Central New England. Ecology 1977, 58, 562–572. [Google Scholar] [CrossRef]
  20. Lorimer, C.G. Methodological considerations in the analysis of forest disturbance history. Can. J. For. Res. 1985, 15, 200–213. [Google Scholar] [CrossRef]
  21. Lorimer, C.G.; Frelich, L.E. A methodology for estimating canopy disturbance frequency and intensity in dense temperate forests. Can. J. For. Res. 1989, 19, 651–663. [Google Scholar] [CrossRef]
  22. Oliver, C.D.; Larson, B.C. Forest Stand Dynamics; Wiley: New York, NY, USA, 1996. [Google Scholar]
  23. Whitney, G.G. From Coastal Wilderness to Fruited Plain: A History of Environmental Change in Temperate North America from 1500 to the Present; Cambridge University Press: Cambridge, UK, 1996. [Google Scholar]
  24. Lorimer, C.G. Historical and ecological roles of disturbance in eastern North American forests: 9000 years of change. Wildl. Soc. Bull. 2001, 29, 425–439. [Google Scholar]
  25. Burrascano, S.; Keeton, W.S.; Sabatini, F.M.; Blasi, C. Commonality and variability in the structural attributes of moist temperate old-growth forests: A global review. For. Ecol. Manag. 2013, 291, 458–479. [Google Scholar] [CrossRef]
  26. Fenneman, N.M. Physiography of Eastern United States; McGraw-Hill: New York, NY, USA, 1938; p. 714. [Google Scholar]
  27. Griffith, G.E.; Omernik, J.M.; Comstock, J.A.; Lawrence, S.; Martin, G.; Goddard, A.; Hulcher, V.J.; Foster, T. Ecoregions of Alabama and Georgia (Color Poster with Map, Descriptive Text, Summary Tables, and Photographs; Map Scale 1:17,000,000); US Geological Survey: Reston, VA, USA, 2001.
  28. Shankman, D.; Hart, J.L. The fall line: A physiographic-forest vegetation boundary. Geogr. Rev. 2007, 97, 502–519. [Google Scholar] [CrossRef]
  29. Cox, L.E.; Hart, J.L. Two Centuries of Forest Compositional and Structural Changes in the Alabama Fall Line Hills. Am. Midl. Nat. 2015, 174, 218–237. [Google Scholar] [CrossRef]
  30. Thornthwaite, C.W. An approach toward rational classification of climate. Geogr. Rev. 1948, 38, 55–94. [Google Scholar] [CrossRef]
  31. PRISM Climate Group. Northwest Alliance for Computational Science and Engineering. Available online: http://www.prism.oregonstate.edu/ (accessed on 13 December 2016).
  32. USDA NRCS (United States Department of Agriculture, Natural Resources Conservation Service). Web Soil Survey. Available online: http://websoilsurvey.nrcs.usda.gov/ (accessed on 6 December 2016).
  33. FIA. Forest Inventory and Analysis National Program. 3.0 Phase 3 Field Guide–Down Woody Materials. Available online: https://www.fia.fs.fed.us/library/field-guides-methods-proc/ (accessed on 25 January 2017).
  34. Buchanan, M.L.; Hart, J.L. A methodological analysis of canopy disturbance reconstructions using Quercus alba. Can. J. For. Res. 2011, 41, 1359–1367. [Google Scholar] [CrossRef]
  35. Stokes, M.A.; Smiley, T.C. An introduction to Tree-Ring Dating; University of Arizona Press: Tuscon, AZ, USA, 1996. [Google Scholar]
  36. Orvis, K.H.; Grissino-Mayer, H.D. Standardizing the reporting of abrasive papers used to surface tree-ring samples. Tree Ring Res. 2002, 58, 47–50. [Google Scholar]
  37. Nowacki, G.J.; Abrams, M.D. Radial-growth averaging criteria for reconstructing disturbance histories from presettlement-origin oaks. Ecol. Monogr. 1997, 67, 225–249. [Google Scholar] [CrossRef]
  38. Rubino, D.L.; McCarthy, B.C. Comparative analysis of dendroecological methods used to assess disturbance events. Dendrochronologia 2004, 21, 97–115. [Google Scholar] [CrossRef]
  39. Hart, J.L.; Grissino-Mayer, H.D. Vegetation patterns and dendroecology of a mixed hardwood forest on the Cumberland Plateau: Implications for stand development. For. Ecol. Manag. 2008, 255, 1960–1975. [Google Scholar] [CrossRef]
  40. Hart, J.L.; Cowden, M.M.; Torreano, S.J.; Vestal, J.P.R. Disturbance, succession, and structural development of an upland hardwood forest on the Interior Low Plateau, Tennessee. Nat. Areas J. 2015, 35, 557–573. [Google Scholar] [CrossRef]
  41. Lorimer, C.G. Age structure and disturbance history of a southern Appalachian virgin forest. Ecology 1980, 61, 1169–1184. [Google Scholar] [CrossRef]
  42. Fraver, S.; White, A.S. Identifying growth releases in dendrochronological studies of forest disturbance. Can. J. For. Res. 2005, 35, 1648–1656. [Google Scholar] [CrossRef]
  43. Hart, J.L.; van de Gevel, S.L.; Grissino-Mayer, H.D. Forest dynamics in a natural area of the southern Ridge and Valley, Tennessee. Nat. Areas J. 2008, 28, 275–289. [Google Scholar] [CrossRef]
  44. Pommerening, A. Approaches to quantifying forest structures. Forestry 2002, 75, 305–324. [Google Scholar] [CrossRef]
  45. Kint, V.; van Meirvenne, M.; Nachtergale, L.; Geudens, G.; Lust, N. Spatial methods for quantifying forest stand structure development: A comparison between nearest-neighbor indices and variogram analysis. For. Sci. 2003, 49, 36–49. [Google Scholar]
  46. Saunders, M.R.; Wagner, R.G. Long-term spatial and structural dynamics in Acadian mixedwood stands managed under various silvicultural systems. Can. J. For. Res. 2008, 38, 498–517. [Google Scholar] [CrossRef]
  47. Pastorella, F.; Paletto, A. Stand structure indices as tools to support forest management: An application in Trentino forests (Italy). J. For. Sci. 2013, 59, 159–168. [Google Scholar]
  48. Pommerening, A.; Stoyan, D. Edge-correction needs in estimating indices of spatial forest structure. Can. J. For. Res. 2006, 36, 1723–1739. [Google Scholar] [CrossRef]
  49. Graz, F.P. The behaviour of the species mingling index Msp in relation to species dominance and dispersion. Eur. J. For. Res. 2004, 123, 87–92. [Google Scholar] [CrossRef]
  50. Graz, F.P. Spatial diversity of dry savanna woodlands. In Forest Diversity and Management; Hawksworth, D.L., Bull, A.T., Eds.; Springer Science and Business Media: Dordrecht, The Netherlands, 2006; pp. 83–97. [Google Scholar]
  51. Robison, S.A.; McCarthy, B.C. Potential factors affecting the estimation of light availability using hemispherical photography in oak forest understories. J. Torrey Bot. Soc. 1999, 126, 344–349. [Google Scholar] [CrossRef]
  52. Busing, R.T. Disturbance and the population dynamics of Liriodendron tulipifera: Simulations with a spatial model of forest succession. J. Ecol. 1995, 83, 45–53. [Google Scholar] [CrossRef]
  53. Lorimer, C.G. Development of the red maple understory in northeastern oak forests. For. Sci. 1984, 30, 3–22. [Google Scholar]
  54. Abrams, M.D. The red maple paradox. BioScience 1998, 48, 355–364. [Google Scholar] [CrossRef]
  55. McEwan, R.W.; Dyer, J.M.; Pederson, N. Multiple interacting ecosystem drivers: Toward an encompassing hypothesis of oak forest dynamics across Eastern North America. Ecography 2011, 34, 244–256. [Google Scholar] [CrossRef]
  56. Nowacki, G.J.; Abrams, M.D. Community, edaphic, and historical analysis of mixed oak forests of the Ridge and Valley Province in central Pennsylvania. Can. J. For. Res. 1992, 22, 790–800. [Google Scholar] [CrossRef]
  57. Richards, J.D.; Hart, J.L. Canopy gap dynamics and development patterns in secondary Quercus stands on the Cumberland Plateau, Alabama, USA. For. Ecol. Manag. 2011, 262, 2229–2239. [Google Scholar]
  58. White, S.D.; Hart, J.L.; Schweitzer, C.J.; Dey, D.C. Altered structural development and accelerated succession from intermediate-severity wind disturbance in Quercus stands on the Cumberland Plateau, USA. For. Ecol. Manag. 2015, 336, 52–64. [Google Scholar] [CrossRef]
  59. USDA APHIS (United States Department of Agriculture, Animal and Plant Health Inspection Service). Cooperative Emerald Ash Borer Project: EAB County Detections. Available online: Https://www.aphis.usda.gov/plant_health/plant_pest_info/emerald_ash_b (accessed on 7 December 2016).
  60. Sobek-Swant, S.; Kluza, D.A.; Cuddington, K.; Lyons, D.B. Potential distribution of emerald ash borer: What can we learn from ecological niche models using Maxent and GARP? For. Ecol. Manag. 2012, 281, 23–31. [Google Scholar]
  61. Parker, G.R. Old-growth forests of the central hardwood region. Nat. Areas J. 1989, 9, 5–11. [Google Scholar]
  62. Hart, J.L.; Clark, S.L.; Torreano, S.J.; Buchanan, M.L. Composition, structure, and dendroecology of an old-growth Quercus forest on the tablelands of the Cumberland Plateau, USA. For. Ecol. Manag. 2012, 266, 11–24. [Google Scholar] [CrossRef]
  63. Kupfer, J.A.; Kirsch, S.W. Heterogeneity of forest characteristics in primary and secondary forest stands on the third Chickasaw loess bluff, Tennessee. Phys. Geogr. 1998, 19, 35–54. [Google Scholar]
  64. Runkle, J.R. Gap regeneration in some old-growth forests of the eastern United States. Ecology 1981, 62, 1041–1051. [Google Scholar]
  65. Runkle, J.R. Disturbance regimes in temperate forests. In The Ecology of Natural Disturbance and Patch Dynamics; Pickett, S.T.A., White, P.S., Eds.; Academic Press: New York, NY, USA, 1985; pp. 17–33. [Google Scholar]
  66. Runkle, J.R. Canopy tree turnover in old-growth mesic forests of eastern North America. Ecology 2000, 81, 554–567. [Google Scholar] [CrossRef]
  67. Cox, L.E.; Hart, J.L.; Dey, D.C.; Schweitzer, C.J. Composition, structure, and intra-stand spatial patterns along a disturbance severity gradient in a Quercus stand. For. Ecol. Manag. 2016, 381, 305–317. [Google Scholar] [CrossRef]
  68. Ruffner, C.M.; Abrams, M.D. Relating land-use history and climate to the dendroecology of a 326-year-old Quercus prinus talus slope forest. Can. J. For. Res. 1998, 28, 347–358. [Google Scholar] [CrossRef]
  69. Abrams, M.D.; Nowacki, G.J. Historical variation in fire, oak recruitment, and post-logging accelerated succession in central Pennsylvania. Bull. Torrey Bot. Club 1992, 119, 19–28. [Google Scholar]
  70. Holzmueller, E.J.; Gibson, D.J.; Suchecki, P.F. Accelerated succession following an intense wind storm in an oak-dominated forest. For. Ecol. Manag. 2012, 279, 141–146. [Google Scholar] [CrossRef]
  71. Lafon, C.W.; Naito, A.T.; Grissino-Mayer, H.D.; Horn, S.P.; Waldrop, T.A. Fire History of the Appalachian Region: A Review and Synthesis; US Department of Agriculture, Forest Service, Southern Research Station: Asheville, NC, USA, 2017; p. 97.
  72. Hart, J.L.; Buchanan, M.L. History of fire in eastern oak forests and implications for restoration. In Proceedings of the 4th Fire in Eastern Oak Forests Conference, USDA Forest Service General Technical Report GTR-NRS, Springfield, MO, USA, 17–19 May 2011; p. 102.
Figure 1. Map of the study site within the Oakmulgee Ranger District of the Talladega National Forest. The square represents the 1 ha study plot. The shaded area within the Alabama inset map represents the Oakmulgee Ranger District.
Forests 08 00093 g001
Figure 2. Crown class distributions of trees (≥5 cm dbh) by group in a multi-cohort forest on the Oakmulgee Ranger District of the Talladega National Forest, Alabama. Crown classes are based on the amount and direction of intercepted light [22]. See Table 1 for a list of species included in the others group.
Forests 08 00093 g002
Figure 3. Diameter class distributions of trees (≥5 cm dbh) by group in a multi-cohort forest on the Oakmulgee Ranger District of the Talladega National Forest, Alabama. See Table 1 for a list of species included in the others group.
Forests 08 00093 g003
Figure 4. Histogram of Mi values for the five most important species. A value of 1 indicates that the four nearest neighbors of a focal stem are different species from the focal stem. A value of 0 indicates the four nearest neighbors are the same species as the focal stem.
Forests 08 00093 g004
Figure 5. Stem maps showing the position of trees (>5 cm dbh) across a 1 ha (100 m × 100 m) plot for the four most abundant species in a multi-cohort forest on the Oakmulgee Ranger District of the Talladega National Forest. Dot size reflects the Mi value for each stem with larger dots reflecting lower Mi values. Note stems within 5 m of the plot boundary are not shown.
Forests 08 00093 g005
Figure 6. Age structure by group in a multi-cohort forest on the Oakmulgee Ranger District of the Talladega National Forest. Note decades without an inner date record are not included. See Table 1 for a list of species included in the others group.
Forests 08 00093 g006
Figure 7. Stem maps of a 1 ha plot showing the position of present day canopy Quercus trees that were at least 10 years of age in 1906 and 1945, respectively. Solid dots indicate stems experiencing release in the respective year, open dots indicate stems not experiencing release in the respective year.
Forests 08 00093 g007
Table 1. Density (stems·ha−1), relative density, dominance (basal area, m2·ha−1), relative dominance, relative importance (mean of relative density and relative dominance), and mingling index for trees (live stems ≥ 5 cm dbh) documented in a multi-cohort forest on the Oakmulgee Ranger District of the Talladega National Forest, Alabama. Species are ranked by importance. dbh, diameter at breast height.
SpeciesDensity (stems·ha−1)Relative Density (%)Dominance (m2·ha−1)Relative Dominance (%)ImportanceMingling (Msp)
Quercus alba L.7915.77.126.821.30.79
Liriodendron tulipifera L.8316.56.725.320.90.64
Carya tomentosa (Lam.) Nutt.509.92.710.210.00.79
Fraxinus pennsylvanica Marshall7815.51.03.79.60.77
Carya glabra (Mill.) Sweet255.02.59.47.20.92
Oxydendrum arboreum (L.) DC.316.20.72.64.40.83
Quercus rubra L.153.01.34.73.80.94
Nyssa sylvatica Marshall173.41.03.73.61.00
Pinus echinata Mill.81.61.45.43.51.00
Frangula caroliniana (Walter) A. Gray275.40.10.32.80.81
Quercus stellata Wangenh.71.40.82.92.20.75
Cornus florida L.173.40.10.41.91.00
Fagus grandifolia Ehrh.132.60.20.61.60.56
Liquidambar styraciflua L.132.60.10.51.51.00
Quercus velutina Lam.71.40.41.41.41.00
Sassafras albidum (Nutt.) Nees71.40.10.30.80.79
Tilia americana L.51.00.00.10.61.00
Halesia carolina L.51.00.00.10.50.90
Quercus coccinea Münchh.20.40.20.60.51.00
Prunus alabamensis C. Mohr40.80.00.10.51.00
Crataegus sp.40.80.00.00.41.00
Diospyros virginiana L.10.20.10.50.4-
Cercis canadensis L.30.60.00.10.30.75
Ostrya virginiana (Mill.) K. Koch10.20.00.00.11.00
Acer rubrum L.10.20.00.00.11.00
Vaccinium arboreum Marshall10.20.00.00.11.00
Total504100.026.6100.0100.0
Table 2. Density (stems·ha−1) and relative density of seedlings (live woody stems < 1 m height) and saplings (live woody stems ≥ 1.0 m height and ˂5 cm dbh) documented in a multi-cohort forest on the Oakmulgee Ranger District of the Talladega National Forest, Alabama. Listed alphabetically.
SeedlingsSaplings
SpeciesDensity·ha−1Relative DensityDensity·ha−1Relative Density
Acer rubrum200.100.0
Aesculus pavia L.800.3100.6
Asimina triloba (L.) Dunal8303.400.0
Callicarpa americana L.2901.218010.2
Calycanthus floridus L.2901.200.0
Carya glabra20008.100.0
Carya tomentosa10704.3301.7
Cercis canadensis4701.9402.3
Celtis occidentalis L.14605.91206.8
Chionanthus virginicus L.00.0100.6
Cornus florida500.200.0
Crataegus sp.600.2704.0
Diospyros virginiana6502.6502.8
Frangula caroliniana11104.51508.5
Fraxinus pennsylvanica1000.4201.1
Halesia carolina12805.280045.5
Hamamelis virginiana L.1100.4100.6
Hydrangea arborescens L.3601.500.0
Liriodendron tulipifera300.1100.6
Nyssa sylvatica5302.1603.4
Oxydendrum arboreum00.0301.7
Pinus L.200.100.0
Prunus alabamensis100.0100.6
Prunus umbellata Elliott100.000.0
Quercus alba11,30045.7804.5
Quercus coccinea100.000.0
Quercus falcata Michx.1100.400.0
Quercus nigra L.200.100.0
Quercus rubra4301.700.0
Quercus stellata900.400.0
Quercus velutina10404.2301.7
Sassafras albidum2300.900.0
Tilia americana3601.5201.1
Vaccinium arboreum200.1301.7
Viburnum acerifolium L.2701.100.0
Total24,710100.01760100.0
Table 3. Calculation of M for the five most dominant species in a multi-cohort forest on the Oakmulgee Ranger District of the Talladega National Forest, Alabama. Note species proportion (Psp) were calculated from trees after implementation of the 5 m buffer zone.
SpeciesPspMsp1 − MspM (Psp/1 − Msp)
Liriodendron tulipifera0.180.640.360.50
Fraxinus pennsylvanica0.160.770.230.70
Quercus alba0.150.790.210.71
Carya tomentosa0.100.790.210.48
Carya glabra0.050.920.080.63

