
Prescribed Burning and Erosion Potential in Mixed Hardwood Forests of Southern Illinois
by
 ,
,
Gurbir Singh
1,* ,
,
Jon E. Schoonover
1,*,
Kyle S. Monroe
2,
Karl W. J. Williard
1 and
Charles M. Ruffner
1 1
Department of Forestry, College of Agricultural Sciences, Southern Illinois University, Carbondale, IL 62901, USA
2
Missouri Department of Conservation, Hannibal, MO 63401, USA
*
Authors to whom correspondence should be addressed.
Forests 2017, 8(4), 112; https://doi.org/10.3390/f8040112
Submission received: 8 February 2017
/
Revised: 24 March 2017
/
Accepted: 4 April 2017
/
Published: 7 April 2017
Abstract
:Prescribed fire has several benefits for managing forest ecosystems including reduction of fuel loading and invasive species and enhanced regeneration of desirable tree species. Along with these benefits there are some limitations like nutrient and sediment loss which have not been studied extensively in mixed hardwood forests. The objective of our research was to quantify the amount of sediment movement occurring on a watershed scale due to prescribed fire in a southern Illinois mixed hardwood ecosystem. The research site was located at Trail of Tears State Forest in western Union county, IL, USA and included five watershed pairs. One watershed in each pair was randomly assigned the prescribed burn treatment and the other remained as control (i.e., unburned). The prescribed burn treatment significantly reduced the litter depth with 12.6%–31.5% litter remaining in the prescribed burn treatment watersheds. When data were combined across all watersheds, no significant differences were obtained between burn treatment and control watershed for total suspended solids and sediment concentrations or loads. The annual sediment losses varied from 1.41 to 90.54 kg·ha−1·year−1 in the four prescribed burn watersheds and 0.81 to 2.54 kg·ha−1·year−1 in the four control watersheds. Prescribed burn watershed 7 showed an average soil sediment loss of 4.2 mm, whereas control watershed 8 showed an average accumulation of sediments (9.9 mm), possibly due to steeper slopes. Prescribed burning did not cause a significant increase in soil erosion and sediment loss and can be considered acceptable in managing mixed hardwood forests of Ozark uplands and the Shawnee Hills physiographic regions of southern Illinois.
1. Introduction
Fire is an important disturbance mechanism for maintaining forest ecosystems. However, fire suppression in the United States began with European settlement and the concern of wildfires burning over rural communities. Early forest ecologists such as Clements [1] believed that fire interrupted the natural processes of a forest association and negated the importance of fire across forest ecosystems. However, by the 1950s some ecologists had asserted the role of fire in maintaining some keystone ecosystems such as the ponderosa pine and prairie ecosystems across the west. In the eastern hardwoods of North America, where historic fire regimes consisted of fairly frequent, low intensity surface fires, fire suppression began in the early 1910s–1920s with the advent of fire patrols, lookout towers, and fire wardens [2]. The near removal of modern fire from central hardwood forests has allowed mesophytic species to begin dominating the understories of many oak-hickory forests [3,4]. To combat this trend, land managers in the east have developed prescriptions for applying fire to oak woodlands to decrease mesophytic encroachment and restore historic conditions to these enduring systems [4,5]. With increased burning, some concerned local groups have suggested that the loess soils of southern Illinois are too friable and steep to support prescribed burning. Thus, reintroduction of prescribed fire in forest ecosystems justifies this research to ensure that best management practices are taken into consideration for each ecosystem when prescribed fires are considered as a management tool.
Prescribed fires can reduce fuel loading on the forest floor [5], resulting in lower chances of wildfires that tend to burn with higher intensity and result in greater impacts on the landscape, such as removal of the duff layer and exposure of upland soils. Prescribed fires are generally planned with lower heat outputs which result in fires of lower intensity and which are hopefully less severe on the environment than wildfires [6]. Under mixed hardwood forest cover, prescribed fires tend to burn at a relatively low intensity, where temperatures typically do not exceed 200 to 250 °C [7], resulting in minimal subsurface heating of the soil [8]. Spigel and Robichaud [9] identified five factors that influence the impacts of prescribed fire on a landscape: burn area, topography, soil properties, climate, and channel proximity. Seasonally burning mixed hardwood forests in the fall can help in litter removal to prepare the seed bed, promote forbs and herbaceous recruitment, and can reduce invasive species [10,11,12,13]. The meta-analysis conducted by Brose, Dey, Phillips, and Waldrop [13], supported the idea that prescribed fire can help in improved regeneration of mixed-oak forests in some situations.
In undisturbed forested ecosystems, precipitation falls onto an intact litter layer and then infiltrates into the duff layer and soil while generating little to no overland flow [14]. Due to the removal of much of the litter layer on burnt forest floors, rain comes into direct contact with soil particles, leading to increased soil particle displacement and subsequent overland water flow causing sediment movement and sheet or rill erosion [15]. Potential increased erosion over the burned area can result in movement of eroded sediments to the lower unburned portions of watersheds [16], or continued movement of eroded sediments down the watershed ultimately ending in streambeds, resulting in increasing stream sedimentation as well as changes to nutrient concentrations in streams impacting water quality [6].
Wildfires and prescribed fires both can alter the hydrologic cycle in forest ecosystems, but the extent of their impacts depends on several factors [3,8,17,18]. Prescribed fires rarely consume the humic horizon of the duff layer on the soil surface and expose it to solar heating or rainfall [8]. The consumption of organic matter increases nutrient availability in the soil [8] that, if not assimilated by plants, can be potentially lost through leaching or erosion [19,20,21]. Heating of soil particles and burning of the organic layer can alter the soil structure and absorption rates, increasing erosion potential [19,22]. However, low subsurface temperatures of prescribed burns under mixed hardwoods decreases the chance that a drastic change in soil structure would occur. This may lead to less sediment movement following a low temperature prescribed burn, when compared to the effects of a high temperature burn or wildfire [23]. In a study conducted by Robichaud [14], runoff hydrographs from simulated rainfall showed no significant difference between unburned-undisturbed areas when compared to areas that were subjected to low-severity burns. This suggests that prescribed fires do not burn the entire duff layer; clearly some of the humic/sappric layer remains protecting the soil particles from the erosive force of raindrops and canopy throughfall.
Conflicting results have been reported about the effects of burning on soil erosion [24,25,26,27,28]. Additionally, runoff generation and soil erosion on steep slopes after prescribed fire has not been studied extensively in mixed hardwood forests. In a study conducted by Moffet et al. [29], field test data were compared with the Water Erosion Prediction Project (WEPP) model on sagebrush rangeland with steep slopes before and after a prescribed fire in southwest Idaho. The results concluded that rill erosion was the most prominent erosion process, and that the WEPP model significantly underestimated the soil erosion for burned conditions. Another study by Soto and Díaz-Fierros [30] used field test data and the WEPP model to determine erosion rates after prescribed burning on scrub-bearing hillslopes in northwest Spain. In this study, the WEPP model again underestimated modelled erosion losses compared to measured erosion losses after burning. Until a more accurate model is created to account for fire on a landscape, field tests still appear to be the most accurate option.
It is anticipated that mixed hardwood forests of southern Illinois, USA might show minimal amounts of sediment movement within the watershed because of low prescribed fire intensities. The objectives of our research were: (1) to quantify the amount of sediment movement occurring on a watershed scale after the implementation of a prescribed fire, and (2) to contribute to a better understanding of the effects of prescribed burning on the soil resources found in the mixed hardwood ecosystems of southern Illinois. The current knowledge of soil erosion that occurs after a prescribed burn in southern Illinois is virtually unknown except for personal observations of the authors and other local professionals. The information garnered from this project can give land managers the ability to have a better understanding of the effects of prescribed burning on soil resources and allow for this management tool to be used in a more sustainable manner.
2. Materials and Methods
2.1. Study Location
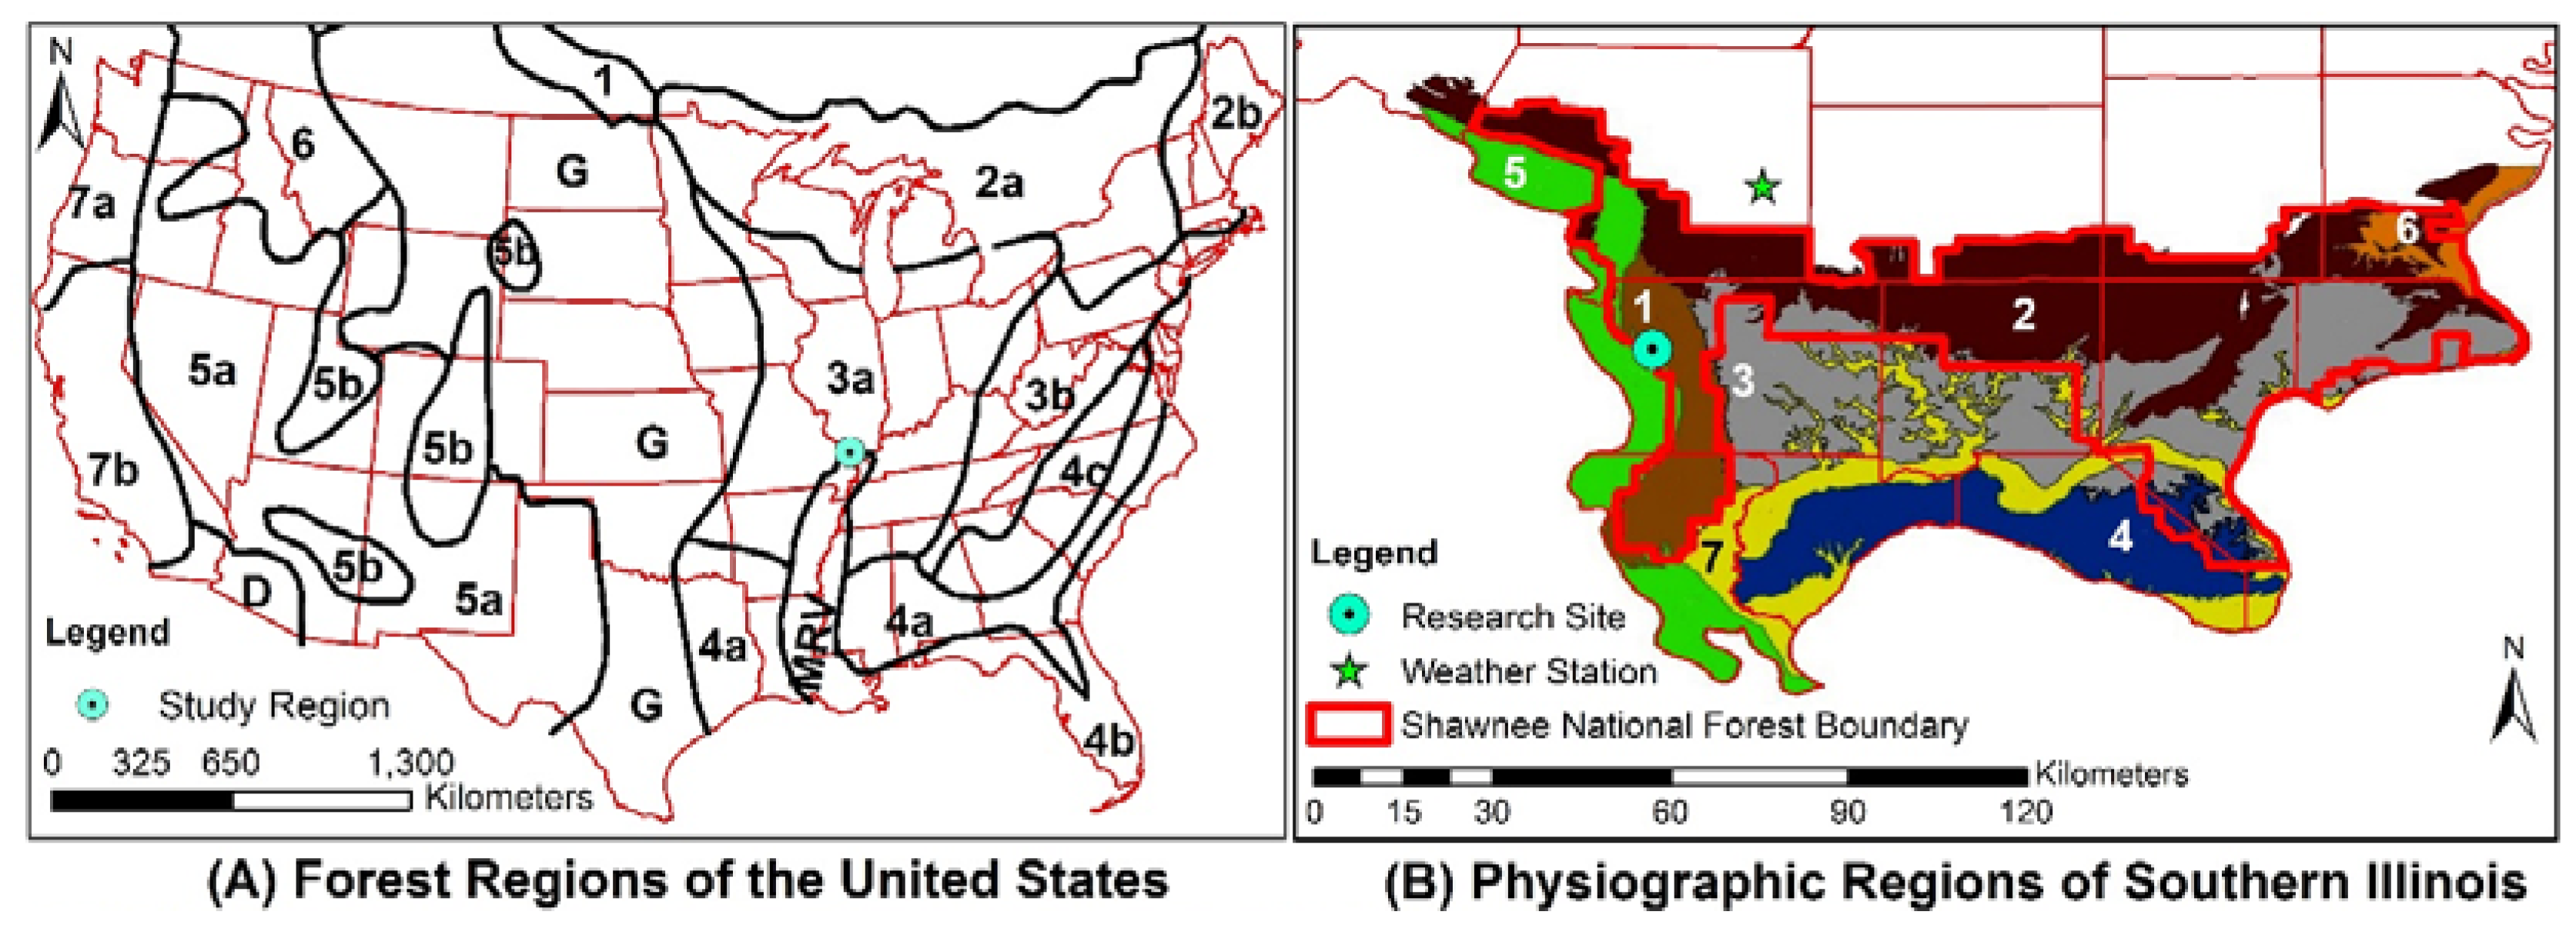
The research site was located at Trail of Tears State Forest (TTSF) in western Union county, about eight kilometers’ northwest of Jonesboro, IL (Figure 1) (Latitude 37.485504; Longitude −89.364989). The southern Illinois region and Union county are part of the central hardwood region of the United States. This region has been subjected to a wide range of silvicultural practices and disturbances, including wildfires and clearcutting for agricultural landuse (4). Historically, due to frequent surface fires and periodic timber harvesting, Quercus and Carya species flourished in this region [31,32]. However, the widespread suppression of fire and reduced timber harvesting in the past 100 years have led to increased dominance of shade tolerant mesophytic species [2].
The state forest site is just over 2000 hectares in size and is managed for timber (limited overstory removal), wildlife, ecosystem preservation, watershed protection, and recreation resources by the Illinois Department of Natural Resources (IDNR). This location was selected for the study because of the steep topography of the loess covered Ozark hills, which cover the majority of the forest. The Ozark hills present some of the most rugged terrain in Illinois, and are susceptible to high erosion potential due to deep loess deposits [33]. There are two dominant soil series found on the treatment site that make up the Menfro-Clarksville complex. The Menfro series is a silt loam and is classified as fine-silty, mixed, superactive, mesic Typic Hapludalfs. The Clarksville series is a gravelly silt loam and is classified as loamy-skeletal, siliceous, semiactive, mesic Typic Paleudults [34]. The climate of the region can be described as continental, with hot humid summers and cool to cold winters. The average temperature for the region is 13.8 °C, and average annual precipitation is 1163 mm [4].
2.2. Watershed Delineation and Experimental Design
A Topcon® total station was used to delineate watershed boundaries and average watershed slopes were calculated by creating a digital elevation model (DEM) for each watershed (Topcon, Livermore, CA, USA). The watershed boundaries were marked by walking their perimeter and hanging flagging along the boundary, and were then delineated using GPS equipment (Garmin Corporation, New Taipie City, Taiwan, China) and GIS software (ArcGIS 9.3, ESRI, Redlands, California, CA, USA). The experimental design consisted of five paired-watersheds encompassing all aspects (slope, vegetation, depth of litter layer), including the microclimates that occur within the mixed hardwood forest ecosystems. Watersheds 1 and 2 (Pair 1) were north facing, watersheds 3 and 4 (Pair 2) were south facing, watersheds 5 and 6 (Pair 3) were east facing, watersheds 7 and 8 (Pair 4) as well as watersheds 9 and 10 (Pair 5) were west facing. After the first few rainfall events, observations showed that karst topography was influencing the behavior of watersheds 1 and 2, resulting in the removal of this pair of watersheds (Pair 1) from the study. Variables used to establish similar characteristics of watersheds included: slope (%), area (ha), tree species composition, and soil series. Details of percent slope and area per watershed are presented in Table 1. The average percent slopes were similar among the watersheds, with a 6.7% difference between the most gradual and the steepest slopes (Table 1). Watersheds 7 and 8 were selected to represent “extreme” slope conditions for the region. After removing these two watersheds, there was only a 3.5% difference in the average percent slope among the remaining watersheds. The watershed areas were also comparable, ranging from 0.06 ha (640.9 m2) to 0.12 ha (1223.1 m2) (Table 1). Slope and aspect were not statistically significant factors impacting sediment loss, therefore no further discussion is presented.
2.3. Pre-Burn Data Collection
Litter depths were taken at 18 locations within each of the eight watersheds prior to the prescribed burn. The litter depth was used to determine if the paired-watersheds have similar amounts of surface organic matter accumulation and to help quantify burn severity and burn intensity after the prescribed fire. Measurements were taken by placing a ruler into the leaf litter and measuring (cm) from the soil surface to the top of the highest leaf curl. Soil moisture (volumetric water content) was collected randomly at 18 locations within each of the eight watersheds prior to the prescribed fire. A field scout time-domain reflectometer (TDR, Spectrum Technologies, Aurora, IL, USA) probe was used to determine pre-burn soil moisture on 5 November 2009. Soil moisture measurements were taken again following the burn so that comparisons could be made between pre- and post-burn volumetric water content at a soil depth of 15 cm. Weather conditions (i.e., temperature, wind speed, relative humidity) were also monitored before and during the prescribed burn. A tipping bucket rain gauge was installed at TTSF to provide more site-specific weather data during the study. Average annual temperature and precipitation data from 1990 to 2008 was obtained from the nearest weather station located to north of the research site in Carbondale, IL (Figure 1). Weather data was provided by Water and Atmospheric Resources Monitoring Program, Illinois Climate Network (2016).
2.4. Vegetative Data Collection Procedures
Forest inventory plots were taken within all study watersheds to determine species composition by basal area (m2·ha−1), mature trees (ha−1), saplings (ha−1), and seedlings (ha−1) (Table 1). Each watershed contained two sample plots that did not overlap each other. The two points, which became plot center, were randomly located within the watersheds. Each random point was used as the center for three nested plots of 3.05 m, 7.62 m, and 15.24 m [36]. Within each 15.24 m diameter plot, species and diameter at breast height (DBH) were recorded for each tree greater than 9 cm DBH. The 7.62 m diameter plots were used to determine sapling density of stems measuring 2 cm to 9 cm at DBH [36]. The 3.05 m diameter plots were used to determine seedling density by measuring stems less than 2 cm. Across all watersheds, the three most dominant mature tree species (>9 cm) were Acer saccharum (28%), Quercus alba (20.5%), and Quercus rubra (12.9%). The three most prevalent sapling species (2–9 cm) were Acer saccharum (47.2%), Fagus grandifolia (20.8%), and Ostrya virginiana (7.5%). The most abundant seedlings (<2 cm) were Fagus grandifolia (11.3%), Quercus alba (11.3%), Nyssa sylvatica (10.5%), and Ulmus americana (10.5%). Species composition, including basal area, mature trees, seedlings, and saplings by watershed were not statistically significant independent variables that influenced the dependent variables (total suspended solids and sediment concentrations or loads), therefore no further discussion in presented.
2.5. Installation of Sediment Collection Equipment
To assess scour and deposition, 18 rebar erosion pins were installed randomly throughout each watershed. Erosion pins were constructed from 9.5 mm rebar cut into 61 cm lengths, with 12.7 mm fender washers welded to the rebar in the center of the rebar. Rebar were pressed into the ground until the washer was flush with the surface of the soil (Figure 2). The erosion pins were measured one year following the burn. Each watershed outlet was equipped with a 45-cm wide, galvanized metal flume that was fabricated by a local sheet metal shop in Carbondale, IL. To prevent water from bypassing the flume, 61 cm × 243 cm galvanized steel sheets were oriented with the long side on the ground and buried ~30 cm deep on each side of the flume. The sheets were buried at an angle and were connected to the front sides of the flume with screws and sealed with silicon (Figure 2). At the downslope edge of the flume a 10-cm diameter polyvinyl chloride (PVC) pipe with a 10-cm elbow was attached to a collar on the flume to route runoff into a 1150 L polyethylene tank. Each tank was calibrated and the side of the tank was labeled in 20 L intervals (Figure 2). The tank was installed on a leveled footing below the watershed outlet to allow the water from the PVC pipe to flow into the tank via gravity.
2.6. The Prescribed Burn
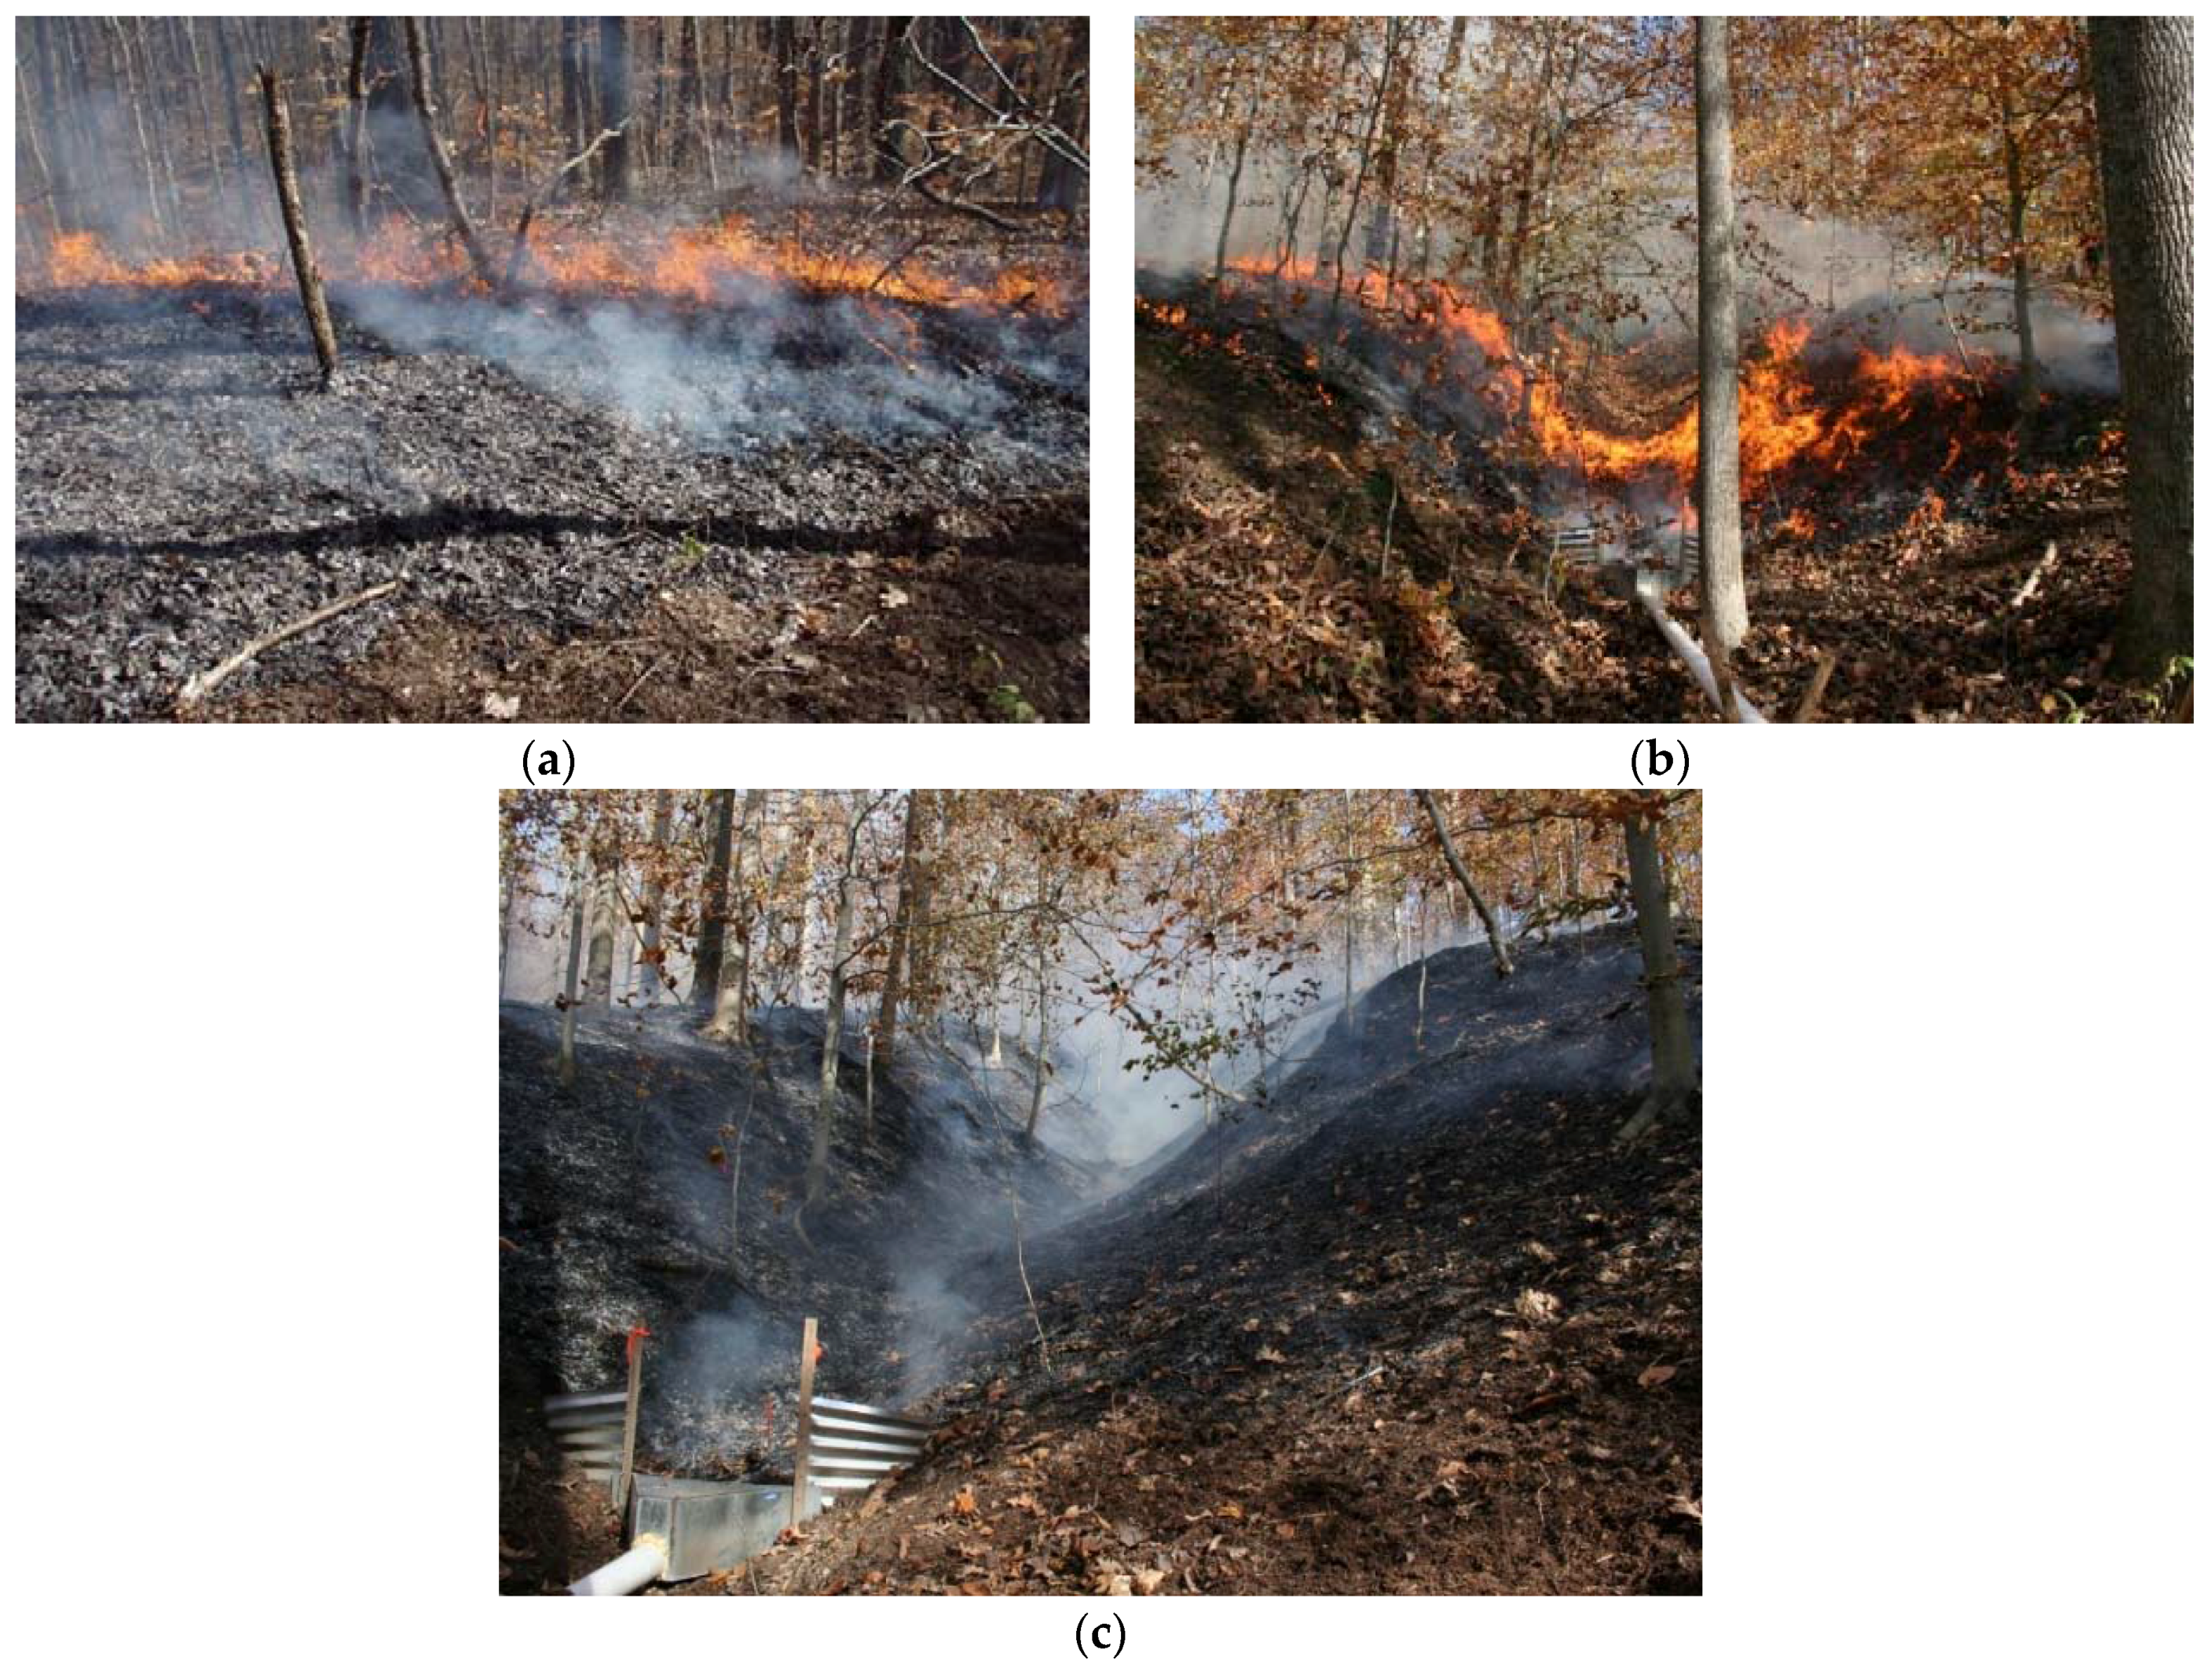
The prescribed burn was performed on 6 November 2009 beginning at approximately 1100 CST by the Southern Illinois University Wildland Fire Crew. The day before the fire, fire lines were installed using council rakes and backpack blowers and then resurveyed the morning of the fire to ensure clean lines. A 10-h fuel moisture stick that was located on-site was measured (weighed in grams) the morning of the burn to provide an accurate moisture content of 10-h dead fuels. Watersheds ranged in slope from 18% to 25%, so backing fires were used to improve the fire line (Figure 3). Once fire lines were deemed sufficient, the ignition sequence was completed using a ring-head fire. During the burn, wind speeds ranged from 3 to 10 km·h−1, the average relative humidity was 40%, and the air temperature was 23 °C (Table 2). Mop-up was performed immediately following the burn, where downed logs and standing dead trees could spread embers into unburned fuel across the line. The site was revisited the day after the burn to make certain that no fires reignited during the night. Specific details of weather conditions during the prescribed burn are provided in Table 2.
2.7. Post-Burn Data Collection
Post-fire data collected within each plot included: surface temperature of the fire, soil erosion or accumulation, total volume of overland flow, and total mass of suspended solids and sediment collected with subsequent precipitation events. To characterize burn severity and intensity, five hobo thermometers were buried in each watershed before the prescribed burn occurred and then data were downloaded following the prescribed burn treatment. The 18 preinstalled erosion pins in each watershed were measured one year after the burn to observe and quantify the extent of sediment erosion or accumulation at different locations within each watershed.
2.8. Water Sampling, Analysis, and Load Calculation
The total volume of water leaving the outlet of the watershed was collected during each storm event. Water collected in each tank was measured to estimate event loads. After each rain event, the tanks were stirred with a paddle to re-suspend organic material and sediment in order to create an even mixture. Each tank was mixed for one minute to reduce sampling bias. After the tank was completely mixed, a grab sample from the tank was collected and taken to the laboratory for analysis. After each rain event, tanks were drained and rinsed with clean water in preparation for the next rain event. Collected water samples were analyzed for both total suspended solids (TSS) and total suspended sediments. Total suspended solids were determined using the U.S. Environmental Protection Agency method 160.2 [37]. Water samples were agitated to re-suspend solids and then vacuum filtered through a Whatman glass microfiber filter to separate the total residue non-filterable suspended solids from the water. Filters were again oven-dried at 105 °C and then reweighed. Total suspended solids included both sediment and organic matter. To separate the sediment, samples were placed in a muffle furnace at 550 °C to combust the organic matter. Following combustion, the sample was again reweighed to determine the final mass of the sediment in the sample.
Total suspended solids and sediment loads were calculated in kg·ha−1:
TSS or sediment load = TSS or sediment concentration (mg/L) × volume collected per event (L) × 1/(Watershed area (ha)) × 1/106 (kg/mg)
2.9. Statistical Analysis
Data were collected from eight watersheds (i.e., four pairs), that consisted of a control watershed sharing a topographic divide with a treatment (prescribed burn) watershed. One watershed in each pair was randomly assigned as the control and the other as the prescribed burn treatment. Total suspended solids and sediments were treated as dependent variables in Proc Glimmix repeated measure model to test for differences among the watersheds. Dependent variables (i.e., TSS concentrations, TSS loads, sediment concentrations, and sediment loads) were not normally distributed, thus log-transformations were performed to address normality assumptions for parametric tests. The log-transformations resulted in normal distributions for all variables. For testing mean differences among the watersheds, Tukey-Kramer test was used. One-way ANOVA models were used to recognize differences between aspect, watershed litter depths, fire temperature, and soil moisture. SAS v9.4 was used for all statistical analyses, and an alpha level of 0.05 was used to determine statistical differences (SAS Institute, Cary, NC, USA).
3. Results and Discussion
3.1. Temperature, Precipitation, and Rainfall Intensity
Average monthly air temperature from 1990 to 2008 varied between 0.94 °C and 24.62 °C with average annual temperature of 12.89 °C. The average monthly air temperature during the study period from September 2009 to September 2010 varied between −2.10 °C and 26.31 °C (Figure 4). Average annual total precipitation received in the region from 1990 through 2008 was 1053 mm [38]. The research site received 1332 mm and 1004 mm of annual total precipitation in 2009 and 2010, respectively (Figure 4). The total precipitation for the study period from 21 September 2009 to 16 September 2010 was 1211 mm. The highest and lowest precipitation was received during October 2009 (256 mm) and August 2010 (33 mm), respectively (Figure 4). Out of total 85 rainfall events during the study period, 31 rainfall events were large enough to produce runoff in at least one watershed. A total of 213 runoff samples were collected over the study period. One extreme runoff event occurred on 30 October 2009 and was not included in final analysis because all the collection tanks overflowed prior to sampling. This event was followed by another rainfall event two days prior and produced 46 mm of precipitation, resulting in high antecedent moisture. Rainfall intensity for generating runoff from watersheds varied between 0.11 mm·h−1 and 3.86 mm·h−1 (Figure 4).
3.2. Prescribed Burn Temperature
The highest maximum air temperature (281.6 °C) was in the west facing aspect of watershed 7. The lowest maximum temperature (191.8 °C) was in the west facing aspect of watershed 10. The average maximum temperatures of the fire in each of the four treatment watersheds were not statistically different from one another (p = 0.11) (Table 3). Maximum temperatures were disregarded as an independent variable influencing TSS or sediment loss due to absence of any significant differences in maximum temperatures among watersheds.
3.3. Litter Depth
No significant differences were found for the pre-burn litter depths when compared between the watersheds (Table 4). Post-burn litter depths were significantly different between the control and prescribed burned watersheds. The unconsolidated litter and fine fuels were mostly consumed in all prescribed burn watersheds, leaving the humus exposed (Figure 5). Some variation was found in the percent of post-burn litter depth remaining in treatment watersheds. The litter remaining post-burn for watershed 4, 5, 7, and 10 were 12.6%, 13.0%, 31.5%, and 30.3%, respectively. Watershed 7 was very incised or V-shaped, and led to leaf litter accumulation in the channel (Figure 5). This leaf litter was compacted and comparatively moist, thus it was not fully consumed during the prescribed burn and remained in the field. Litter depths had no statistically significant impact on TSS concentrations (p = 0.82), TSS loads (p = 0.19), sediment concentrations (p = 0.65), or sediment loads (p = 0.21). Duff layer reduction after prescribed burn was between 68.5% and 87.5% and was comparable to duff layer reduction observed in other studies [39,40,41].
3.4. Volumetric Soil Water Content
Soil moisture was very consistent throughout the prescribed burn treatment and control watersheds (Table 4). Pre-burn soil moisture content was higher in watershed 4 (26.3%) compared to watershed 5 (19.8%), but similar across all other watersheds (p = 0.09). There were no statistical differences (p = 0.08) between watersheds based on post-burn soil moisture content. Similar results for soil moisture content in prescribed burned fires compared to unburned areas were reported by Barnes and Van Lear [42] in mixed hardwood forests of South Carolina. Volumetric water content did not significantly affect sediment loss (p = 0.22).
3.5. Total Suspended Solids and Total Sediments in Paired Watersheds
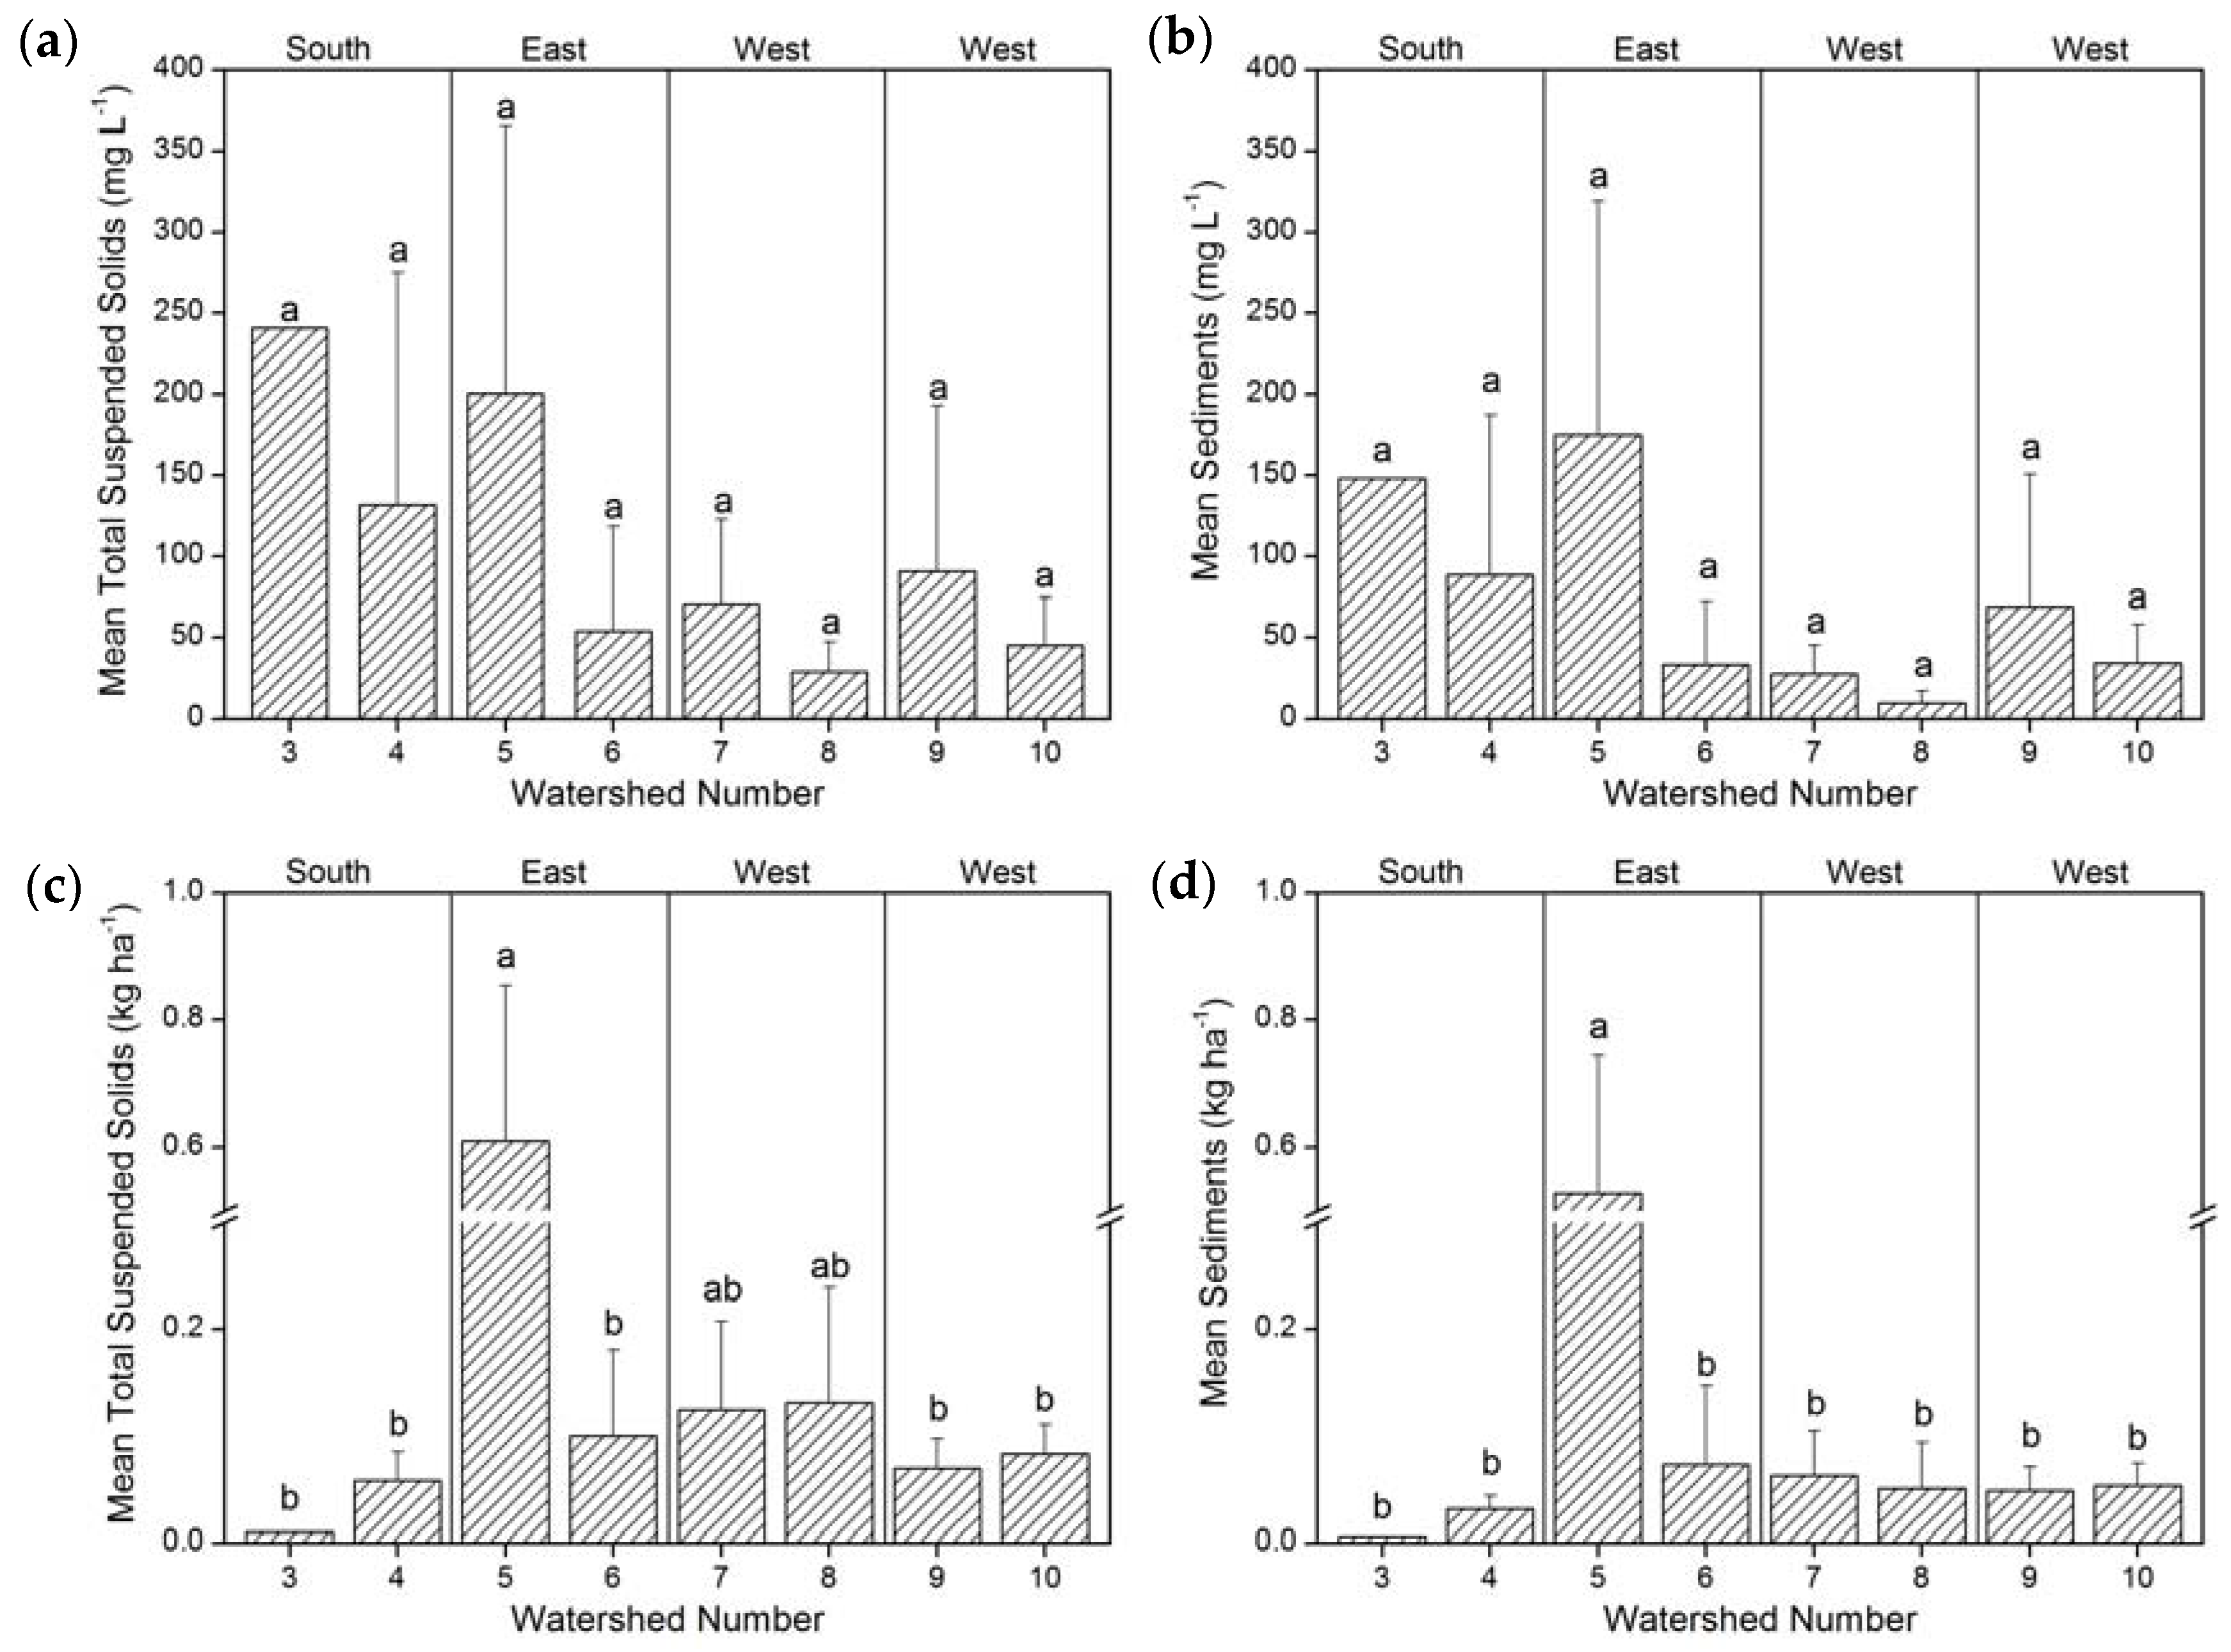
Pre-burn TSS and sediment concentrations were higher in watershed 3 and 5 compared to other watersheds. However, there were no significant differences among all watersheds (Figure 6a,b). Watershed 6 was slightly flattened out at the bottom before the placement of the flume, which could have resulted in lower runoff velocities and allowed TSS to settle before entering the flume [43,44]. Watershed 8 likely received the lowest concentration of pre-burn TSS and sediment concentrations because of the compacted layer of leaf litter that accumulated in the V-shaped drainage channel. The leaf litter would help filter out the smaller particles of detritus before it reached the flume or prevent the movement of the detritus layer [45,46]. Watershed 3 had no variability and the lowest TSS and sediment loads, as only one pre-burn sample was collected on 7 October 2009 and the tank volume was only 4.5 L of water following a 28 mm rainfall event. Pre-burn sediment loads for watershed 5 were significantly higher compared to other watersheds (Figure 6c,d).
Prescribed burn watershed 5 showed the highest variability (±95% confidence interval) among sampling events both for pre- and post-burn conditions. Post-burn TSS concentrations were significantly higher for prescribed burn watershed 5 compared to control watersheds 6 and 8 (Figure 7a). Post-burn sediment concentrations were also significantly higher for prescribed burn watershed 5 compared to control watersheds 6, 8, and 9 (Figure 7b). Post-burn TSS and sediment loads were significantly higher for watershed 5 compared to all other control watersheds (Figure 7c,d). Elevated pre-burn and post-burn concentrations or loads for watershed 5 indicated that the pre-burn litter layer was not the only influencing variable. Observations made during sample collections revealed that a seep existed directly above the flume of watershed 5. The seep was not noticed before the prescribed burn treatment occurred because of the leaf litter present there. The elevated levels of pre-burn TSS and sediment concentrations or loads showed that the seep was likely present throughout the entire study. This seep from the hillside likely increased loads by allowing subsurface sediment to resurface and enter the flume before having a chance to settle out within the watershed. This explains the elevated levels of TSS and sediments both pre- and post-burn for watershed 5.
Watershed 7 and 8 had the lowest post-burn TSS and sediment concentrations or loads and were not significantly different from each other. These low concentrations or loads in watershed 7 and 8 can be attributed to the leaf litter accumulation in the thalweg of the watershed, which could have acted as a filter. Additionally, watershed 7 had unconsumed leaf litter and fresh leaf drop that accumulated in the channel. Watershed 10 resulted in significantly higher TSS and sediment loads compared to control watershed 9, with no significant difference in TSS and sediment concentrations between watershed 9 and 10 (Figure 7). Watershed 9 had coarse woody debris that existed within the channel which acted as a dam (Figure 5). This resulted in catching TSS and sediments before they reached the flume, and could have been a contributing factor for low post-burn TSS and sediment loads [47].
3.6. Total Suspended Solids and Total Sediments Combined by Prescribed Burn and Control
In total, five runoff events were collected before prescribed burn treatment (Figure 8). Mean TSS and sediment concentrations showed temporal variability, whereas TSS and sediment loads did not show temporal variability during pre-burn conditions. A total of 19 post-burn samples were collected starting from November 2009 to September 2010. Prescribed burn increased TSS and sediment concentrations or loads. The highest concentrations ~400 mg·L−1 and loads ~8 kg·ha−1 were observed during spring 2010. Precipitation received during March 2010 was 140 mm, which was the highest during the post-burn period (Figure 4). Antecedent soil moisture conditions and higher overland flow could have resulted in this peak TSS and sediment concentration or load. No runoff was generated during summer months from June to August 2010. Average monthly precipitation received during these months was less than the 18-year average (Figure 4). August 2010 was the driest month, and precipitation received was 33 mm, which was 50% less than the 18-year average (Figure 4). The last runoff event was collected in September 2010, and TSS and sediment loads for control and prescribed burn treatment were less than 0.5 kg·ha−1 and leveled off to loads observed during pre-burn conditions (Figure 8).
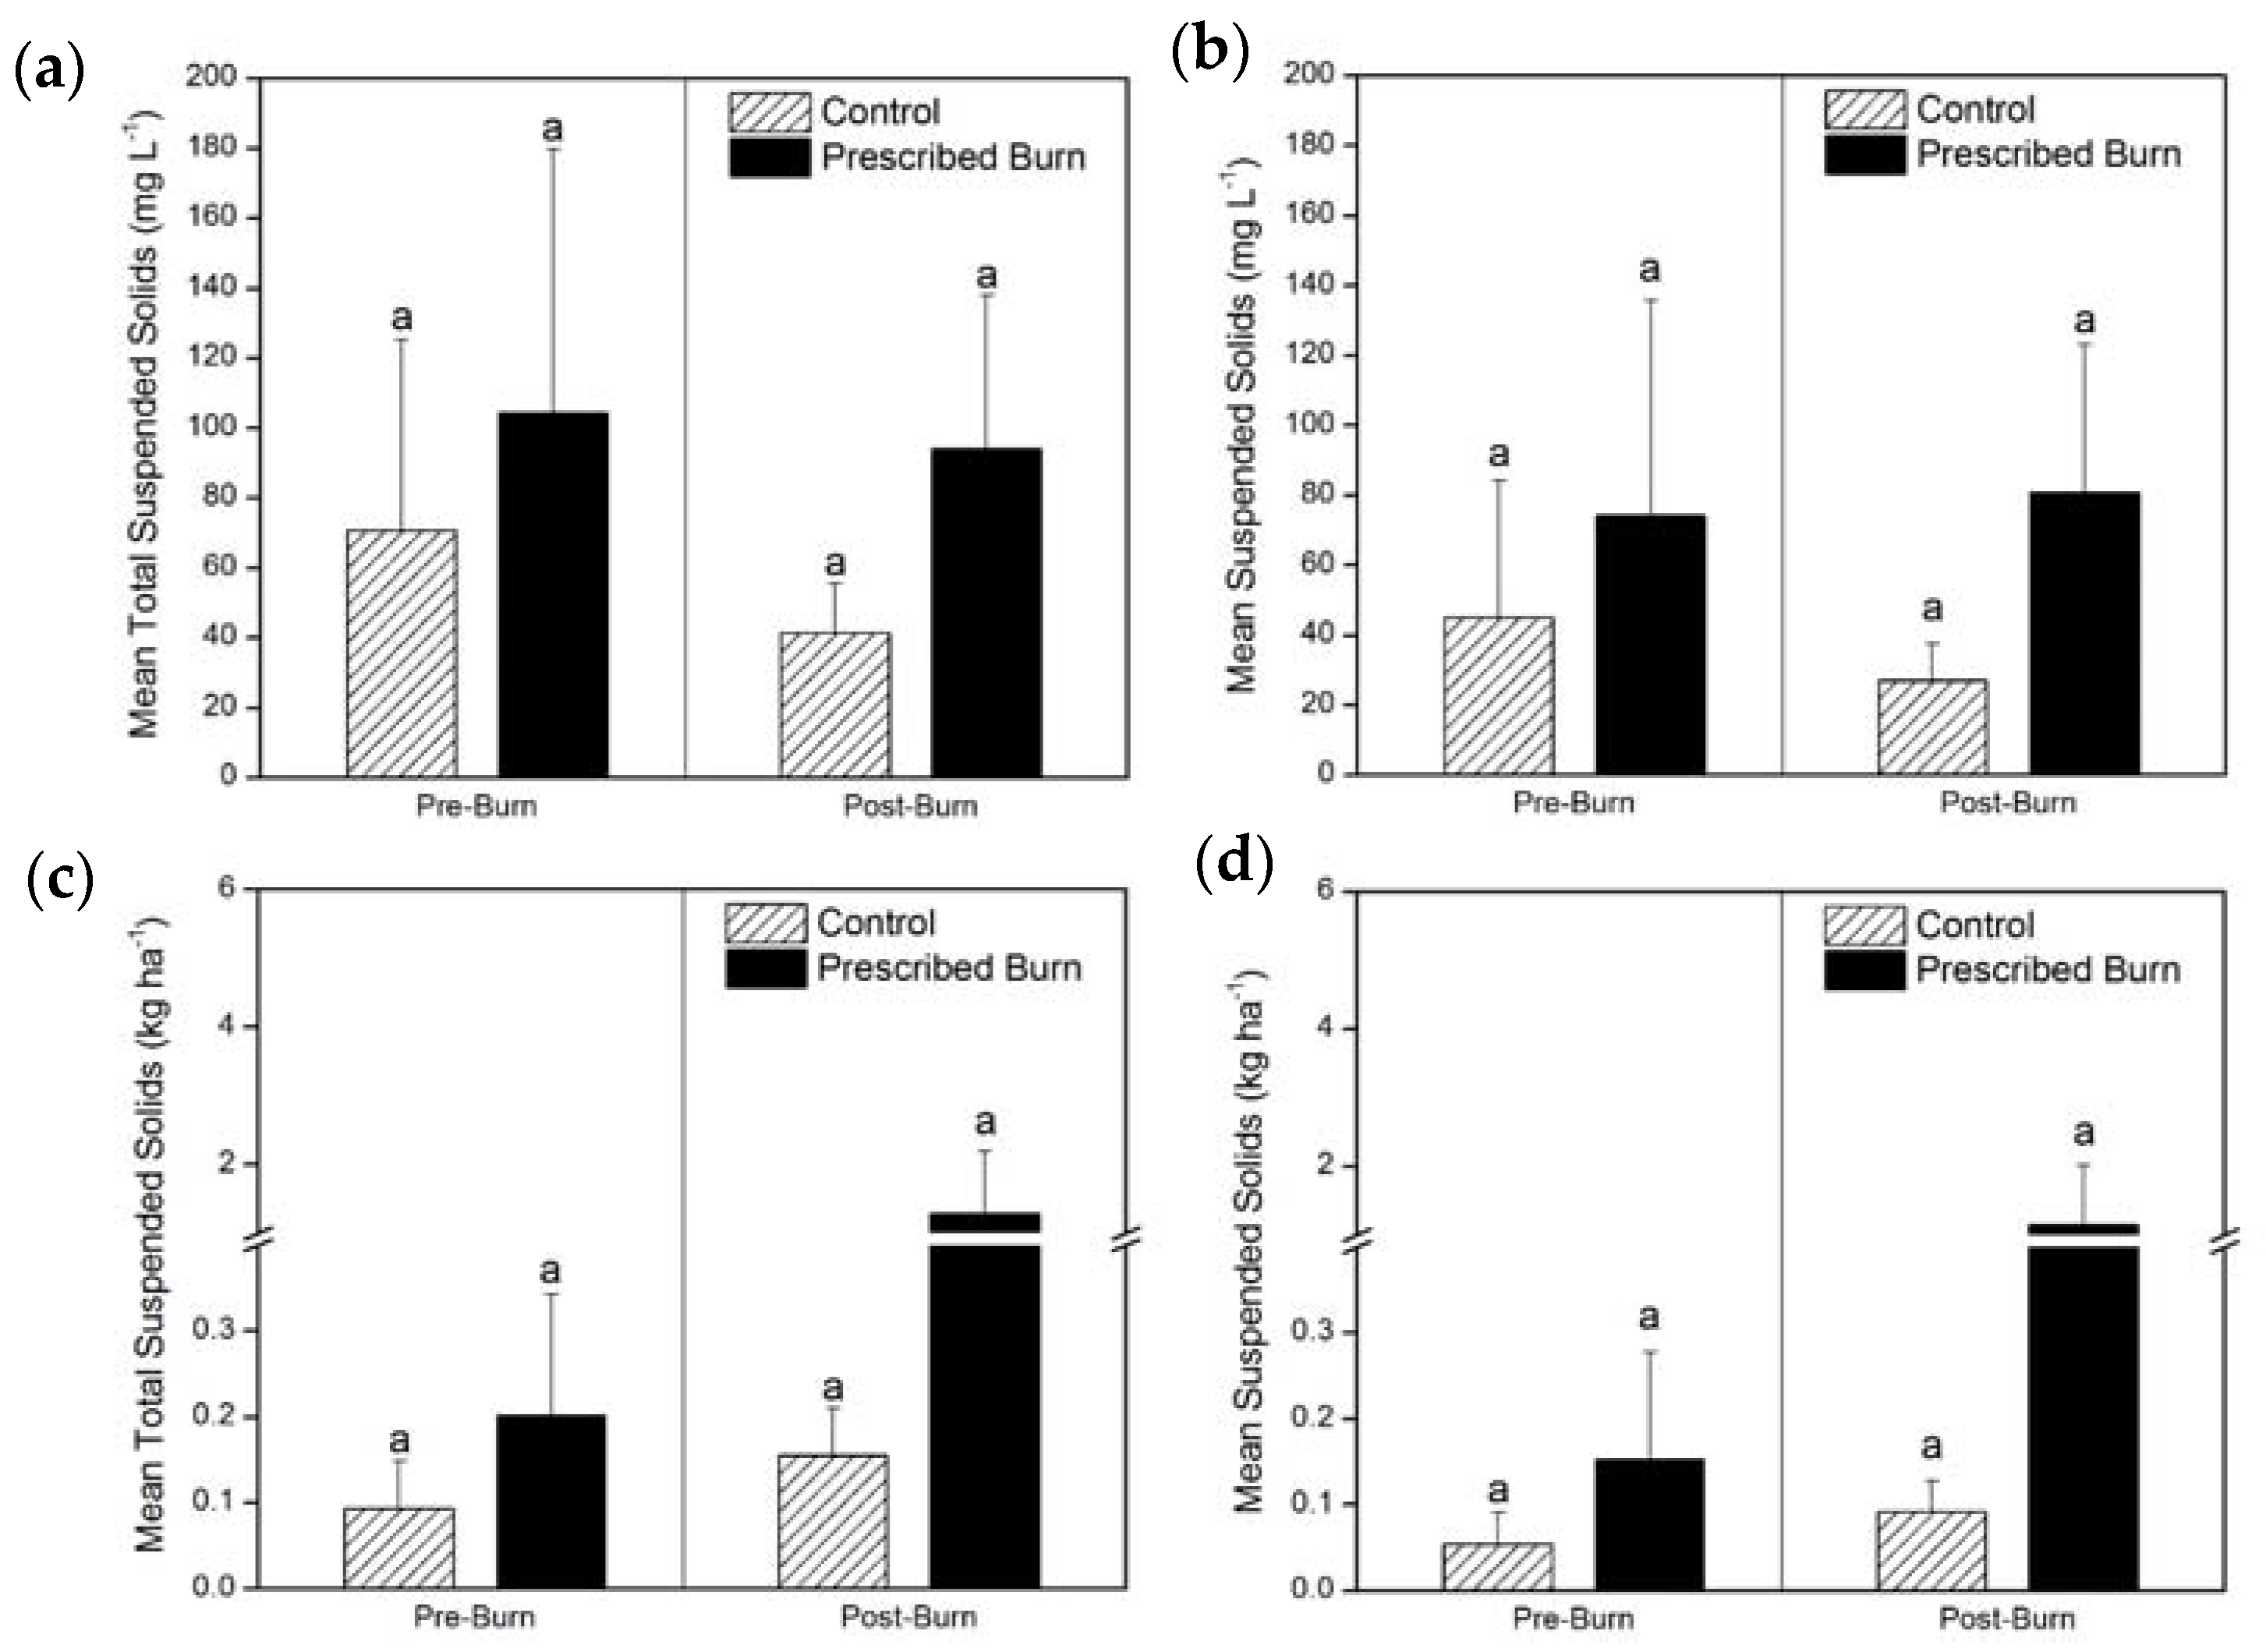
The pre-burn TSS and sediment loads are much lower than post-burn TSS and sediment loads in all watersheds when data were combined by prescribed burned and control treatments (Figure 9). This indicates that an increase in TSS and sediment loss post-burn was not only attributed to the prescribed burn. There may have been other factors that caused an increase in TSS and sediment loss. One major change from pre- to post-burn sampling was that a portion of the post-sampling period occurred during the dormant season. Canopy cover was not monitored during the study, but research has shown that canopy cover slows throughfall and can reduce rainfall intensity. Transpiration and uptake of water by vegetation during the growing season would have also slowed saturation and decreased the volume of overland flow [9,48]. Only five storm events over a two-month period make up the pre-burn sampling period, whereas the post-burn sampling period contains 19 sampled storm events over a ten-month period (Figure 8). The ten-month post-burn sampling period consisted of March, April, and May. These three months on average received most of the rainfall during this study (Figure 4). Not incorporating March through May in the pre-burn sampling period likely contributed to lower TSS and sediment loads. A full year of sampling before the prescribed burn could have verified if the seasonal changes were a leading factor in the TSS and sediment increase.
Combining data over watersheds by treatments showed no significant difference for pre-and post-burn. Total suspended solid and sediment concentrations in control and prescribed burn watersheds were similar (p > 0.05) prior to the implementation of the prescribed burn, and were not statistically different post-burn (p > 0.05) (Figure 9a,b). This was also consistent in TSS and sediment loads with similar outputs for pre- and post-burn conditions (Figure 9c,d). Post-burn TSS and sediment loads indicate that on average, the prescribed burn treatment increases TSS and sediment concentrations or loads, and resulted in higher variability for prescribed burn treatments, but with no significant difference from control treatments. The overall effect of burning on soil loss was minimal, and reduction in higher variability after burning will depend on how quickly surface cover is re-established [27,49,50].
A hypothetical distribution of selected landscape-ecosystem types with respect to geomorphic sensitivity, fire index (frequency and intensity), and portion of total sediment yield that is fire induced, was given by Swanson [51]. Swanson indicated that the fire induced portion of total sediment yield can be about 5% when mixed hardwood forests are subjected to fires of low intensity. Most of the research on prescribed fires and their impact on sediment loss have been carried out in pine dominated forests, and not enough studies are available in mixed hardwood forests. Plot scale erosion studies of mixed hardwoods forests in Georgia reported that sediment loads per 30-min simulated rainfall ranged from 6 kg·ha−1 to 379 kg·ha−1 [52]. It was concluded that sediment production was low because residual root cover was not completely burned and high infiltration rates were measured in erosion plots.
3.7. Annual Sediment Loss
Prescribed burn watershed 5 had a projected annual sediment loss of 90.54 kg·ha−1·year−1, which is more than 13 times greater than the next closest projected annual loss that occurred in prescribed burn watershed 10 at 6.76 kg·ha−1·year−1 (Table 5). These projected erosion rates seem nominal when compared with those of agriculture and other land uses [53,54,55,56]. Annual soil losses measured in row crops, sod crops, and forests reported in other studies are provided in Table 6 and far exceed our soil loss averages.
Erosion pins were measured at the conclusion of the field study to evaluate the annual soil movement by watershed (Table 5). Erosion pin data in prescribed burn watershed 7 showed an average soil loss of 4.2 mm. Conversely, watershed 8 had the highest accumulation of sediment (9.9 mm). These two watersheds were the only ones that showed a significant difference between one another, while all others were similar. Watersheds 7 and 8 are paired-watersheds that represent the steepest slopes. The soil loss in watershed 7 could be attributed to the steep slopes accompanied by the loss of litter during the prescribed burn. The highest amount of soil accumulation in watershed 8 is also likely due to the percent slope. Instead of the sediment being lost as in watershed 7, it is plausible that the litter allowed the sediment to move, but remained within the watershed. This movement of sediment within the watershed led to higher rates of accumulation than what was documented in the other watersheds. Watershed 9 had the lowest average change and lowest average range of sediment movement within the watersheds. One observation that could have influenced these low rates of sediment movement was the debris of large dead trees that had fallen into the drainage. This coarse woody debris might have acted as sediment traps, which could have reduced the sediment movement throughout the watershed [47].
It is evident from our study that prescribed burning does not cause a significant increase in soil loss, and levels of erosion should be considered acceptable in mixed hardwood forests of southern Illinois. Additionally, reduction in erosion rates after prescribed burning will depend on how rapidly surface cover is re-established, as well as the precipitation received and intercepted by residual tree crowns. In a study conducted by Ursic [50] in scrub oak forest in Mississippi, enough regrowth of understory resulted in normalizing runoff and sediment production over a 3-year post-burn period. Ursic [50] reported that the maximum sediment yield was 6500 kg·ha−1 on two burned catchments during the first year after burning, 580 kg·ha−1 after two years, and 50 kg·ha−1 in the final year of study.
3.8. Decision Tool for Land Managers in Southern Illinois
Land managers should use prescribed fire when possible for fuel reduction and site preparation where necessary. An important consideration is to maintain high moisture content in the humus layer during burning operations. Land managers set specific prescription levels when designing a prescribed burn plan. These prescription levels are designed to reduce the chance of an escaped fire and yield the desired management outcome following the burn. Fire intensity and severity are terms that scale a fire as low, medium, or high given by Byram [64]. Prescription levels for prescribed burning are designed to keep the fire intensity and severity at a low to medium range [65,66]. This low to medium range can be determined by post-burn observations which include flame length, fuel consumption, fire-scar height, etc. The prescribed burn for the study at TTSF was within the typical prescription range that is desired by land managers when burning in mixed hardwood forests of the central and eastern United States [8,20,66,67]. The timing of the burn (6 November 2009) is within the standard fall and winter prescribed burn period [8]. The maximum temperatures of the prescribed burn were comparable to the recorded temperatures of prescribed burns studied under other mixed hardwood forests [20,66,67]. Results from this research showed that the levels of TSS and sediment loss were not significantly different between control and prescribed burn watersheds. If all criteria of prescribed burning are met, the land owners of southern Illinois can use prescribed fires to manage their mixed hardwood forests without serious worry for soil loss.
4. Conclusions
The research findings provide valuable information regarding prescribed burning on steep topography in the forested Ozark hills of southern Illinois. Prescribed fires reduced the litter depth with no differences in soil moisture content due to prescribed burning. Only one watershed (watershed 5) showed some significant changes due to prescribed burning compared to other watersheds due to the presence of a seep. However, the TSS and sediment concentrations and loads were not increased significantly due to prescribed burning of mixed hardwood forests. Sediment transport in all watersheds and erosion potential after a prescribed fire can also be categorized as low, and land managers may use these data to burn more frequently or burn larger tracts. Slope and aspect were not influencing factors in regulating runoff after burning. If prescribed burning temperature does not exceed the recommended temperature observed in our study, then the humic horizon of the lower duff is not consumed, which protects soil from rain drops and throughfall. Prescribed fires can be recommended in southern Illinois for maintaining hardwood forests without increasing erosion risk under typical topography and precipitation years.
Acknowledgments
This research was supported by funds from the USDA National Institute of Food and Agriculture McIntire-Stennis Cooperative Forestry Research Program.
Author Contributions
G.S. was involved in statistical analysis, writing, and editing the manuscript. J.E.S., K.W.J.W. and C.M.R. were involved in setting up experiment layout and editing the manuscript. K.S.M. collected data and carried out analyses for runoff samples.
Conflicts of Interest
The authors declare no conflicts of interest.
References
- Clements, F.E. Plant Succession: An Analysis of the Development of Vegetation; Carnegie Institution of Washington: Washington, DC, USA, 1916. [Google Scholar]
- Ruffner, C.M.; Groninger, J.W. Making the case for fire in southern illinois forests. J. For. 2006, 104, 78–83. [Google Scholar]
- Abrams, M.D. Fire and the development of oak forests. J. Biosci. 1992, 42, 346–353. [Google Scholar] [CrossRef]
- Ozier, T.B.; Groninger, J.W.; Ruffner, C.M. Community composition and structural changes in a managed illinois ozark hills forest. Am. Midl. Nat. 2006, 155, 253–269. [Google Scholar] [CrossRef]
- Norris, L.A. An overview and synthesis of knowledge concerning natural and prescribed fire in pacific northwest forests. In Natural and Prescribed Fire in Pacific Northwest Forests; Walstad, J.D., Radosevich, S.R., Sandberg, D.V., Eds.; Oregon State University Press: Corvallis, OR, USA, 1990; pp. 7–22. [Google Scholar]
- Blattel, C. Fire and forest hydrology. In Prescribed Fire and Oak Ecosystem Maintenance: A Primer for Land Managers; Department of Forestry Research Publication, Southern Illinois University: Carbondale, CO, USA, 2005; pp. 80–87. [Google Scholar]
- Boerner, R.E.; Decker, K.L.; Sutherland, E.K. Prescribed burning effects on soil enzyme activity in a southern Ohio hardwood forest: A landscape-scale analysis. Soil Biol. Biochem. 2000, 32, 899–908. [Google Scholar] [CrossRef]
- Erickson, H.E.; White, R. Soils under Fire: Soils Research and the Joint Fire Science Program; USDA Forest Service, Pacific Northwest Research Station: Portland, OR, USA, 2008. [Google Scholar]
- Spigel, K.M.; Robichaud, P.R. First-year post-fire erosion rates in bitterroot national forest, Montana. Hydrol. Process 2007, 21, 998–1005. [Google Scholar] [CrossRef]
- Scharenbroch, B.; Nix, B.; Jacobs, K.; Bowles, M. Two decades of low-severity prescribed fire increases soil nutrient availability in a midwestern, USA oak (Quercus) forest. Geoderma 2012, 183, 80–91. [Google Scholar] [CrossRef]
- Dey, D.C.; Fan, Z. A Review of Fire and Oak Regeneration and Overstory Recruitment. Available online: https://www.nrs.fs.fed.us/pubs/gtr/gtr-p-46papers/01-dey-p-46.pdf (accessed on 2 July 2017).
- Auchmoody, L.; Smith, H.C. Survival of Northern Red Oak Acorns after Fall Burning; USDA Forest Service, Northeastern Forest Experiment Station: Broomall, PA, USA, 1993; p. 5. [Google Scholar]
- Brose, P.H.; Dey, D.C.; Phillips, R.J.; Waldrop, T.A. A meta-analysis of the fire-oak hypothesis: Does prescribed burning promote oak reproduction in eastern North America? For. Sci. 2013, 59, 322–334. [Google Scholar] [CrossRef]
- Robichaud, P.R. Fire effects on infiltration rates after prescribed fire in northern Rocky Mountain forests, USA. J. Hydrol. 2000, 231, 220–229. [Google Scholar] [CrossRef]
- Coelho, C.D.O.A.; Ferreira, A.J.D.; Boulet, A.-K.; Keizer, J.J. Overland flow generation processes, erosion yields and solute loss following different intensity fires. Q. J. Eng. Geol. Hydrogeol. 2004, 37, 233–240. [Google Scholar] [CrossRef]
- Rich, L.R. Erosion and Sediment Movement Following a Wildfire in a Ponderosa Pine Forest of Central Arizona; USDA Forest Service, Rocky Mountain Forest and Range Experiment Station: Fort Collins, CA, USA, 1962. [Google Scholar]
- Boerner, R.E.J. Effects of fire on the ecology of the forest floor and soil of central hardwood forests. In Proceedings of the Conference on Fire, People, and the Central Hardwood Landscape, Richmond, KY, USA, 12–14 March 2000; Yaussy, D.A., Ed.; USDA Forest Service, Northeastern Research Station: Delaware County, PA, USA, 2000; pp. 56–63. [Google Scholar]
- Robichaud, P.R.; Pierson, F.B.; Brown, R.E.; Wagenbrenner, J.W. Measuring effectiveness of three postfire hillslope erosion barrier treatments, western Montana, USA. Hydrol. Process 2008, 22, 159–170. [Google Scholar] [CrossRef]
- Neary, D.G.; Klopatek, C.C.; DeBano, L.F.; Ffolliott, P.F. Fire effects on belowground sustainability: A review and synthesis. For. Ecol. Manag. 1999, 122, 51–71. [Google Scholar] [CrossRef]
- Knoepp, J.D.; Elliott, K.J.; Clinton, B.D.; Vose, J.M. Effects of prescribed fire in mixed oak forests of the southern appalachians: Forest floor, soil, and soil solution nitrogen responses. J. Torrey Bot. Soc. 2009, 136, 380–391. [Google Scholar] [CrossRef]
- DeBano, L.F. The effect of fire on soil properties. In Proceedings of the Management and Productivity of Western-Montane Forest Soils, Boise, ID, USA, 10–12 April 1990; Harvey, A.E., Neuenschwander, L.G., Eds.; USDA Forest Service: Washington, DC, USA, 1991; pp. 151–155. [Google Scholar]
- DeBano, L.F.; Neary, D.G.; Ffolliott, P.F. Fire effects on Ecosystems; John Wiley & Sons: New York, NY, USA, 1998. [Google Scholar]
- Robichaud, P.; Waldrop, T.A. A comparison of surface runoff and sediment yields from low-and high-severity site preparation burns1. J. Am. Water Resour. Assoc. 1994, 30, 27–34. [Google Scholar] [CrossRef]
- Danielovich, S.J. High Intensity Site Preparation Burning after Clearcutting in Southern Hardwoods—Effects on Residual Vegetation and Soil Erosion; Clemson University: Clemson, SC, USA, 1986. [Google Scholar]
- Douglass, J.E.; van Lear, D.H. Prescribed burning and water quality of ephemeral streams in the piedmont of south Carolina. For. Sci. 1983, 29, 181–189. [Google Scholar]
- Durgin, P.B. Burning changes the erodibility of forest soils. J. Soil Water Conserv. 1985, 40, 299–301. [Google Scholar]
- Ralston, C.W.; Hatchell, G.E. Effects of prescribed burning on physical properties of soil. In Prescribed Burning Symposium Proceedings; USDA Forest Service, Southeast Forest Experment Station: Charleston, SC, USA, 1971; pp. 14–16. [Google Scholar]
- Boerner, R.E.J. Soil, fire, water, and wind: How the elements conspire in the forest context. In Fire in Eastern Oak Forests: Delivering Science to Land Managers; Dickinson, M.B., Ed.; USDA Forest Service, Northern Research Station: Columbus, OH, USA, 2006; pp. 104–112. [Google Scholar]
- Moffet, C.A.; Pierson, F.B.; Robichaud, P.R.; Spaeth, K.E.; Hardegree, S.P. Modeling soil erosion on steep sagebrush rangeland before and after prescribed fire. Catena 2007, 71, 218–228. [Google Scholar] [CrossRef]
- Soto, B.; Díaz-Fierros, F. Runoff and soil erosion from areas of burnt scrub: Comparison of experimental results with those predicted by the wepp model. Catena 1998, 31, 257–270. [Google Scholar] [CrossRef]
- Robertson, P.A.; Heikens, A.L. Fire frequency in oak-hickory forests of southern Illinois. Castanea 1994, 59, 286–291. [Google Scholar]
- Ruffner, C.M.; Groninger, J.W. Oak Ecosystem Restoration and Maintenance in Southern Illinois; Gen. Tech. Rep. SRS-73; US Department of Agriculture, Forest Service, Southern Research Station: Asheville, NC, USA, 2004; pp. 177–181.
- Fenneman, N.M. Physiography of Eastern United States; McGraw-Hill: New York, NY, USA; London, UK, 1938; Volume 122, p. 714. [Google Scholar]
- Survey, W.S. Soil Survey Staff, Natural Resources Conservation Service, United States Department of Agriculture. Available online: http://websoilsurvey.nrcs.usda.gov/ (accessed on 12 December 2016).
- Fralish, J.S.; Franklin, S.B. Taxonomy and Ecology of Woody Plants in North American Forests: (Excluding Mexico and Subtropical Florida); John Wiley & Sons: New York, NY, USA, 2002. [Google Scholar]
- Fralish, J.S. The effect of site environment on forest productivity in the Illinois Shawnee Hills. Ecol. Appl. 1994, 4, 134–143. [Google Scholar] [CrossRef]
- Keith, L.H. Environmental Sampling and Analysis: A Practical Guide; CRC Press Inc.: Boca Raton, FL, USA, 1991. [Google Scholar]
- Network, I.C. Water and Atmospheric Resources Monitoring Program; Illinois State Water Survey: Champaign, IL, USA, 2016. [Google Scholar]
- Norum, R.A. Fire intensity fuel reduction relationships associated with understory burning in larch/douglas fir stands. In Proceedings of the Tall Timbers Fire Ecology Conference Number 14 and Intermountain Fire Research Council Fire & Land Management Symposium, Missoula, MT, USA, 8–10 October 1974; Komarek, E.V., Ed.; Tall Timbers Research Station: Missoula, MT, USA, 1976; pp. 359–372. [Google Scholar]
- Shearer, R.C. Seedbed Characteristics in Western Larch Forests after Prescribed Burning; USDA Forest Service, Intermountain Forest and Range Experiment Station: Ogden, UT, USA, 1975; p. 126. [Google Scholar]
- Waldrop, T.A.; Glass, D.W.; Rideout, S.; Shelburne, V.B. An Evaluation of Fuel-Reduction Treatments Across a Landscape Gradient in Piedmont Forests: Preliminary Results of the National Fire and Fire Surrogate Study; USDA Forest Service, Southwest Research Station: Asheville, NC, USA, 2004; pp. 54–59. [Google Scholar]
- Barnes, T.; van Lear, D. Prescribed fire effects on advanced regeneration in mixed hardwood stands. South. J. Appl. For. 1998, 22, 138–142. [Google Scholar]
- Liu, B.; Nearing, M.; Shi, P.; Jia, Z. Slope length effects on soil loss for steep slopes. Soil Sci. Soc. Am. J. 2000, 64, 1759–1763. [Google Scholar] [CrossRef]
- Wu, W.; Sidle, R.C. A distributed slope stability model for steep forested basins. Water Resour. Res. 1995, 31, 2097–2110. [Google Scholar] [CrossRef]
- Bormann, F.H.; Likens, G. Pattern and Process in a Forested Ecosystem: Disturbance, Development and the Steady State Based on the Hubbard Brook Ecosystem Study; Springer Science & Business Media: New York, NY, USA, 2012. [Google Scholar]
- Sayer, E.J. Using experimental manipulation to assess the roles of leaf litter in the functioning of forest ecosystems. Biol. Rev. 2006, 81, 1–31. [Google Scholar] [CrossRef] [PubMed]
- Bilby, R.E.; Likens, G.E. Importance of organic debris dams in the structure and function of stream ecosystems. Ecology 1980, 61, 1107–1113. [Google Scholar] [CrossRef]
- Swank, W.T.; Vose, J.; Elliott, K. Long-term hydrologic and water quality responses following commercial clearcutting of mixed hardwoods on a southern Appalachian catchment. For. Ecol. Manag. 2001, 143, 163–178. [Google Scholar] [CrossRef]
- Ursic, S.J. Hydrologic Effects of Prescribed Burning on Abandoned Fields in Northern Mississippi; USDA Forest Service, Southern Forest Experiment Station: New Orleans, LA, USA, 1969. [Google Scholar]
- Ursic, S.J. Hydrologic Effects of Prescribed Burning and Deadening Upland Hardwoods in Northern Mississippi; USDA Forest Service, Southern Forest Experiment Station: New Orleans, LA, USA, 1970; Volume 54, p. 15. [Google Scholar]
- Swanson, F.J. Fire and geomorphic processes. In Proceedings of the Fire Regimes and Ecosystem Properties, Honolulu, HI, USA, 11–15 December 1978; Mooney, H.A.B.T.H., Christensen, N.L., Lotan, J.E., Reiners, W.A., Eds.; USDA Forest Service: Ogden, UT, USA, 1981; pp. 401–444. [Google Scholar]
- Shahlaee, A.; Nutter, W.L.; Burroughs, E.; Morris, L. Runoff and sediment production from burned forest sites in the georgia piedmont. Water Resour. Bull. 1991, 27, 485–493. [Google Scholar] [CrossRef]
- Ursic, S.; Dendy, F.E. Sediment yields from small watersheds under various land uses and forest covers. USDA For. Serv. 1965, 970, 47–52. [Google Scholar]
- Kort, J.; Collins, M.; Ditsch, D. A review of soil erosion potential associated with biomass crops. Biomass Bioenergy 1998, 14, 351–359. [Google Scholar] [CrossRef]
- Montgomery, D.R. Soil erosion and agricultural sustainability. Proc. Natl. Acad. Sci. USA 2007, 104, 13268–13272. [Google Scholar] [CrossRef] [PubMed]
- Schilling, K.E.; Jha, M.K.; Zhang, Y.K.; Gassman, P.W.; Wolter, C.F. Impact of land use and land cover change on the water balance of a large agricultural watershed: Historical effects and future directions. Water Resour. Res. 2008, 44. [Google Scholar] [CrossRef]
- Meginnis, H.G. Effect of cover on surface run-off and erosion in the loessial uplands of mississippi. USDA Circ. 1935, 347, 15. [Google Scholar]
- Daniel, H.A.; Elwell, H.M.; Cox, M.B. Investigations in Erosion Control and Reclamation of Eroded Land at the Red Plains Conservation Station, Guthrie, Oklahoma; The United States Department of Agriculture: Washington, DC, USA, 1943; Volume 837, pp. 1–29.
- Copley, T.L.; Forrest, L.A. Investigations in Erosion Control and Reclamation of Eroded Land at the Central Piedmont Conservation Experiment Station Statesville, Nc 1930–1940; USDA Tech. Bull.: Washington, DC, USA, 1944. [Google Scholar]
- Pope, J.; Archer, J.; Johnson, P. Investigations in Erosion Control and Reclamation of Eroded Sandy Clay Lands of Texas, Arkansas, and Louisiana at the Conservation Experiment Station, Tyler, Tex 1931–40; USDA Tech. Bull.: Washington, DC, USA, 1946; p. 76. [Google Scholar]
- Ferguson, E. Prescribed Burning in Shortleaf-Loblolly Pine on Rolling Uplands in East Texas; Fire Contribution Notes 18; USDA Forest Service: Washington, DC, USA, 1957; pp. 130–132. [Google Scholar]
- Schuman, G.; Spomer, R.; Piest, R. Phosphorus losses from four agricultural watersheds on Missouri Valley loess. Soil Sci. Soc. Am. J. 1973, 37, 424–427. [Google Scholar] [CrossRef]
- Sharpley, A. Identifying sites vulnerable to phosphorus loss in agricultural runoff. J. Environ. Qual. 1995, 24, 947–951. [Google Scholar] [CrossRef]
- Byram, G.M. Combustion of forest fuels. In Forest Fire: Control and Use; Davis, K.P., Ed.; McGraw-Hill: New York, NY, USA, 1959; Volume 1, pp. 61–89. [Google Scholar]
- Brose, P.H.; van Lear, D.H. Responses of hardwood advance regeneration to seasonal prescribed fires in oak-dominated shelterwood stands. Can. J. For. Res. 1998, 28, 331–339. [Google Scholar] [CrossRef]
- Brose, P.H.; Schuler, T.M.; Ward, J.S. Responses of oak and other hardwood regeneration to prescribed fire: What we know as of 2005. In Fire in Eastern Oak Forests: Delivering Science to Land Mangers; Dickinson, M.B., Ed.; USDA Forest Service Gen. Tech. Rep. NRS-P-1; USDA Forest Service: Columbus, OH, USA, 2006; pp. 123–135. [Google Scholar]
- Loucks, E.; Arthur, M.A.; Lyons, J.E.; Loftis, D.L. Characterization of fuel before and after a single prescribed fire in an Appalachian hardwood forest. South. J. Appl. For. 2008, 32, 80–88. [Google Scholar]
Figure 1.
(A) Forest regions of the United States: (1) Northern Conifer-Hardwood forest, Aspen Parkland; (2a) Northern Hardwood-Conifer Forest (Sugar Maple-Yellow Birch-American Beech-White Pine Forest), Great Lakes Section; (2b) Northern Hardwood-Conifer Forest, New England Section; (3a) Central Hardwood Forest (Oak-Hickory and mesophytic elements), Plateau section; (3b) Central Hardwood Forest, Appalachian Mountain section; (4a) Southeastern Pine-Hardwood Forest, Upper Coastal Plain; (4b) Southeastern Pine-Hardwood Forest, Lower Coastal Plain; (4c) Southeastern Pine-Hardwood Forest, Piedmont Plateau; (5a) Southwestern Juniper-Pinyon Savanna; (5b) Central and Southern Rocky Mountain Mixed Conifer Forest; (6) Northern Rocky Mountain Conifer Forest; (7a) Northern Coastal Conifer Forest; (7b) Sierra Nevada Mountain, Southern Coastal Conifer Forest. Other zones include grassland (G), desert (D), and the Mississippi River Valley (MRV). Adapted from Fralish and Franklin [35]. (B) Physiographic regions of southern Illinois: (1) Illinois Ozark Hills; (2) Greater Shawnee Hills; (3) Lesser Shawnee Hills; (4) Cretaceous Hills; (5) Mississippi River Alluvial Plain; (6) Lower Ohio-Wabash Rivers Alluvial Plain; (7) Ohio-Cache Rivers Alluvial Plain. (C) Research site location at Trail of Tears State Forest in the Ozark hills of southern Illinois.

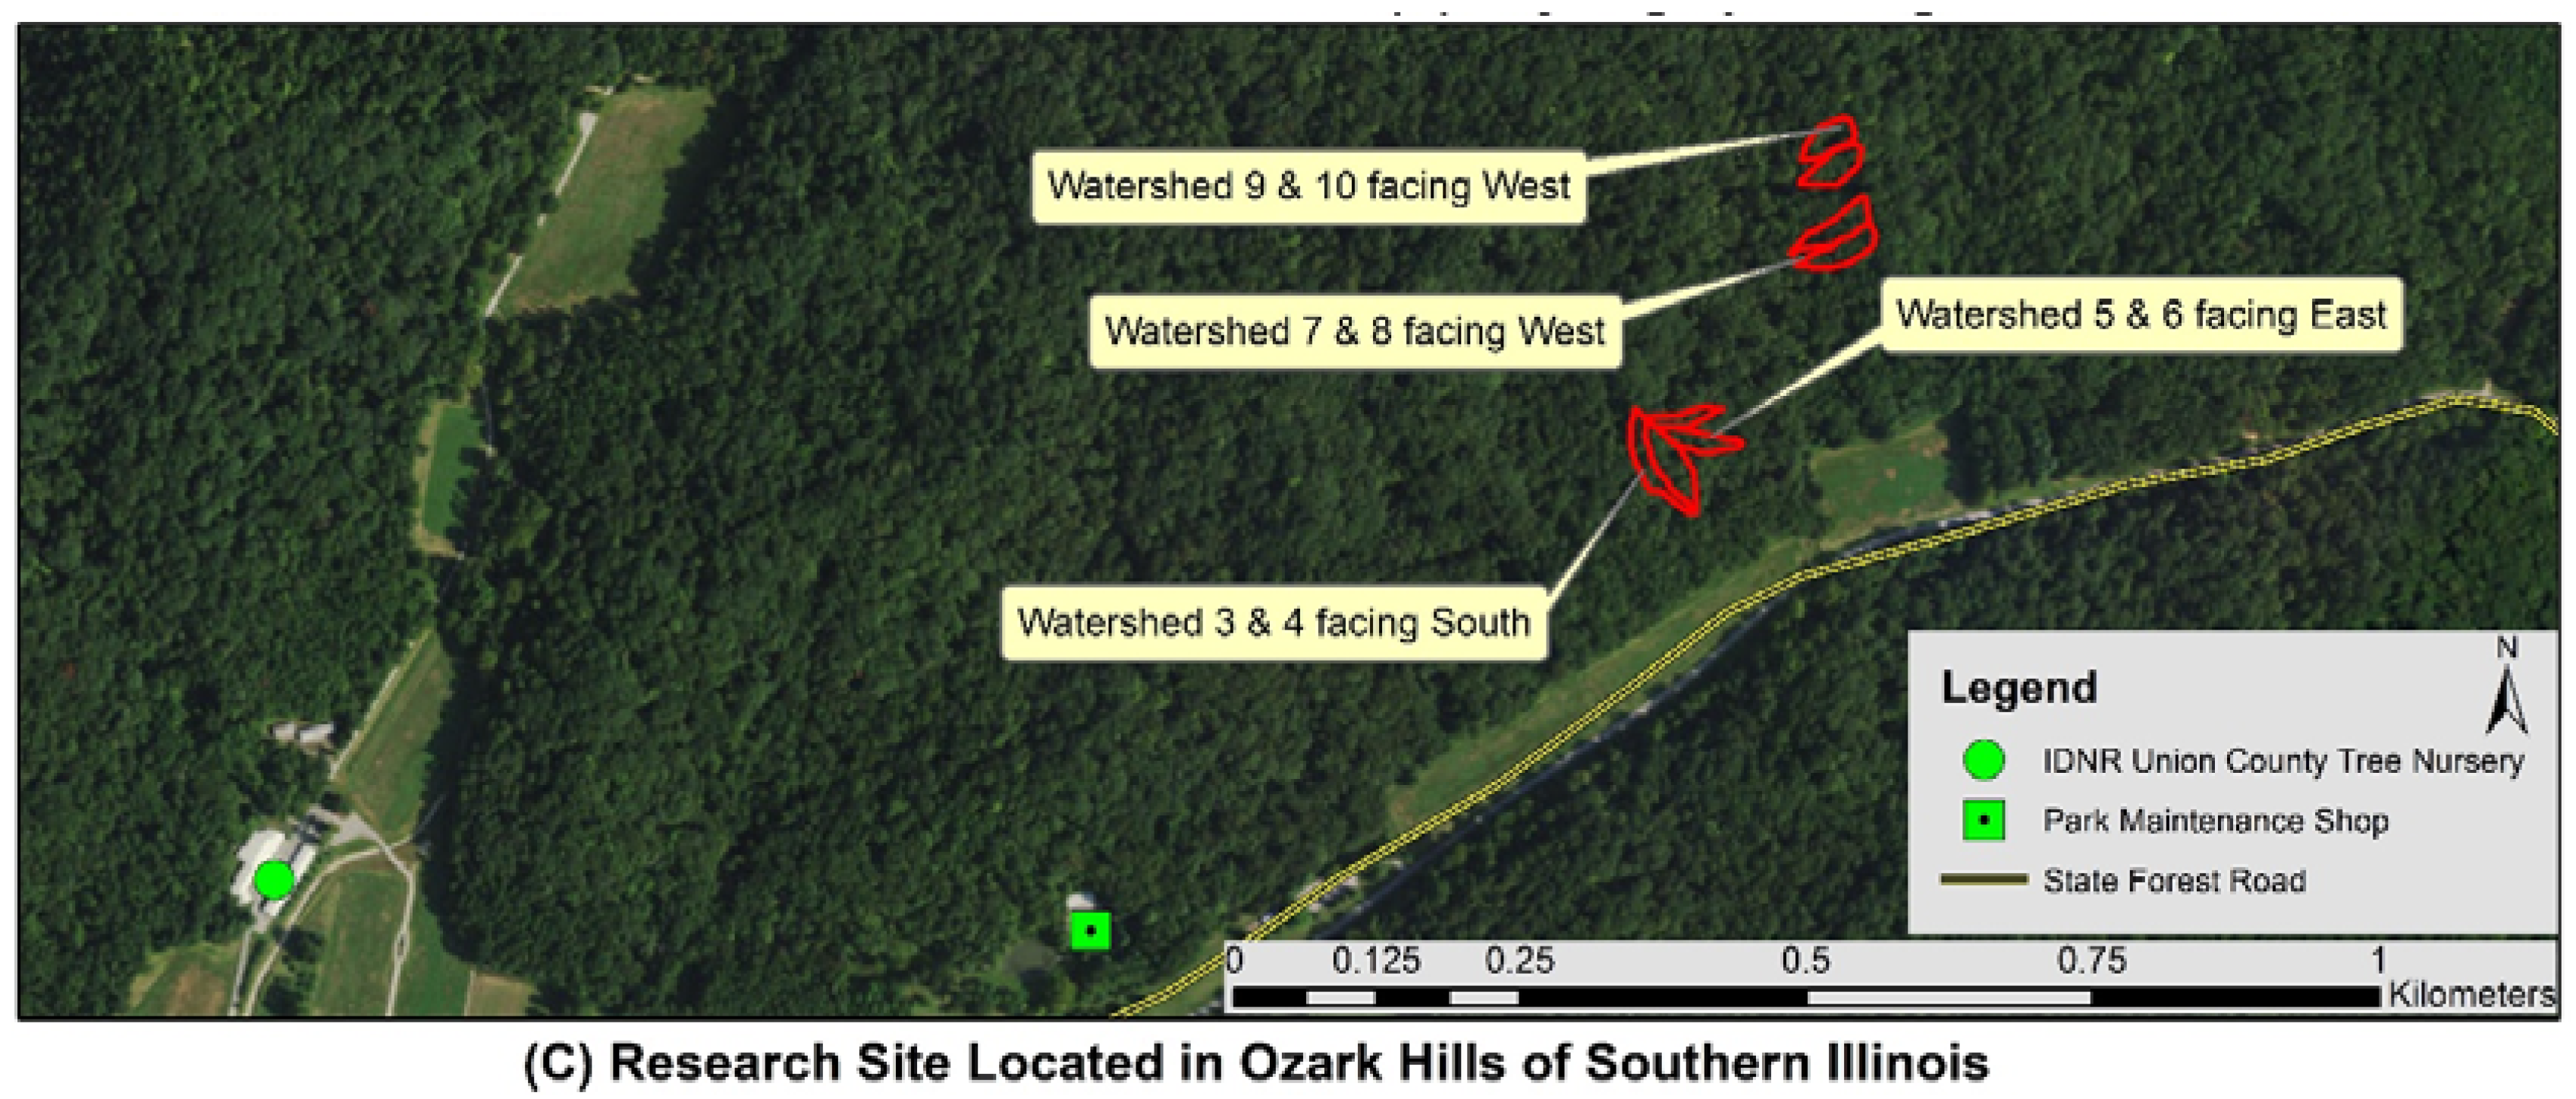
Figure 2.
Erosion pin installed flush with the soil surface (a). Installation of galvanized metal flume (b) and complete set up of flume and tank design (c).
Figure 2.
Erosion pin installed flush with the soil surface (a). Installation of galvanized metal flume (b) and complete set up of flume and tank design (c).
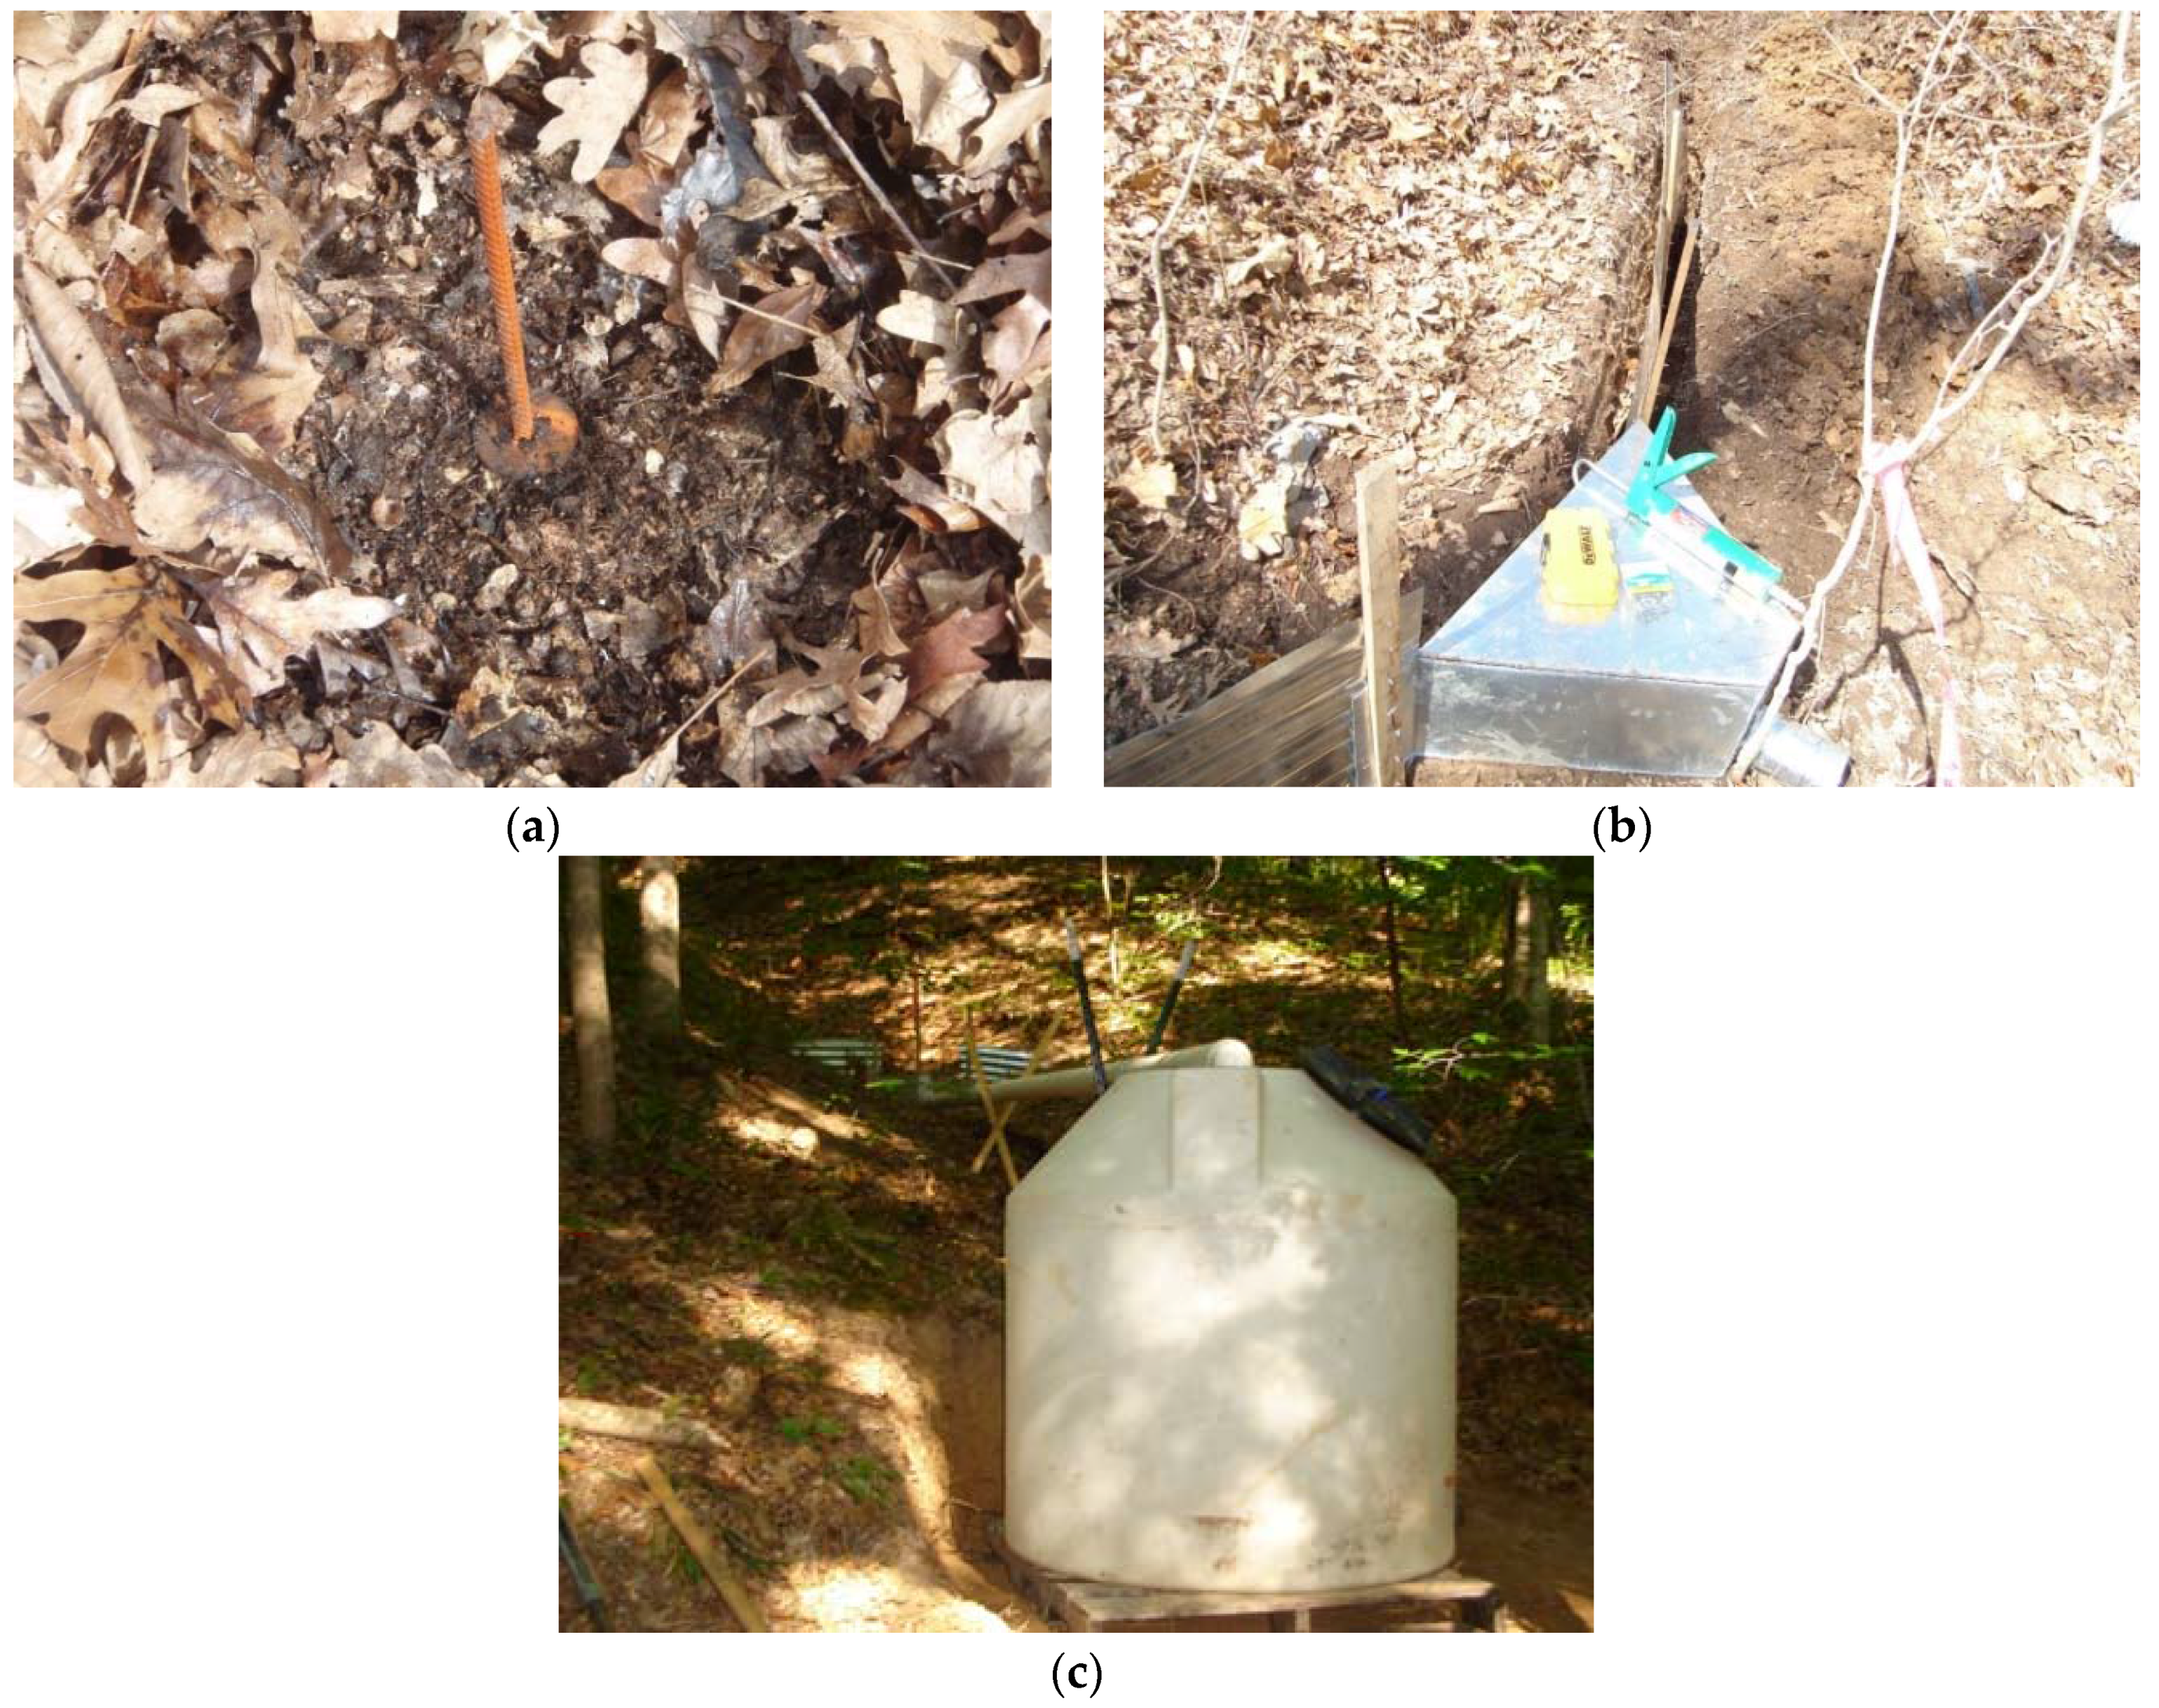
Figure 3.
Example of how the backing fire was used to improve the fire line before continuing the ignition process by lighting the ring-head fire. Photographs showing the completion of the ring-head fire ignition sequence in watershed 10 (a,b). Photograph showing the completion of the prescribed burn treatment in Watershed 10 (c).

Figure 4.
Average monthly air temperature (a); average monthly total precipitation (b); and rainfall intensity for runoff collection events (c) during 2009 and 2010 at Trail of Tears State Forest, IL.
Figure 4.
Average monthly air temperature (a); average monthly total precipitation (b); and rainfall intensity for runoff collection events (c) during 2009 and 2010 at Trail of Tears State Forest, IL.
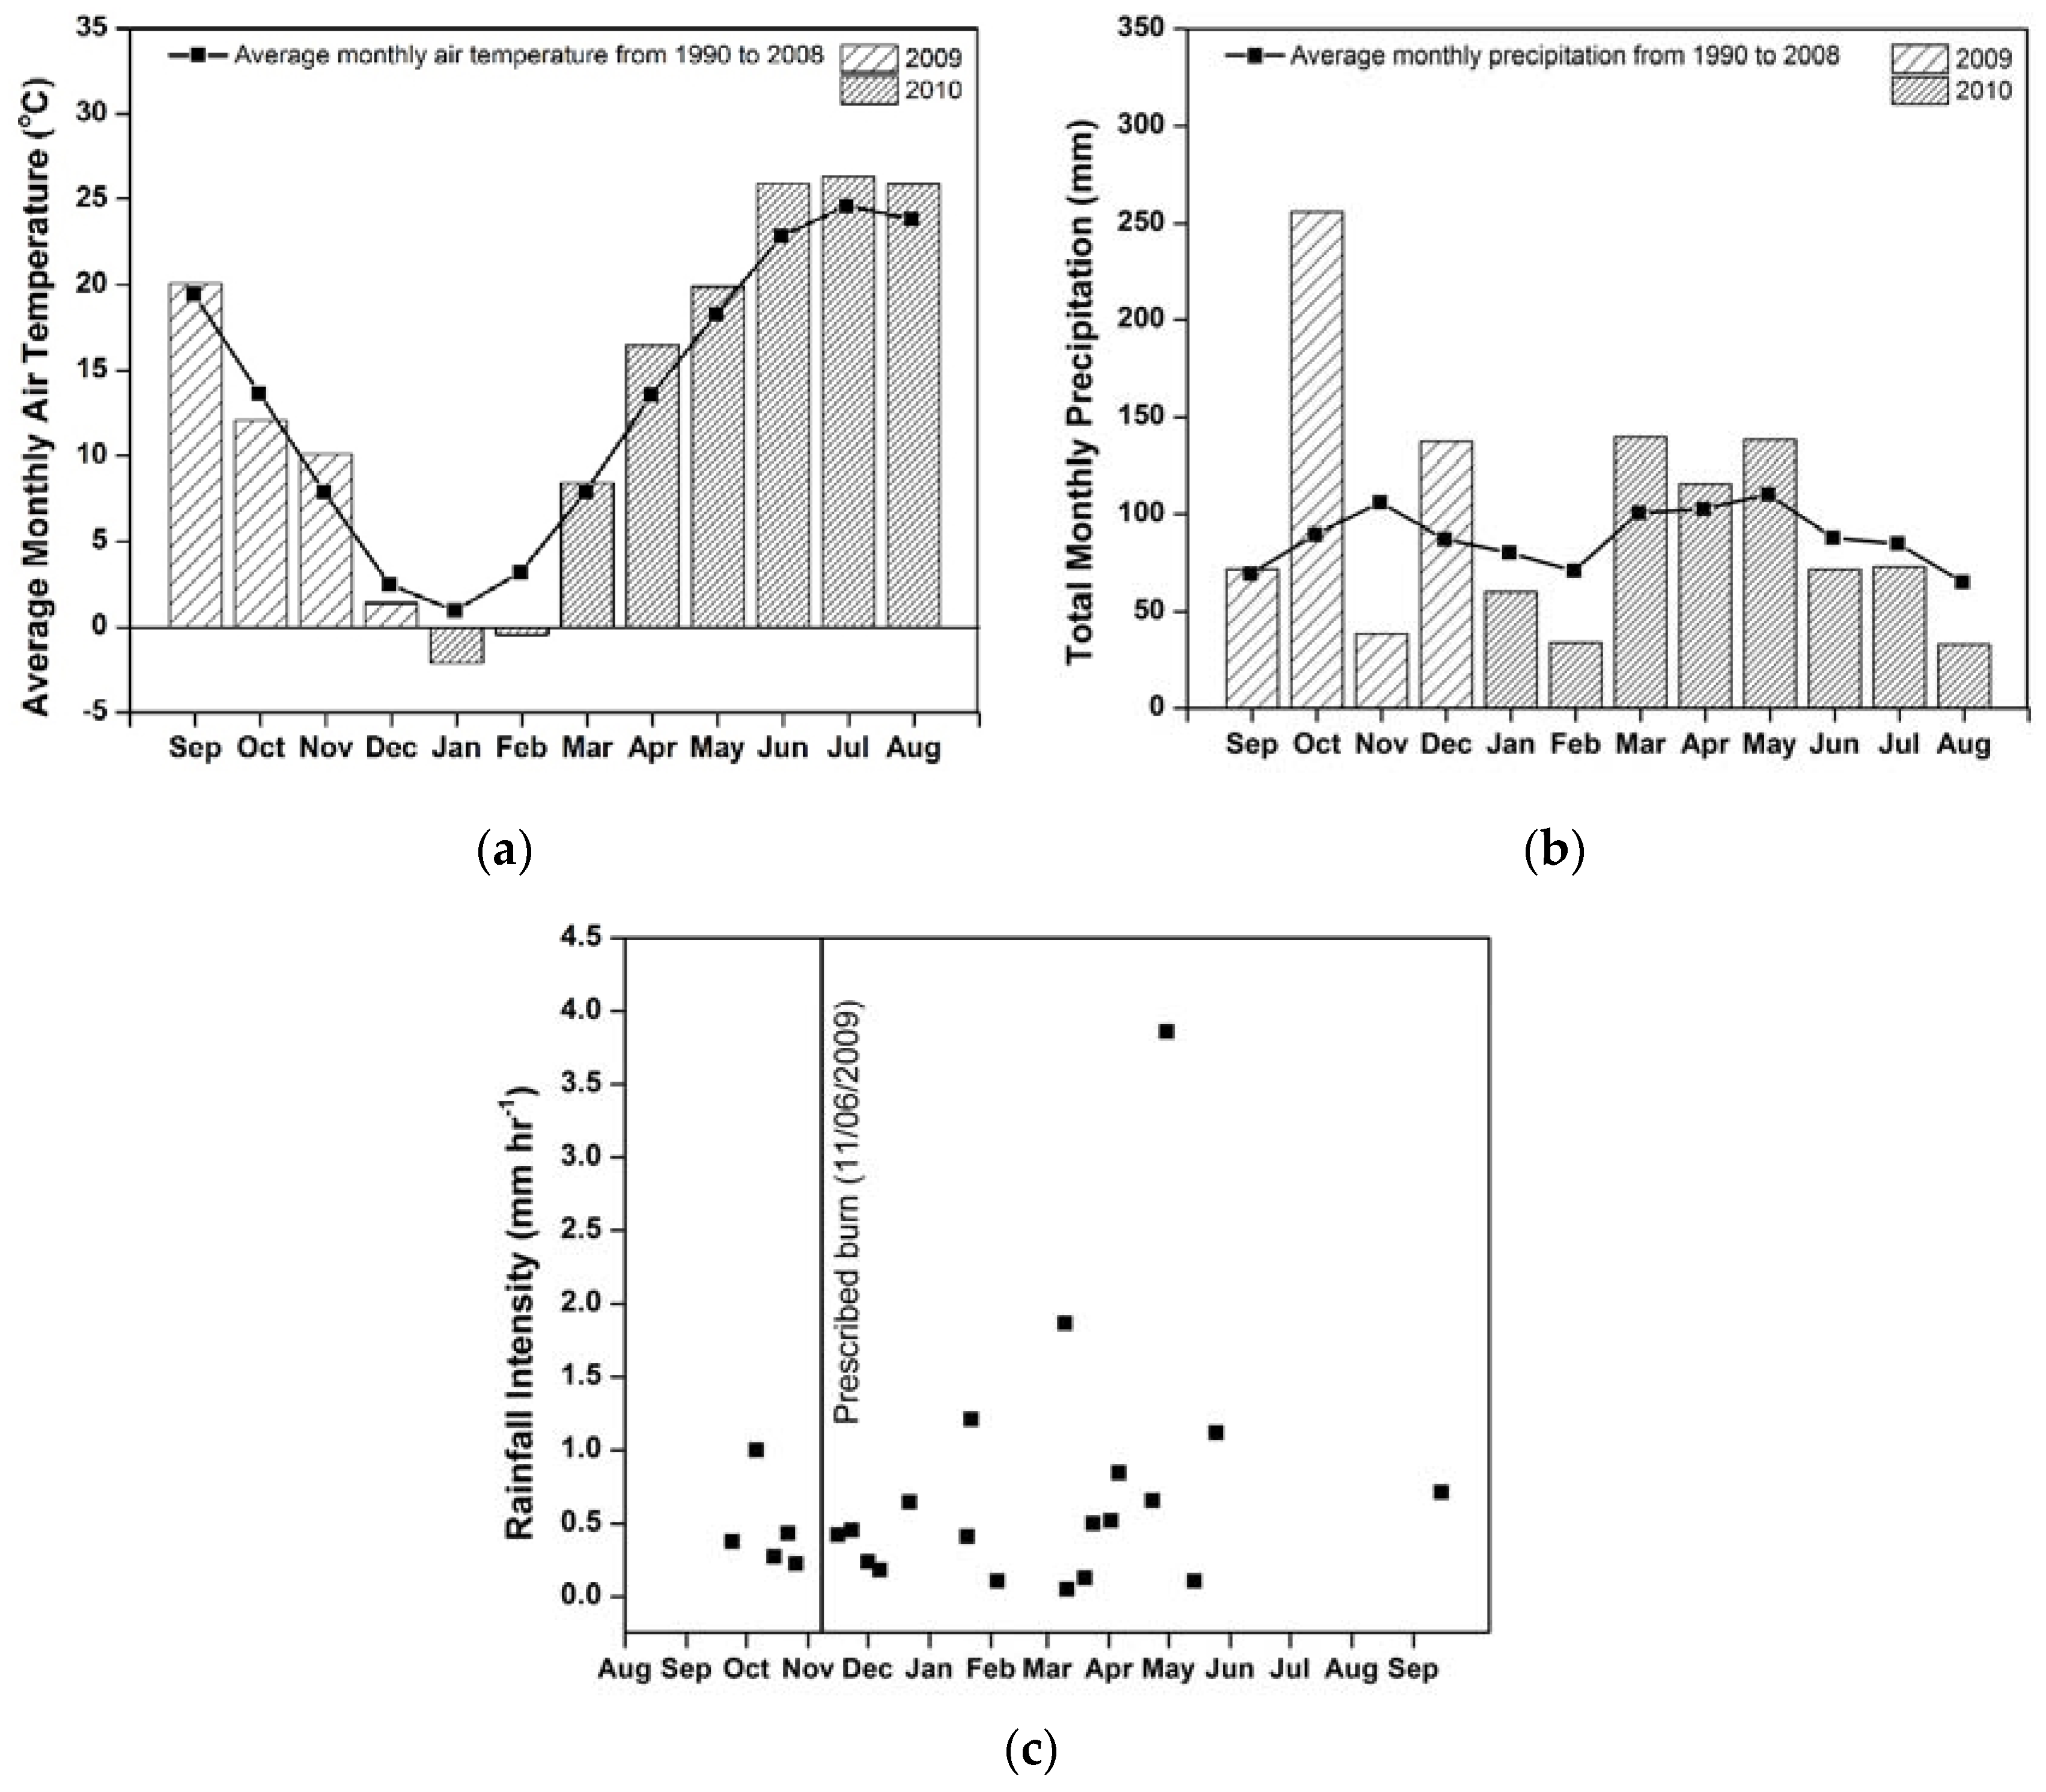
Figure 5.
Picture of watershed 7 on the left (a) and 8 on the right (b), which show the incised or V-shaped channel with litter accumulation. Picture showing coarse woody debris that was lying across the drainage of watershed 9 (c). Litter consumption following the prescribed burn treatment in watershed 4 at Trail of Tears State Forest, IL (d).
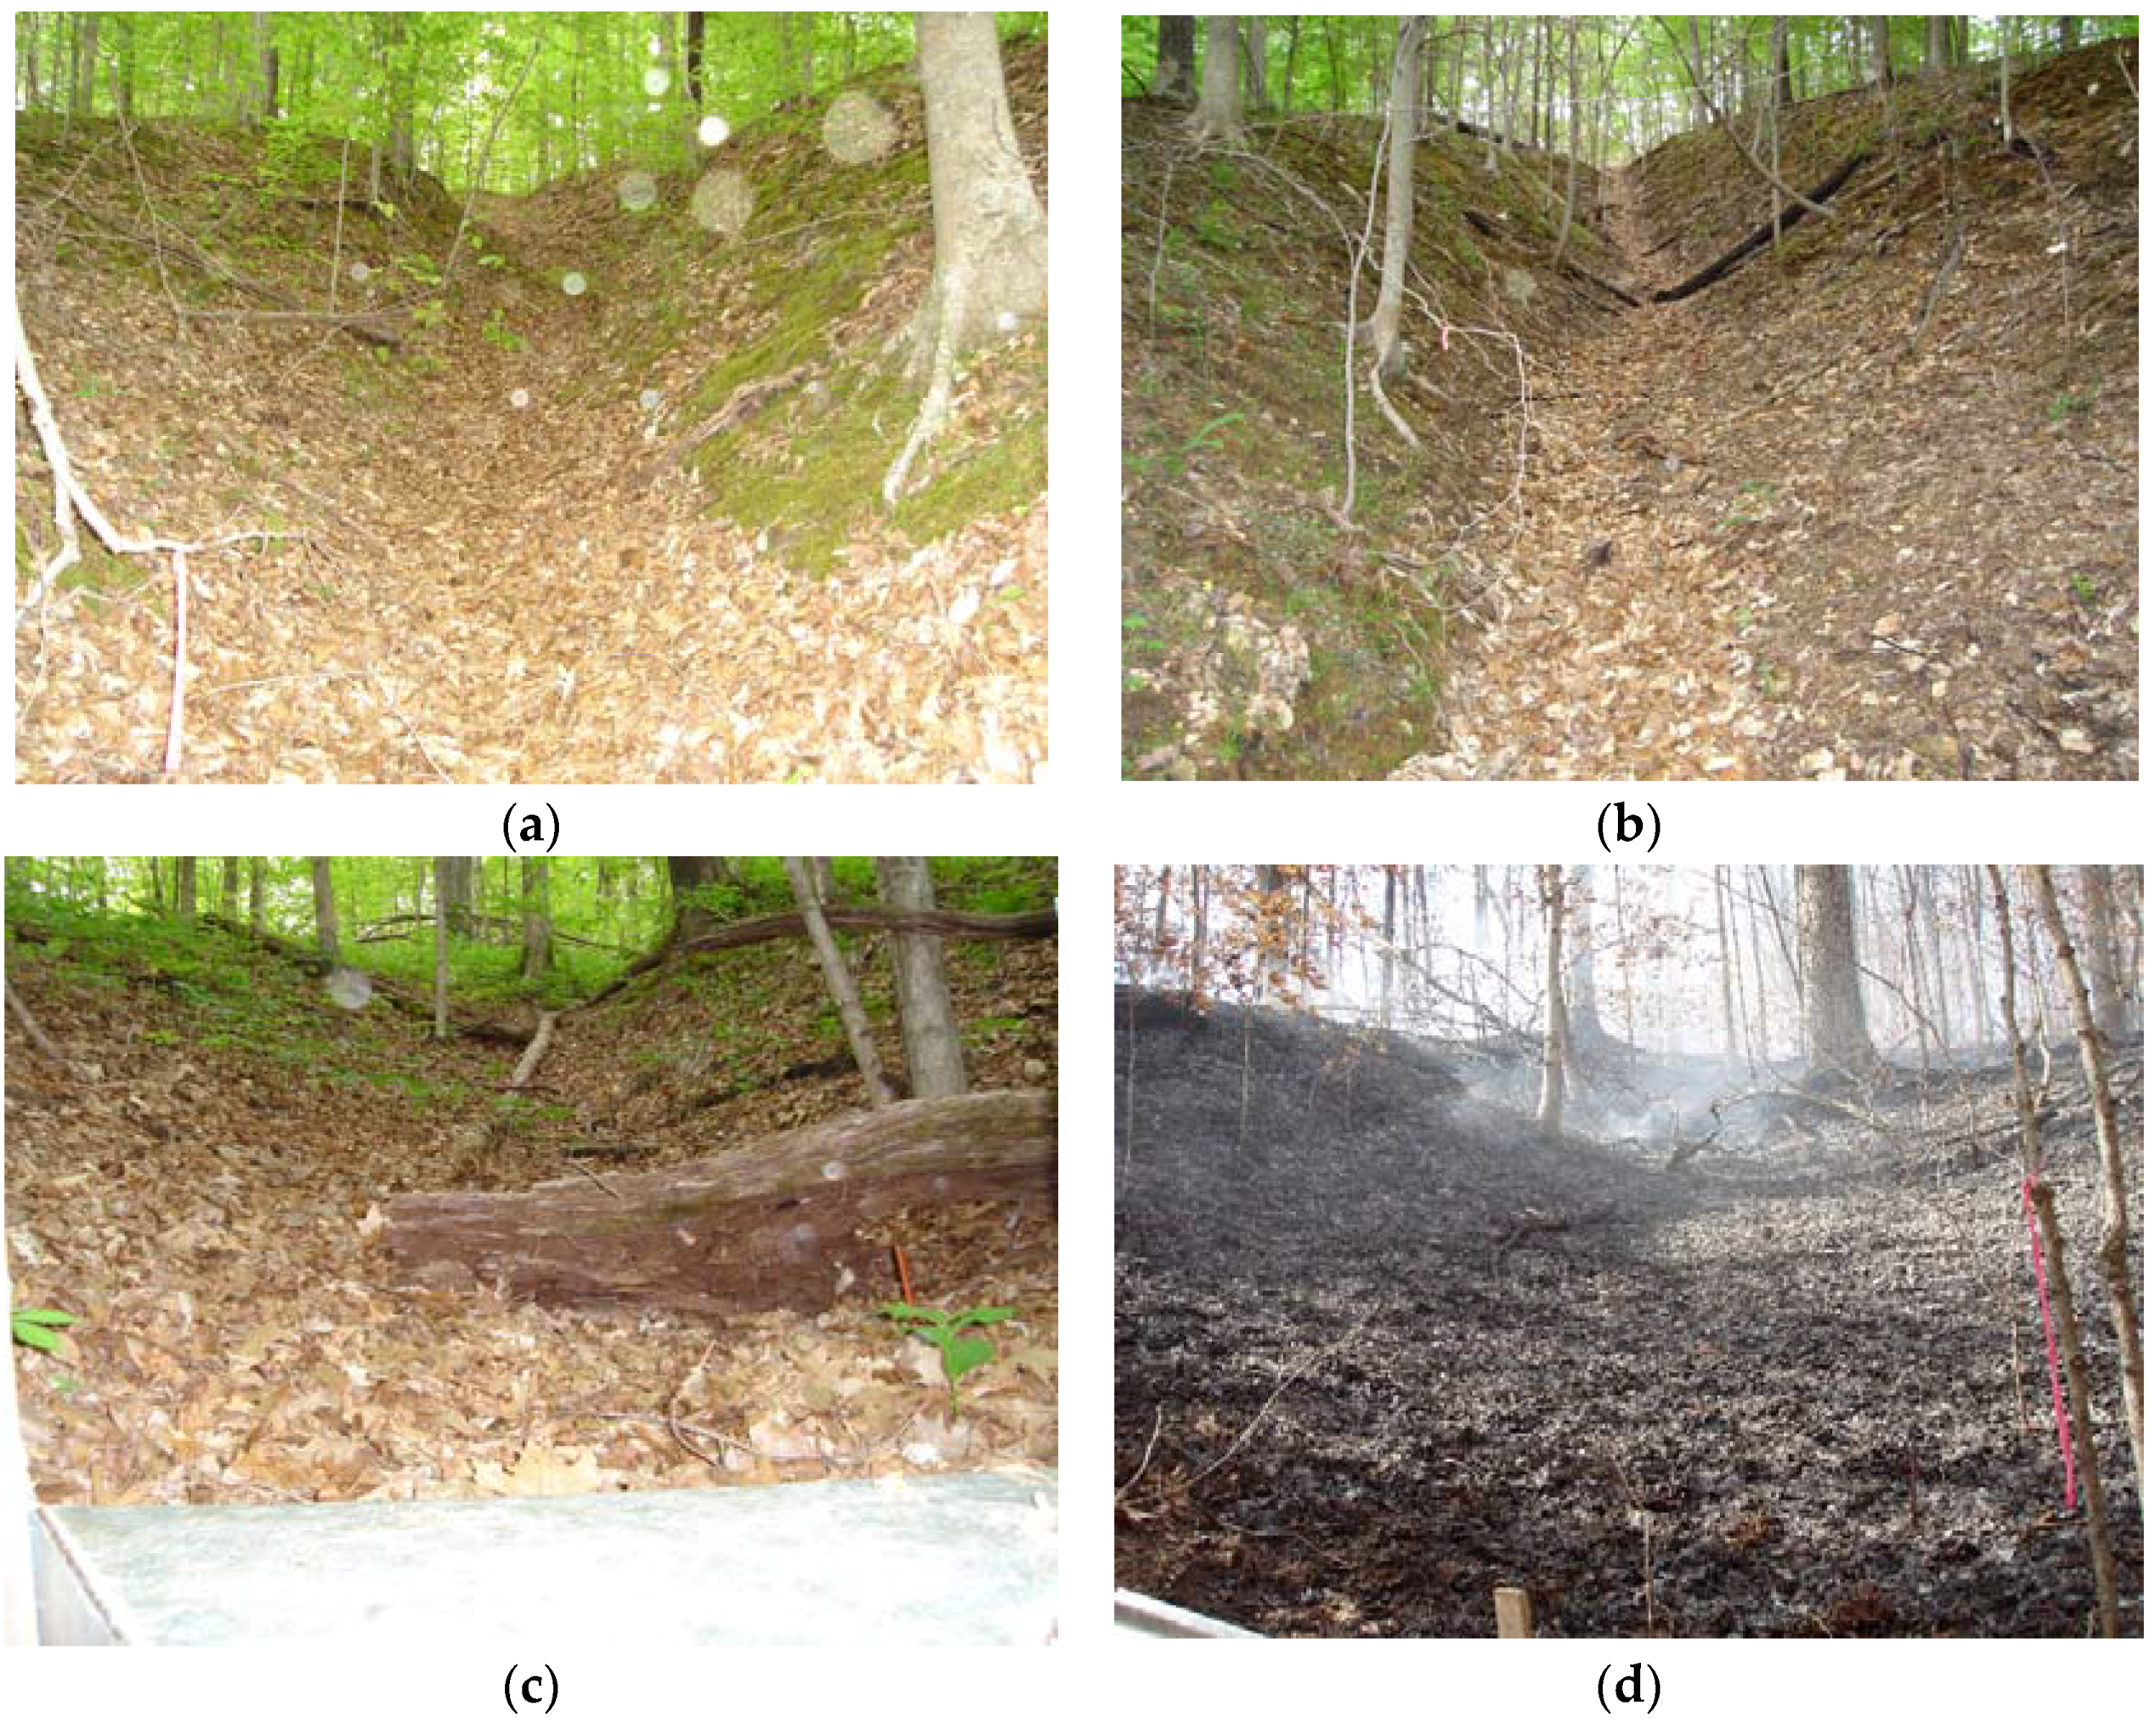
Figure 6.
Comparisons of mean ±95% confidence interval (CI) for pre-burn (a) total suspended solids concentration; (b) sediments concentration; (c) total suspended solids loads; and (d) sediment loads by paired-watersheds. Significant differences (p values < 0.05) are noted by different letters at the top of each bar.

Figure 7.
Comparisons of mean ±95% confidence interval (CI) for post-burn (a) total suspended solids concentration, (b) sediments concentration, (c) total suspended solids loads, and (d) sediment loads by treatments in paired-watersheds. Significant differences (p values < 0.05) are noted by different letters at the top of each bar.
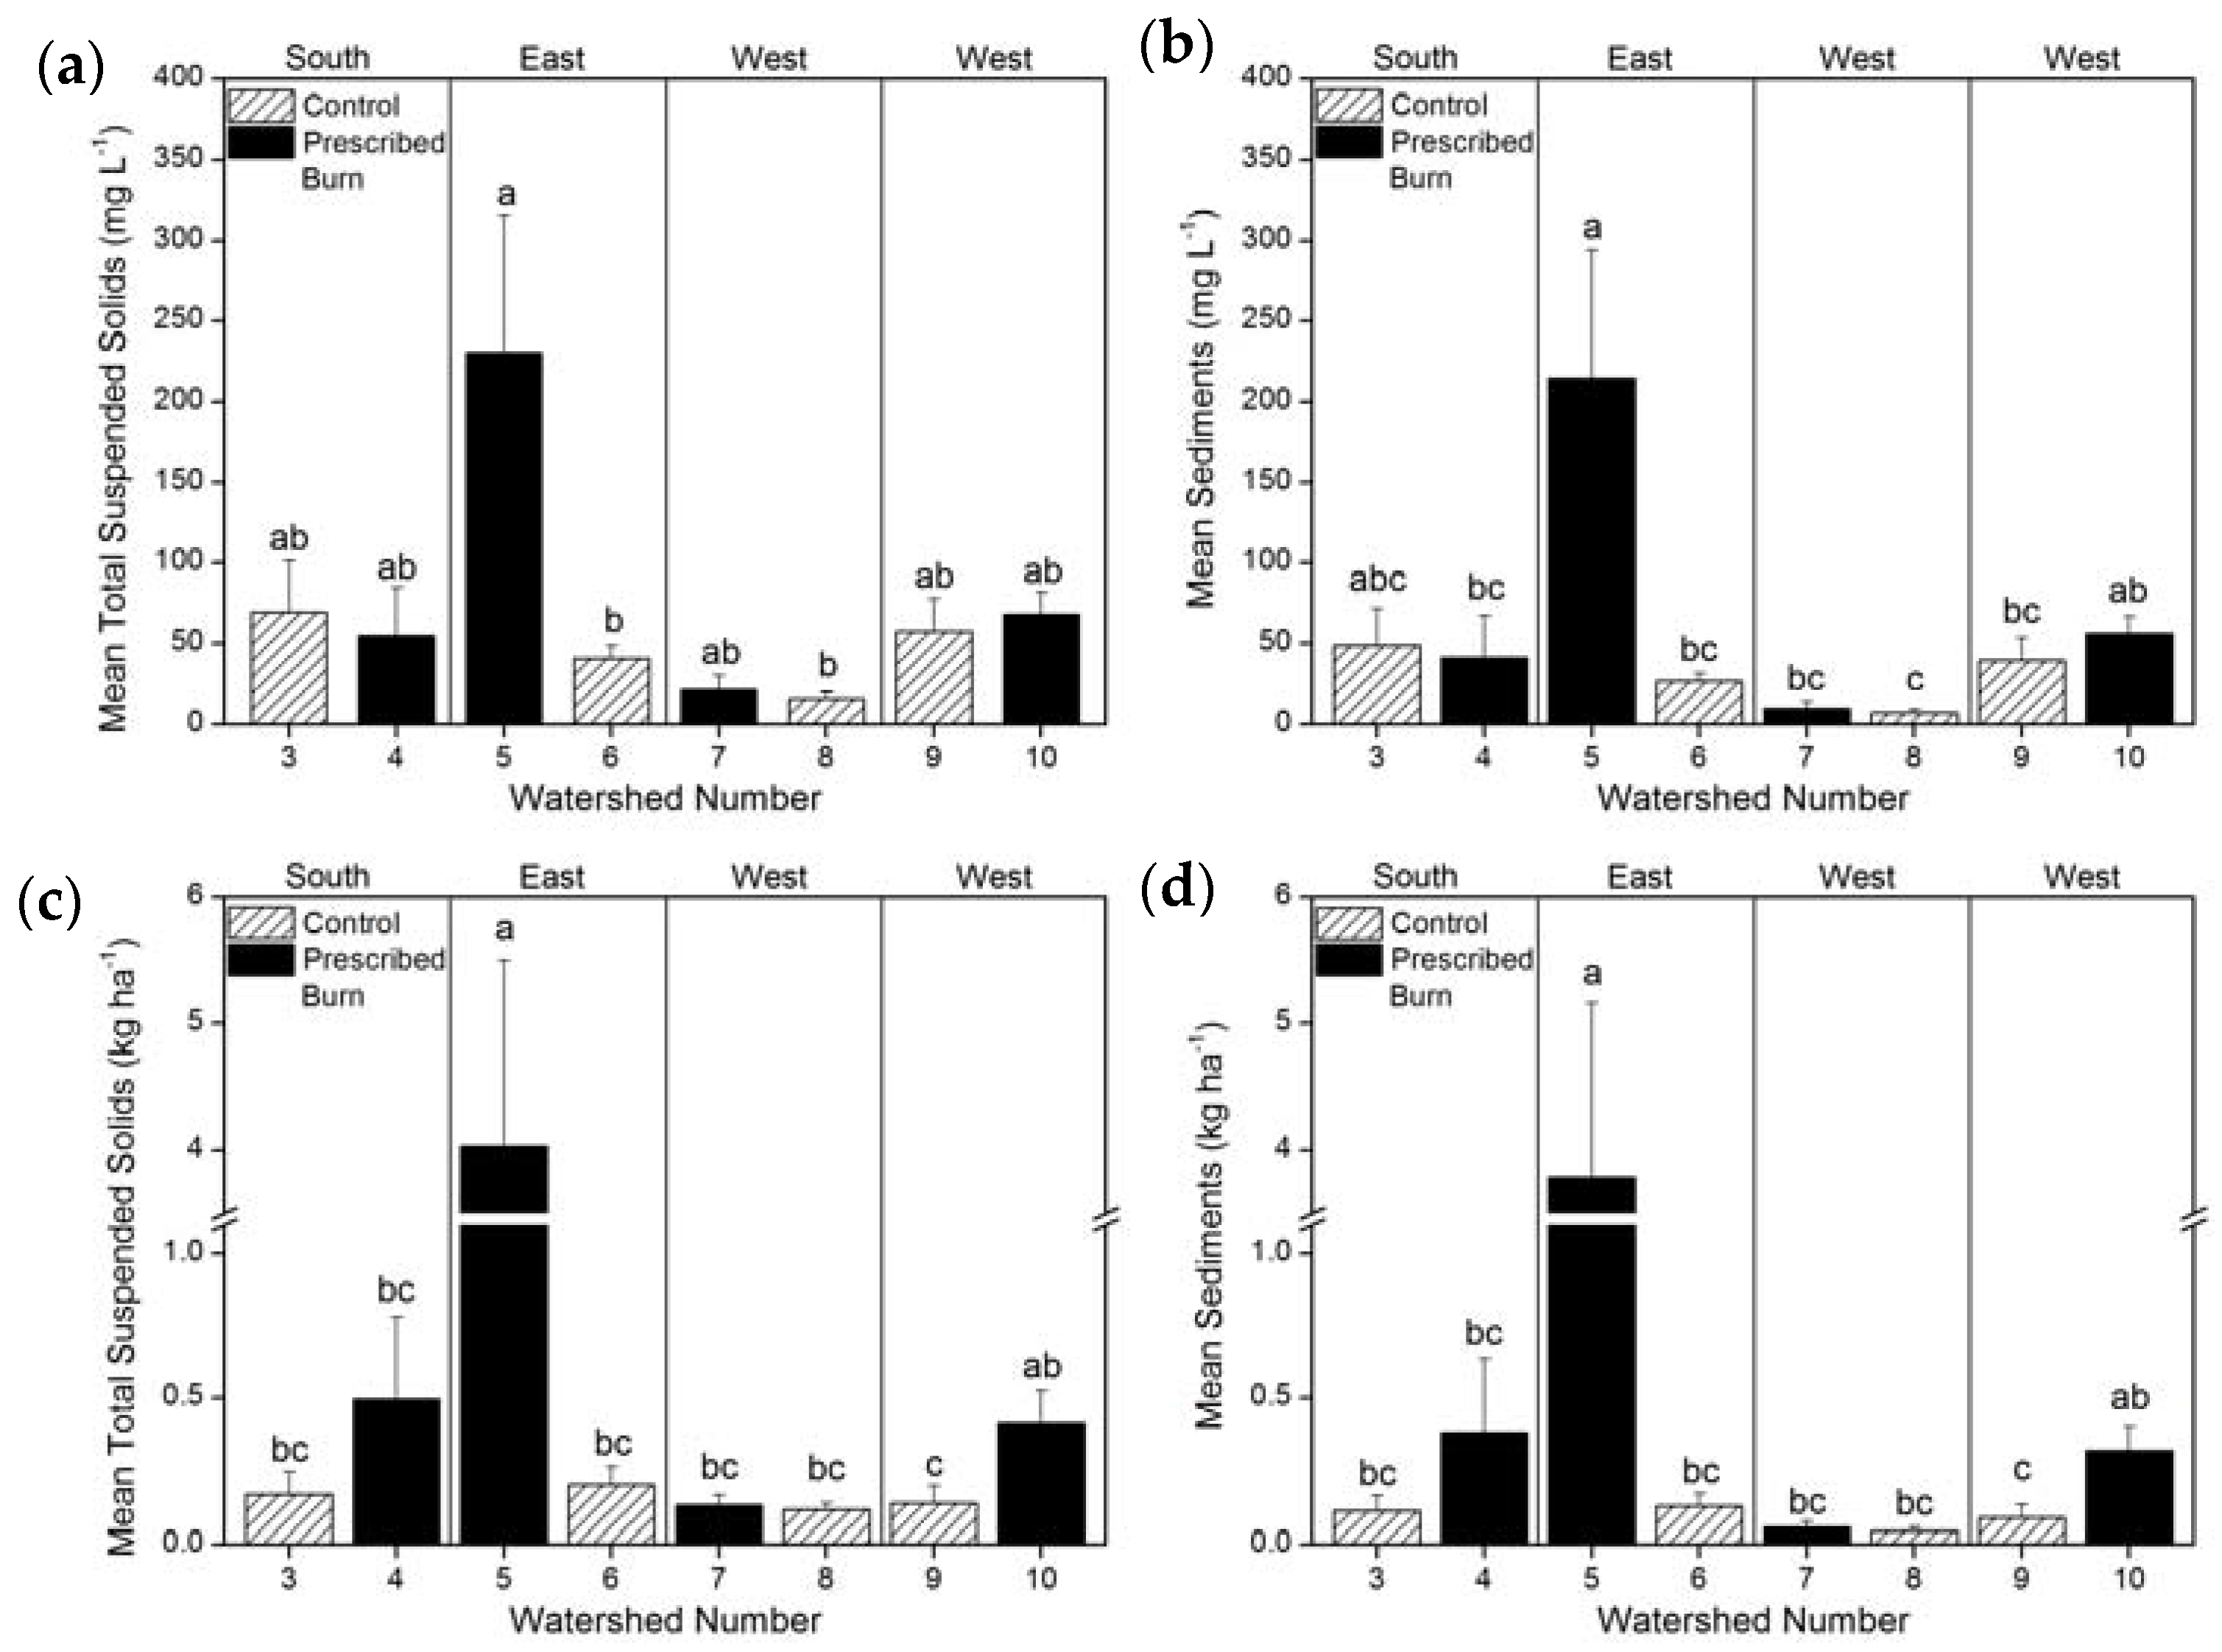
Figure 8.
Scatter plots for means from 24 runoff collection events for (a) total suspended solids concentration; (b) sediments concentration; (c) total suspended solids loads; and (d) sediment loads data by treatments combined by watersheds.
Figure 8.
Scatter plots for means from 24 runoff collection events for (a) total suspended solids concentration; (b) sediments concentration; (c) total suspended solids loads; and (d) sediment loads data by treatments combined by watersheds.
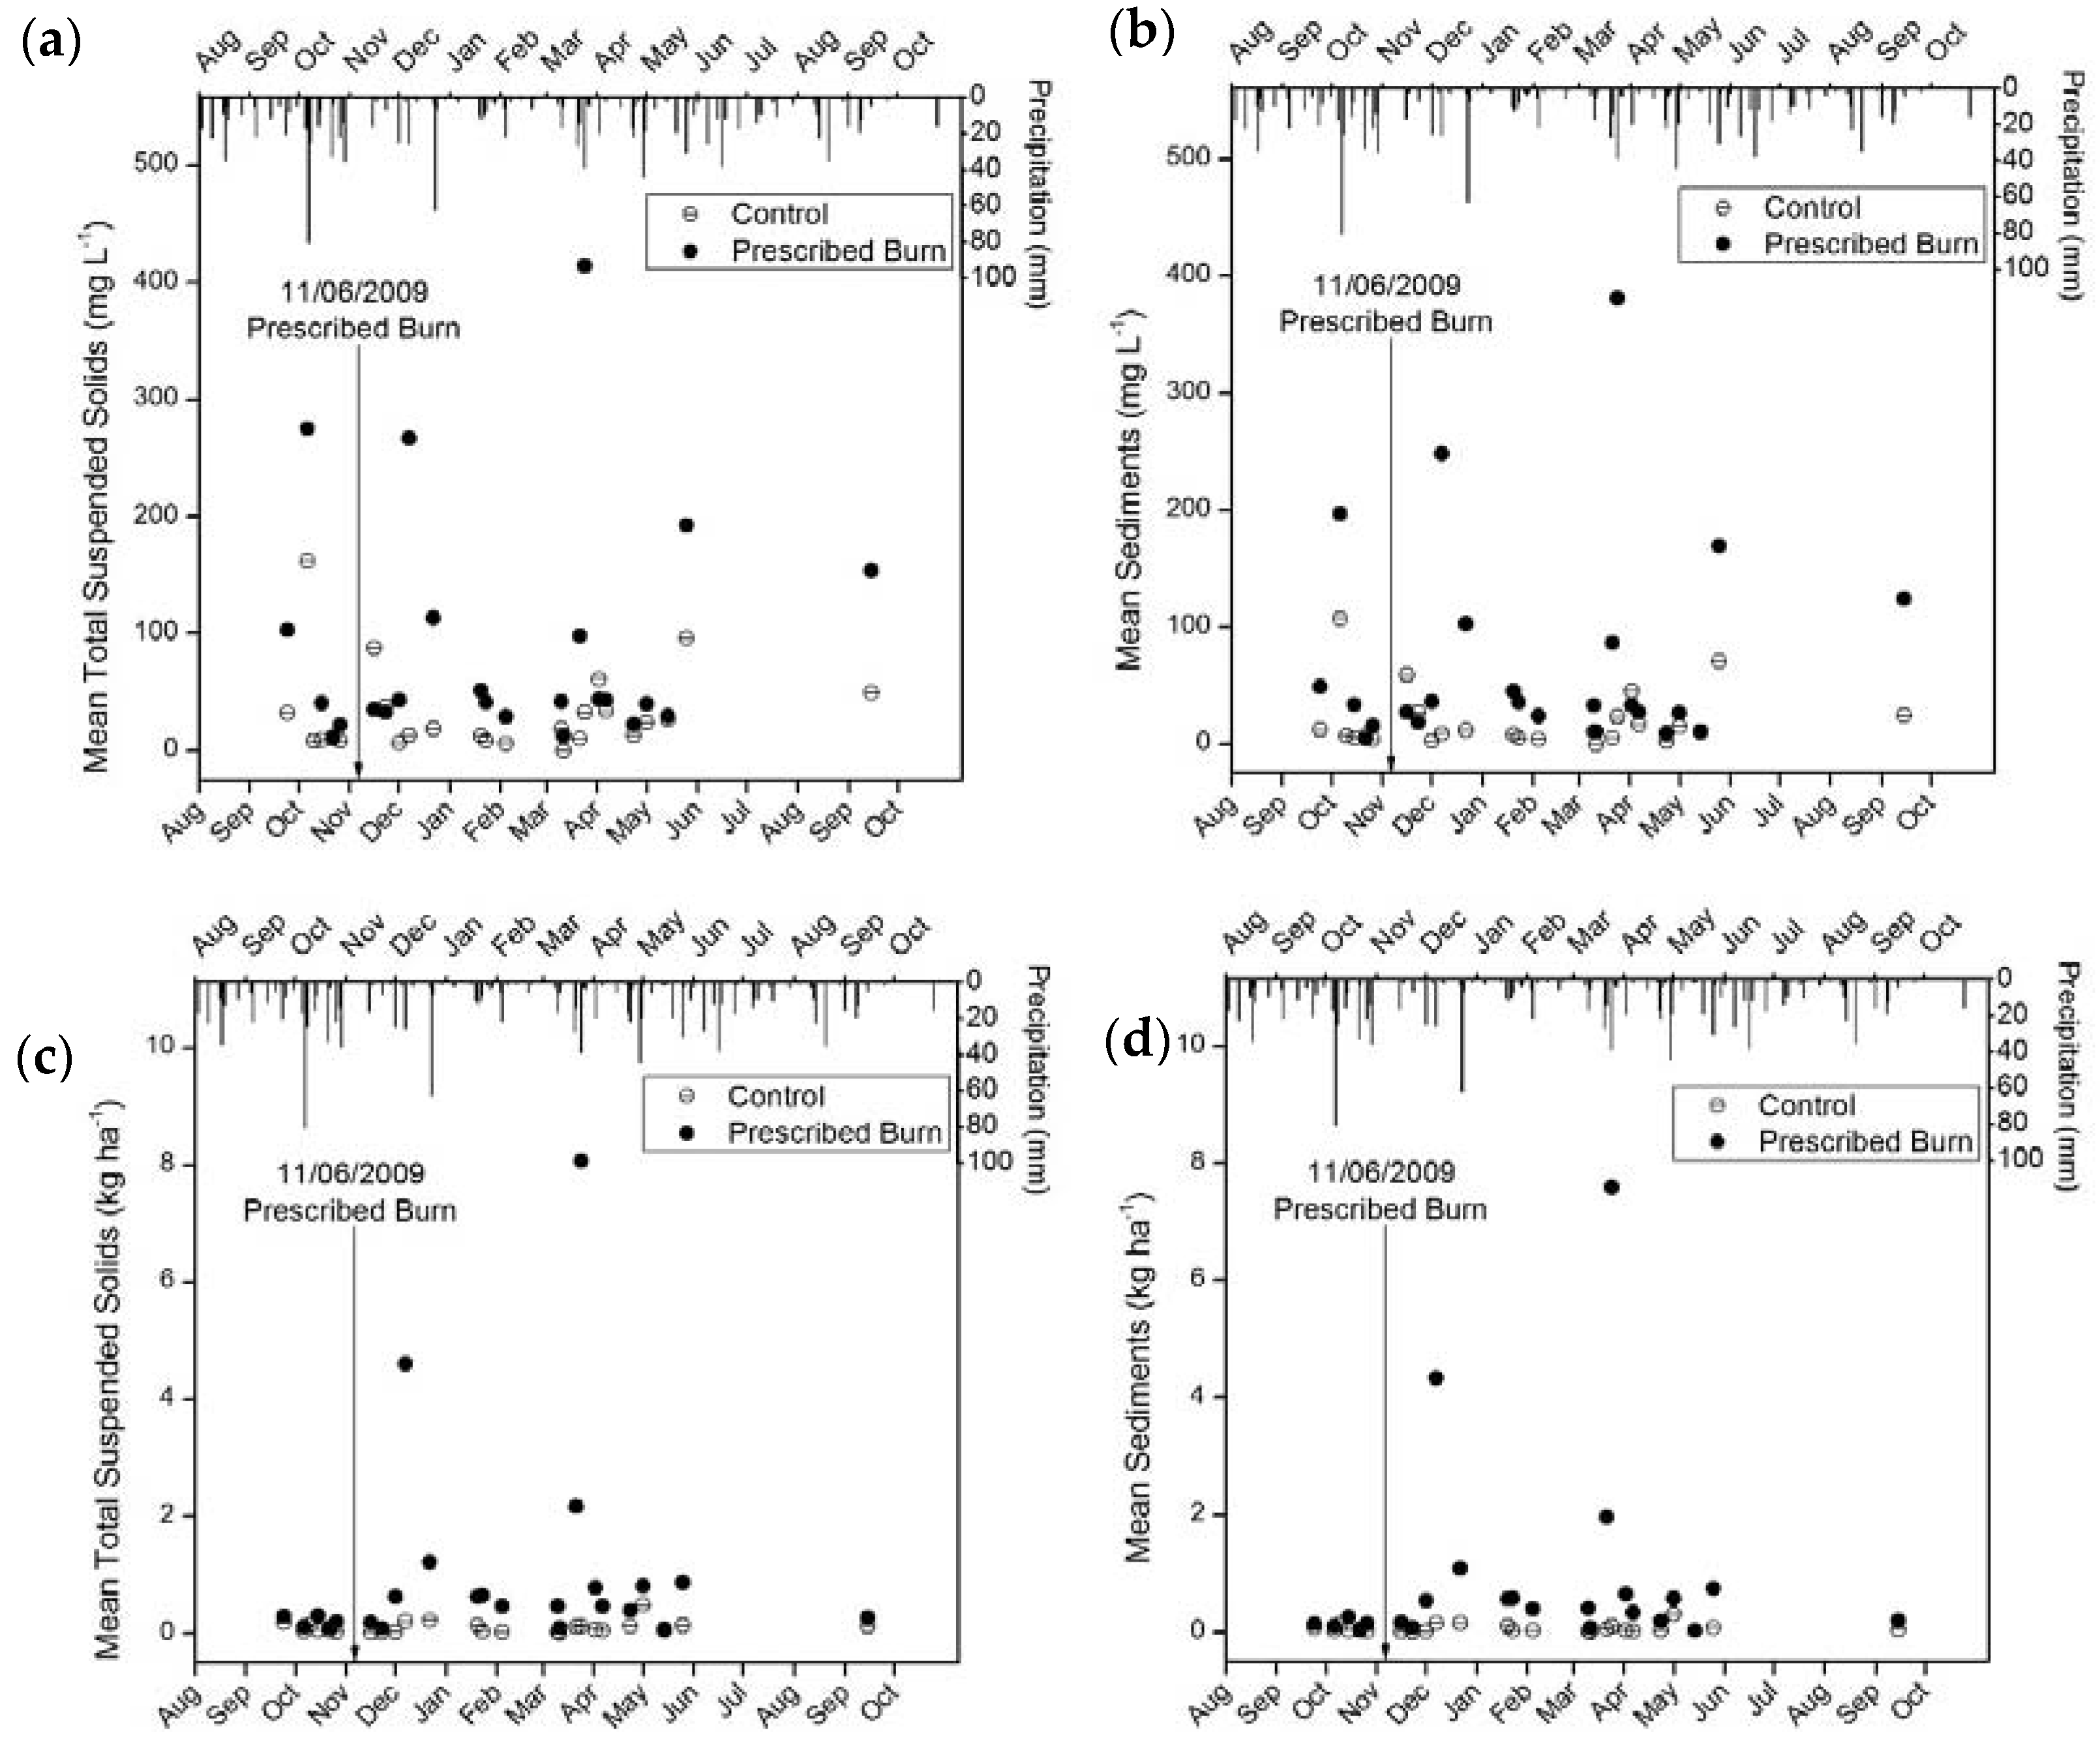
Figure 9.
Comparisons of mean ±95% confidence interval (CI) pre-burn and post-burn (a) total suspended solids concentration; (b) sediments concentration; (c) total suspended solids loads; and (d) sediment loads data by treatments combined over watersheds. Significant differences (p values < 0.05) are noted by different letters at the top of each bar.


Table 1.
Watershed characteristics including landscape features and vegetation densities at Trail of Tears State Forest, IL.
Table 1.
Watershed characteristics including landscape features and vegetation densities at Trail of Tears State Forest, IL.
| Landscape Characteristics | Vegetation Characteristics | ||||||||
|---|---|---|---|---|---|---|---|---|---|
| Watershed | Aspect | Average Slope (%) | Slope Range (%) | Elevation Range (m) | Area (ha) | Basal Area (m2·ha−1) | Mature Trees ha−1 (>9 cm) | Saplings ha−1 (2–9 cm) | Seedlings ha−1 (<2 cm) |
| Control | |||||||||
| 3 | South | 18.1 | 5.0–68.8 | 140–169 | 0.11 | 31.1 | 411 | 794 | 9781 |
| 6 | East | 21.3 | 3.4–44.7 | 141–167 | 0.06 | 17.0 | 356 | 1096 | 4109 |
| 8 | West | 24.8 | 2.2–58.3 | 140–169 | 0.11 | 42.6 | 493 | 767 | 21,918 |
| 9 | West | 21.6 | 2.2–45.8 | 155–174 | 0.06 | 31.3 | 384 | 877 | 13,013 |
| Prescribed Burn | |||||||||
| 4 | South | 18.6 | 0.1–42.9 | 140–166 | 0.12 | 54.6 | 493 | 109 | 10,274 |
| 5 | East | 21.6 | 0.0–43.7 | 138–161 | 0.07 | 44.7 | 356 | 329 | 9589 |
| 7 | West | 24.6 | 1.8–72.4 | 141–169 | 0.10 | 38.1 | 548 | 438 | 5479 |
| 10 | West | 18.9 | 1.7–42.8 | 151–171 | 0.09 | 30.7 | 576 | 767 | 5479 |
Vegetation characteristics represent the average of two sampling plots accessed in each watershed.
Table 2.
On-site weather conditions during the prescribed burn on 6 November 2009 at Trail of Tears State Forest, IL.
Table 2.
On-site weather conditions during the prescribed burn on 6 November 2009 at Trail of Tears State Forest, IL.
| Time (CST) | Temp (°F) | Temp (°C) | Relative Humidity (%) | Wind Speed (km·h−1) | Wind Direction |
|---|---|---|---|---|---|
| 1100 | 68.5 | 20.3 | 43 | 3–8 | S-SW |
| 1200 | 74.8 | 23.8 | 39 | 3 | S |
| 1300 | 76.8 | 24.9 | 37 | 6–10 | S |
Table 3.
Mean ± standard error air temperature at 30 cm above the soil surface for burned watersheds at Trail of Tears State Forest, IL.
Table 3.
Mean ± standard error air temperature at 30 cm above the soil surface for burned watersheds at Trail of Tears State Forest, IL.
| Watershed | Mean Temperature (°C) † | Aspect |
|---|---|---|
| 4 | 207.44 ± 12.14 a †† | South |
| 5 | 218.61 ± 26.95 a | East |
| 7 | 281.56 ± 36.39 a | West |
| 10 | 191.77 ± 20.94 a | West |
† Mean air temperatures were taken from an average of five hobo thermometers placed throughout each watershed; †† Different letter within a column represent significant differences at p value < 0.05.
Table 4.
Average pre- and post-burn litter depth and soil moisture for experimental watersheds at Trail of Tears State Forest, IL.
Table 4.
Average pre- and post-burn litter depth and soil moisture for experimental watersheds at Trail of Tears State Forest, IL.
| Watershed | Average Litter Depth (cm) | Average Volumetric Water Content (%) | ||
|---|---|---|---|---|
| Pre-Burn | Post-Burn | Pre-Burn | Post-Burn | |
| Control | ||||
| 3 | 4.50 a †† | 4.50 a †† | 22.0 ab | 22.2 a |
| 6 | 4.66 a | 4.66 a | 25.2 ab | 24.0 a |
| 8 | 3.92 a | 3.92 a | 22.2 ab | 23.3 a |
| 9 | 3.73 a | 3.73 a | 24.0 ab | 24.0 a |
| Prescribed Burn | ||||
| 4 | 4.77 a | 0.60 b | 26.3 a | 25.8 a |
| 5 | 4.63 a | 0.62 b | 19.8 b | 19.1 a |
| 7 | 4.13 a | 1.34 b | 24.9 ab | 22.6 a |
| 10 | 4.29 a | 1.29 b | 25.6 ab | 25.4 a |
†† Within a column, different letters represent significant differences at p values < 0.05.
Table 5.
Projected annual sediment loss from the watersheds during the post-burn phase and annual soil movement measured by erosion pins in all watersheds at Trail of Tears State Forest, IL.
Table 5.
Projected annual sediment loss from the watersheds during the post-burn phase and annual soil movement measured by erosion pins in all watersheds at Trail of Tears State Forest, IL.
| Watershed | Projected Annual Sediment Loss (kg·year−1) † | Projected Annual Sediment Loss per Ha (kg·ha−1·year−1) | Average Change in Soil Movement per Watershed (mm) † |
|---|---|---|---|
| Control | |||
| 3 | 0.09 | 0.81 | 2.63 ± 1.91 ab †† |
| 6 | 0.16 | 2.54 | −1.32 ± 1.24 ab |
| 8 | 0.11 | 1.04 | 9.89 ± 7.32 b |
| 9 | 0.07 | 1.10 | 0.92 ± 0.64 ab |
| Prescribed Burn | |||
| 4 | 0.53 | 4.34 | 1.84 ± 2.53 ab |
| 5 | 5.97 | 90.54 | −2.68 ± 1.62 ab |
| 7 | 0.15 | 1.41 | −4.19 ± 1.87 a |
| 10 | 0.62 | 6.76 | −2.14 ± 1.53 ab |
† Projected annual losses were predicted based on the daily average sediment loss for the 301 days that made up the post-burn sampling period. This average daily loss was used to predict the remaining 64 days to estimate the annual loss; Negative numbers indicated soil loss and positive numbers indicate accumulation; †† Different letter within a column represent significant differences at p values < 0.05.
Table 6.
Annual soil losses reported from different land use systems in the United States.
| Reference | Location | Land Use | Years † | Annual Precipitation (mm) | Soil Loss (kg·ha−1·year−1) |
|---|---|---|---|---|---|
| Meginnis [57] | Holly Springs, Mississippi | Scrub oak, burned | 2 | 1620 | 740 |
| Oaks, unburned | 2 | 1700 | 56 | ||
| Daniel et al. [58] | Guthrie, Oklahoma | Woodland burned annually | 10 | 780 | 247 |
| Woodland unburned | 10 | 780 | 22 | ||
| Copley et al. [59] | Statesville, North Carolina | Hardwood, burned semi-annually | 9 | 1180 | 6904 |
| Hardwood, unburned | 9 | 1180 | 4 | ||
| Pope et al. [60] | Tyler, Texas | Woodland, burned annually | 9 | 1041 | 807 |
| Woodland unburned | 9 | 1041 | 112 | ||
| Ferguson [61] | East Texas | Shortleaf-loblolly, single burn | 1.5 | - | 471 |
| Shortleaf-loblolly, unburned | 1.5 | - | 224 | ||
| Ursic [50] | North Mississippi | Scrub oak, burned | 3 | 1323 | 568 |
| Scrub oak, unburned | 3 | 1323 | 247 | ||
| Schuman et al. [62] | Treynor, Iowa | Corn, contour farming | 3 | 778 | 25,310 |
| Corn, contour farming | 3 | 774 | 16,600 | ||
| Bromegrass, rotational grazing | 3 | 755 | 600 | ||
| Corn, level terraced farming | 3 | 757 | 1330 | ||
| Sharpley [63] | Southern Plains of Oklahoma and Texas | Grass | >6 | - | 223 |
| Field crops, no-till | >6 | - | 564 | ||
| Field crops, reduced-till | >6 | - | 1275 | ||
| Field crops, conventional-till | >6 | - | 3574 | ||
| Peanut-Sorghum | >6 | - | 16,684 |
† Total number of years for soil loss monitoring.
© 2017 by the authors. Licensee MDPI, Basel, Switzerland. This article is an open access article distributed under the terms and conditions of the Creative Commons Attribution (CC BY) license (http://creativecommons.org/licenses/by/4.0/).
Share and Cite
MDPI and ACS Style
Singh, G.; Schoonover, J.E.; Monroe, K.S.; Williard, K.W.J.; Ruffner, C.M. Prescribed Burning and Erosion Potential in Mixed Hardwood Forests of Southern Illinois. Forests 2017, 8, 112. https://doi.org/10.3390/f8040112
AMA Style
Singh G, Schoonover JE, Monroe KS, Williard KWJ, Ruffner CM. Prescribed Burning and Erosion Potential in Mixed Hardwood Forests of Southern Illinois. Forests. 2017; 8(4):112. https://doi.org/10.3390/f8040112
Chicago/Turabian StyleSingh, Gurbir, Jon E. Schoonover, Kyle S. Monroe, Karl W. J. Williard, and Charles M. Ruffner. 2017. "Prescribed Burning and Erosion Potential in Mixed Hardwood Forests of Southern Illinois" Forests 8, no. 4: 112. https://doi.org/10.3390/f8040112
Note that from the first issue of 2016, this journal uses article numbers instead of page numbers. See further details here.