
Can Carbon Fluxes Explain Differences in Soil Organic Carbon Storage under Aspen and Conifer Forest Overstories?

Department of Wildland Resources and Ecology Center, Utah State University, Logan, UT 84322-5230, USA
*
Author to whom correspondence should be addressed.
Forests 2017, 8(4), 118; https://doi.org/10.3390/f8040118
Submission received: 25 January 2017
/
Revised: 31 March 2017
/
Accepted: 6 April 2017
/
Published: 11 April 2017
(This article belongs to the Special Issue Tree Species, as Major Drivers of Forest Ecosystems Functioning)
Abstract
:Climate- and management-induced changes in tree species distributions are raising questions regarding tree species-specific effects on soil organic carbon (SOC) storage and stability. Quaking aspen (Populus tremuloides Michx.) is the most widespread tree species in North America, but fire exclusion often promotes the succession to conifer dominated forests. Aspen in the Western US have been found to store more SOC in the mineral soil than nearby conifers, but we do not yet fully understand the source of this differential SOC accumulation. We measured total SOC storage (0–50 cm), characterized stable and labile SOC pools, and quantified above- and belowground litter inputs and dissolved organic carbon (DOC) fluxes during snowmelt in plots located in N and S Utah, to elucidate the role of foliage vs. root detritus in SOC storage and stabilization in both ecosystems. While leaf litterfall was twice as high under aspen as under conifers, input of litter-derived DOC with snowmelt water was consistently higher under conifers. Fine root (<2 mm) biomass, estimated root detritus input, and root-derived DOC fluxes were also higher under conifers. A strong positive relationship between root and light fraction C content suggests that root detritus mostly fueled the labile fraction of SOC. Overall, neither differences in above- and belowground detritus C inputs nor in detritus-derived DOC fluxes could explain the higher and more stable SOC pools under aspen. We hypothesize that root–microbe–soil interactions in the rhizosphere are more likely to drive these SOC pool differences.
1. Introduction
With an increasing emphasis in forestry practices on ecosystem services other than wood, including climate change mitigation, there is a need to better understand tree species effects on soil organic carbon (SOC) sequestration. As forest soils store as much, if not more, carbon than aboveground biomass [1], information about tree species effects on SOC storage is as crucial as understanding C sequestration in biomass. This becomes especially important given climate change and management-induced changes on the distribution of tree species [2].
Vegetation is the primary source of SOC through above- and belowground litter inputs. In forests, aboveground litterfall consists mainly of leaves or coniferous needles [3,4] while belowground carbon (C) primarily originates from fine root turnover associated with trees [5,6]. Tree species-specific effects on SOC stocks have been documented in temperate and boreal forests (as reviewed by Vesterdal et al. [7]) showing clear species effects on the forest floor, but only limited support for species-specific effects on mineral SOC. In the Intermountain West, quaking aspen (Populus tremuloides Michx.), the most widespread hardwood species on the North American continent, grow on soils significantly higher in mineral SOC stocks compared to neighboring conifer stands, despite higher forest floor SOC pools in the latter’s systems [8]. This pattern occurs across different conifer species—subalpine fir (Abies lasiocarpa (Hook.) Nutt.), Douglas fir (Pseudotsuga menziesii Mirb.), and Engelmann spruce (Picea engelmanii Parry ex Engelm.). The spatial proximity of aspen and conifer stands further suggests that this difference is mainly due to the effect of vegetation rather than climate or soil properties. However, mechanisms behind this vegetation impact are not yet fully understood. In light of aspen decline observed in many areas of the western USA [9,10,11], often accompanied by conifer encroachment, elucidating the mechanisms and pathways of SOC storage and stabilization is crucial for future carbon balance predictions and modeling efforts.
To understand how the shift in vegetation from aspen to conifer stands will affect SOC stocks, we first must identify and quantify the C input and output processes that control these SOC stock differences in aspen and conifer stands. The objective of this study is, therefore, to quantify and compare the role of foliage and root detritus in SOC storage and stabilization under aspen and conifer forest soils typical of the Intermountain West, USA. We specifically aim to assess (i) whether SOC storage and stability patterns under both overstories are consistent across a wider geographical range; (ii) how SOC properties and stocks differ with depth; and (iii) what the relative role of foliage and root detritus input is in terms of SOC stabilization under both overstories.
To address these questions, we determined belowground SOC distribution and fluxes under aspen and conifer stands at multiple sites in northern and southern Utah. As previous studies had shown aspen–conifer SOC differences at three locations in northern Utah [8,12], we added four sites at Cedar Mountain (CM) in southern Utah to test whether these initial patterns were consistent across a wider geographical range. We assessed the quantity and quality of SOC and measured fine root mass at all sites sampled. For logistical reasons, we were able to measure major C fluxes only in northern Utah, which constituted our intensively studied core study site, with CM as complementary sites.
2. Materials and Methods
2.1. Site Description
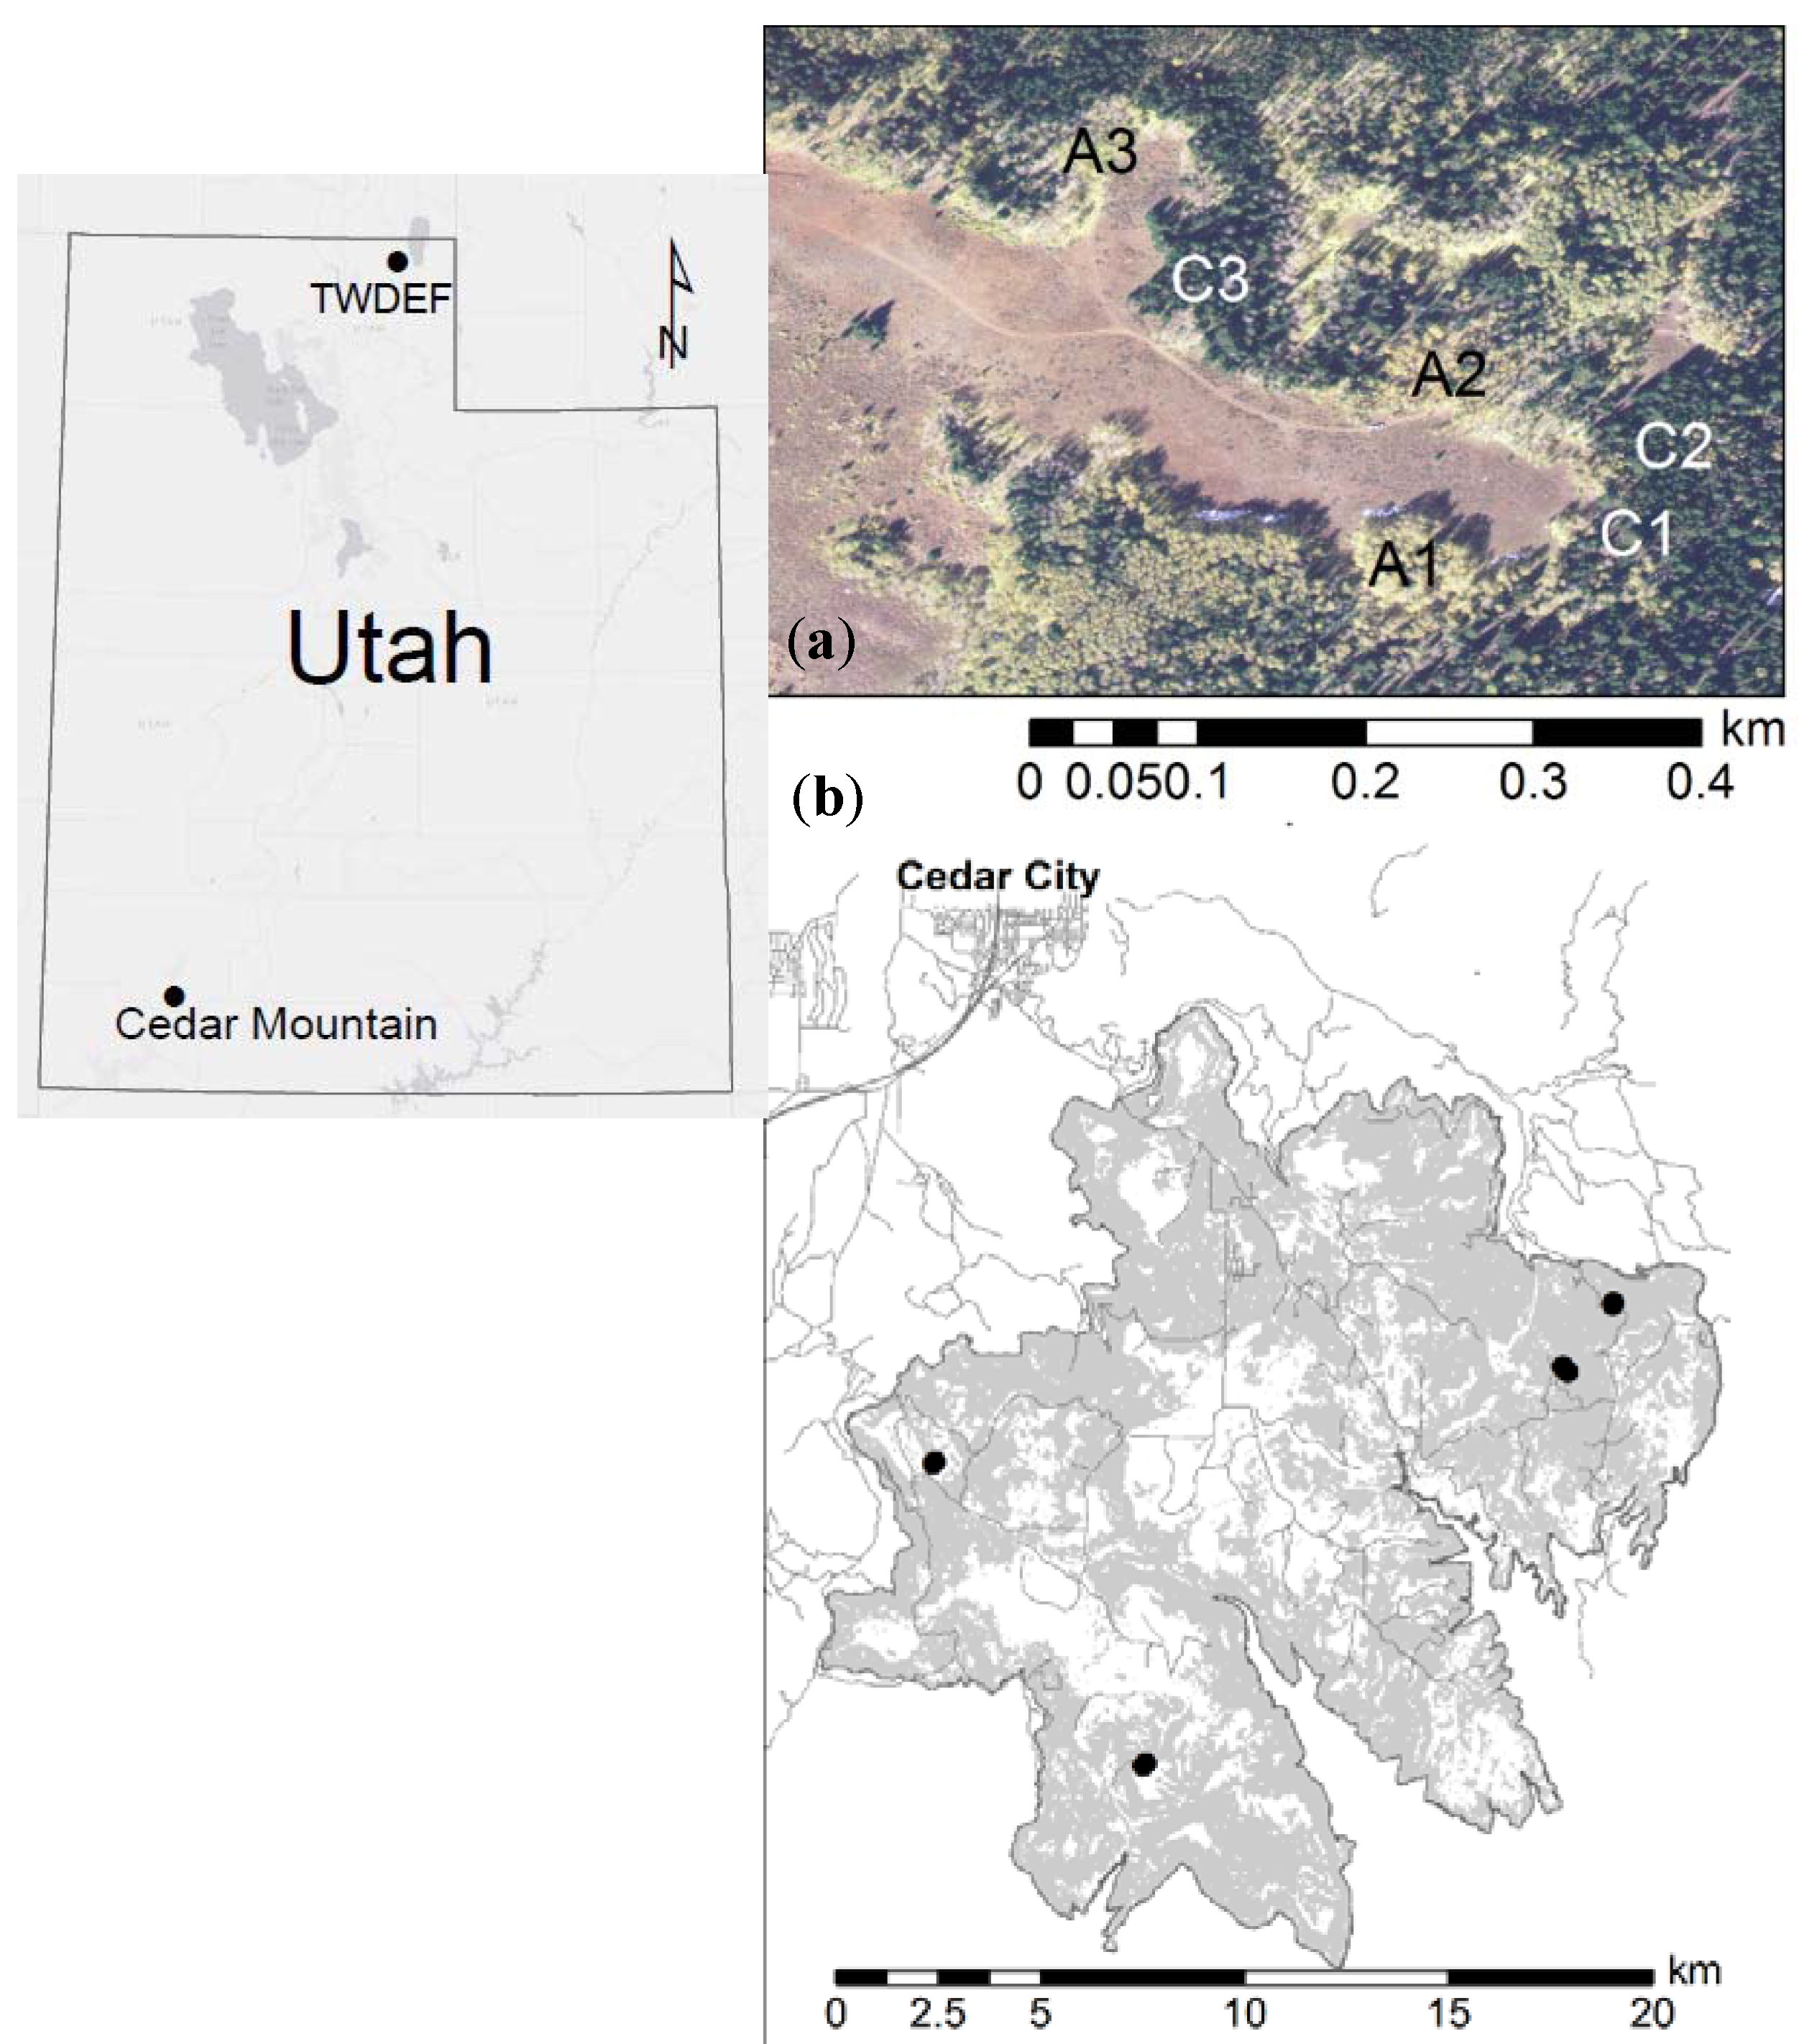
The sampling for this study was conducted at the T.W. Daniels Experimental Forest (TWDEF) located approximately 30 km northeast of Logan in northern Utah, and at CM in SW-Utah (Figure 1, Table 1).
TWDEF is a Utah State University research forest located on USA Forest Service land at 2600 m elevation. Climate data from the past eight years at the Daniel SNOTEL site [13] indicate an average low temperature around −7.1 °C in December, and an average high temperature of 15.8 °C in July. Mean annual precipitation is 1031 mm with about 70% accumulating as snow. Snowmelt typically occurs from mid-April or early May to mid-or late-June. Monthly rainfall is low between May and October, with lowest monthly precipitation (<50 mm) typically occurring in July. Forested communities include aspen and conifer stands, predominantly subalpine fir and Engelmann spruce stands. These secondary forests have been dated to be around 100 to 200 years old [14]. The aspen and conifer stands are in close proximity to each other (Figure 1), and characterized by similar elevation, aspect, climate, geomorphology, and geology. The soils in the study area are carbonate-free and generally well drained, formed in eolian deposits overlying residuum and colluvium from the Wasatch formation (tertiary: middle and lower Eocene) dominated by roughly stratified, poorly sorted conglomerate a few hundred meters thick [15]. Soils have been classified as Mollisols under aspen stands and as Alfisols under conifer stands [16]. Summer grazing by cattle and sheep has occurred since the late 1800s [17], but was greatly reduced coincident with fire suppression since 1910 [14]. The research sites are located in a fenced area to exclude cattle. The area was fenced off in 2005 to protect the equipment from livestock damage. The site is well instrumented and studied, and our study capitalized on additional data on snow cover, water dynamics, soil respiration, soil temperature and moisture from prior and ongoing studies at the site.
Cedar Mountain is located southeast of Cedar City on a high-elevation plateau (1800–3200 m) that falls within the greater Colorado Plateau region. It encompasses approximately 275 km2 of the Kolob Terrace formation of the Markagunt Plateau. Precipitation averages 823 mm annually, and monthly temperature means range from −3.8 °C in December to 15.3 °C in July [18]. Snowfall delivered primarily by Pacific-origin westerlies comprises most of the precipitation, occurring during the months of October through April. Additionally, the study area receives monsoonal rainfall during the summer months (mid-July through September) [19]. Soil types vary generally from Mollisols to Alfisols [20]. Major forest vegetation types in the study site consist of a mosaic of aspen, aspen–conifer mixtures, and conifer forests. The CM conifer plots in this study were dominated by Douglas fir, white fir (Abies concolor (Gord.) Lind. ex Hild.), and subalpine fir. Higher elevation sites across the Markagunt were historically dominated by Engelmann spruce [21], but now include large areas of aspen-dominated forest. The study sites ranged from 2680 to 2986 m in elevation. Past research suggests that Cedar Mountain has been subjected to long-term grazing, primarily from domestic sheep, which has altered herbaceous understory communities [22]. The sampling plots (aspen and conifer pairs) at CM were a subset of plots sampled in a previous study [12]. It was not possible to install instruments or measure SOC fluxes at CM due to access limitations and land-use issues (e.g., unplowed roads and actively grazed private property).
2.2. Field Sampling
Soil and vegetation samples were collected in six adjacent aspen- and conifer-dominated stands at TWDEF and four plot pairs (eight plots in total) at CM in late summer and early fall of 2013 and 2014. In 10-m circular plots, status (dead or alive) and diameter at breast height (DBH) (i.e., stem diameter at 1.30 m in height) of all trees >4 cm diameter were recorded, from which we calculated live basal area (LBA) by species (m2·ha−1). Stands were designated as either conifer- or aspen-based on a threshold of >75% LBA of the overstory. In addition, we calculated live stem density (n·ha−1). At TWDEF, understory was cut in one subplot (1 × 1 m) per plot, dried at 50 °C, weighed, ground, and analyzed for total C with a Skalar PrimacsSLC Analyzer (Skalar, Inc., Breda, The Netherlands) to estimate understory aboveground C input.
Soils were sampled within the same 10-m circular plots by excavating three pits per plot to a depth of 50 cm and removing subsamples at 10 cm increments. Soils were put in plastic bags and stored in coolers until transported to the laboratory where they were stored at 5 °C until further analysis. In addition, three soil cores per plot were taken using a split corer from 0–15, 15–30, and 30–45 cm in depths, and the middle 5 cm part of the core was excised to calculate bulk density (BD). Forest floor C content in the aspen and conifer plots was determined by excavating three O horizon samples per plot within 15 × 15 cm-frames. The samples were stored in plastic bags during transport, dried at 50 °C in the laboratory, ground, and analyzed for total C as described above.
At all sampling sites we collected six root cores in each plot up to 50 or 60 cm depth in late summer and early fall of 2013 and 2014. At CM and one TWDEF plot, cores were taken with a 5 cm diameter split corer in 15 cm increments. At the other TWDEF plots, 15 root cores were taken with a hydraulic soil corer (Giddings Machine Company, Windsor, CO, USA) up to 50 cm depth. In addition, root–soil cores were collected when 30 rhizotron tubes were installed during summer 2013 and 2014. The hydraulic soil cores were split into 10 cm increments in the lab; the other samples were processed by depth increments collected and adjusted to 10 cm increments for further analysis.
2.3. Laboratory Analyses
Soil samples were sieved (2-mm mesh) and divided in two. One part of the sample was air-dried and the other one stored at 5 °C. Soil BD samples were dried at 105 °C, sieved (2 mm), and the coarse and fine fractions weighed. For three 35–40 cm BD samples that were missing, BD values were estimated using a correction factor based on values of the other plots.
Air-dried soils were used to extract three SOC pool fractions with different turnover times using a simplified size fractionation method described by Roman Dobarco and Van Miegroet [12]. In brief, 30 g of air-dried soil was shaken with glass beads for 18 h to break up aggregates. The mineral-associated organic matter in the clay and silt fraction (MoM) was separated by wet sieving through a 53-μm sieve, with the >53 μm fraction further divided into a light fraction (LF) and mineral-associated SOC in the >53 μm sand fraction (MA). The LF was separated using electrostatic attraction, following a modification of the method by Kaiser et al. [23]. All fractions and bulk soil were ground to <250 μm and analyzed for total organic carbon (TOC) and inorganic C (IC) with Skalar PrimacsSLC Analyzer (Skalar, Inc., Breda, The Netherlands). SOC pool sizes in bulk soil and fractions were calculated by multiplying C concentrations with fine soil mass, which, in turn, was calculated from bulk density (g·cm−3) and percentage of coarse (>2 mm) content.
In order to determine relative stability, we used two indices of bioavailability: (1) hot water extractable organic carbon (HWEOC) [24,25], and (2) cumulative CO2 evolution per gram SOC during a 10-month soil incubation as a proxy for decomposability. HWEOC was determined by mixing field-moist soils with ultrapure water in 50-mL centrifuge tubes (1:10 soil–water (w/w)), and heating the slurry in a hot water bath at 85 °C for one hour. The solution was filtered through Sterlitech GF/F filters (pore size 0.4 μm) and the supernatant analyzed for dissolved organic carbon (DOC) with a Phoenix 8000 Carbon Analyzer (Tekmar-Dohrmann, Mason, OH, USA). To measure decomposability field-moist soils from the top 20 cm of TWDEF aspen and conifer stands, adjusted to a moisture content of 30%, were incubated at 25 °C for 10 months. Three soil lab replicates of one composite sample per overstory type (composited from three plots) were added to 1 L glass jars with a lid designed to connect to a gas analyzer through a system of tubes and valves. CO2 evolution was measured at weekly intervals with an automated soil gas flux system (LI-8100, LI-COR, Inc., Lincoln, NE, USA) that was connected to incubation jars during the time of measurement. After the measurement, the jars were opened to bring the gas concentrations back to ambient levels.
The root–soil cores were washed using a hydropneumatic elutriator system [26] to remove soil. The material was dried at 50 °C, weighed, and recognizable roots of <2 mm were separated from the organic material. This size was chosen based on suggestions in literature that roots of less than 2-mm diameter are contributing the most to root C turnover in soils [27]. The weight of the fine roots was recorded, and a subset was ground for TOC analysis as described above, and for N analysis with a Europa 20/20 SL isotope ratio mass spectrometer (Sercon, Cheshire, UK).
Soil texture was determined by particle size analysis with the hydrometer method at Utah State University’s Analytical Lab. pH was measured by mixing 10 mL soil with 10 mL ultrapure water using the ATI Orion 950 Ross FASTQC Titrator. Soils from the top and bottom 10 cm sampled from each pit were extracted with sodium pyrophosphate (NaPP), acid ammonium oxalate (AAO), and citrate-dithionite (CD) to estimate organically-bound, amorphous and crystalline Fe and Al. The extracts were analyzed with an Atomic Absorption Spectrometer (Varian AA240 flame atomization). Organically bound Fe and Al were calculated by subtracting NaPP values from AAO values.
2.4. Carbon Fluxes
2.4.1. Aboveground C Input
Five litter traps with an area of 794 cm2 were installed one meter above the soil surface in each plot at TWDEF for fine litter-fall sampling in the snow-free season (June till October of 2014 and 2015). At the end of October (2014 and 2015), ground litter traps were installed to capture litterfall during snow cover presence. The litter from these litter traps was collected after the snow had melted in early June. All litter was dried at 50 °C, the dry weight recorded, and ground to 250-μm diameter before analysis of TOC and total nitrogen. Branches were excluded for C flux calculations.
2.4.2. Soil Solution Fluxes
Silicon carbide suction cup (SIC 20, Decagon Devices, Inc, Pullman, WA, USA) soil pore water samplers (SPW) were installed at 5 and 45 cm depth in three aspen and three conifer plots at TWDEF. Water was sampled by applying negative pressure of 50 kPa to 1 L glass sampling bottles wrapped in ductape and stored in Styrofoam coolers to reduce light penetration. In 2014, samples were collected twice a week during the snowmelt period (April–June) until no water could be collected (~July 8) to capture seasonal variability. As no fluctuations of DOC concentrations were detected in 2014, sampling frequency was reduced to once a week during the snowmelt period of 2015, and early weeks of snowmelt in 2016. On sampling days, water was transferred to amber vials, transported to the laboratory where samples were filtered through a 1-μm glassfiber filter, and DOC was measured with Phoenix 8000 Carbon Analyzer (Tekmar-Dohrmann, Mason, OH, USA). Absorbance at 254 nm was measured with a Genesys 10 UV-Vis spectrophotometer (Thermo Scientific, Madison, WI, USA) to calculate Specific Ultraviolet Absorbance (SUVA = abs at 254 nm·cm−1 × 100/DOC mg·L−1; units = L·mg−1 C·m−1) as a proxy for DOC aromaticity [28], hydrophobicity [29], and microbial stability [30].
As the area of collection for SPW samplers is not known, we calculated DOC fluxes in the soil based on snow water equivalent (SWE) data recorded annually in an open meadow at the Daniel SNOTEL site (NRCS—TWDEF, accessed October 2016). In 2016, we independently collected SWE data from aspen and conifer plots at TWDEF by digging two pits per plot, and collecting two snow cores per pit. This enabled us to calculate SWE under aspen and conifers in 2014 and 2015 from the open meadow SNOTEL site data for those years. We used the three-year-average SWE values—595 mm for aspen and 446 mm for conifers—for calculating the DOC input via throughfall, by multiplying the DOC concentration measured in snow with the water volume.
In the soil DOC flux calculations, water flux at 5 cm soil depth was assumed to be equal to SWE. The water volume at 45 cm depth was adjusted based on the ratio between average water volumes collected at 5 and 45 cm depths during the three sampling years—0.75 for aspen and 0.57 for conifers. Average annual DOC flux was calculated using weighted averages of DOC concentrations and SWE-based water volumes. Dissolved total nitrogen, NO3, and NH4 were measured in samples from three sampling times in 2015 and from two sampling times in 2016. Samples were analyzed with AQ2 Discrete Analyzer (Seal Analytical, Mequon, WI, USA) at USU’s Water Research Laboratory.
2.4.3. Belowground C Input
Root detritus C input was estimated indirectly from soil respiration and aboveground litterfall as described by Raich and Nadelhoffer [31]. We used previously published soil summer respiration data at TWDEF [32] to calculate annual soil respiration. Non-summer respiration rates were estimated based on summer rates and average soil temperatures using the equation by Zak et al. [33]:
where k1 is the calculated mean winter respiration rate, k2 the average measured summer respiration rate, t1 the average winter soil temperature, t2 the average summer soil temperature, and Q10 = 2. Soil temperature had been measured at 30-min intervals at the sites in three aspen and three conifer plots, all but one conifer corresponding to our measurement plots. The data were collected with temperature-soil moisture sensors (Acclima TDT, Meridian, ID, USA) as part of an ongoing study at TWDEF (S. Jones, unpublished data). In our calculations, the year was split into three periods; Summer: 1 June–30 September; Winter: 1 November–30 April for aspen, and 1 November–31 May for conifers based on snowpack presence; with a transition in October and May for aspen and October for conifers, based on soil temperatures transitioning between subnivean winter soil temperatures and high summer soil temperatures. For each period, the average daily respiration rate was multiplied by the number of days, and the annual CO2 emission from the soil (Rs) was calculated as the sum of these seasonal values.
k1 = k2 e(t1−t2)/10 ln Q10
We used annual soil respiration data and aboveground litterfall data to calculate root turnover based on the relationship described by Raich and Nadelhoffer [31], and the assumption that heterotrophic and autotrophic (root) respiration each accounted for 50% of total respiration [34,35]:
where Pb = belowground detritus production, Rh = heterotrophic respiration, Pa = aboveground detritus production, Rs = soil respiration, and Rr = root respiration.
Pb = Rh − Pa = Rs − Rr − Pa = 0.5 × (Rs − Pa)
In addition, we installed 30 minirhizotron tubes at TWDEF (15 in aspen, and 15 in conifer stands up to 40 cm depth) in summer 2013 and 2014. The tubes were installed at a 45° angle up to 40 cm vertical depth. Images were collected every 1.3 cm down the minirhizotron tube once a month from June till October, 2015, with a minirhizotron camera (Bartz Technology Corporation, Carpinteria, CA, USA). The length, diameter, and status (dead or alive based on appearance) of each root was recorded using the software Rootfly (Version 2.0.2, Clemson University). In images collected in June, roots were marked dead if the color of a root was black. Later roots were marked dead if the color changed with time to dark brown or black, or the root disappeared. The length of fine roots was summed for each 10-cm soil depth for each minirhizotron, and the average fine root length was calculated for each plot. We calculated root length on an area basis by dividing observed root lengths by the product of minirhizotron frame area and depth-of-field of 2 mm, which then was multiplied by the depth of the soil profile sampled [36]. Minirhizotron data were converted from length (m·m−2) to total root dry matter (g·m−2) using conversion factors: 51.0 m·g−1 for aspen, and 15.0 m·g−1 for conifers [37], and root detritus input was calculated from the ratio of dead root mass at the end of the growing season to total root mass.
As part of a separate laboratory experiment, we ground aspen and conifer roots, saturated the biomass with ultrapure water, exposed them to freeze-thaw cycles and leached them to obtain source-specific DOC (unpublished data). We used the respective DOC concentrations and root masses to estimate root-derived DOC input in the field.
2.5. Statistical Analysis
Data analysis was conducted using the software R [38]. Statistical comparisons for total SOC stocks (O-horizon plus mineral soil), mineral SOC stocks, C stocks in SOC fractions, average HWEOC values, and root C pools were done for the whole soil profile sampled (sum of all depths). Differences between both overstory types for these dependent variables were compared using a paired t-test. Sites were the unit of replication (n = 5) with four sites at CM, and the average of three plots constituting one site at TWDEF. This was done due to the close proximity of all plots at TWDEF, and the concern about pseudoreplication (Figure 1). No data transformations were performed. Due to the small sample size, we computed a post-hoc power analysis using the package pwr [39] (α = 0.05, π = 0.8) to evaluate whether a p-value > α = 0.05 was due to inefficient sample size. DOC fluxes were analyzed with repeated measures ANOVA with overstory type and depth used as the independent variables, and variation by year as the error term. Relationships among root and SOC variables were assessed using linear mixed effects (LME) models with the package lme4 [40], with depth being considered as the random variable. To estimate model fit, we calculated marginal and conditional R2 [41] with the package piecewiseSEM [42]. Average values are reported as mean ± standard deviation, unless stated otherwise. Outcomes of statistical analyses are reported by stating the p-value, and t-statistic from the paired t-test, Cohen’s d effects size (ES), 95% confidence interval (CI), and suggested sample size (SN) from the power analysis (if p > α). Cohen’s d was evaluated based on the categories defined by Cohen [43] with 0.2 being small, 0.5 medium, and 0.8 being large. In other words, an effect size of 0.8 can also be interpreted as 47% non-overlap between two distributions. All figures were plotted with the package ggplot2 [44]. All maps were created with ArcGIS 10.2 (ESRI, Redlands, CA, USA).
3. Results
3.1. SOC Distribution under Aspen and Conifer Forest Stands
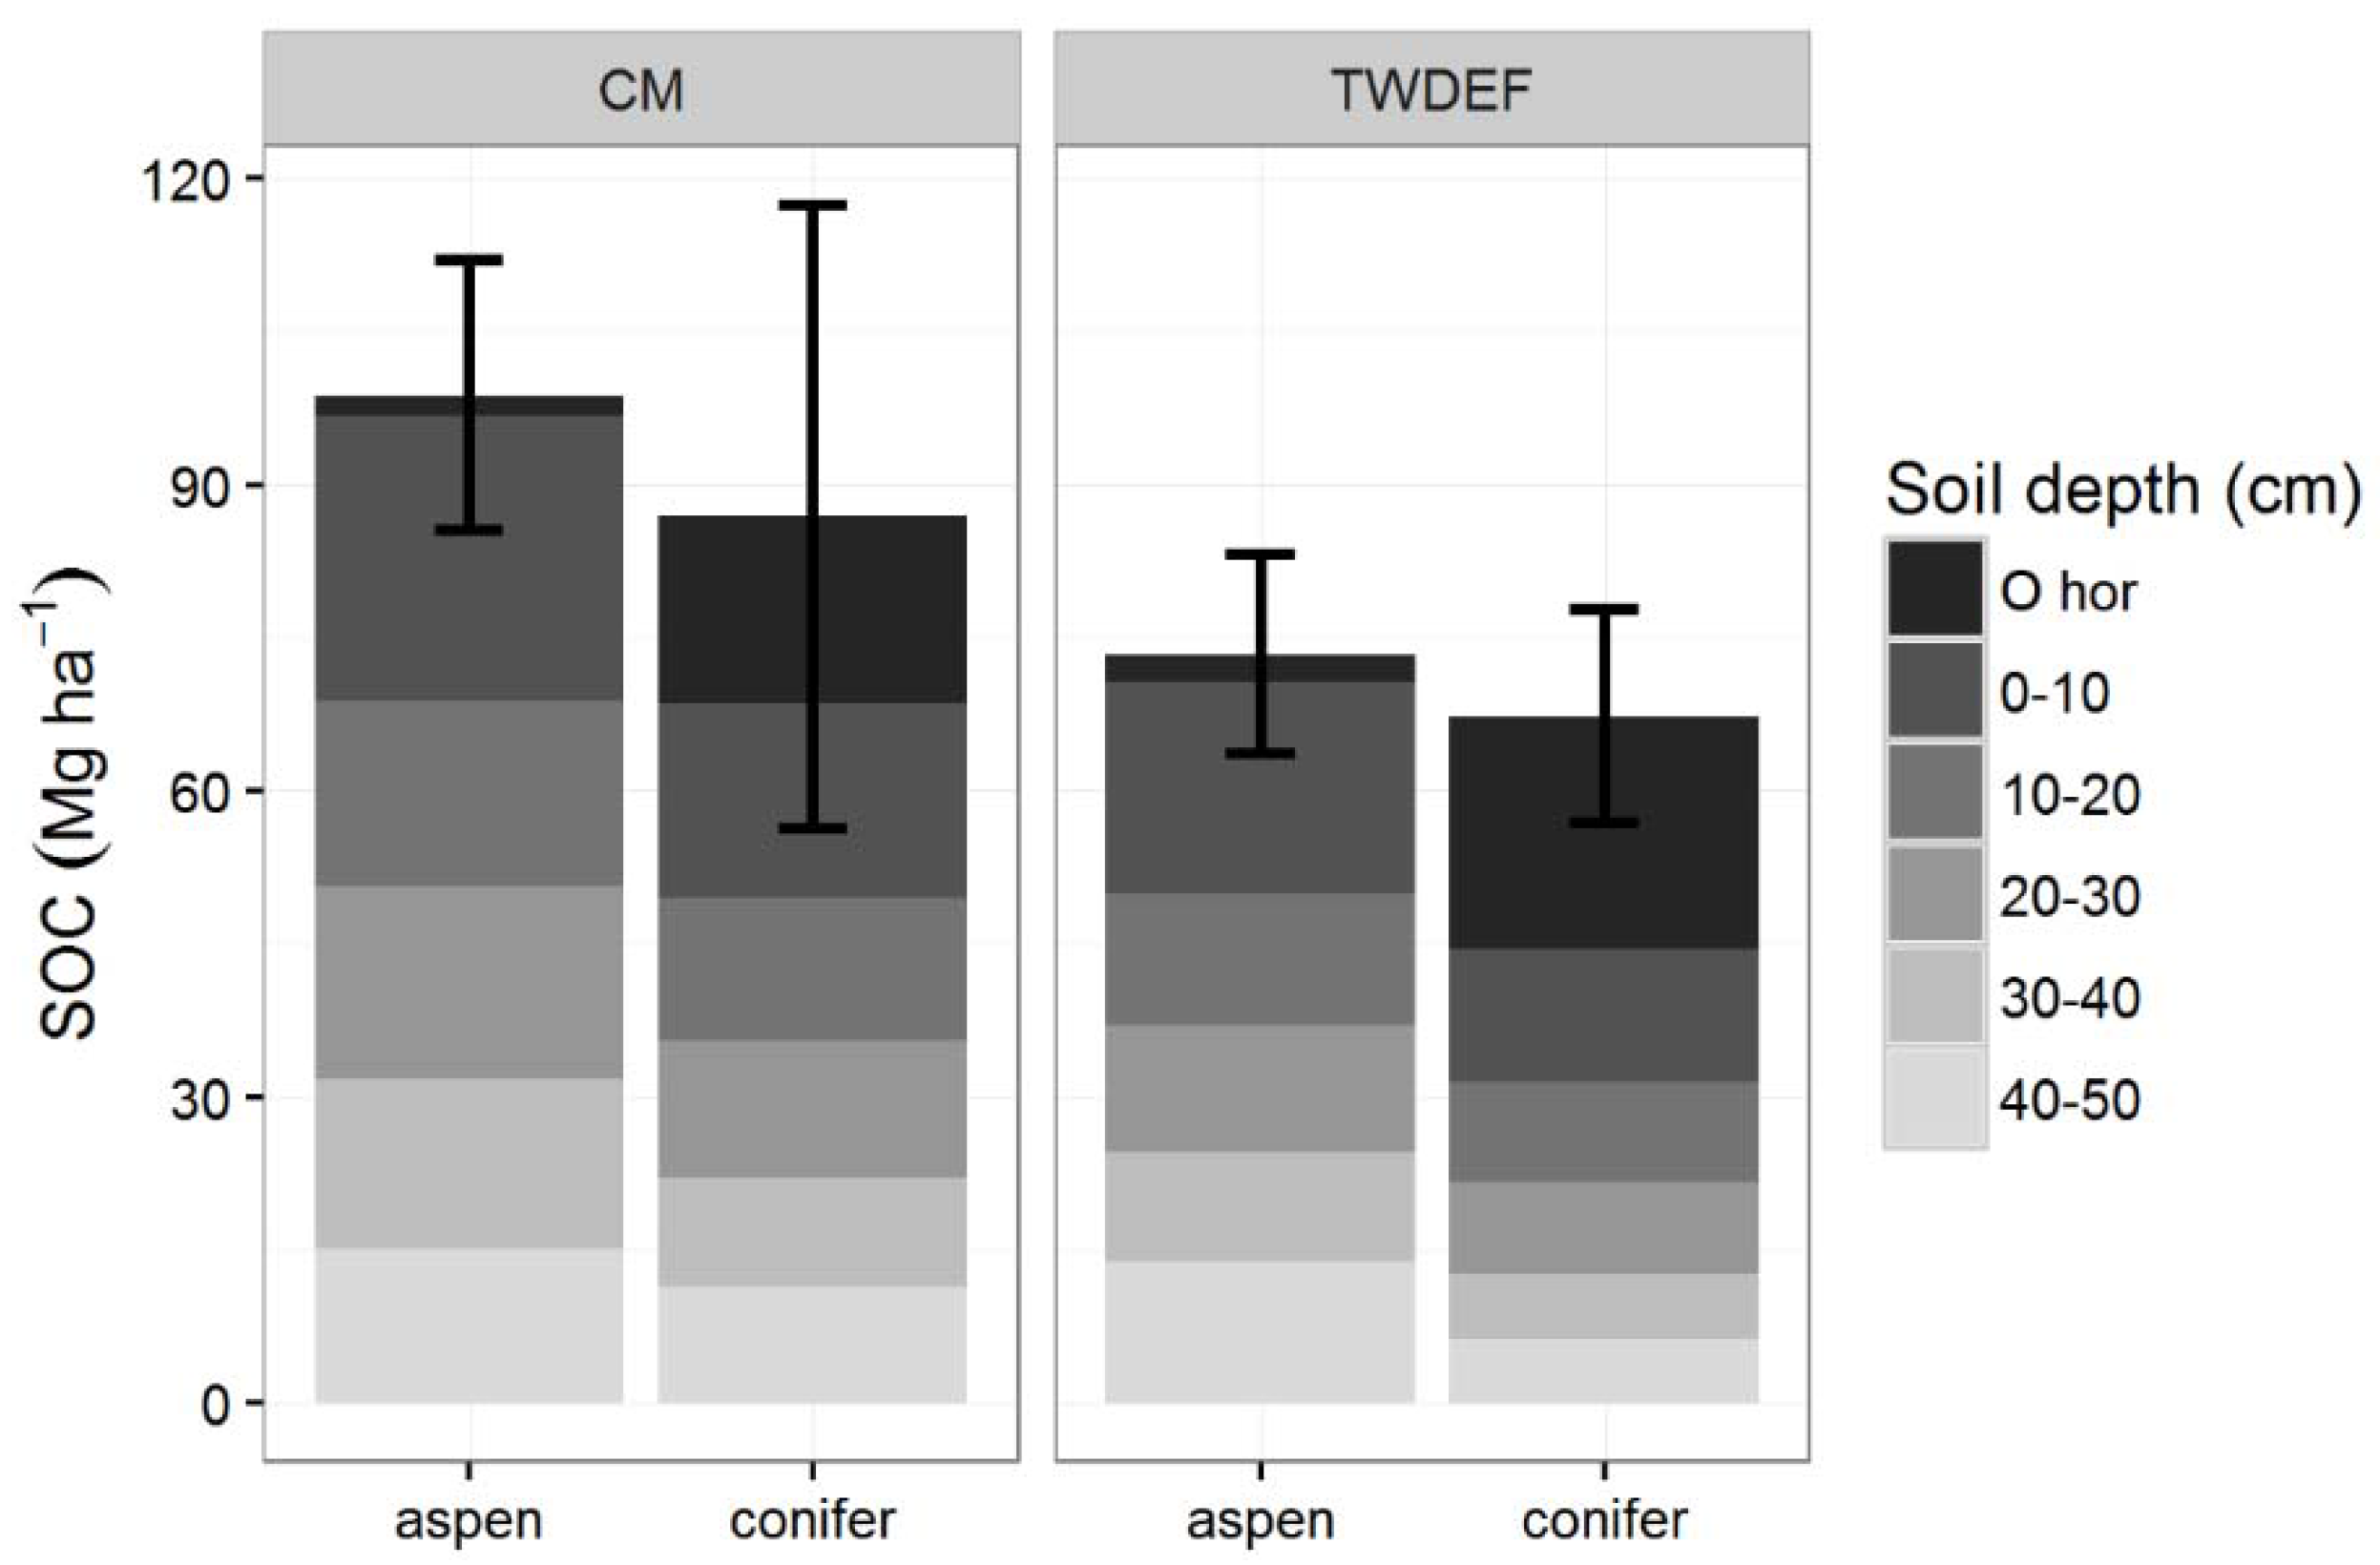
Total SOC stocks (O-horizon + mineral soil up to 50 cm) under aspen were slightly higher than SOC stocks under conifers: 93.7 ± 16.11 Mg·ha−1 under aspen vs. 82.9 ± 27.9 Mg·ha−1 under conifers (p = 0.51, t = 0.72; ES = 0.32, CI = (1.15, 1.79), SN > 78). Mineral SOC stocks were consistently higher under aspen (Figure 2) at each site, and were on average 91.55 ± 16.3 Mg·ha−1 under aspen vs. 61.25 ± 22.4 Mg·ha−1 under conifer stands (p = 0.08, t = 2.31; ES = 1.03, CI = (0.52, 2.58), SN > 9). (The difference between plots sampled at CM and TWDEF ranged from 7.4 to 81. 5 Mg·ha−1, and was on average 30.3 Mg·ha−1.
At all sites, SOC consisted mainly of the more stable MoM fraction (68%–87%) (Figure 3). At TWDEF, aspen had a slightly higher SOC proportion in the MoM fraction (72% of mineral SOC) compared to conifers (68%), while conifers had more C in the LF fraction (23%) compared to aspen (11%). At CM, vegetation differences in SOC distribution among the different fractions were less pronounced with the LF fraction, constituting 16% of SOC pools under aspen and 19% under conifers. At TWDEF, MoM stocks (0–50 cm) were 50.9 ± 12.9 Mg C·ha−1 under aspen vs. 30.6 ± 5.3 Mg C·ha−1 under conifers; with corresponding values at CM of 78.8 ± 16.2 Mg C·ha−1 under aspen and 56.6 ± 19.7 Mg C·ha−1 under conifers (p = 0.15, t = 1.8; ES = 0.78, CI = (0.73, 2.29), SN > 15). At TWDEF, slightly higher LF C pools were found under conifer stands (11.0 ± 1.7 Mg C·ha−1) than aspen (9.3 ± 1.7 Mg C·ha−1), but at CM the opposite pattern was observed with aspen having higher LF C pools (17.2 ± 3.2 Mg C·ha−1) than conifers (14.7 ± 7.9 Mg C·ha−1), mostly in the topsoil (p = 0.53, t = 0.69, SE = 0.31, CI = (1.16, 1.78), SN > 83). The MA fraction constituted less than 10% of SOC stocks under both overstories, and ranged from 2 to 5 Mg C·ha−1 at the northern and southern sites (p = 1, t = 0.005, SE = 0.002, CI = (1.46, 1.46), SN > 10,000).
During the 10-month long lab incubation, aspen soils showed lower CO2 evolution (146.2 mg·g−1 soil C or 8.5% of total SOC), than conifer soils (231.4 mg·g−1 soil C or 18% of total SOC), indicating lower decomposability of aspen SOC. Results from hot water extractions showed a similar pattern of lability with conifer soils containing more water soluble (labile) SOC (21.6 ± 8.4 mg·g−1 soil C at TWDEF and 13.6 ± 4.6 mg·g−1 soil C at CM) than aspen soils (16.1 ± 8.2 mg·g−1 soil C at TWDEF and 11.2 ± 2.3 mg·g−1 soil C at CM) (p = 0.03, t = −3.29, SE = 1.47, CI = (0.17, 3.11)). The water-extractable C, however, constituted only about 1.6% of total SOC in aspen soils and 2.1% of total SOC in conifer soil at TWDEF, and respectively 1.2% and 1.4% at CM. Deeper soils from TWDEF conifer plots, and two conifer plots at CM contained higher labile C amounts in the 40–50 cm depth than in the topsoil. This was not observed for aspen soils where there was no difference in the depth distribution of HWEOC.
Based on the estimated age of forest stands at TWDEF, around 100 years [14], we calculated a net average annual SOC accumulation difference of 225 kg C·ha−1·year−1 between aspen and conifer mineral soil. The age of the stands at CM could be assumed to be around 100–150 years based on measurements by Mueggler [45]. Assuming an average stand age of 100 years, the estimated difference in net average annual SOC accumulation between aspen and conifers at CM ranged from 74 to 190 kg C·ha−1·year−1. At one site (CM20), the difference was even bigger, 815 kg C·ha−1·year−1, possibly due to differences in soil mineralogy, as at CM20 the soil at the aspen stand contained twice as much extractable Fe as the soil at the conifer stand (1400–1700 vs. 400–700 mg Fe·g−1 soil). Assuming a stand age of 150 years, the range of net average annual SOC accumulation difference between overstory types was 50–126 kg C·ha−1·year−1 for three of the four sampled sites (excluding CM20).
3.2. Relative Role of Foliage Inputs to SOC Storage
Aboveground litterfall in TWDEF aspen stands was 851 ± 207 kg C·ha−1 in 2014–2015 and 596 ± 143 kg C·ha−1 in 2015–2016, compared to respectively 520 ± 102 kg C·ha−1 and 430 ± 62 kg C·ha−1 under conifers. Aboveground C input via litterfall was on average 250 kg C·ha−1 higher under aspen, and this difference increased to 429 kg C·ha−1 when understory aboveground C was added (197 ± 18 kg C·ha−1 under aspen vs. 17 ± 7 kg C·ha−1 under conifers). The majority of aspen litterfall decomposed within 2 to 3 years based on the O-horizon stock values by Woldeselassie et al. [8] (1.7 ± 0.38 Mg C·ha−1) and this study (2.7 ± 0.87 Mg C·ha−1), respectively. The higher C content in the conifer O-horizon (22.8 Mg C·ha−1) as well as the average aboveground litterfall of 492 kg·ha−1 (including understory) indicated a mean residence time (MRT) of 46 years for the conifer O-horizon C pool.
As litterfall needs to be incorporated into soil to become part of mineral SOC, the next step is to assess how, and to what extent, the differences in litter input and turnover are expressed in DOC fluxes into the soil. The majority of the annual precipitation at TWDEF is in the form of snow, therefore, the majority of the soil water flow occurs during snowmelt. The DOC in the snowpack constituted 2%–10% of the DOC fluxes during snowmelt at 5 cm depth under aspen (3.3 kg C·ha−1), and 3%–7% under conifers (7.6 kg C·ha−1). Soil solution DOC concentrations at 5 cm depth under aspen (average range 7.3–23.8 mg·L−1 from 2014–2016) were mostly lower than DOC concentrations under conifers (average range 28.4–45.5 mg·L−1), and generally decreased at 45 cm depth for both overstories (average range 8.1–10.1 mg·L−1 for aspen, and 25–37.7 mg·L−1 for conifers). Litter-derived DOC fluxes transported into 5 cm soil depth with snowmelt water ranged from 50 to 145 kg·ha−1 under aspen, representing only 7% to 20% of annual litterfall C. The litter-derived DOC fluxes under conifers ranged from 130 to 177 kg C·ha−1, constituting 27%–37% of conifer litterfall C (Table 2).
As water percolated through the soil during snowmelt, DOC flux declined (Table 2), and on average 44.7 kg C·ha−1 of DOC was retained (or decomposed) between 5 and 45 cm in aspen soils, compared to 77.1 kg C·ha−1 in conifer soils, about 42% higher. The variability in net DOC retention was much higher under aspen (7.1 to 98.8 kg C·ha−1), than under conifers (72.9 to 95.5 kg C·ha−1).
Despite the higher aboveground litterfall, the smaller DOC input fluxes and lower net DOC retention in aspen soils make it unlikely that aboveground litter is the main factor causing the differences in SOC pools between aspen and conifer stands. This, in turn, suggests that differences in root detritus production might be a more important factor.
3.3. Relative Role of Root Inputs to SOC Storage
Fine root (<2-mm diameter) C stocks were higher in conifer soils (4060 ± 960 kg C·ha−1 at TWDEF and 5370 ± 610 kg C·ha−1 at CM) compared to aspen soils (1940 ± 420 kg C·ha−1 at TWDEF and 3520 ± 540 kg C·ha−1 at CM; p = 0.005, t = −5.65, SE = 2.52, CI = (0.57, 4.47)). Root biomass was the highest at the top 10 cm under both overstories at all sites, and decreased with soil depth (Figure 4). We found a strong relationship between root mass and LF (p < 0.001), with root distribution explaining 26% (marginal R2, conditional R2 = 0.42) of the variability of the light fraction distribution in 10–50 cm depths. The top 10 cm were excluded from the analysis as this depth experiences direct litterfall inputs that add to the LF fraction of SOC, and, therefore, does not have a strong relationship with root mass.
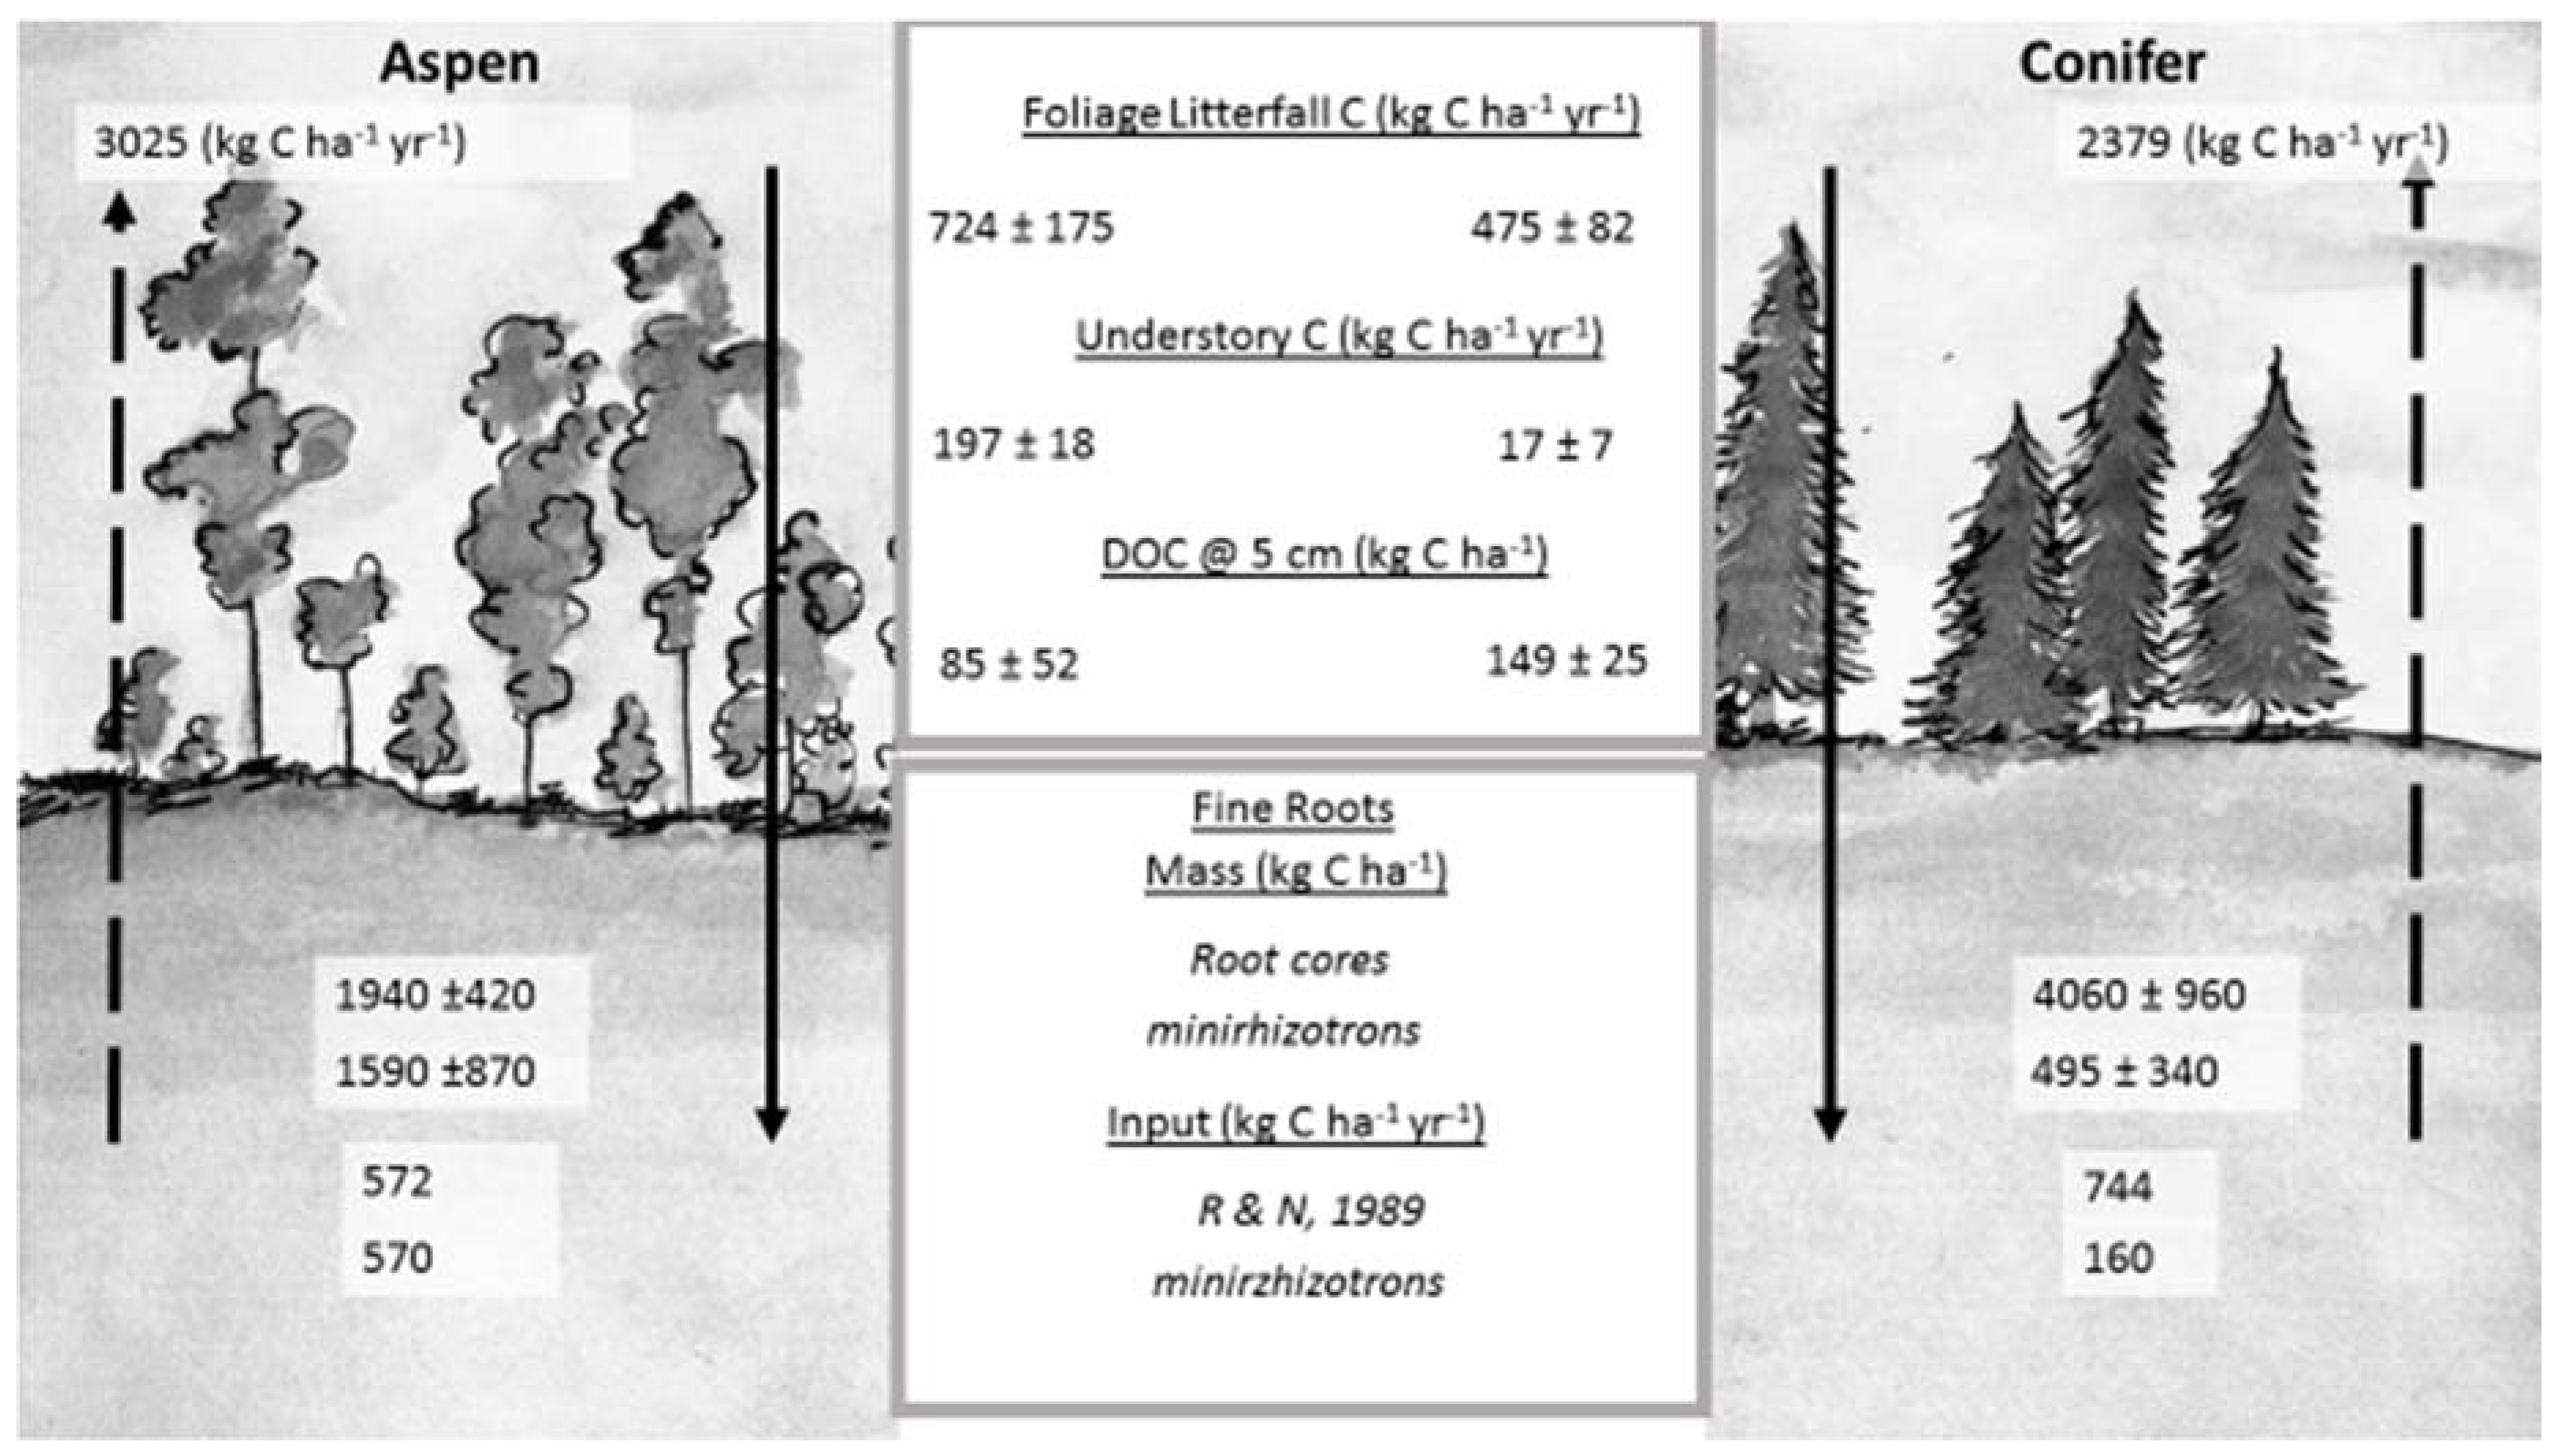
Based on the average ecosystem-specific annual soil respiration rates (3025 kg C·ha−1·year−1 under aspen and 2379 kg C·ha−1·year−1 under conifers) and aboveground litterfall values (723.5 ± 175 kg C·ha−1·year−1 under aspen and 475 ± 82 kg C·ha−1·year−1 under conifers), we calculated annual belowground detritus (root) input as 572 kg C·ha−1·year−1 for aspen and 744 kg C·ha−1·year−1 for conifers at TWDEF. Compared with the fine root mass data from root cores, this represented 29% of total fine root biomass for aspen and 18% for conifers, suggesting a three- to four-year MRT of aspen fine roots, and a five- to six-year MRT of conifer fine roots.
Minirhizotron image analysis revealed seven times more roots under aspen than conifers (696 under aspen, and 109 under conifers from 15 minirhizotron tubes), and total calculated root mass under aspen was 1592 kg C·ha−1·year−1 for aspen and 494 kg C·ha−1·year−1 for conifers. At the end of the growing season, 32% of live aspen roots had died vs. 36% under conifers, which corresponded to about 573 kg C·ha−1·year−1 in aspen root detritus input, while there was only 158 kg C·ha−1·year−1 in conifer root detritus. When root mortality rates from minirhizotron observations were applied to root mass values from root cores, annual root detritus input for aspen was 620 kg C·ha−1·year−1 vs. 1462 kg C·ha−1·year−1 for conifers at TWDEF, and 1120 kg C·ha−1·year−1 for aspen vs. 1933 kg C·ha−1·year−1 for conifers at CM.
Our previous estimates of net DOC retention between 5 and 45 cm (45 kg C·ha−1 of DOC in aspen and 77 kg C·ha−1 in conifer soils) did not consider DOC leaching from roots. Based on the laboratory leaching experiment (unpublished data), we calculated the potential amount of root DOC contributions by combining the DOC concentrations from leachates with the root mass from root cores. We estimated that aspen root detritus could have contributed as much as 39 kg C·ha−1, and conifer roots as much as 77 kg C·ha−1 to the DOC flux in the soil. Adding this root-derived DOC flux would increase net DOC retention/decomposition under aspen to 84 kg C·ha−1 and 154 kg C·ha−1 in the conifer soil.
DOC concentration and chemistry (e.g., degree of hydrophobicity, C/N ratio) are important factors affecting C sorption to mineral surfaces [46,47]. The snowpack DOC in our study had a low aromaticity (SUVA was on average 2.2 L·mg C−1·m−1 under aspen, and 1.5 L·mg C−1·m−1 under conifers). The SUVA values generally increased as water infiltrated from the forest floor into the mineral soil (SUVA = 3.1 ± 0.89 L·mg C−1·m−1 under aspen, and 3.2 ± 0.19 L·mg C−1·m−1 under conifers at 5 cm depth), and then decreased with depth (to 2.8 L·mg C−1·m−1 at 45 cm under aspen, and to 2.6 L·mg C−1·m−1 under conifers), as did C/N ratios (from a range of 22–48 at 5 cm to 18–37 at 45 cm under aspen, and from 44–61 at 5 cm to 22–55 at 45 cm under conifers). Overall, and based on the measured characteristics, DOC quality did not differ much between aspen and conifer. An additional factor affecting sorption–desorption processes in soil is pH [46]. The pH of the solutions sampled was similar under both overstories, and ranged from 6.4 to 6.9 for conifers and 6.9 to 7.1 for aspen, and was similar during all three sampling years.
At TWDEF, conifer stands were characterized by larger DOC input fluxes from both aboveground and belowground sources, larger DOC leaching losses below 45 cm and overall greater DOC retention/degradation compared to aspen. This pattern (greater retention under conifers), however, is opposite to the actual SOC and MoM accumulation pattern observed, and is thus unable to explain higher SOC storage in aspen soils.
4. Discussion
4.1. SOC Pools, and Biotic and Abiotic Controls on SOC and MoM
By expanding the geographical range of aspen and conifer comparisons in Utah through the addition of the CM sites, we saw big differences between SOC pools at TWDEF and CM. The high values observed in CM aspen (from 81 to 112 Mg C·ha−1) are not unique as Woldeselassie et al. [8] reported similar values at Bear and Frost canyons in northern Utah. Woldeselassie [48] further found that even under the same aspen cover, SOC pools could differ highly at fine spatial scales, mostly driven by abiotic factors such as microclimate and soil moisture.
The SOC stocks found in the mineral soils at TWDEF are comparable to values found in other areas in North America [49,50,51,52]. However, aspen do not always have higher SOC stocks than conifers [53]. Laganiére et al. [52] found higher mineral SOC pools under aspen in Ontario, but not in Quebec. In none of these reported sites were the differences statistically significant, but the authors argued that this might be due to a small sample size. Two studies in Minnesota found smaller or similar SOC stocks under aspen compared to adjacent conifers [49,50]. In comparing SOC stocks for the top 50 cm under black spruce, aspen, and jack pine at two sites in Canada, Gower et al. [51] reported black spruce SOC > aspen SOC > jack pine SOC. The results from this Canadian study must be considered with some caution as the soils in that comparison differed in water drainage.
The majority of SOC at TWDEF and CM was associated with the silt and clay fraction, i.e., consisted of MoM, with conifer soils having a slightly higher proportion of C in the LF fraction, and a slightly lower proportion of C in the silt and clay fraction compared to aspen soils. A vegetation difference in SOC distribution, favoring more stable MoM under aspen, has been shown in other studies in Utah [8,12], and Canada [54]. A higher association of C with silt and clay under aspen could partially help to explain why SOC in aspen soils was less decomposable during the 10-month incubation and less soluble (as indicated by lower hot water extractable DOC), both suggesting higher stability. Higher soil decomposability under conifers has been reported before by Olsen and Van Miegroet [32], Woldeselassie et al. [8], and Giardina et al. [55]. Also, Laganiére et al. [56] found a higher proportion of SOC distributed as LF in conifer soils, and higher CO2 evolution from these soils during incubation [52]. Overall, higher stability of aspen SOC seems to be a consistent finding in literature, as reviewed by Laganiére et al. [53]. The strong correlation between root and LF C suggests that the major source of LF in the deeper depths is root detritus.
Modest sample size potentially played a role in limiting statistical power when mineral SOC, and MoM SOC pools were compared under aspen and conifer stands. The calculated effect size for mineral SOC was 1.03, and for MoM SOC pools it was 0.78. According to the criteria defined by Cohen [43], both qualify as high. A post hoc power analysis revealed that on the basis of the mean, the effect size observed for the mineral SOC pool would require an n of approximately 9 to obtain statistical power at the recommended 0.80 level. For MoM SOC, the approximate n was 15. In fact, when we combined previously published SOC stock data for adjacent aspen and conifer forest stands in Utah [8] with our data, which increased the sample size to 11 pairs, we found that aspen SOC in the mineral soil was consistently higher than conifer SOC (p = 0.0013, t = 4.44; SE = 1.34, CI = (0.36, 2.32)). Therefore, we are confident that the observed values in our study, at least in the mineral SOC pool, were not due to chance.
In the study by Woldeselassie et al. [8], there is no information on the mineralogy of the soils at Bear and Frost canyons or other abiotic factors that could explain the reported high SOC values. In our study, soils at CM and at TWDEF differed in terms of Fe and Al oxide amounts. The highest SOC pools corresponded with the highest extractable Fe oxide contents (1000–1700 mg Fe·g−1 and 400–500 mg Al·g−1 soil corresponding with 4.7% and 6% of C and 250–350 mg Fe·g−1 and 100–200 mg Al·g−1 soil corresponding with 1%–2.5% of C, Figure 5), illustrating the potential role of mineralogy on SOC storage. The CM stands also have higher root biomass, and, therefore, potentially higher root C inputs contributing to belowground SOC storage. However, the observed positive correlation between root C and LF C suggests that root detritus fuels the less stable LF C pool rather than the more stable MoM pool.
4.2. Aboveground C Input
Forest floor is widely known to be more directly affected by tree species, with conifers having overall higher forest floor C stocks than broadleaved trees [56,57]. In our study, forest floor C stock differences were big enough to partially offset the higher SOC stocks in aspen mineral soils, making the total belowground SOC stocks similar between overstories. However, forest floor is more sensitive to disturbances [58,59], and in a fire prone region such as Utah, the O-horizon does not constitute a long-term C pool. The larger mineral SOC pools under aspen are comparatively less susceptible to fire disturbance, and thus are more likely to contribute to long-term belowground C sequestration.
The aspen litterfall measured in this study was similar to what has been reported by Bartos and Debyle [60] in northern Utah—1397 kg·ha−1 of leaves, which corresponds to about 630 kg C·ha−1. The results are also similar to what has been found in Canada by Gower et al. [61]—1672 kg organic matter·ha−1 (752 kg C) in their northern study site and 2170 kg organic matter·ha−1 (977 kg C) in the southern study site. Conifer litterfall reported by Gower et al. [61] was smaller to what we found in our study—860 kg organic matter·ha−1 under pine (387 kg C) and 785 kg organic matter·ha−1 (353 kg C) under spruce in the southern site, as well as 619 kg organic matter·ha−1 under pine (279 kg C) and 684 kg organic matter·ha−1 under spruce (309 kg C) in the northern site. The differences in litterfall are probably due to differences in growing conditions between the boreal forests of Canada, and the semi-arid mountain forests of Utah.
The potential pathways for aboveground C incorporation into mineral soil are by leaching of DOC and/or by biological and physical mixing. While soil fauna has not been specifically analyzed at TWDEF, past soil pedon analyses conducted at TWDEF [8,16] did not find any signs of megafauna activity. Furthermore, if faunal mixing was prominent, we would expect a more even distribution of the LF with soil depth. We also did not observe any earthworm activity in the sites, nor are we aware of a study from the Intermountain West that has documented such activity. Therefore, we can assume that soil fauna plays a minor role in plant detritus incorporation into deeper mineral soil at the studied sites, and most of the aboveground C is incorporated into mineral soil with snowmelt water.
Woldeselassie et al. [8] hypothesized that higher litterfall, and faster turnover of aspen foliage, coupled with freeze-thaw cycles, and slow decomposition under the snowpack could potentially lead to higher DOC fluxes into the soil profile occurring under aspen. Our results did not support this hypothesis. Even though lab experiments indicated that aspen foliage does release ten times more DOC after freezing and thawing than do conifer needles (Boča, unpublished data), the DOC concentrations and fluxes measured in the field were always smaller under aspen than under conifers. It is possible that some leaching occurs during fall and early winter when daytime temperatures rise above freezing, and small volumes of snowmelt transport high concentration DOC into soil. However, in a two-year study with monthly sampling intervals, Fröberg et al. [62] similarly found consistently higher DOC values under conifers than birch in Sweden without any high concentration peaks under birch. The overall DOC input from litterfall was found to be comparatively small—9% of aspen litterfall, and 30% of conifer litterfall. The contribution of fresh litterfall to mineral SOC has been shown to be minimal also in an upland oak forest at Oak Ridge National Laboratory using 14C [63]. Despite the higher litterfall values in aspen, the lower DOC input fluxes from the forest floor, and the absence of clear signs of bioturbation make it unlikely that aboveground C is the main source of total and stable SOC in the mineral soil.
4.3. Belowground C Input
Root biomass data for different tree species are known to vary by geographical location due to abiotic growing conditions [36,64], which are the likely drivers of root biomass differences between CM and TWDEF. Our finding that conifers had higher fine root biomass than aspen is partially supported by other studies. For example, Steele et al. [37] found higher fine root biomass under aspen than black spruce at the southern study site, but lower biomass in the northern study site. Hansson et al. [65] found Norway spruce to have three times higher fine root biomass than adjacent pine and birch stands in Sweden. In a review, Vogt et al. [57] found that deciduous forests had lower fine root biomass than conifers and suggested that the capacity of evergreen forests to photosynthesize year round combined with longer foliage retention, may increase their potential to maintain a higher root mass. Our estimated annual root turnover of about 20%–36% (MRT 3–5 years) coincides with estimates by Hansson et al. [65]. Similar to Steele et al. [37] we found no big differences in fine root turnover rates between tree species.
It is interesting that root cores, minirhizotrons, and calculations yielded similar root detritus C input estimates for aspen stands (~600 kg C·ha−1·year−1) at TWDEF, while the various estimates were more variable (200–1500 kg C ha−1·year−1) for conifers. One reason for the divergent rhizotron-derived estimates is that the tubes under conifers experienced high fungal growth that obscured the detection of roots. In the calculations of root detritus input from soil respiration and aboveground litter input [31], it is uncertain whether the 50:50 partitioning of autotrophic vs. heterotrophic respiration [34,35] is equally valid in both forest types, especially considering that heterotrophic respiration in laboratory incubations was higher for conifer soils. Indeed, differences in C allocation patterns between conifers and hardwoods have been reported in other studies [66]. Also, differences in the type of mychorrizal associations between conifers and aspen [67] may have resulted in different belowground C allocation patterns [68] that were not captured in our calculations.
The strong positive relationship between root and LF C suggests that root detritus most likely fuels the LF fraction of SOC, which is considered less stable. On the other hand, rhizodeposition fuels microbial processes [69]. As studies suggest that microbial-derived compounds dominate MoM [70,71], detritus quality would be expected to influence the processing speed, with higher quality substrates resulting in more SOC being incorporated into MoM [72]. While DOC concentrations derived from root detritus did not differ in vegetation type in our laboratory experiment, the roots themselves showed differences in C/N ratio, with aspen root C/N around 40 vs. 90 for conifer roots, potentially pointing at differential microbial C processing and stabilization as per Cotrufo et al. [72].
The DOC in solution is more likely to add directly to the MoM fraction of SOC. Our estimated root detritus contribution to soil solution DOC showed potentially higher DOC C input from conifer than aspen roots. Vegetation differences regarding DOC inputs derived from aboveground and belowground detritus sources also followed an opposite pattern to what we observed in terms of SOC pools and stabilization. The observed depth differences in SUVA are consistent with our conceptual understanding of how DOC chemistry changes from precipitation to top- and subsoil [73]. Even though we found higher DOC/DON ratios in conifer than in aspen soil solutions, the difference in DOC aromaticity (SUVA) between both overstories was generally minimal, similar to what was found by Fröberg et al. [63] as well as in a global DOC meta-analysis by Michalzik et al. [74]. The decrease of SUVA and C/N values with depth is indicative of potential sorption or decomposition of aromatic compounds [73] or of roots adding less aromatic compounds to the solution. SUVA values recorded during the leaching experiment showed similar values for foliage and root leachates. Hansson et al. [75] also found similar SUVA values from Norway spruce needle and root leachates, but their values were higher than in our study, often increasing with time of decomposition. In our experiment, the substrate was leached once, potentially explaining the lower SUVA values. Collectively, this suggests that root DOC additions should not lower the SUVA of DOC in the percolating solution. We conclude that the observed differences in soil water chemistry between aspen and conifer were too small to cause major differences in sorption and stabilization of that DOC under both overstories. The higher DOC fluxes associated with higher calculated net DOC retention under conifers might initially suggest concentration driven DOC sorption. However, the DOC flux and retention patterns run contrary and fail to explain the actual SOC and MoM storage, which is higher under aspen.
The above- and belowground plant C pools and detritus input fluxes, as well as the DOC fluxes measured in our study, prove inadequate in explaining the differences in SOC storage and stabilization between aspen and conifer soils. The larger stable SOC and MoM stocks are thus not simply the result of higher above- and belowground litter input or turnover (Figure 6). As suggested by Rasse et al. [76], roots probably play a greater role in SOC stabilization than C derived from aboveground sources, but this is not necessarily mediated through detritus dynamics, which seem to feed more into the LF. Rather, the rhizosphere, i.e., living roots and associated microbial populations, may be key in creating the observed differences. Unfortunately, this study did not quantify microbial biomass, diversity and activity in the field.
Tree species differ in their C allocation to roots, and how this C is partitioned between root respiration and fine root biomass. While reviews have suggested that, on average, half of soil respiration is autotrophic from recent photosynthate [77], the reported relative proportion of fixed C that is allocated belowground ranges from 10% to 90% [34]. Differences in C allocation between deciduous and evergreen trees, and trees with ectomycorrhizal (like most conifers) and arbuscular mycorrhizal (aspen have also arbuscular mycorrhizae) associations have been reported in literature [67,78,79]. Therefore, we hypothesize that the differences between SOC pools under aspen and conifer overstories are due to differences in belowground C allocation and microbial composition and activity in the rhizosphere. While we did not investigate the rhizosphere, studies have shown that quantitatively the C inputs into soil by fine root turnover and exudation can be in the same range [80].
Furthermore, it has been shown that species with thicker roots (such as conifer roots in our study) forage more by mycorrhizal fungi, whereas thin-root species (such as aspen roots in our study) forage more by root proliferation [81]. Higher root proliferation can translate into higher surface area, more microbial MoM. In fact, Román Dobarco et al. [82] showed that the MoM under aspen largely consists of relatively simple molecules, which could originate from root exudates and microbial decomposition.
5. Conclusions
In this study, we quantified above- and belowground soil C pools and fluxes (Figure 6) to test some of the commonplace explanations for differential SOC accumulation patterns between ecosystems. To our knowledge, this is the first attempt to explain differences in SOC storage and stabilization in aspen and conifer systems in North America. Our results clearly demonstrate that aspen store significantly more mineral SOC than conifer stands in Utah, with most of the C associated with the silt and clay fraction, considered the more stable form of SOC. Aboveground C input fluxes are an unlikely factor in creating these differences. Indeed, while aspen have higher aboveground litterfall, only a small fraction of the aboveground litterfall appears to be transported into mineral soil. Nor did we find evidence that root detritus input is the driver of SOC differences between both overstory types. This leaves the logical conclusion that the observed differences in SOC storage and stabilization are more likely related to plant–microbe–soil interactions that take place in the rhizosphere. Our analysis identifies major gaps in our understanding of SOC dynamics, including the quantification of rhizosphere processes in belowground C sequestration. It also points to new directions for future inquiry, for example, the use of novel techniques, such as foliage- and root-specific biomarker (cutin and suberin) concentrations in bulk soil and MoM to further elucidate the relative role of above- and belowground C sources of SOC stabilization.
Acknowledgments
This research project was supported by the Utah Agricultural Experiment Station (McIntire-Stennis), the Cedar Mountain Research Initiative, Utah State University (USU) Ecology Center, and Office of Research and Graduate Studies. Field sampling was supported by I-Utah (NSF EPSCoR cooperative agreement IIA 1208732 awarded to USU). We thank Mercedes Román Dobarco, Scott Jones, Jobie Carlisle, William Mace, Chris Cox, Astrid Jacobson, David Powelson, Andrew Kulmatiski, and the many undergraduate students for their help with field sampling and laboratory analyses. Publication No. 8964, Utah Agricultural Experiment Station, Utah State University, Logan, UT, USA 84322-4810.
Author Contributions
Initial concept—H.V.M.; sample collection, data processing, and statistical analysis—A.B.; experimental design, manuscript outline, interpretation of results and writing—H.V.M. and A.B.
Conflicts of Interest
The authors declare no conflict of interest.
References
- Pan, Y.; Birdsey, R.; Fang, J.; Houghton, R.; Kauppi, P.E.; Kurz, W.; Phillips, O.L.; Shvidenko, A.; Lewis, S.L.; Canadell, J.G.; et al. A large and persistent carbon sink in the world’s forests. Science 2011, 333, 988–993. [Google Scholar] [CrossRef] [PubMed]
- McKenney, D.W.; Pedlar, J.H.; Lawrence, K.; Hutchinson, M.F.; Kenney, D.W.; Campbell, K. Potential impacts of climate change on the distribution of North American trees. Bioscience 2007, 57, 939–948. [Google Scholar] [CrossRef]
- Jensen, V. Decomposition of Angiosperm Tree Leaf Litter. In Biology of Plant Litter Decomposition; Academic Press: London, UK, 1974; pp. 69–104. [Google Scholar]
- Millar, C.S. Decomposition of Coniferous Leaf Litter. In Biology of Plant Litter Decomposition; Academic Press: London, UK, 1974; pp. 105–128. [Google Scholar]
- Finér, L.; Ohashi, M.; Noguchi, K.; Hirano, Y. Fine root production and turnover in forest ecosystems in relation to stand and environmental characteristics. For. Ecol. Manag. 2011, 262, 2008–2023. [Google Scholar] [CrossRef]
- Spielvogel, S.; Prietzel, J.; Leide, J.; Riedel, M.; Zemke, J.; Kögel-Knabner, I. Distribution of cutin and suberin biomarkers under forest trees with different root systems. Plant Soil 2014, 381, 95–110. [Google Scholar] [CrossRef]
- Vesterdal, L.; Clarke, N.; Sigurdsson, B.D.; Gundersen, P. Do tree species influence soil carbon stocks in temperate and boreal forests? For. Ecol. Manag. 2013, 309, 4–18. [Google Scholar] [CrossRef]
- Woldeselassie, M.; van Miegroet, H.; Gruselle, M.-C.; Hambly, N. Storage and stability of soil organic carbon in aspen and conifer forest soils of northern Utah. Soil Sci. Soc. Am. J. 2012, 76, 2230. [Google Scholar] [CrossRef]
- Rogers, P. Using Forest Health Monitoring to assess aspen forest cover change in the southern Rockies ecoregion. For. Ecol. Manag. 2002, 155, 223–236. [Google Scholar] [CrossRef]
- Kulakowski, D.; Veblen, T.T.; Drinkwater, S. The persistence of quaking aspen (Populus Tremuloides) in the Grand Mesa area, Colorado. Ecol. Appl. 2004, 14, 1603–1614. [Google Scholar] [CrossRef]
- Di Orio, A.P.; Callas, R.; Schaefer, R.J. Forty-eight year decline and fragmentation of aspen (Populus tremuloides) in the South Warner Mountains of California. For. Ecol. Manag. 2005, 206, 307–313. [Google Scholar] [CrossRef]
- Román Dobarco, M.; van Miegroet, H. Soil organic carbon storage and stability in the aspen-conifer ecotone in montane forests in Utah State, USA. Forests 2014, 5, 666–688. [Google Scholar] [CrossRef]
- Natural Resources Conservation Service. Snow Telemetry (SNOTEL) Precipitation and Air Temperature Data for T. W. Daniels Experimental Forest (Utah). Available online: http://wcc.sc.egov.usda.gov/nwcc/site?sitenum=1098 (accessed on 15 October 2016).
- Wadleigh, L.; Jenkins, M.J. Fire frequency and the vegetative mosaic of a spruce-fir forest in northern Utah. Gt. Basin Nat. 1996, 56, 28–37. [Google Scholar]
- Dover, J.H. Geologic Map of the Logan 30ʹ X 60ʹ Quadrangle, Cache and Rich Counties, Utah, and Lincoln and Uinta Counties, Wyoming; Geological Survey (U.S.): Denver, CO, USA, 1995.
- Van Miegroet, H.; Boettinger, J.L.; Baker, M.A.; Nielsen, J.; Evans, D.; Stum, A. Soil carbon distribution and quality in a montane rangeland-forest mosaic in northern Utah. For. Ecol. Manag. 2005, 220, 284–299. [Google Scholar] [CrossRef]
- Schimpf, D.J.; Henderson, J.A.; MacMahon, J.A. Some aspects of succession in the spruce-fir forest zone of northern Utah. Gt. Basin Nat. 1980, 40, 1–26. [Google Scholar]
- Natural Resources Conservation Service. Snow Telemetry (SNOTEL) Precipitation and Air Temperature Data for Kolob (Utah). Available online: https://wcc.sc.egov.usda.gov/nwcc/site?sitenum=561 (accessed on 15 October 2016).
- Evans, D. A Spatiotemporal Analysis of Aspen Decline in Southern Utah’s Cedar Mountain, Using Remote Sensing and Geographic Information Systems. Master’s Thesis, Utah State University, Logan, UT, USA, 2010. [Google Scholar]
- McNab, W.H.; Avers, P.E. Ecological Subregions of the United States, Section Descriptions; USDA Forest Service: Washington, DC, USA, 1994; p. 267.
- DeRose, R.J.; Long, J.N. Disturbance, structure, and composition: Spruce beetle and Engelmann spruce forests on the Markagunt Plateau, Utah. For. Ecol. Manag. 2007, 244, 16–23. [Google Scholar] [CrossRef]
- Bowns, J.E.; Bagley, C.F. Vegetation responses to long-term sheep grazing on mountain ranges. J. Range Manag. 1986, 39, 431–434. [Google Scholar] [CrossRef]
- Kaiser, M.; Ellerbrock, R.H.; Sommer, M. Separation of coarse organic particles from bulk surface soil samples by electrostatic attraction. Soil Sci. Soc. Am. J. 2009, 73, 2118–2130. [Google Scholar] [CrossRef]
- Ghani, A.; Dexter, M.; Perrott, K. Hot-water extractable carbon in soils: A sensitive measurement for determining impacts of fertilisation, grazing and cultivation. Soil Biol. Biochem. 2003, 35, 1231–1243. [Google Scholar] [CrossRef]
- Bu, X.; Wang, L.; Ma, W.; Yu, X.; McDowell, W.H.; Ruan, H. Spectroscopic characterization of hot-water extractable organic matter from soils under four different vegetation types along an elevation gradient in the Wuyi Mountains. Geoderma 2010, 159, 139–146. [Google Scholar] [CrossRef]
- Smucker, A.J.M.; McBurney, S.L.; Srivastava, A.K. Quantitative separation of roots from compacted soil profiles by the hydropneumatic elutriation system. Agron. J. 1982, 74, 500. [Google Scholar] [CrossRef]
- Gill, R.A.; Jackson, R.B. Global patterns of root turnover for terrestrial ecosystems. New Phytol. 2000, 147, 13–31. [Google Scholar] [CrossRef]
- Weishaar, J.L.; Aiken, G.R.; Bergamaschi, B.A.; Fram, M.S.; Fujii, R.; Mopper, K. Evaluation of specific ultraviolet absorbance as an indicator of the chemical composition and reactivity of dissolved organic carbon. Environ. Sci. Technol. 2003, 37, 4702–4708. [Google Scholar] [CrossRef] [PubMed]
- Dilling, J.; Kaiser, K. Estimation of the hydrophobic fraction of dissolved organic matter in water samples using UV photometry. Water Res. 2002, 36, 5037–5044. [Google Scholar] [CrossRef]
- Kalbitz, K.; Schmerwitz, J.; Schwesig, D.; Matzner, E. Biodegradation of soil-derived dissolved organic matter as related to its properties. Geoderma 2003, 113, 273–291. [Google Scholar] [CrossRef]
- Raich, J.W.; Nadelhoffer, K.J. Belowground carbon allocation in forest ecosystems: Global trends. Ecology 1989, 70, 1346–1354. [Google Scholar] [CrossRef]
- Olsen, H.R.; van Miegroet, H. Factors affecting carbon dioxide release from forest and rangeland soils in northern Utah. Soil Sci. Soc. Am. J. 2010, 74, 282. [Google Scholar] [CrossRef]
- Zak, D.R.; Grigal, D.F.; Ohmann, L.F. Kinetics of microbial respiration and nitrogen mineralization in great lakes forests. Soil Sci. Soc. Am. J. 1993, 57, 1100. [Google Scholar] [CrossRef]
- Hanson, P.J.; Edwards, N.T.; Garrten, C.T.; Andrews, J.A. Separating root and soil microbial contributions to soil respiration: A Review of methods and observations. Biogeochemistry 2000, 48, 115–146. [Google Scholar] [CrossRef]
- Subke, J.A.; Inglima, I.; Cotrufo, M.F. Trends and methodological impacts in soil CO2 efflux partitioning: A metaanalytical review. Glob. Chang. Biol. 2006, 12, 921–943. [Google Scholar] [CrossRef]
- Johnson, M.G.; Tingey, D.T.; Phillips, D.L.; Storm, M.J. Advancing fine root research with minirhizotrons. Environ. Exp. Bot. 2001, 45, 263–289. [Google Scholar] [CrossRef]
- Steele, S.J.; Gower, S.T.; Vogel, J.G.; Norman, J.M. Root mass, net primary production and turnover in aspen, jack pine and black spruce forests in Saskatchewan and Manitoba, Canada. Tree Physiol. 1997, 17, 577–587. [Google Scholar] [CrossRef] [PubMed]
- R Development Core Team. R: A Language and Environment for Statistical Computing; R Foundation for Statistical Computing: Vienna, Austria, 2015; Volume 1. [Google Scholar]
- Champely, S. pwr: Basic Functions for Power Analysis. R Package Version 1.1.3. Available online: http://CRAN.R-project.org/package=pwr (accessed on 20 January 2017).
- Bates, D.; Mächler, M.; Bolker, B.; Walker, S. Fitting linear mixed-effects models using lme4. J. Stat. Softw. 2015, 67, 1–48. [Google Scholar] [CrossRef]
- Nakagawa, S.; Schielzeth, H. A general and simple method for obtaining R2 from generalized linear mixed-effects models. Methods Ecol. Evol. 2013, 4, 133–142. [Google Scholar] [CrossRef]
- Lefcheck, J.S. piecewiseSEM: Piecewise structural equation modeling in R for ecology, evolution, and systematics. Methods Ecol. Evol. 2015. [Google Scholar] [CrossRef]
- Cohen, J. Statistical Power Analysis for the Behavioral Sciences, 2nd ed.; Lawrence Earlbaum Associates: Hillsdale, NJ, USA, 1988. [Google Scholar]
- Wickham, H. ggplot2: Elegant Graphics for Data Analysis; Springer: New York, NY, USA, 2009. [Google Scholar]
- Mueggler, W.F. Age distribution and reproduction of intermountain aspen stands. West. J. Appl. For. 1989, 4, 41–45. [Google Scholar]
- Strahm, B.D.; Harrison, R.B. Controls on the sorption, desorption and mineralization of low-molecular-weight organic acids in variable-charge soils. Soil Sci. Soc. Am. J. 2008, 72, 1653. [Google Scholar] [CrossRef]
- Kaiser, K.; Zech, W. Sorption of dissolved organic nitrogen by acid subsoil horizons and individual mineral phases. Eur. J. Soil Sci. 2000, 51, 403–411. [Google Scholar] [CrossRef]
- Woldeselassie, M.K. Soil Organic Carbon and Site Characteristics in Aspen and Evaluation of the Potential Effects of Conifer Encroachment on Soil Properties in Northern Utah. Master’s Thesis, Utah State University, Logan, UT, USA, 2009. [Google Scholar]
- Alban, D.H.; Perala, D.A.; Schlaegel, B.E. Biomass and nutrient distribution in aspen, pine, and spruce stands on the same soil type in Minnesota. Can. J. For. Res. 1978, 8, 290–299. [Google Scholar] [CrossRef]
- Weishampel, P.; Kolka, R.; King, J.Y. Carbon pools and productivity in a 1-km2 heterogeneous forest and peatland mosaic in Minnesota, USA. For. Ecol. Manag. 2009, 257, 747–754. [Google Scholar] [CrossRef]
- Gower, S.T.; Vogel, J.G.; Norman, M.; Kucharik, C.J.; Steele, S.J. Carbon distribution and aboveground net primary production in aspen, jack pine, and black spruce stands in Saskatchewan and Manitoba, Canada. J. Geophys. Res. Biogeosci. 1997, 102, 29029–29041. [Google Scholar] [CrossRef]
- Laganiére, J.; Paré, D.; Bergeron, Y.; Chen, H.Y.H.; Brassard, B.W.; Cavard, X. Stability of soil carbon stocks varies with forest composition in the Canadian boreal biome. Ecosystems 2013, 16, 852–865. [Google Scholar] [CrossRef]
- Laganière, J.; Boča, A.; van Miegroet, H.; Paré, D. A tree species effect on soil that is consistent across the species’ range: The case of aspen and soil carbon in north America. Forests 2017, 8. [Google Scholar] [CrossRef]
- Laganière, J.; Angers, D.A.; Paré, D.; Bergeron, Y.; Chen, H.Y.H. Black spruce soils accumulate more uncomplexed organic matter than aspen soils. Soil Sci. Soc. Am. J. 2011, 75, 1125. [Google Scholar] [CrossRef]
- Giardina, C.P.; Rhoades, C.C. Clear cutting and burning affect nitrogen supply, phosphorus fractions and seedling growth in soils from a Wyoming lodgepole pine forest. For. Ecol. Manag. 2001, 140, 19–28. [Google Scholar] [CrossRef]
- Boča, A.; van Miegroet, H.; Gruselle, M.-C. Forest overstory effect on soil organic carbon storage: A meta-analysis. Soil Sci. Soc. Am. J. 2014, 78, S35. [Google Scholar] [CrossRef]
- Vogt, K.A.; Grier, C.C.; Vogt, D.J. Production, turnover, and nutrient dynamics of above- and belowground detritus of world forests. Adv. Ecol. Res. 1986, 15, 303–377. [Google Scholar]
- Nave, L.E.; Vance, E.D.; Swanston, C.W.; Curtis, P.S. Fire effects on temperate forest soil C and N storage. Ecol. Appl. 2011, 21, 1189–1201. [Google Scholar] [CrossRef] [PubMed]
- Van Miegroet, H.; Olsson, M. Ecosystem disturbance and soil organic carbon—A review. In Soil Carbon in Sensitive European Ecosystems: From Science to Land Management; Jandl, R., Rodeghiero, M., Olsson, M., Eds.; John Wiley & Sons, Ltd.: Hoboken, NJ, USA, 2011; pp. 85–117. [Google Scholar]
- Bartos, D.L.; Debyle, N.V. Quantity, decomposition, and nutrient dynamics of aspen litterfall in Utah. For. Sci. 1981, 27, 381–390. [Google Scholar]
- Gower, S.T.; Hunter, A.; Campbell, J.; Vogel, J.; Veldhuis, H.; Harden, J.; Trumbore, S.; Norman, J.M.; Kucharik, C.J. Nutrient dynamics of the southern and northern BOREAS boreal forests. Ecoscience 2000, 7, 481–490. [Google Scholar] [CrossRef]
- Fröberg, M.; Hansson, K.; Kleja, D.B.; Alavi, G. Dissolved organic carbon and nitrogen leaching from Scots pine, Norway spruce and silver birch stands in southern Sweden. For. Ecol. Manag. 2011, 262, 1742–1747. [Google Scholar] [CrossRef]
- Fröberg, M.; Jardine, P.M.; Hanson, P.J.; Swanston, C.W.; Todd, D.E.; Tarver, J.R.; Garten, C.T. Low dissolved organic carbon input from fresh litter to deep mineral soils. Soil Sci. Soc. Am. J. 2007, 71, 347. [Google Scholar] [CrossRef]
- Leppälammi-Kujansuu, J.; Aro, L.; Salemaa, M.; Hansson, K.; Kleja, D.B.; Helmisaari, H.-S. Fine root longevity and carbon input into soil from below- and aboveground litter in climatically contrasting forests. For. Ecol. Manag. 2014, 326, 79–90. [Google Scholar] [CrossRef]
- Hansson, K.; Helmisaari, H.-S.; Sah, S.P.; Lange, H. Fine root production and turnover of tree and understorey vegetation in Scots pine, silver birch and Norway spruce stands in SW Sweden. For. Ecol. Manag. 2013, 309, 58–65. [Google Scholar] [CrossRef]
- Kuptz, D.; Fleischmann, F.; Matyssek, R.; Grams, T.E.E. Seasonal patterns of carbon allocation to respiratory pools in 60-year-old deciduous (Fagus sylvatica) and evergreen (Picea abies) trees assessed via whole-tree stable carbon isotope labeling. New Phytol. 2011, 191, 160–172. [Google Scholar] [CrossRef] [PubMed]
- Neville, J.; Tessier, J.; Morrison, I.; Scarratt, J.; Canning, B.; Klironomos, J. Soil depth distribution of ecto- and arbuscular mycorrhizal fungi associated with Populus tremuloides within a 3-year-old boreal forest clear-cut. Appl. Soil Ecol. 2002, 19, 209–216. [Google Scholar] [CrossRef]
- Brzostek, E.R.; Greco, A.; Drake, J.E.; Finzi, A.C. Root carbon inputs to the rhizosphere stimulate extracellular enzyme activity and increase nitrogen availability in temperate forest soils. Biogeochemistry 2013, 115, 65–76. [Google Scholar] [CrossRef]
- Kuzyakov, Y.; Domanski, G. Carbon input by plants into the soil. Review. J. Plant Nutr. Soil Sci. 2000, 163, 421–431. [Google Scholar] [CrossRef]
- Clemente, J.S.; Simpson, A.J.; Simpson, M.J. Association of specific organic matter compounds in size fractions of soils under different environmental controls. Org. Geochem. 2011, 42, 1169–1180. [Google Scholar] [CrossRef]
- Dümig, A.; Häusler, W.; Steffens, M.; Kögel-Knabner, I. Clay fractions from a soil chronosequence after glacier retreat reveal the initial evolution of organo–mineral associations. Geochim. Cosmochim. Acta 2012, 85, 1–18. [Google Scholar] [CrossRef]
- Cotrufo, M.F.; Wallenstein, M.D.; Boot, C.M.; Denef, K.; Paul, E. The microbial efficiency-matrix stabilization (MEMS) framework integrates plant litter decomposition with soil organic matter stabilization: Do labile plant inputs form stable soil organic matter? Glob. Chang. Biol. 2013, 19, 988–995. [Google Scholar] [CrossRef] [PubMed]
- Kaiser, K.; Kalbitz, K. Cycling downwards—Dissolved organic matter in soils. Soil Biol. Biochem. 2012, 52, 29–32. [Google Scholar] [CrossRef]
- Michalzik, B.; Kalbitz, K.; Park, J.; Solinger, S. Fluxes and concentrations of dissolved organic carbon and nitrogen—A synthesis for temperate forests. Biogeochemistry 2001, 52, 173–205. [Google Scholar] [CrossRef]
- Hansson, K.; Kleja, D.B.; Kalbitz, K.; Larsson, H. Amounts of carbon mineralised and leached as DOC during decomposition of Norway spruce needles and fine roots. Soil Biol. Biochem. 2010, 42, 178–185. [Google Scholar] [CrossRef]
- Rasse, D.P.; Rumpel, C.; Dignac, M.-F. Is soil carbon mostly root carbon? Mechanisms for a specific stabilisation. Plant Soil 2005, 269, 341–356. [Google Scholar] [CrossRef]
- Högberg, P.; Read, D.J. Towards a more plant physiological perspective on soil ecology. Trends Ecol. Evol. 2006, 21, 548–554. [Google Scholar] [CrossRef] [PubMed]
- Phillips, R.P.; Fahey, T.J. Tree species and mycorrhizal associations influence the magnitude of rhizosphere effects. Ecology 2006, 87, 1302–1313. [Google Scholar] [CrossRef]
- Sommer, J.; Dippold, M.A.; Flessa, H.; Kuzyakov, Y. Allocation and dynamics of C and N within plant-soil system of ash and beech. J. Plant Nutr. Soil Sci. 2016, 179, 376–387. [Google Scholar] [CrossRef]
- Nguyen, C. Rhizodeposition of organic C by plants: Mechanisms and controls. Agronomie 2003, 23, 375–396. [Google Scholar] [CrossRef]
- Eissenstat, D.M.; Kucharski, J.M.; Zadworny, M.; Adams, T.S.; Koide, R.T. Linking root traits to nutrient foraging in arbuscular mycorrhizal trees in a temperate forest. New Phytol. 2015, 208, 114–124. [Google Scholar] [CrossRef] [PubMed]
- Román Dobarco, M.; Jacobson, A.R.; Miegroet, H.V. Chemical composition of soil organic carbon from mixed aspen-conifer forests characterized with Fourier transform infrared spectroscopy. Forests 2014, 5, 666–688. [Google Scholar]
Figure 1.
Location of sampling sites: (a) T.W. Daniels Experimental Forest (TWDEF) site with six intensive measurement plots; and (b) pairs of extensively measured plots at four Cedar Mountain (CM) sites.
Figure 1.
Location of sampling sites: (a) T.W. Daniels Experimental Forest (TWDEF) site with six intensive measurement plots; and (b) pairs of extensively measured plots at four Cedar Mountain (CM) sites.

Figure 2.
Soil organic carbon (SOC) stocks (Mg C·ha−1) for aspen and conifer at CM and TWDEF. Values are averages of four paired sites at CM, and three plot pairs at TWDEF. Error bars are standard deviations for the total SOC stocks (O-horizon −50 cm) across the sites and plots (p = 0.51, ES = 0.32 for total SOC stocks, and p = 0.08, ES = 1.03 for mineral SOC stocks).

Figure 3.
Pool sizes of the three major SOC fractions mineral associated organic matter (MoM) in the silt and clay fraction, MA > 53—mineral associated SOC in the sand fraction, LF—light fraction (Mg·ha−1) at TWDEF (average of three plots) (a) and CM (average of four sites) (b). Error bars are standard deviations for the whole profile (MoM: p = 0.15, ES = 0.78; MA: p = 1, SE = 0.002; LF: p = 0.53, t = 0.69, SE = 0.31).
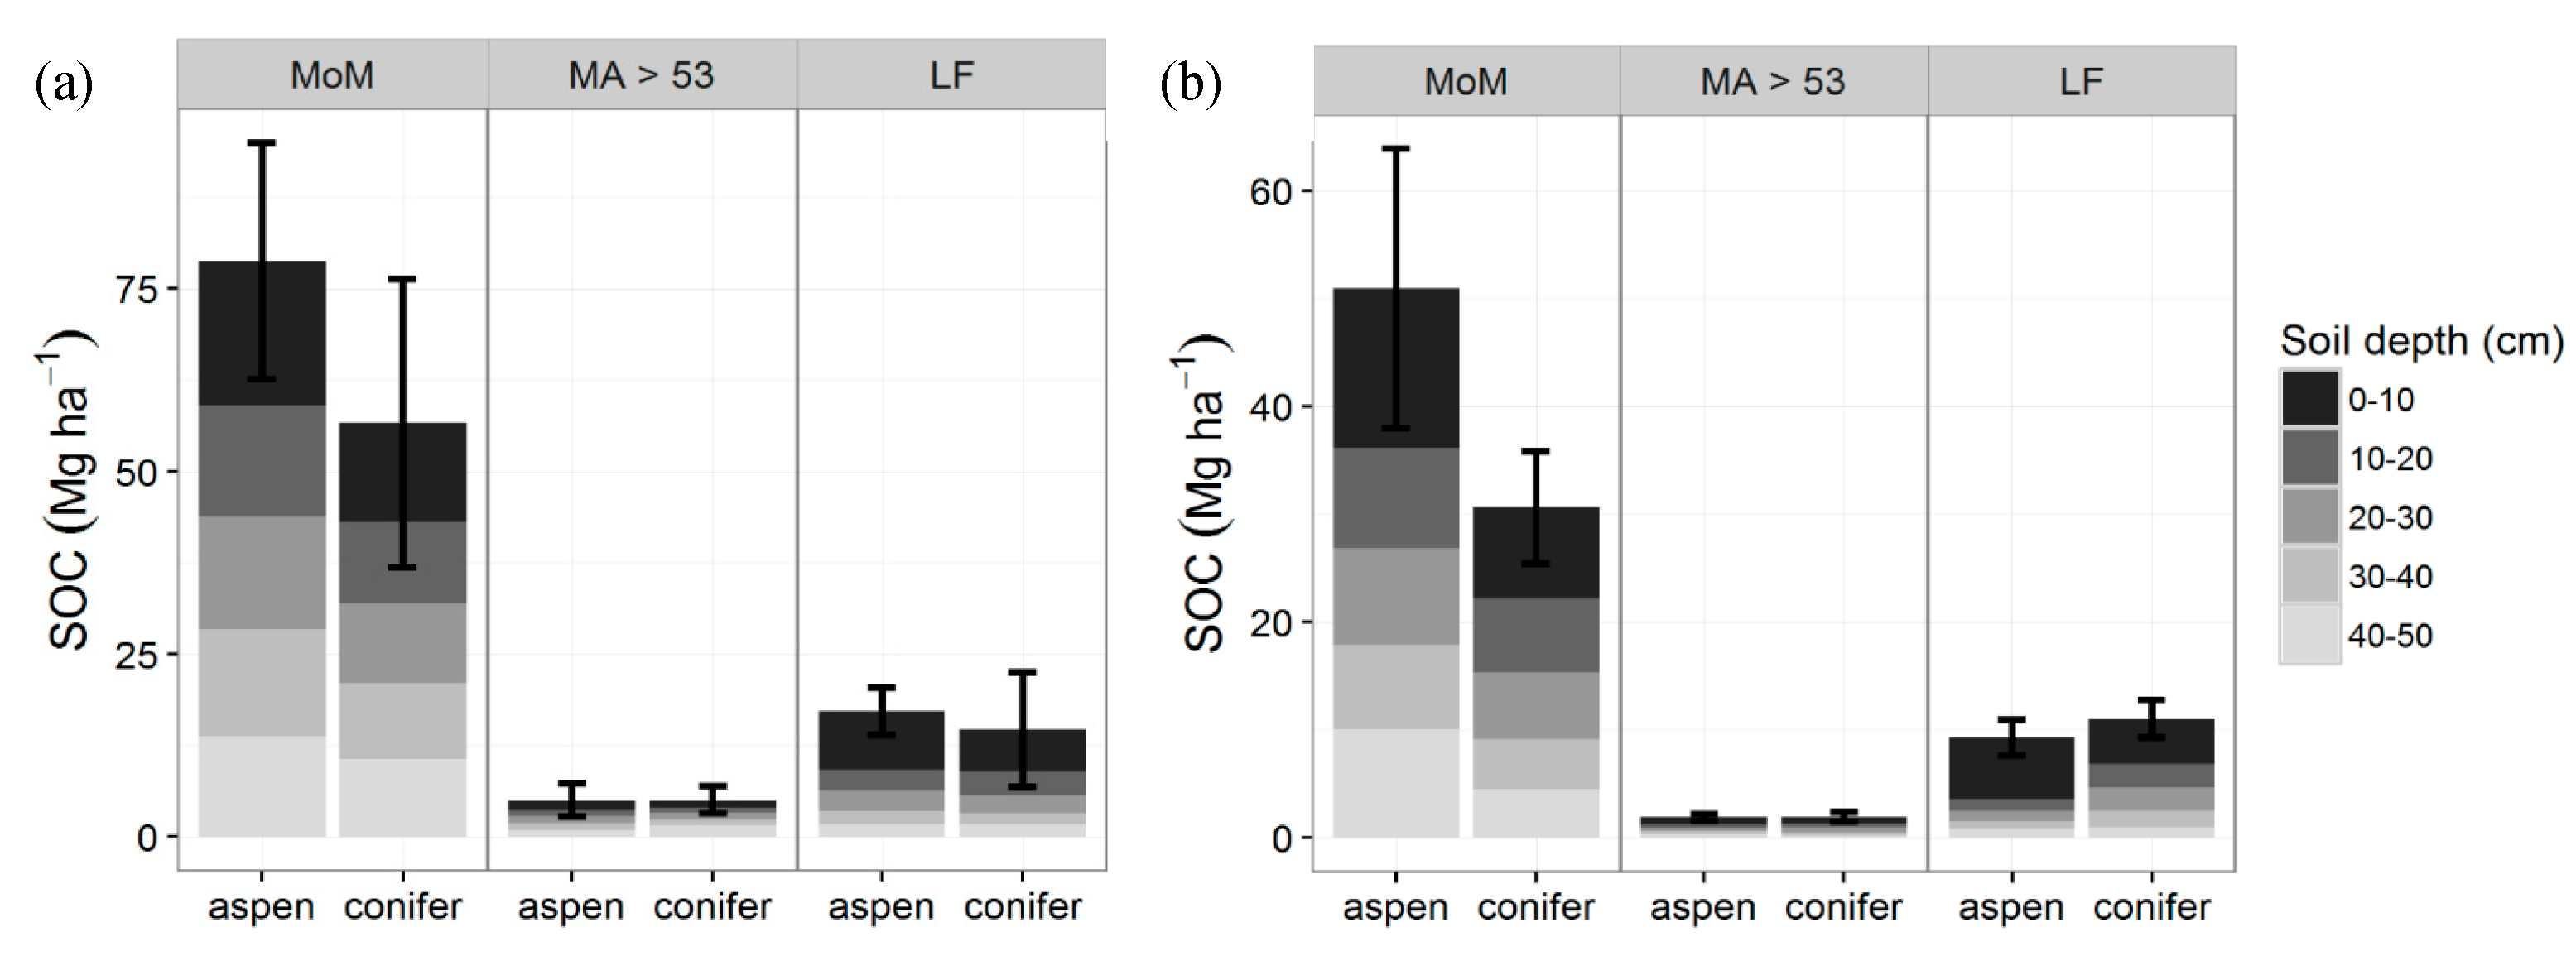
Figure 4.
Root biomass and LF—light fraction C content (Mg·ha−1) by depth and vegetation type at TWDEF and CM. Error bars are standard errors of three plots at TWDEF and four sites at CM. For the whole soil profile, total root biomass was higher under conifers than aspen (p = 0.005, SE = 2.52), while light fraction pools were similar (p = 0.53, SE = 0.31).
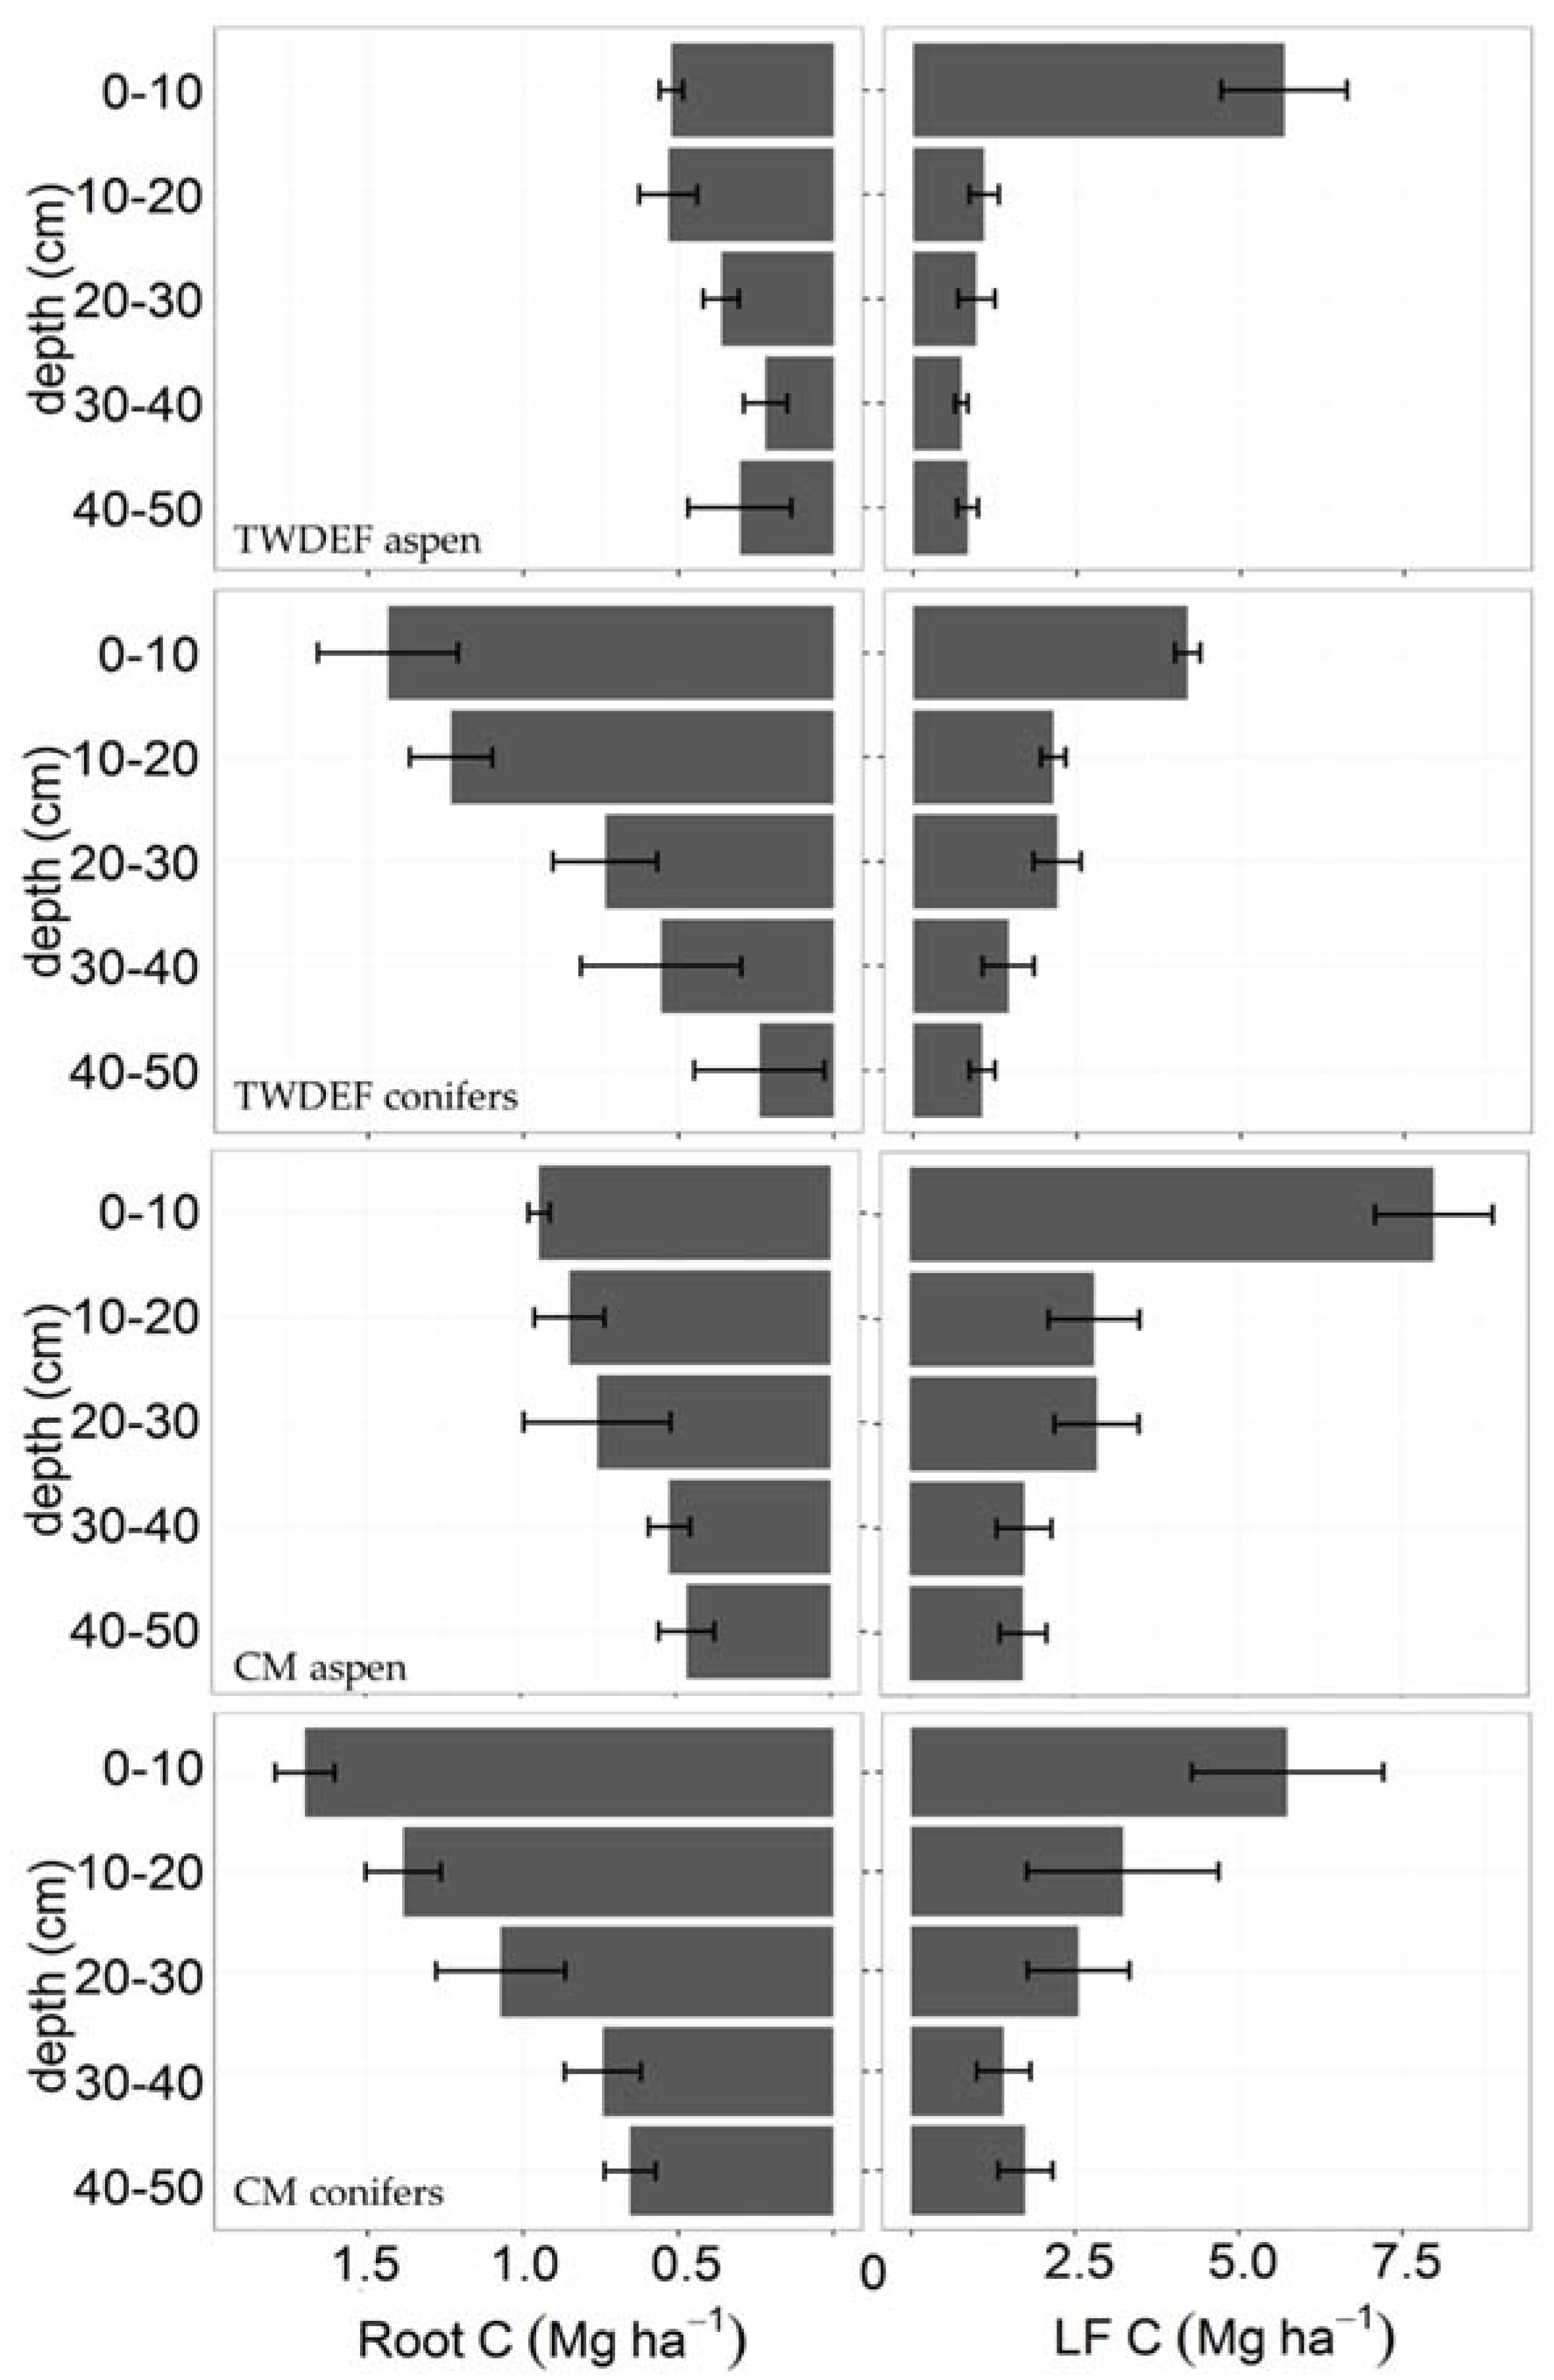
Figure 5.
Relationship between total extractable Fe (mg·g−1 soil) and C concentrations in 0–10 cm depth soils from CM and TWDEF. The labels in the graph correspond to the plot labels in Table 1. “A” indicates aspen plots, and “C” indicates conifer plots.
Figure 5.
Relationship between total extractable Fe (mg·g−1 soil) and C concentrations in 0–10 cm depth soils from CM and TWDEF. The labels in the graph correspond to the plot labels in Table 1. “A” indicates aspen plots, and “C” indicates conifer plots.
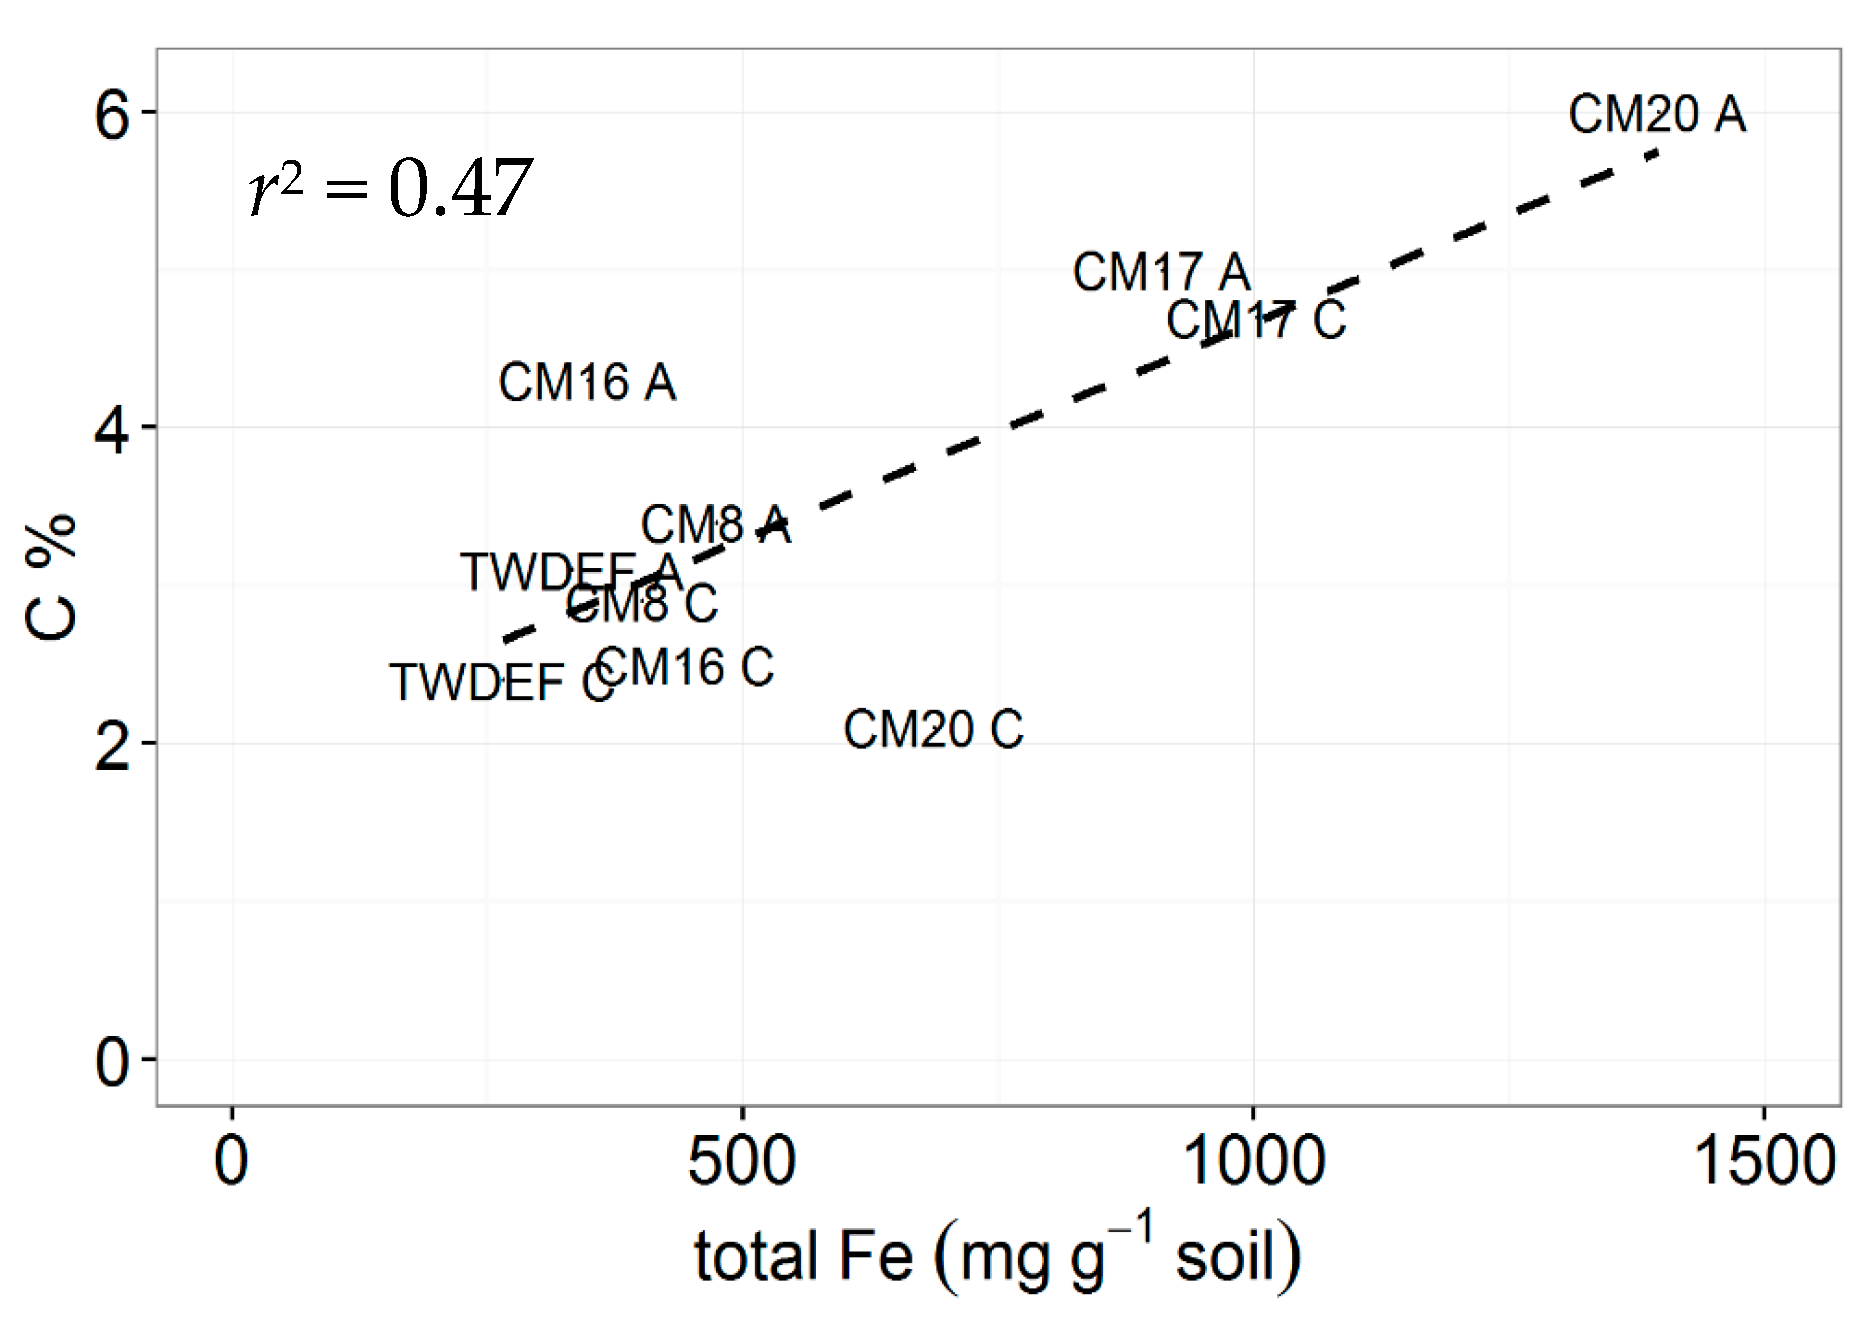
Figure 6.
C fluxes into and out of soil at TWDEF. All values are averages of three plots ± SD. Foliage litterfall C is an average value for two consecutive years (2014–2016). Understory C was measured in 2015. DOC—dissolved organic carbon flux during snowmelt period averaged for three consecutive years. Fine root mass was measured from root cores and from minirhizotron data. Fine root input (R and N, 1989) was calculated using the relationships reported by Raich and Nadelhoffer [31], and using minirhizotron data evaluation. Arrows going upward indicate C loss through soil respiration with actual C loss values given on top. Soil respiration data used in the figure were originally reported by Olsen and Van Miegroet [32]. (Illustration by Mercedes Román Dobarco)

Table 1.
Site location and stand characteristics.
| Aspen | Conifer | |||||||||||||
|---|---|---|---|---|---|---|---|---|---|---|---|---|---|---|
| Site | UTM Coordinates | Elev. (m) | Slope (%) | Aspect | LBA (m2·ha−1) | Stems (ha−1) | Soil Texture | UTM Coordinates | Elev. (m) | Slope (%) | Aspect | LBA (m2·ha−1) | stems (ha−1) | Soil Texture |
| CM8 | X: 320149 Y: 4150010 | 2703 | 23 | NW | 54.4 | 639 | Loam | X: 320206 Y: 4150075 | 2699 | 23 | NW | 65.7 | 526 | Loam, clay loam |
| CM16 | X: 3316696 Y: 4161467 | 2680 | 11 | N | 19.7 | 529 | Sandy loam | X: 331651 Y: 4161417 | 2702 | 8 | N | 45.9 | 1298 | Loam |
| CM17 | X: 315048 Y: 4157533 | 2724 | 4 | NW | 19.8 | 2396 | Loam | X: 315004 Y: 4157475 | 2714 | 9 | N | 34.6 | 1403 | Loam |
| CM20 | X: 330427 Y: 4159551 | 2896 | 11 | W | 34.7 | 1057 | Sandy loam | X: 330542 Y: 4159749 | 2892 | 15 | N | 45.6 | 1569 | Sandy loam |
| TWDEF * | X: 0457840 Y: 4634963 | 2634–2649 | 1–11 | SSE–SE | 48.7 | 1949 | Loam, clay loam | X: 0457952 Y: 4634897 | 2636–2659 | 1–9 | SSE–SE | 56.4 | 3138 | Loam, clay loam |
* The parameters for TWDEF are ranges of three replicates. LBA, live basal area (m2·ha−1); UTM, Universal Transverse Mercator.
Table 2.
Dissolved organic carbon (DOC) (kg·ha−1) transport during snowmelt period ± standard deviation (n = 3 plots per overstory type at TWDEF).
Table 2.
Dissolved organic carbon (DOC) (kg·ha−1) transport during snowmelt period ± standard deviation (n = 3 plots per overstory type at TWDEF).
| Year | DOC | |||
|---|---|---|---|---|
| Aspen 5 cm | Aspen 45 cm | Conifer 5 cm | Conifer 45 cm | |
| 2014 | 56.26 ± 2.35 | 49.20 ± 4.56 | 177.61 ± 152.82 | 82.11 ± 97.43 |
| 2015 | 52.81 ± 10.19 | 24.67 ± 5.91 | 137.96 ± 33.14 | 65.11 ± 11.91 |
| 2016 | 145.44 ± 49.23 | 46.66 ± 9.13 | 130.49 ± 27.35 | 67.47 ± 38.39 |
(Effect of overstory type p = 0.01, F1,28 = 7.63; effect of depth p = 0.006, F1,28 = 9.02; effect of interaction p = 0.98, F1,28 = 0.001; repeated measures ANOVA).
© 2017 by the authors. Licensee MDPI, Basel, Switzerland. This article is an open access article distributed under the terms and conditions of the Creative Commons Attribution (CC BY) license (http://creativecommons.org/licenses/by/4.0/).
Share and Cite
MDPI and ACS Style
Boča, A.; Van Miegroet, H. Can Carbon Fluxes Explain Differences in Soil Organic Carbon Storage under Aspen and Conifer Forest Overstories? Forests 2017, 8, 118. https://doi.org/10.3390/f8040118
AMA Style
Boča A, Van Miegroet H. Can Carbon Fluxes Explain Differences in Soil Organic Carbon Storage under Aspen and Conifer Forest Overstories? Forests. 2017; 8(4):118. https://doi.org/10.3390/f8040118
Chicago/Turabian StyleBoča, Antra, and Helga Van Miegroet. 2017. "Can Carbon Fluxes Explain Differences in Soil Organic Carbon Storage under Aspen and Conifer Forest Overstories?" Forests 8, no. 4: 118. https://doi.org/10.3390/f8040118
Note that from the first issue of 2016, this journal uses article numbers instead of page numbers. See further details here.