Article

A Basal Area Increment-Based Approach of Site Productivity Evaluation for Multi-Aged and Mixed Forests

1
Research Institute of Forest Resource Information Techniques, Chinese Academy of Forestry, Beijing 100091, China
2
Center for Statistical Genetics, Pennsylvania State University, Loc T3436, Mail Code CH69, 500 University Drive, Hershey, PA 17033, USA
3
Faculty of Forestry and Wood Sciences, Czech University of Life Sciences Prague, Prague 6, Suchdol 16521, Czech Republic
4
College of Forestry, Central South University of Forestry and Technology, 498 ShaoshanNanlu, Changsha 410004, Hunan, China
5
Department of Forest, Rangeland, and Fire Sciences, University of Idaho, Moscow, ID 83844, USA
6
Academy of Forest Inventory and Planning of Jilin Province, Changchun 130022, Jilin, China
*
Author to whom correspondence should be addressed.
Forests 2017, 8(4), 119; https://doi.org/10.3390/f8040119
Submission received: 17 February 2017 / Revised: 29 March 2017 / Accepted: 1 April 2017 / Published: 12 April 2017

Abstract

:
Accurate estimates of forest site productivity are essential for environmental planning and forest management. In this study, we developed a new productivity index, hereafter termed basal area potential productivity index (BAPP), to estimate site productivity for irregular and complex forests characterized by multi-aged, multi-species, and multi-layer stands. We presented the biological relevance of BAPP with its computational details. We also compared BAPP against basal area realized productivity (BARP) in order to verify the practicability and reliability of BAPP. Time-series data of the national forest inventory on 1912 permanent sample plots that were located in two main forest types and consisted of oak-dominated mixed forests and other broadleaf forests in northeast China were used to demonstrate the application of BAPP. The results showed that the value of BAPP for each sample plot was larger than or equal to the corresponding BARP value for each forest type. For appropriately managed stands with relatively better site conditions, the values of both BARP and BAPP were almost identical. The values of the difference between BAPP and BARP could therefore be used to effectively assess forest site productivity. Meanwhile, BAPP also provides much reliable and valuable information that can aid decision-making in forest management.

1. Introduction

Forest site productivity, which is a quantitative estimate of the potential of a site to produce wood or plant biomass, provides information that is essential for predicting the rate of change of wood or plant biomass production potential under different management regimes [1,2,3]. Reliable information on site productivity is an important prerequisite for forest management planning. The terms “site productivity” and “site quality” are often used interchangeably, and concepts of these terms were developed by forest managers to project the expected production potential of the trees of a certain species on a given site [4,5].
Various approaches have been used to estimate site productivity [1,6,7,8], and among the methods, a dominant height–age model approach (i.e., the site index (SI)) is most commonly used, especially for planted stands [2,3,5,6]. The SI is defined as the mean height of dominant and co-dominant trees in a stand at a specified reference age [5]. The dominant height of a stand reflects the productivity of a fully stocked, even-aged stand, because the height growth of dominant trees is independent of stand density over a wide range of densities [1,9,10]. Conceptually, the SI was developed for even-aged stands of a single species, but over the last two decades, it has been applied to multi-aged and mixed species stands as well [11,12,13]. As a result, numerous drawbacks of using the SI have been identified, discussed, and reported [11]. For instance, the SI is often not observable, because even-aged, well-stocked, free-growing, undisturbed, and undamaged dominant and co-dominant trees may not exist. This is a common situation in the degraded stands or stands managed using uneven-aged silviculture. Even if the trees are present, they may not be desirable species for estimating the SI. Small errors in the measurements of age or dominant height often lead to large uncertainties in SI prediction [9].
These limitations of estimating the SI have become much more noticeable in recent years as the scope of forest management has widened towards the creation of multi-purpose stands with multiple ages and species [1,2,10,12,14,15]. Such a new paradigm of management has not only limited the application of the SI, but also led to the exploration of alternative approaches to evaluate site productivity of such stands [1,12,14], such as using either site and environmental factors [1,5,7,8,14] or stand-based measures: stand basal area, stand volume [10,14], and height–diameter models [12,16]. Worldwide, there is an increasing interest in using different strategies to manage multi-aged and mixed species stands where other stand measures, rather than the SI, are often used to estimate site productivity [10,17].
In a natural forestry context, site productivity emphasizes the potential of timber or biomass production as a main indicator of a site. It is also used as a reliable indicator of sustainability and predicting the rate of change of the biomass or volume production [10,14]. The maximum mean annual basal area increment (BAI) is often considered to be a more useful measure of site productivity than a stand height-based index [10,14]. An index that represents stand volume or biomass production allows for more direct and meaningful comparison across the tree species, site types, and regions than a stand height-based index [10]. Vanclay [6] proposed a growth index for complex and mixed tropical forests based on diameter increment, which was adjusted for tree size (diameter) and competition measures. This study also suggested that the annual BAI or volume increment might indicate the site productivity, especially for unmanaged stands. Berrill and O’Hara [10] proposed BAI- or volume increment-based site productivity indices, and demonstrated the applications of these indices in the individual-tree and stand growth models for a coastal redwood (Sequoia sempervirens Lamb. ex D. Don Endl.).
According to the Chinese National Forest Inventory program, China has approximately 122 million hectares of natural forests, which accounts for 64% of the total forested area; the standing volume of natural forests is approximately 12.3 billion m3, or 83 % of the total volume in the country [18]. However, decreased forest productivity caused by inappropriate considerations of site quality during forest management is a very critical issue in China. Stand height-based or site and environmental factors-based approaches of evaluating site productivity of plantations were well documented [19,20,21], however, no general approaches that are applicable for multi-aged and mixed species stands are available in China. Thus, this study aims to: (i) develop a new productivity index (i.e., BAI-based index for estimating site productivity of multi-aged and mixed species stands); (ii) to provide computational details of this index; (iii) to verify and validate the index using the national forest inventory (NFI) data from two typical multi-aged and mixed species stands in northeast China; and (iv) to demonstrate the application of the new index by evaluating site productivity of the studied forests.

2. Materials and Methods

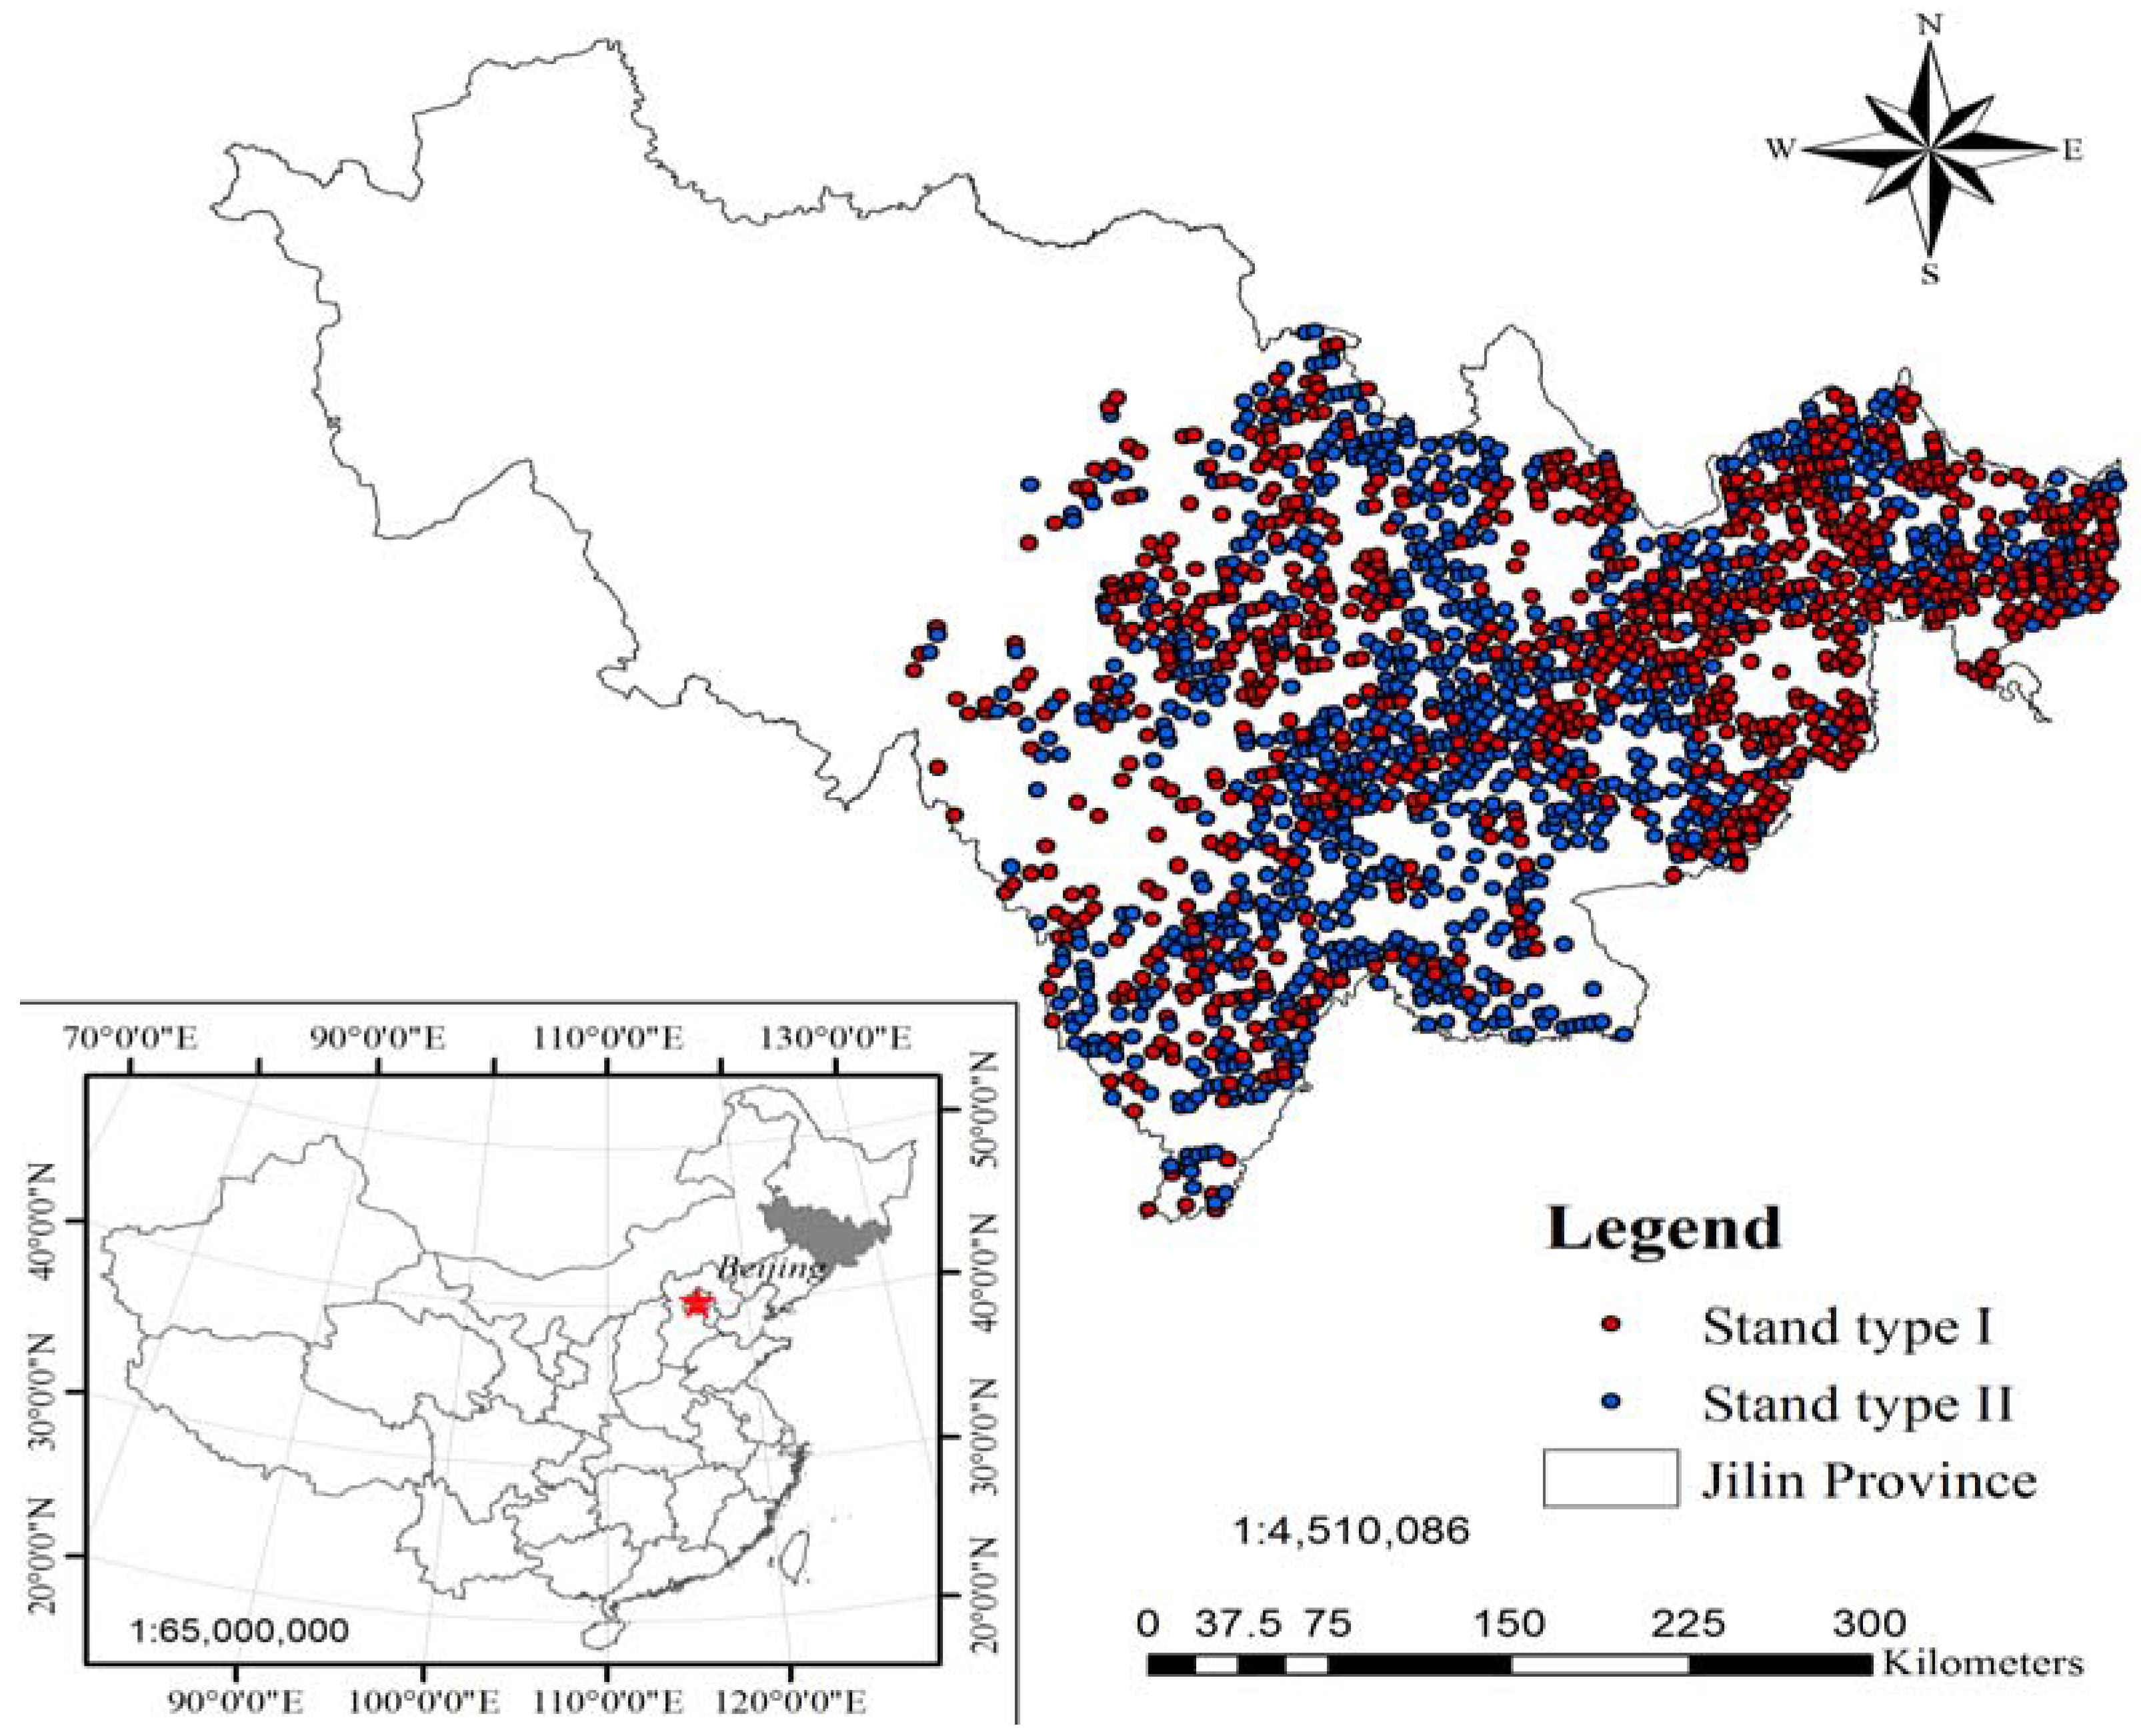
2.1. Study Area and Data

We used data acquired from a total of 1912 permanent sample plots (PSPs) of the Chinese NFI on two main multi-aged and mixed species stand types, including Mongolian oak (Quercusmongolica Fisch. ex Ledeb.)-dominated stands (stand type I) and other broadleaf stands (stand type II) with low growth rates (the dominant species were Tilia tuan Szyszyl., Fraxinus mandshurica Rupr., Ulmuspumila L., and Betula costata Trautv.). Both forest types were distributed randomly across the middle and eastern parts of Jilin Province in northeast China (Figure 1). Each PSP was square with an area of 0.06 ha. Of the 1912 PSPs, 859 were allocated in stand type I and 1053 in stand type II.
The PSPs represented a variety of different stand structures, stand densities, site qualities, tree sizes, ages, and growth conditions. The inventory was conducted partially or fully in 1994, 1999, 2004, and 2009, meaning that most sampled trees had three 5-year growth intervals. Within each PSP, we measured the diameter at breast height (dbh) of all standing living trees with dbh ≥ 5 cm. Six average trees were selected in each PSP, following the same sampling intensity as would be used for dominant height selection (i.e., proportion of 100 thickest trees per ha) [22]. The total height of each selected tree was measured. The arithmetic mean of the trees was regarded as a stand mean height (H). In addition, the age of each selected tree was recorded by counting the growth rings on increment cores taken at 0.1 m above the ground [23], and their arithmetic mean value was also used as a stand age (T).
A total of 5575 observations (2718 and 2857 from stand types I and II, respectively) were used to estimate site productivity. H, T, stand basal area ( B A ), species composition, and Reineke’s stand density index ( S ) [24] for each PSP were calculated. The S was given by
S = N ( D / D ˜ ) β = N ( D / 20 ) 1.605
where β is a parameter which, as proposed by Tang et al. [25], we set to 1.605; D ˜ is the standard base diameter (recommended value 20 cm); and N D are the number of standing living trees and the arithmetic mean diameter at breast height of the stand, respectively. Summary statistics of measurements of the relevant stand characteristics are presented in Table 1. All PSPs were stratified into ten site groups using seven biogeoclimatic factors, including elevation, slope, aspect, slope position, soil depth, soil type, and humus layer, and we coded them by group = 1 , 2 , ... , 10 with smaller values indicating higher site productivities. Methodological details of dividing the PSPs into site groups are also found in Zhu et al. [26]. The relationship between H and T for each of the ten site groups and two stand types is shown in Figure 2.

2.2. Basal Area Potential Productivity Index

In this study, a basal area potential productivity index (BAPP) was defined as the maximum annual BAI at a specific T for a stand type with a given site type. It can be obtained by seeking an optional Reineke’s stand density index [24], ( S ˜ ), in a given feasible region, that maximizes the following objective function:
BAPP = arg   max S [ S min , S max ] ( B A I T = f ( S ) )
where S min and S max are the lower and upper limits of S , respectively; B A I T is the annual basal area increment at T; and f is the BAI-function with a predictor S , which depends on stand height and basal area growth models.
Based on Equation (1), BAPP has two primary characteristics:
(i)
Stability: BAPP is dependent on site type, stand type, and T. Thus, when these variables are quantified, BAPP can be determined.
(ii)
Maximization: BAPP reflects the maximum mean annual BAI of a particular site type, stand type, and T; therefore, the mean annual BAI of a stand is always less than or equal to BAPP. However, in theory, the mean annual BAI can be close, or even equal to BAPP for an appropriately managed stand.
Thus, BAPP can be effectively used to quantify site productivity for multi-aged and mixed stands. Therefore, a considerable amount of reliable information (e.g., site quality and potential for improving the BAI of an objective stand) could be provided by the values of difference between the basal area realized productivity (BARP) and BAPP, which is very important for decision-making in forestry.

Computational Conditions for BAPP

Computational conditions for BAPP at a specific T based on Equation (1) as follows:
(i) Determine the objective stand type;
(ii) Develop a HT model (Equation (2)) for the objective stand, and estimate the parameters using ordinary nonlinear least square (ONLS) regression:
H = f H ( T , Φ ^ H )
where T and H are stand age and stand mean height, respectively, and Φ ^ H is the vector of the parameter estimates. It should be noted that for estimating BAPP based on NFI data, H instead of stand dominant height was applied in the whole calculation. This is because (a) stand dominant height was not measured in Chinese NFI data, especially for multi-aged and mixed forests; and (b) the correlation between H and stand dominant height is strong [27].
(iii) Develop a BA growth model (Equation (3)) for the objective stand, and estimate the parameters using ONLS regression:
B A = f G ( T , S , H , Φ ^ G )
where B A and S are stand basal area and stand density index, respectively, and Φ ^ G is the vector of the parameter estimates.
(iv) Determine the site group of a stand type ( group );
(v) Determine the specific age of a stand type ( T 0 );
(vi) Determine a feasible region of the stand density index.
When the abovementioned conditions are given, Equation (1) can be a typical nonlinear programming problem. Applying these conditions, we used the combined method of a golden section and a dichotomy iteration algorithm (GS&DIA) [28,29] to compute the BAPP in Equation (1).

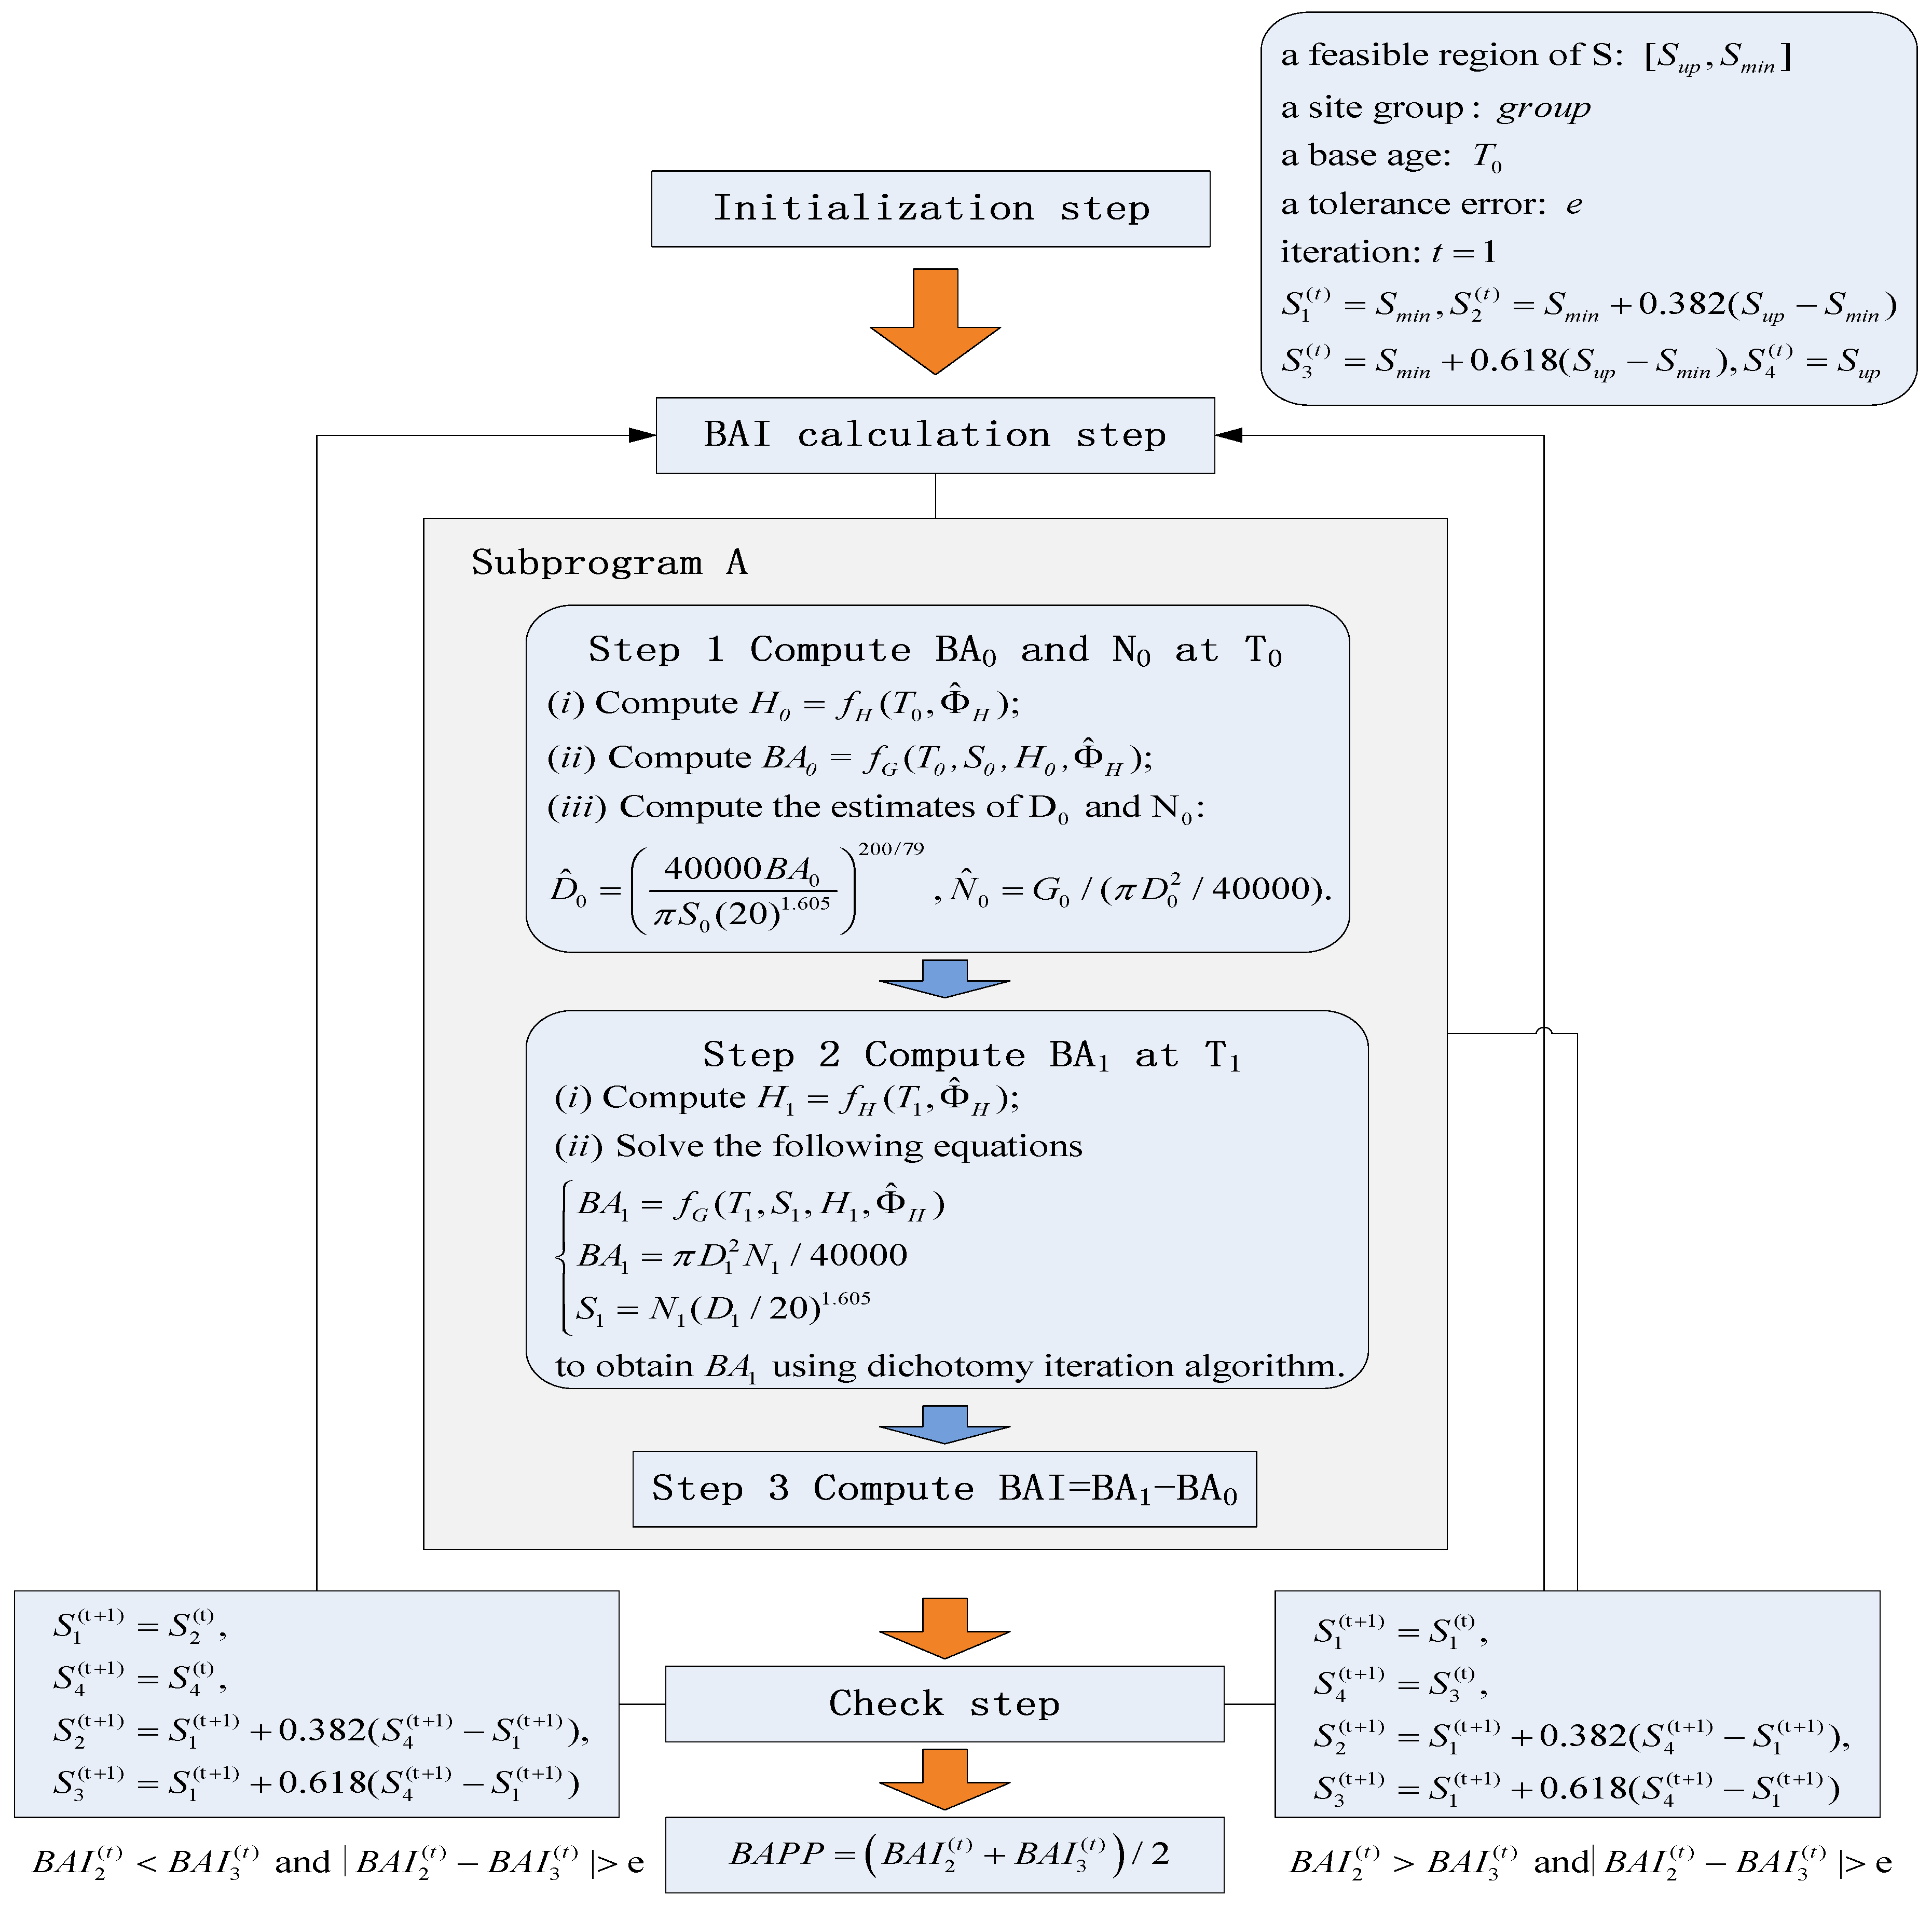
2.2.1. The GS&DIA Procedure
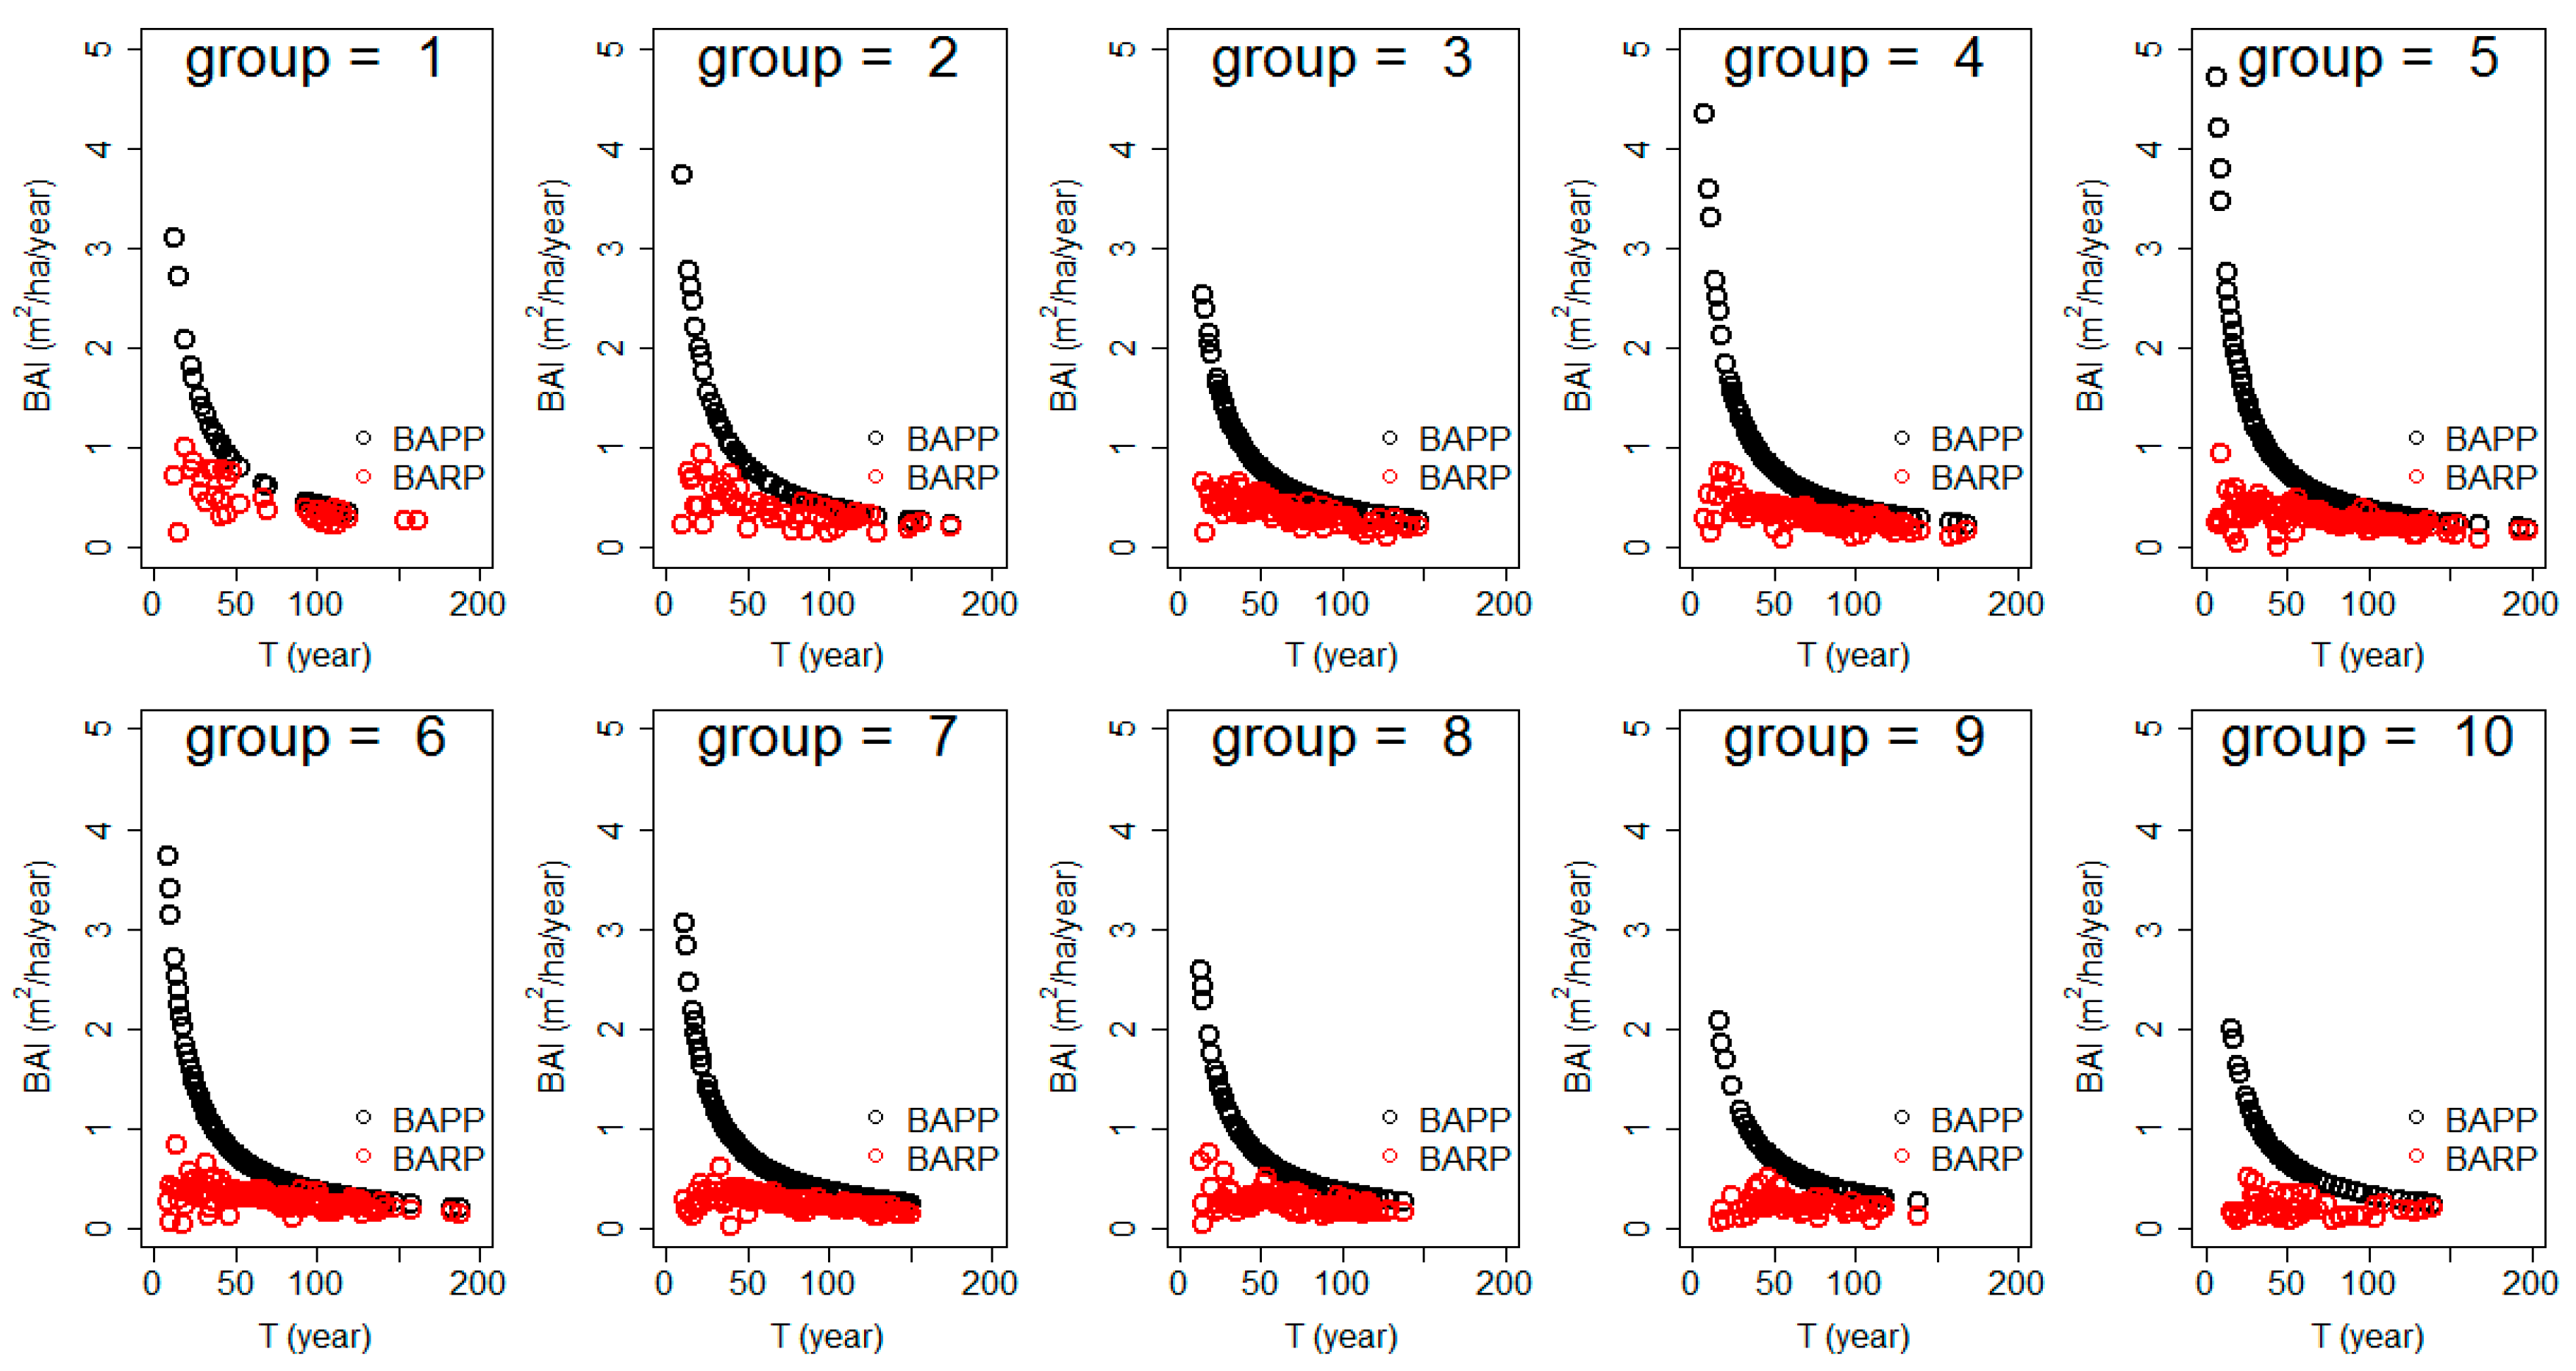
We implemented the GS&DIA for estimating BAPP as follows:
Step 1: Set a feasible region of S [ S min ,   S max ] , and set a site group ( group ), a base age ( T 0 ), a tolerance error ( e ), and iteration t = 1 . The starting values of the stand density indices for four points of segmentation ( S 1 ( t ) , S 2 ( t ) , S 3 ( t ) , and S 4 ( t ) ), as determined by the golden section, are given by:
S 1 ( t ) = S min ,   S 2 ( t ) = S min + 0.382 ( S max S min ) ,   S 3 ( t ) = S min + 0.618 ( S max S min ) ,   S 4 ( t ) = S max
Step 2: The BAIs of four points of segmentation ( B A I 1 ( t ) , B A I 2 ( t ) , B A I 3 ( t ) , and B A I 4 ( t ) ) corresponding to S 1 ( t ) , S 2 ( t ) , S 3 ( t ) , and S 4 ( t ) , respectively, at the t t h iteration are obtained using subprogram A (see below), and a dichotomy iteration algorithm is applied.
Step 3: If B A I 2 ( t ) > B A I 3 ( t ) and | B A I 2 ( t ) B A I 3 ( t ) | > e , then compute S 1 ( t + 1 ) , S 2 ( t + 1 ) , S 3 ( t + 1 ) , and S 4 ( t + 1 ) :
S 1 ( t + 1 ) = S 1 ( t ) ,   S 4 ( t + 1 ) = S 3 ( t ) ,   S 2 ( t + 1 ) = S 1 ( t + 1 ) + 0.382 ( S 4 ( t + 1 ) S 1 ( t + 1 ) ) ,   S 3 ( t + 1 ) = S 1 ( t + 1 ) + 0.618 ( S 4 ( t + 1 ) S 1 ( t + 1 ) )
if B A I 2 ( t ) > B A I 3 ( t ) and | B A I 2 ( t ) B A I 3 ( t ) | > e , then
S 1 ( t + 1 ) = S 2 ( t ) ,   S 4 ( t + 1 ) = S 4 ( t ) ,   S 2 ( t + 1 ) = S 1 ( t + 1 ) + 0.382 ( S 4 ( t + 1 ) S 1 ( t + 1 ) ) ,   S 3 ( t + 1 ) = S 1 ( t + 1 ) + 0.618 ( S 4 ( t + 1 ) S 1 ( t + 1 ) ) ,
and one must go back to step 2 for the next iteration, otherwise the calculation stops. The final estimate of BAPP at T 0 and its corresponding stand density index are:
B A P P = ( B A I 2 ( t ) + B A I 3 ( t ) ) / 2 , S ˜ = ( S 2 ( t ) + S 3 ( t ) ) / 2 .
Subprogram A:
This subprogram is for B A I estimation under known Φ ^ G , Φ ^ H , T 0 , and S 0 (e.g., S 1 ( t ) , S 2 ( t ) , S 3 ( t ) , and S 4 ( t ) values from the main program). Identical tree growth was assumed for an objective stand type. That is, tree numbers in the stand in the two succeeding stand ages are identical. A dichotomy iteration algorithm was applied to determine the B A I as below (Figure 3):
Step 1: Compute the basal area of the stand, B A 0 , and number of trees, N 0 , at T 0 ;
(i) Given T 0 , compute H 0 ;
H 0 = f H ( T 0 , Φ ^ H )
(ii) Given T 0 , S 0 , and H 0 , compute B A 0 using the following equation:
B A 0 = f G ( T 0 , S 0 , H 0 , Φ ^ G )
(iii) Given B A 0 and S 0 , N 0 and the mean diameter at breast height, D 0 , of the stand at T 0 are obtained by solving the following equations:
{ B A 0 = π D 0 2 N 0 / 40000 S 0 = N 0 ( D 0 / 20 ) 1.605 .
The estimates of D 0 and N 0 are
D ^ 0 = ( 40000 B A 0 π S 0 ( 20 ) 1.605 ) 200 / 79  and  N ^ 0 = G 0 / ( π D 0 2 / 40000 ) .
Step 2: Compute the basal area of the stand ( B A 1 ) at T 1 ( T 0 + 1 ) years;
We suppose that the tree numbers in the two succeeding stand ages ( T 0 and T 1 ) are identical, which means that N 1 = N ^ 0 .
(i) Given T 1 and Φ ^ H , compute H 1 using the following equation:
H 1 = f H ( T 1 , Φ ^ H )
(ii) Given H 1 , T 1 , N 1 , and Φ ^ G , the basal area of the stand ( B A 1 ), the stand density index ( S 1 ), and the mean diameter at breast height ( D 1 ) at T 1 are obtained by solving the following equations:
{ B A 1 = f G ( T 1 , S 1 , H 1 , Φ ^ G ) B A 1 = π / 40000 D 1 2 N 1 S 1 = N 1 ( D 1 / 20 ) 1.605
If we solve D 1 directly, after simplifying the equations, the objective function is changed to the following form:
f B A ( T 1 , N 1 ( D 1 / 20 ) 1 . 605 , H 1 , F ^ G ) π / 40000 D 1 2 N 1 = 0
while solving S 1 directly, the objective function is:
f G ( T 1 , S 1 , H 1 , Φ ^ G ) π / 100 ( S 1 / N 1 ) 2 / 1.605 N 1 = 0
The dichotomy iteration algorithm was employed to solve the above Equations (9) or (10) to obtain D 1 or S 1 , and then we computed B A 1 .
Step 3: Compute B A I using the following equation:
B A I = B A 1 B A 0
We present a framework with all the computational steps through which BAPP was derived (Figure 3). The codes for the GS&DIA implemented in ForStat 2.2 (a statistical software with specific forestry analytical tools developed by the Chinese Academy of Forestry, Beijing, China, see [30]) are given in the Supplementary Code S1. All other calculations were also performed using ForStat 2.2 software.

2.3. BARP

The BARP is defined as the difference between the basal area of a stand for the two succeeding stand ages ( T 0 and T 0 + 1 ) with a 1-year interval. However, in practice, it is impossible to conduct field surveys every year, especially for large-scale surveys. To address this problem, we proposed a reliable method for calculating the BARP. Two main functions of the BARP are:
(i) To verify computational method of the BAPP. The values of BAPP must be greater than or equal to those of the BARP, otherwise the values of BAPP would be meaningless.
(ii) To evaluate the realized stand growth status using the following equation:
Δ = BAPP BARP ,
where Δ is the potential for improving the BAI of the objective stand.
The computational procedures of BARP are similar to those in subprogram A for BAPP. It should be noted that, unlike the BAPP calculation, the stand characteristics, including T and S from field surveys, should be provided for the BARP calculation.

2.4. Stand Mean Height and Stand Basal Area Growth Models

Based on the work of Zhu et al. [26], we used the Richards’ height growth model (Equation (12)):
H = a i [ 1 exp ( b i T ) ] c i + ε
where H and T are sample plot-level arithmetic mean height (m) and stand age (year), respectively; Φ ^ H i = ( a i , b i , c i ) T is a parameter vector of the i t h site group; and ε is an error term.
The Richards’ B A growth model from an integrated stand growth model, as proposed by Tang et al. [31], was applied to estimate the site productivity of stand types I and II:
B A = β 1 i H [ 1 exp ( β 2 ( S / 10000 ) β 3 T ) ] β 4 + ε
where B A is the stand basal area (m2 ha−1); S is the stand density index; H and T are the same as in Equation (12); and Φ ^ B A i = ( β 1 i , β 2 , β 3 , β 4 ) T ( i = 1 , ... , 10 ) is the parameter vector, in which β 1 i is related to the site group. We estimated Equations (12) and (13) using ONLS and evaluated their fitting performance by coefficient of determination ( R 2 ):
R 2 = 1 ( y j y ^ j ) 2 / ( y j y ¯ ) 2
where y j and y ^ j are the observed and predicted H or B A , respectively, for the j t h observation, and y ¯ is the mean H or B A of the observations.

3. Results

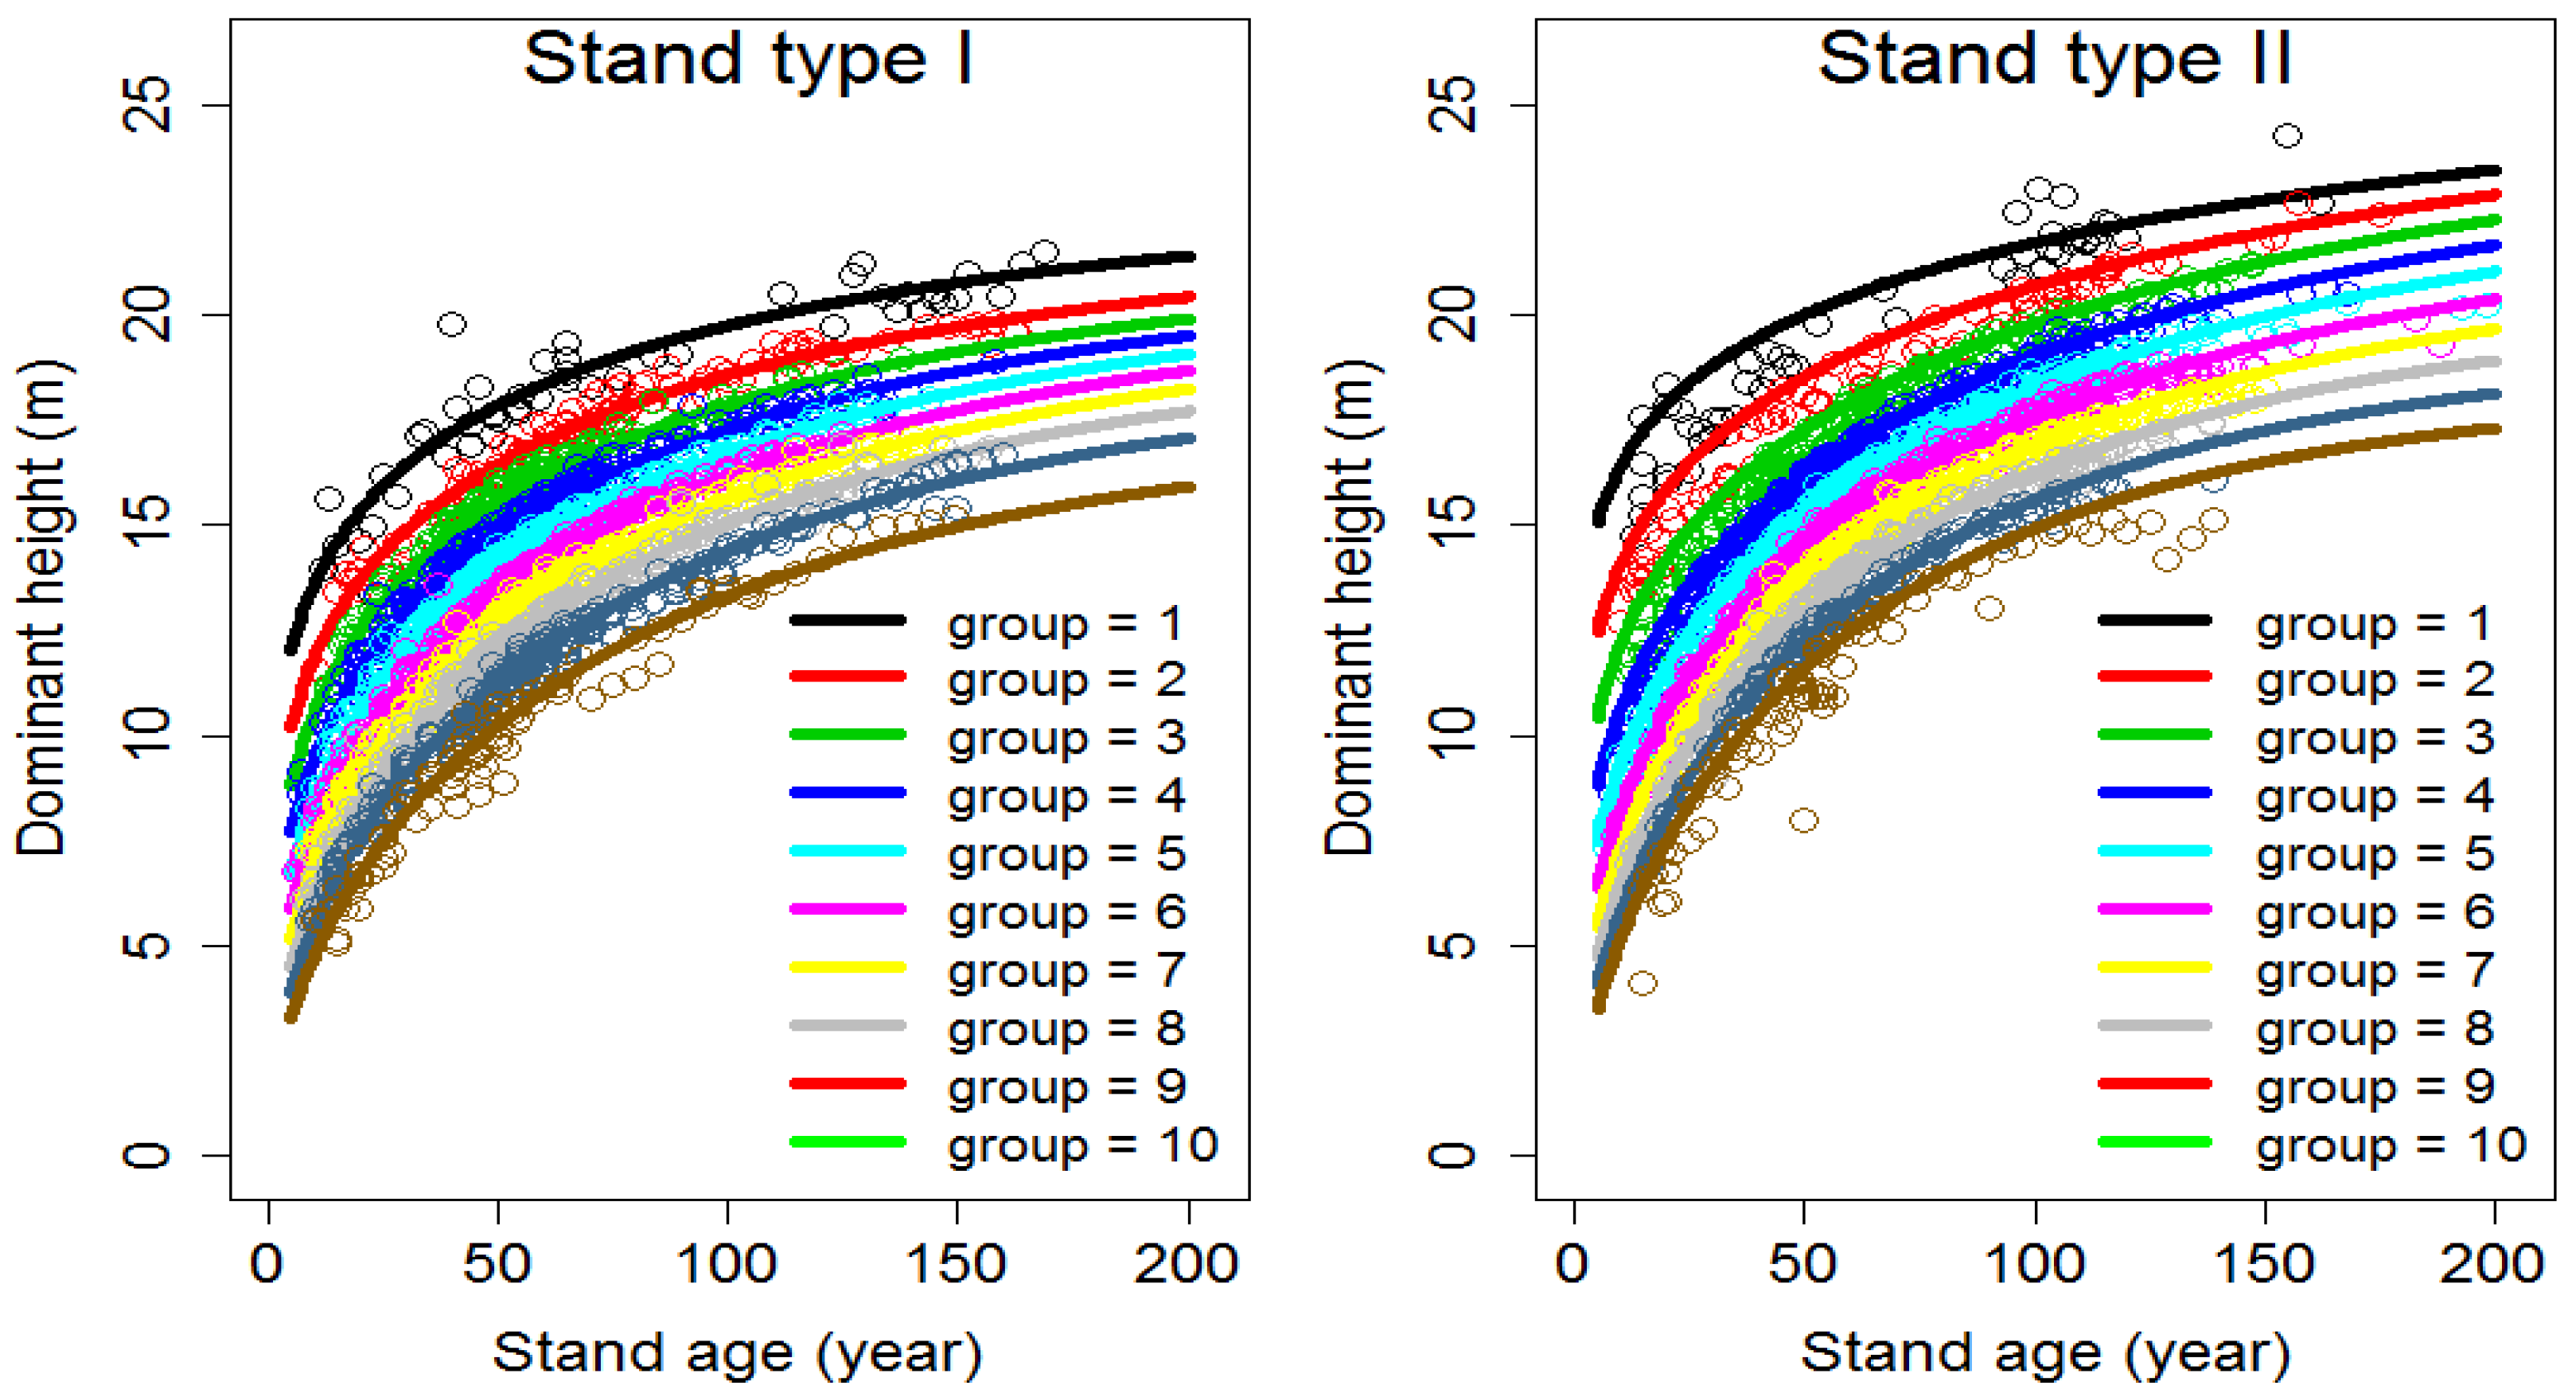
3.1. Parameter Estimation

The parameter estimates of Equations (12) and (13) fitted by OLS regression are listed in Table 2. All parameter estimates for both models were significant (p < 0.05). Based on the fit statistics, the R 2 of Equation (12) was 0.987 and 0.978 for stand types I and II, respectively. For Equation (13), R 2 for the same stands was 0.956 and 0.945, respectively. This shows that both models fitted the data adequately well.

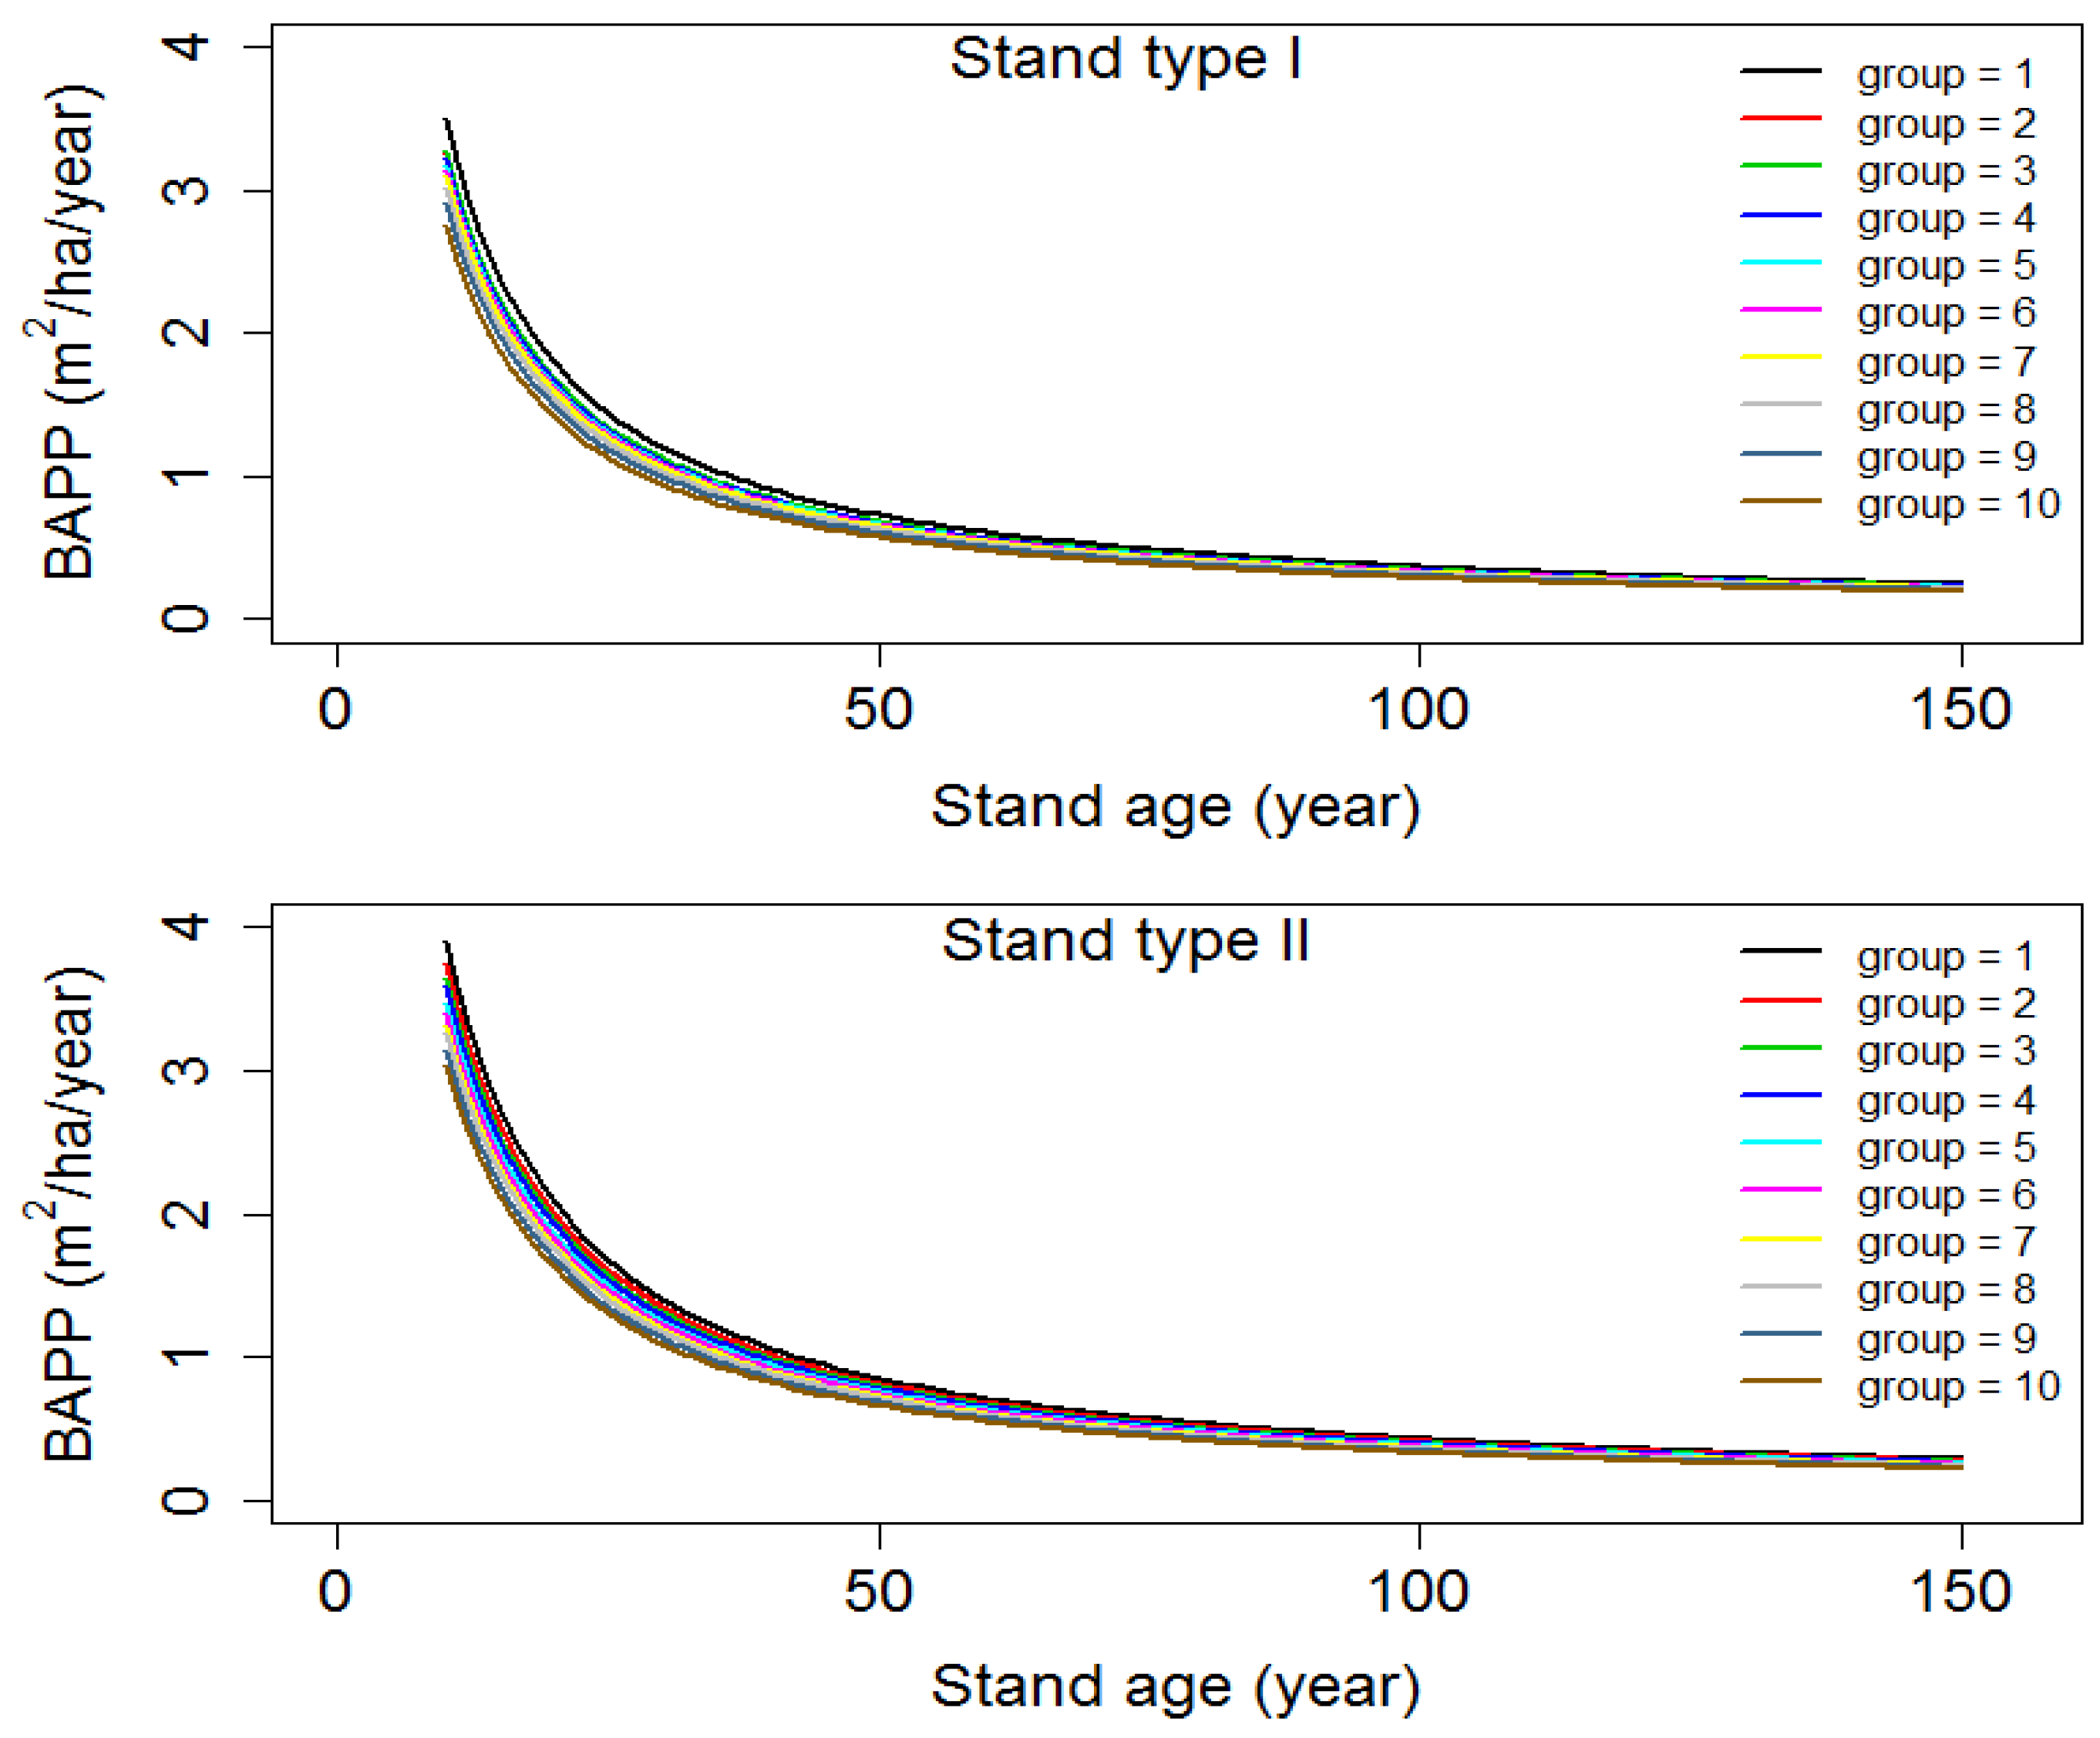
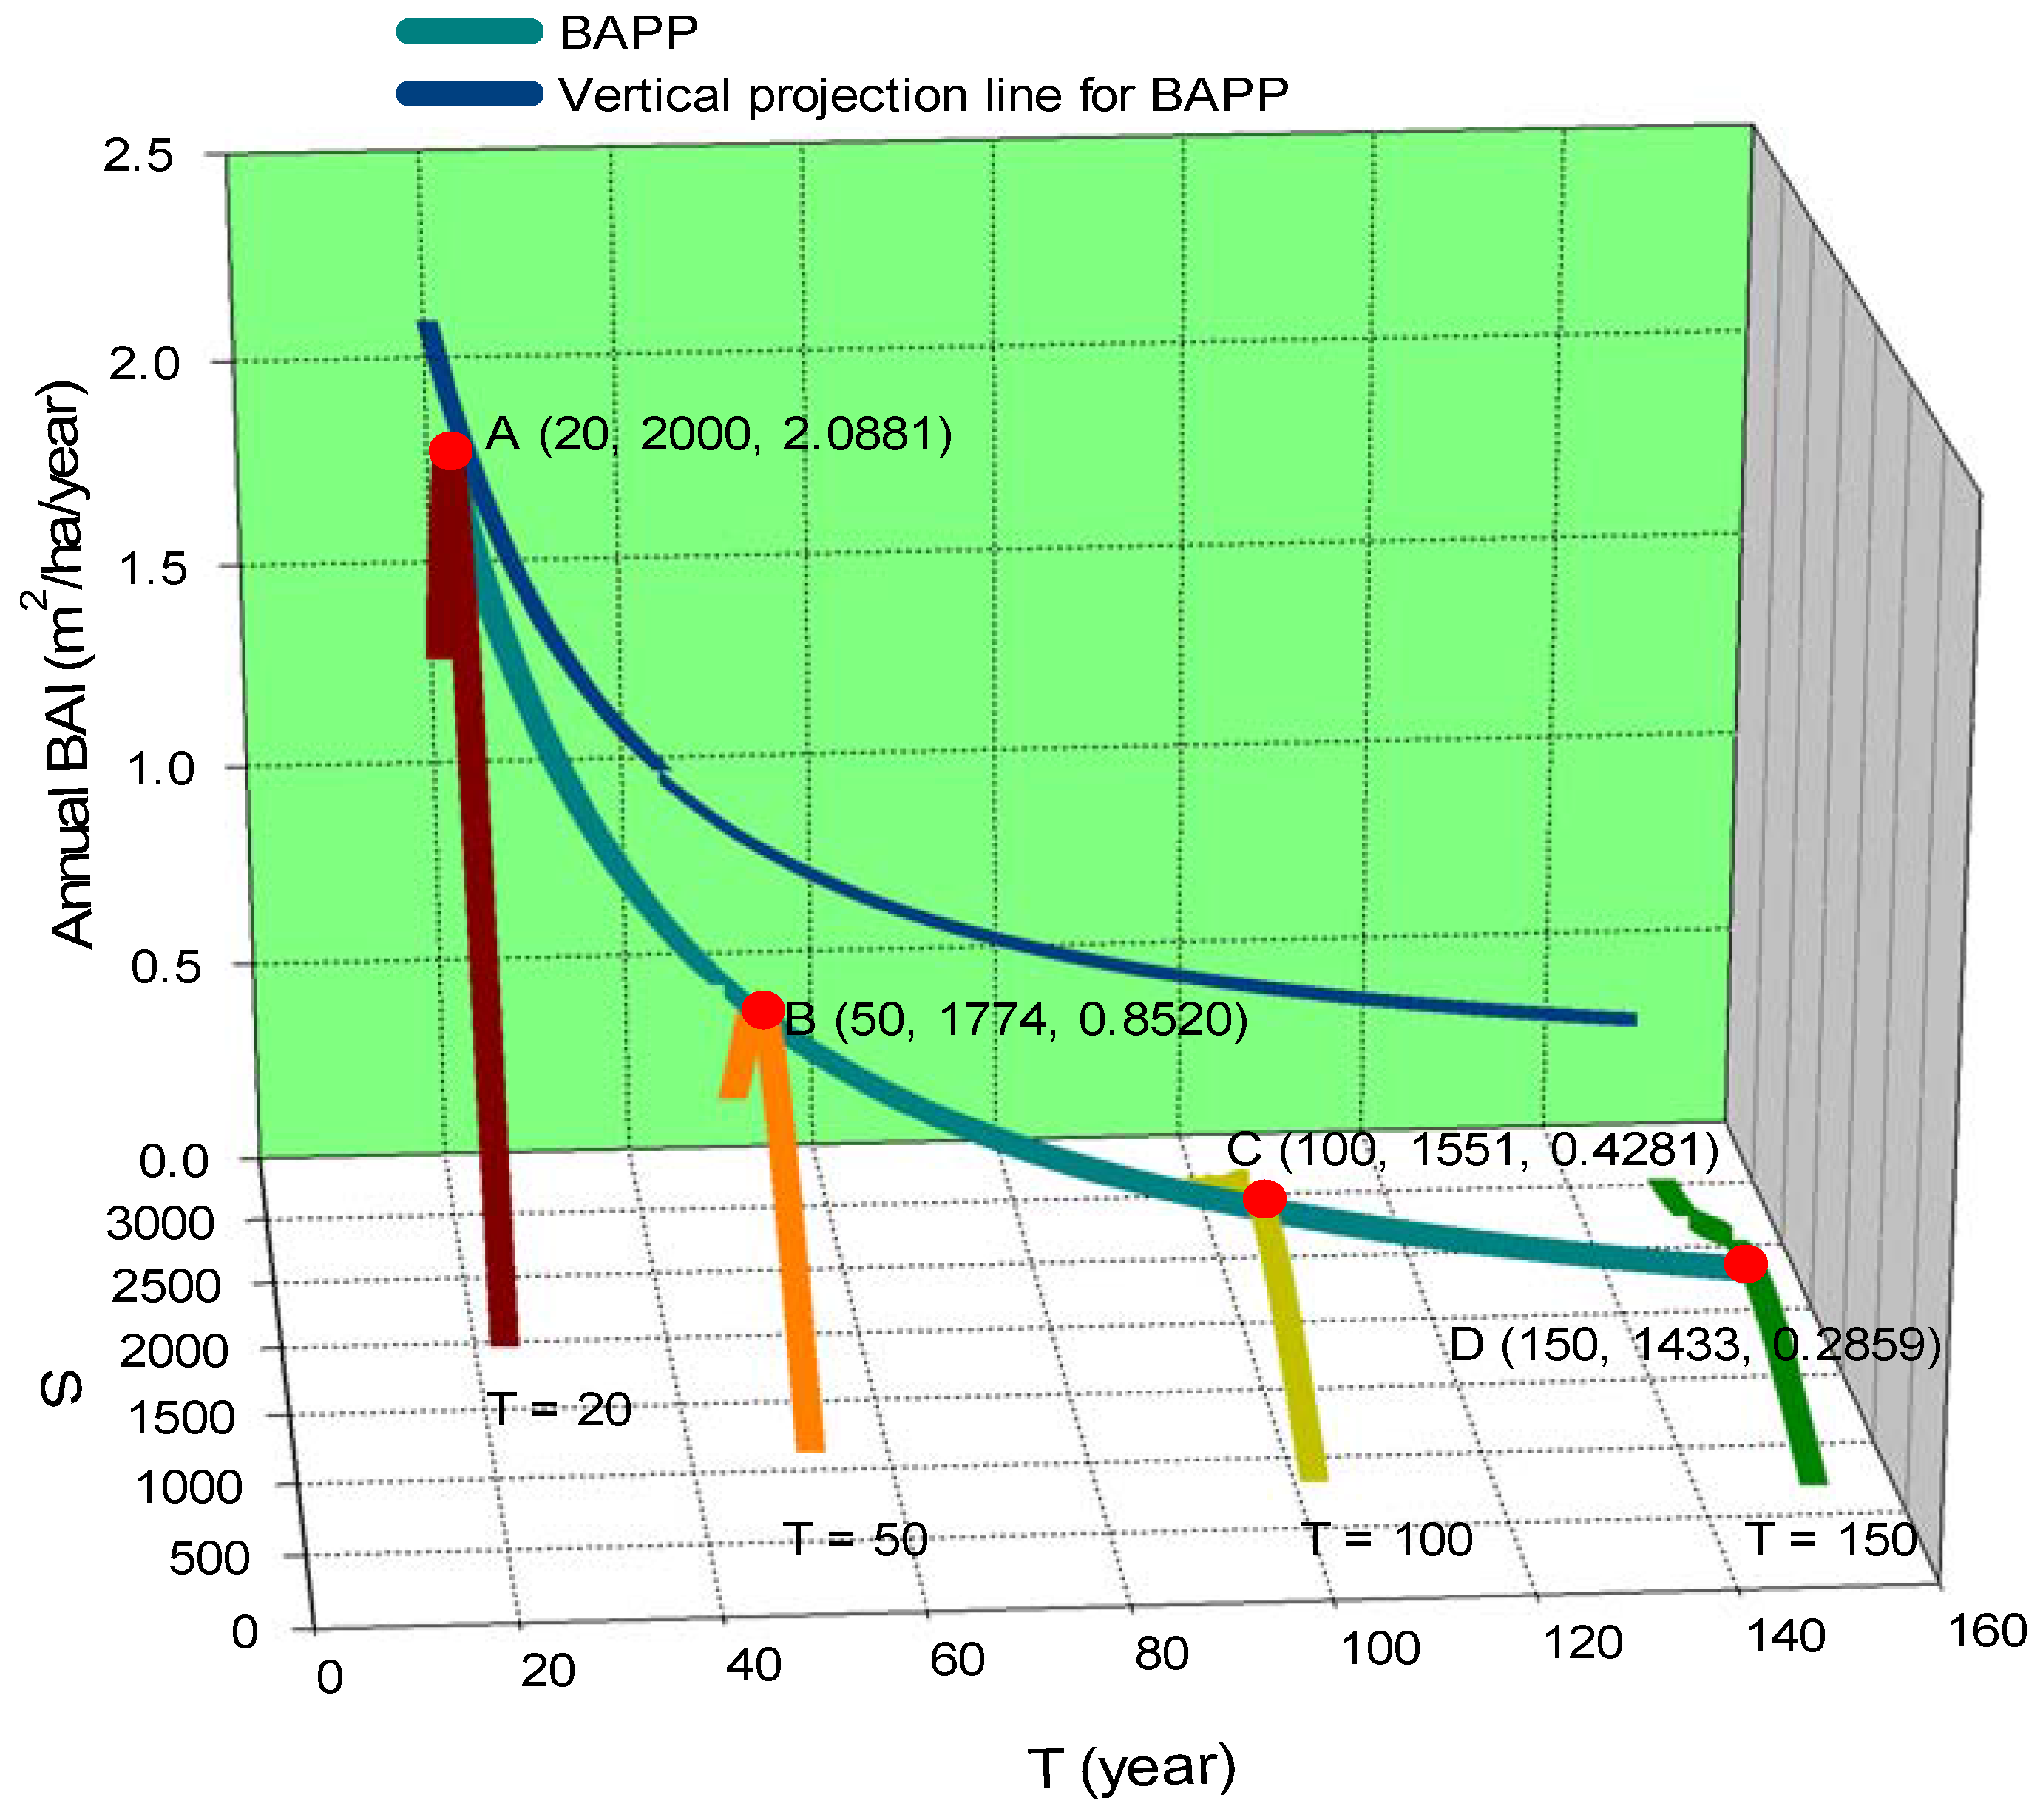
3.2. BAPP Calculation

BAPPs under ten site groups for stand types I and II were obtained using GS&DIA based on Equations (12) and (13) with the known parameters estimates (Table 2). Using stand type I as an example, we presented the computational details of BAPP. The application conditions for computing BAPP of a stand type I are listed below:
(i)
Equation (12) was used as a H growth model, and its parameter estimates are given in Table 2;
(ii)
Equation (13) was used as a B A growth model, and its parameter estimates are listed in Table 2;
(iii)
Ten site groups denoted by group   =   1 , ... , 10 were applied.
(iv)
The feasible range of T ranged from 10 to 150 years.
(v)
A 50-year base age ( T 0 ) was used.
(vi)
The feasible region of S ranged from 30 to 3000.
The BAPP at T was obtained by seeking an optimal stand density index, S ˜ , from the given feasible range (30, 3000) that maximized the objective function (Equation (1)). For example, Figure 4 shows the relationship of annual BAI and S for the feasible region 30 S 3000 when T = 20 years (young), 50 years (middle-aged), 100 years (sub-mature), and 150 years (mature) for the first site group ( group   =   1 ). For each specific T ( T = 20, 50, 100, and 150 years), the relationship of B A I and S exhibited a single curve; thus, the maximum annual BAI (culmination point) on this curve is a BAPP at T .
The values of S for the culmination points decreased as T increased (Figure 4), meaning that S ˜ was negatively correlated with T . In addition, BAPP and T were also negatively correlated. The connection of all culmination points at different values of T within its feasible region (e.g., 10 T 150 ) formed a three-dimensional curve of BAPP (the green line in Figure 4). This curve depicts the correlation between B A P P and S ˜ at different values of T for the multi-aged oak-dominated mixed stands (stand type I). Three-dimensional curves of BAPP could be projected as two-dimensional ones based on T , which would be simpler. This simplified curve is defined as a BAPP curve for stand type I (the blue line in Figure 4).
For different site groups in each stand type, there were negative correlations between BAPP and T . For a specific T , BAPP and site group ( group = 10 ) were also negatively correlated (i.e., BAPP decreased with increasing site group (Figure 5)). These results are consistent with the definition of the site groups, where the first site group denotes the highest site quality and the last site group denotes the lowest site quality of the stands.

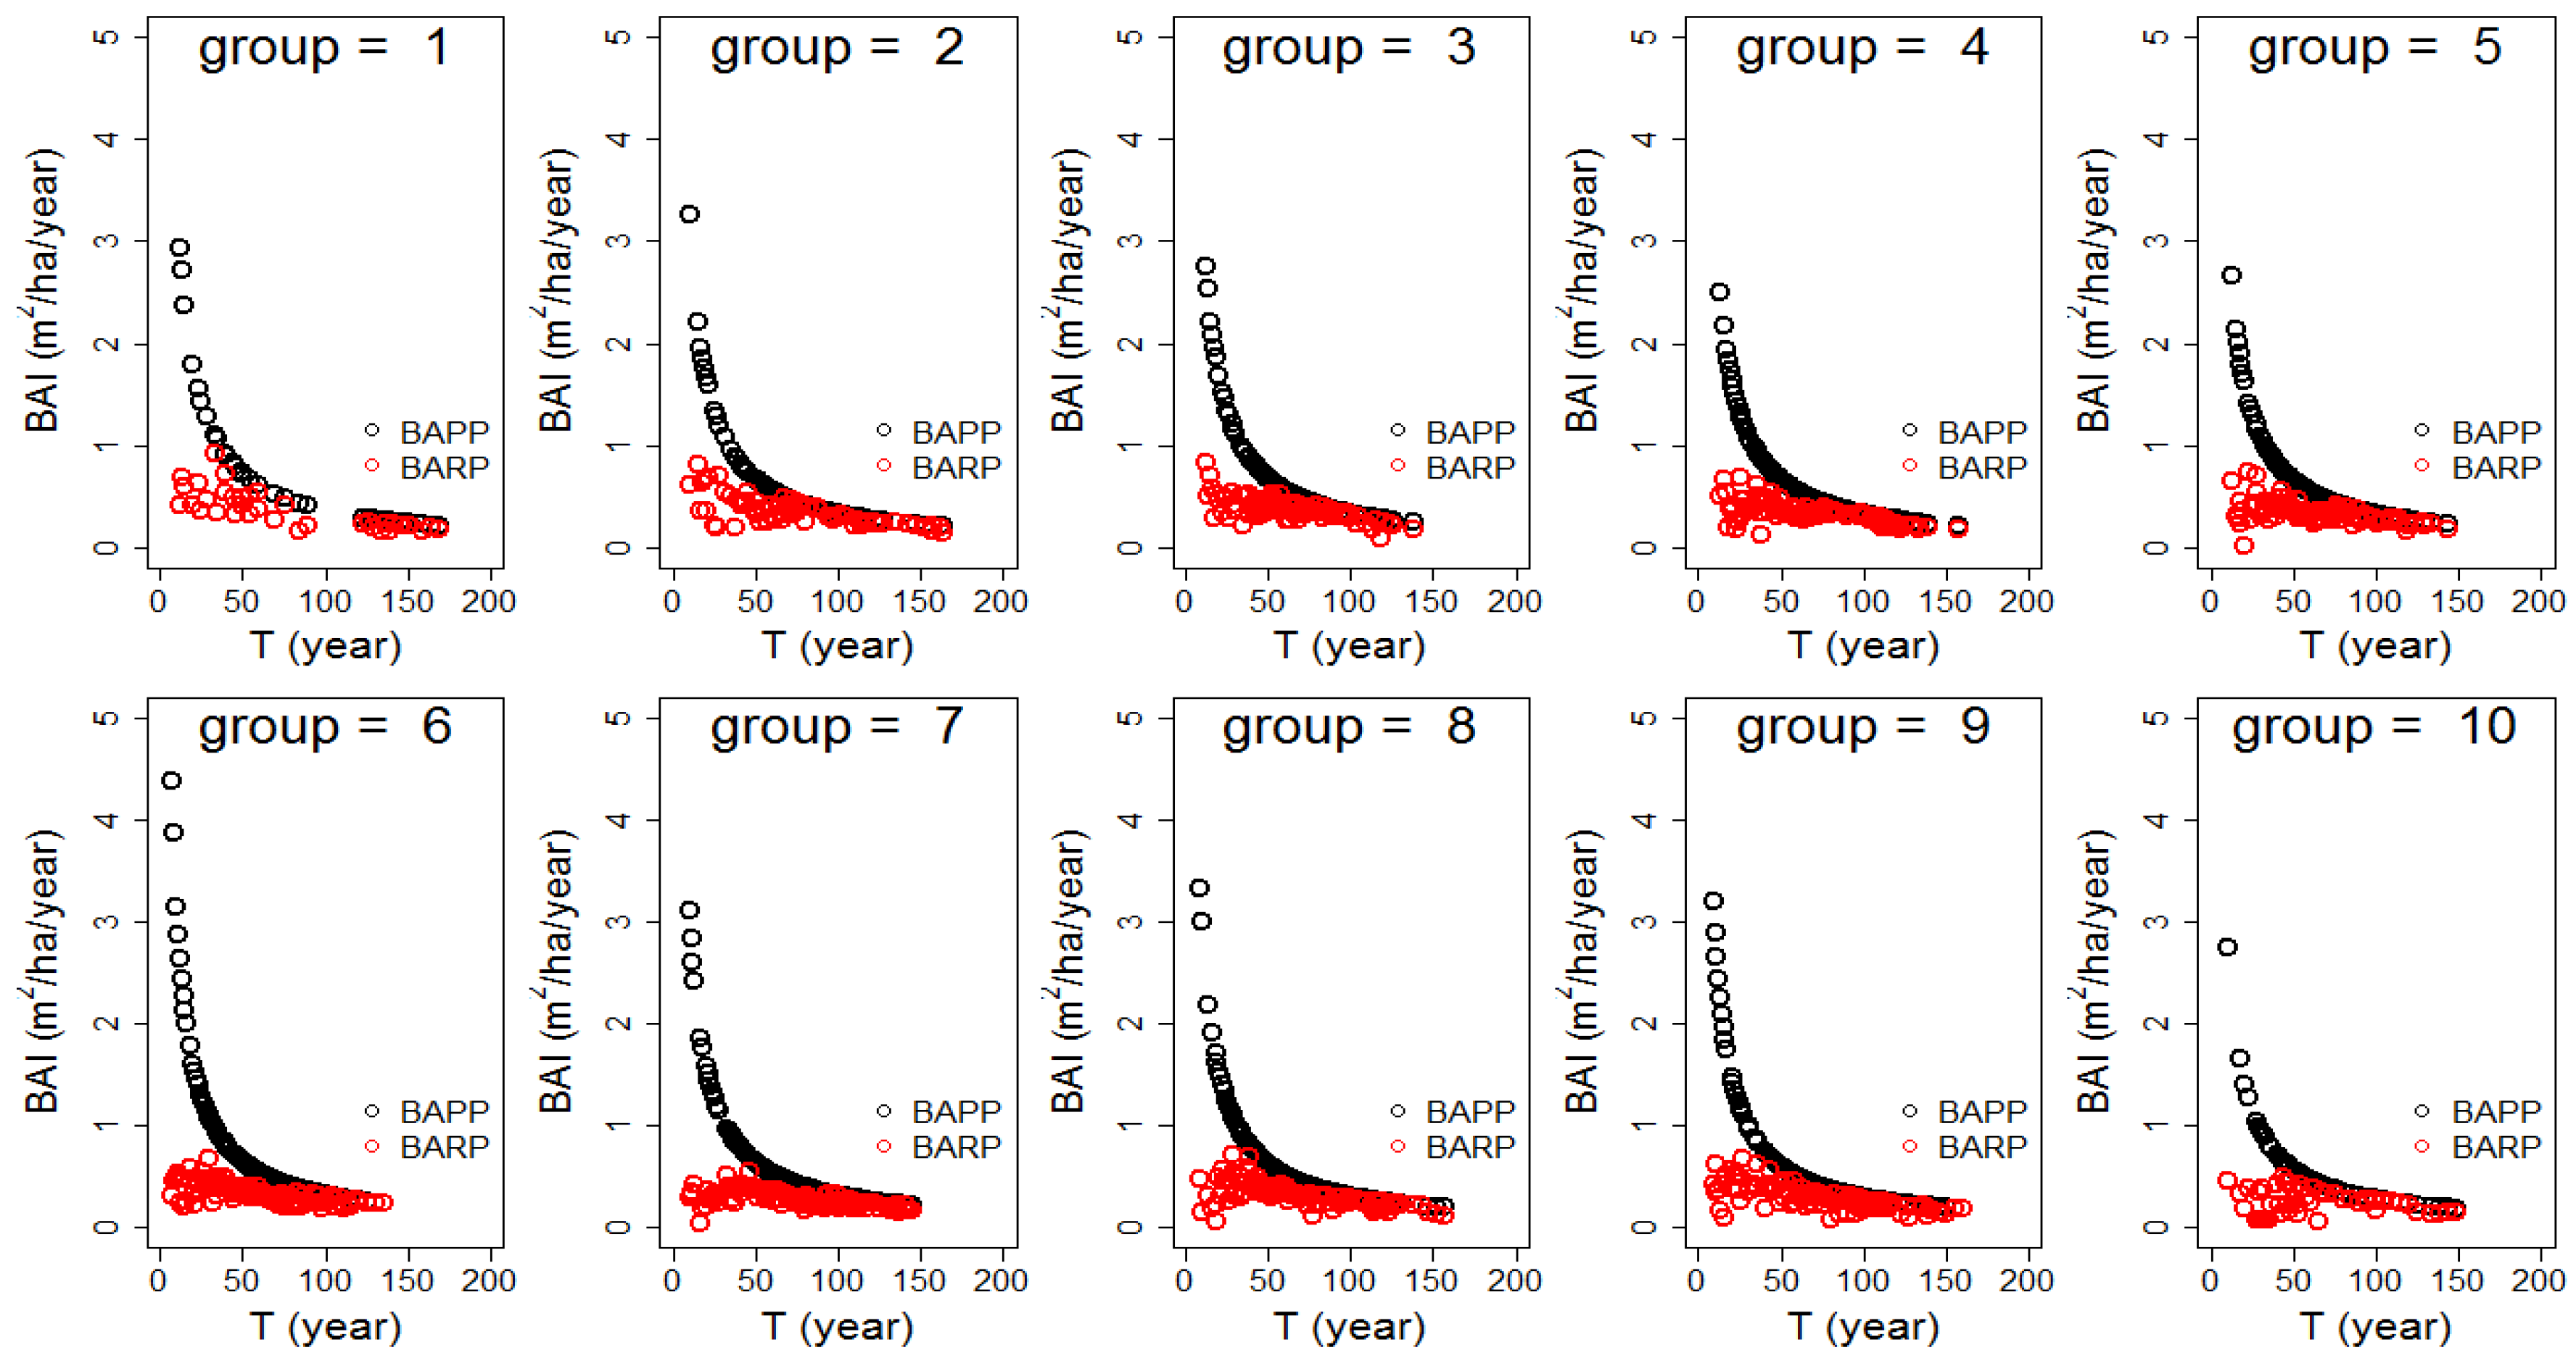
3.3. BAPP Verification

The BARPs of all the PSPs for both stand types were obtained using Equations (12) and (13) according to the computational method of BARP presented in Section 2.3. Figure 6 and Figure 7 show the BAPPs and BARPs of all PSPs for stand types I and II, respectively. The BAPP value of each PSP was larger than or equal to the value of the corresponding BARP for each site group.
For young and middle-aged stands, the differences of BARPs from BAPPs for stand types I and II were large. However, such difference decreased with increasing T . For each site group, the BARP values were much smaller than those of the BAPP, and BARPs tended to be closer to the corresponding BAPPs when a stand was getting more and more matured stages. In addition, for a specific T , BARP was always smaller than BAPP. However, when stands had higher site productivities and were managed more appropriately, both BARPs and BAPPs were almost identical (Figure 6 and Figure 7). These results suggest that BAPP could be used to assess site productivity effectively.

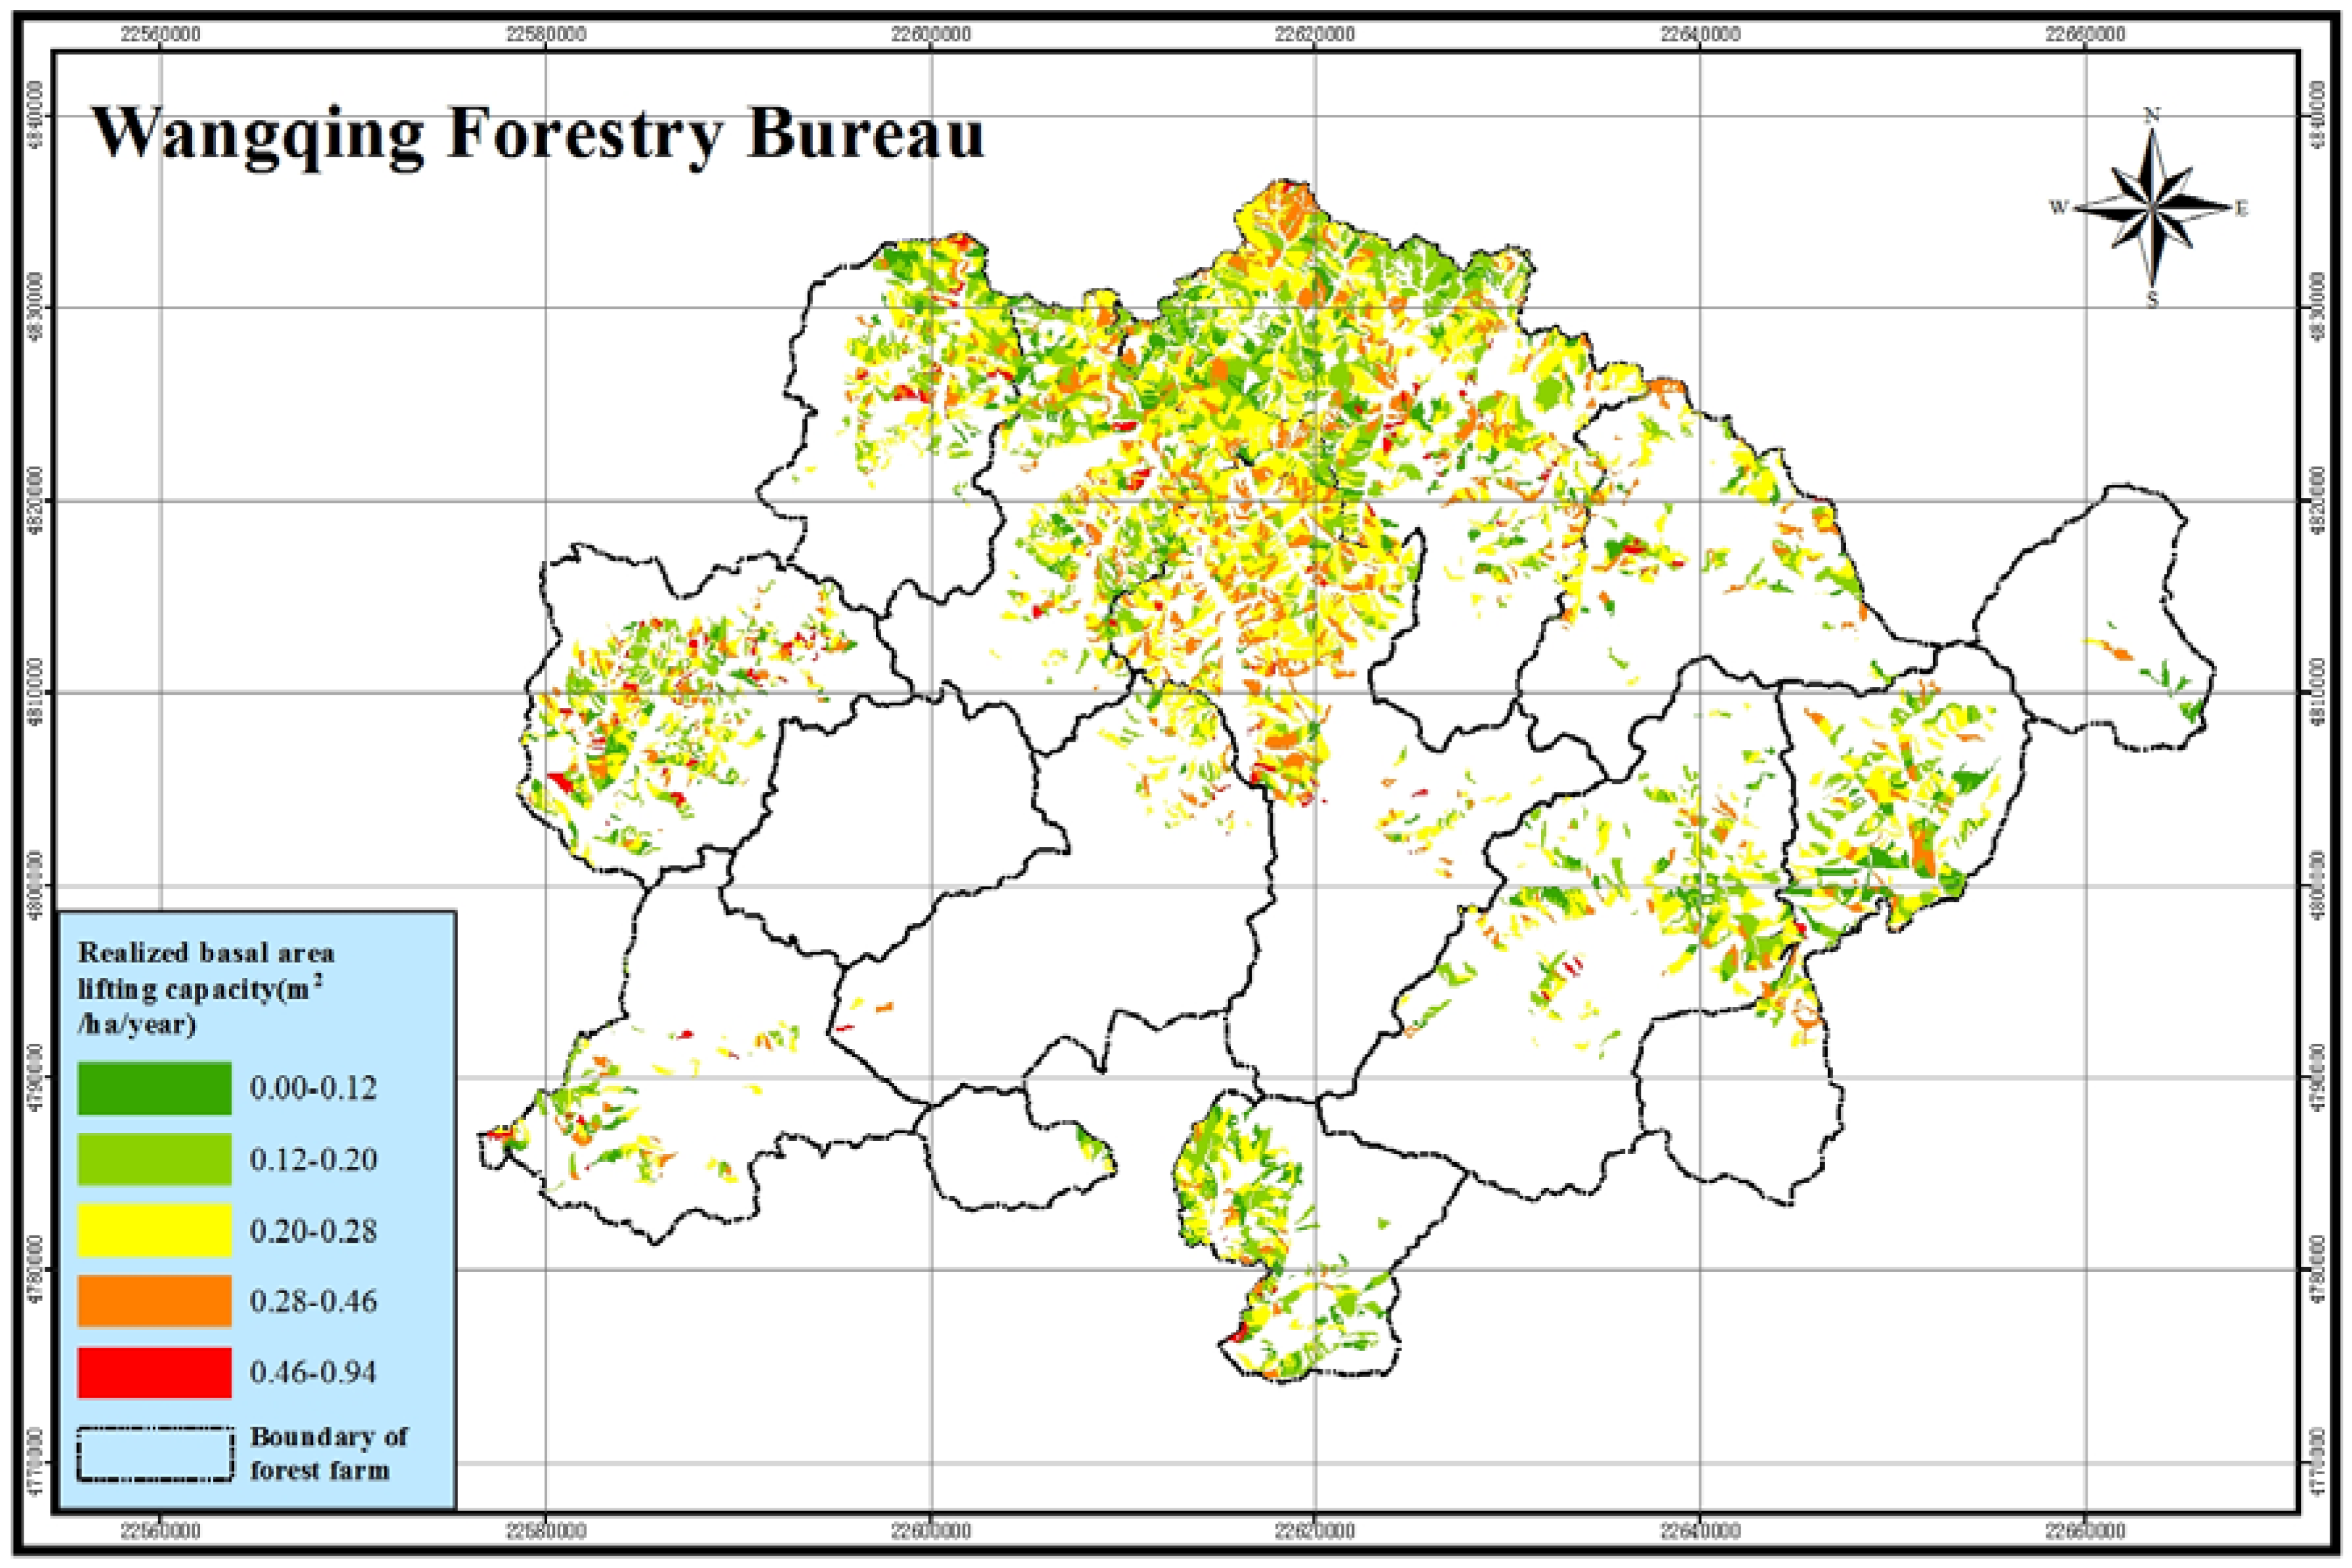
3.4. Application of BAPP in Forest Management

The BAPP is used to evaluate site productivity effectively. Based on the values of difference of the BARP from BAPP, three important questions for forest management could be answered during decision-making in forestry. As an example, we illustrated its application in the forest stands of Wangqing Forestry Bureau.
(i) How much could BAI of a stand be improved?
The potential improvement of the BAI of a stand at time T for each site group is given by
Δ B A I T = BAPP T BARP T
where B A I T is the potential basal area increment at time T , and BAPP T and BARP T are the basal area potential productivity and realized productivity, respectively, at time T . Using stand type I as an example, Δ B A I T at different values of T ( T = 10 , ... , 150 ) for the ten site groups ( group   =   1 , ... , 10 ) are displayed in Figure 8. The Δ B A I T (m2 ha−1) values at the base age ( T = 50 years) for the ten site groups ( group   =   1 , ... , 10 ) were 0.31, 0.22, 0.34, 0.26, 0.29, 0.32, 0.28, 0.24, 0.18, and 0.19, respectively. Similar results could be attained at forest management level-Wangqing Forestry Bureau (Figure 9).
(ii) When should the site quality of a stand be improved?
The optimal time for improving the site quality of a forest stand (e.g., via new or improved forest management treatments) could be determined with the help of the curves of the relationship between Δ B A I T and T (Figure 8). This figure shows that Δ B A I T decreased with increasing T for each site group. However, Δ B A I T first decreased rapidly before T = 50 and then relatively slowly after T = 50 . This clearly indicates that any tending operations should be applied to a stand before it becomes 50 years old. The stands could then be substantially improved when appropriate measures were applied in an appropriate range of stand ages.
(iii) What stand is given priority for improvement?
In forestry, stands with the best or worst site conditions are usually selected for improving the productivity. However, potential improvements of these stands are commonly ignored. In this study, the values of Δ B A I could be used to determine which stands should have priority for quality improvement. For example, stands with large values of Δ B A I might have small BARP and, thus, they would represent high-priority stands for quality improvement. In contrast, stands with smaller values of Δ B A I would have lower priority under proper management. Using stand type I as an example, according to the Δ B A I (m2 ha−1), the priorities of stand improvements at the base age ( T = 50 years) for the ten site groups are: group   =   3 ( Δ B A I = 0.34) > group   =   6 ( Δ B A I = 0.32) > group   =   1 ( Δ B A I = 0.31) > group   =   5 ( Δ B A I = 0.29) > group   =   7 ( Δ B A I = 0.28) > group   =   4 ( Δ B A I = 0.26) > group   =   1 ( Δ B A I = 0.23) > group   =   2 ( Δ B A I = 0.22) > group   =   10 ( Δ B A I = 0.19) > group   =   9 ( Δ B A I = 0.18). The values of Δ B A I can also be used to determine the priorities of the stands with different values of T .
Based on the abovementioned functions and provisions, BAPP could be applied for site productivity evaluation of stands at a large scale. Figure 9 shows the distribution of the potential improvement of BAI for stand type I at current stand age of each sub-compartment in the Wangqing Forestry Bureau, which is a main distribution region of this stand type in Jilin province based on the NFI data acquired in 2009. We could directly obtain the site quality class of any locations in the Wangqing Forestry Bureau in BA growth for stand type I in Figure 9. In addition, we could also know the potential improvement of the BAI for each sub-compartment with the management priority being their quality improvement. Therefore, the combination of the information given in Figure 9 and the abovementioned three questions could be useful for decision-making in forest management.

4. Discussion

Estimating forest site productivity is necessary for effective forest management and useful for evaluating basic site conditions for ecological field studies [32]. The high variability in silvicultural and ecological conditions for multi-aged and mixed species forests makes it difficult to use the dominant height–age index or the SI. For such conditions, as mentioned in the introduction section of this article, it is necessary to use alternative indices, such as basal area growth or diameter growth as productivity indices, and to integrate them into the stand structure or typology in the analyses [32]. In this study, we first proposed a new BAI-based index (i.e., BAPP) for measuring the site productivity of multi-aged and mixed species forests. This index is the maximum mean annual BAI at a given T and site condition for a specific stand, and the computational details of BAPP are presented. The BARP of mixed species stands was then used to verify this index. In addition, the application of BAPP was also demonstrated using the NFI time-series data from two types of multi-aged and mixed species forests in northeast China. The results showed that BAPP could be used to assess forest site productivity effectively. Meanwhile, BAPP also provides much reliable information for decision-making in forestry.
The SI derived from stand dominant height-dominant age model is empirical and based on two assumptions: (i) height growth is highly dependent on site quality and independent of competition effects or stand density effects; and (ii) height growth over time is asymptotic, reaching a maximum that is defined by site quality [33]. In practice, when dominant or co-dominant trees were selected as site trees to estimate the SI, an assumption was made that these trees have always been dominant or co-dominant and would continue to be so [34,35]. However, this assumption might be difficult to meet because dominant trees observed at the time of sampling might have been suppressed before. The dominant height-age relationship approach for site productivity estimation of multi-aged and mixed species forests was based upon the following three assumptions [12]: (i) decreasing tree taper (D divided by H) is associated with increasing site productivity [12]; (ii) stand density does not affect the height-diameter relationship of the dominant and co-dominant trees in the uneven-aged stands; and (iii) height growth over time is asymptotic, whereas diameter is not. The first and the third assumptions generally hold [12]. However, the second assumption is very difficult to meet because stand density is a very important factor related to competition effects that is well correlated with stand growth. As per BAPP, there are not any restrictions or assumptions to be made on height growth. This is because BAPP is a local maximum of B A I in a stand feasible region of S at a given T and it is obtained from empirical stand growth models by optimizing an iterative algorithm in theory. In addition, the effects of stand density on B A I also were included in the BAPP calculation. Therefore, relative to SI, BAPP is a more reliable and effective index for site quality evaluation of multi-aged and mixed species forests. Furthermore, B A I is a reliable indicator of sustainability of biomass or volume productions in mixed species stands [6,10,14].
In this study, both H and B A growth models were needed to determine BAPP. For a H growth model, T is the only predictor. This is useful, because adding other tree and stand predictors would increase forest inventory costs and the computational complexity of BAPP. Even though the Richards’ height growth model (Equation (12)) showed high fitting accuracy for stand types I and II, other model forms, such as exponential, logistics, Schumacher, and power functions, could also be used to develop height growth models [9,12,32,33,34,35,36,37]. The predictors in the B A growth model were restricted to T , S , and H when computing BAPP. In addition, the functional relationship of the B A I obtained from the B A growth model and S should be non-monotonic. The B A growth model (Equation (13)) in this study had the above-referenced characteristics. Similar to the results of the integrated stand growth model [31], this model (Equation (13)) also shows good performance for B A prediction.
Stand density index, S ˜ is negatively correlated with T (Figure 4), and this is consistent with the laws of stand growth. In forestry, the mean diameter at breast height of a stand increases and stand density decreases during self-thinning as T increases, which also causes S ˜ to decrease. Self-thinning and tree growth are the two common phenomena of the stands, and self-thinning is a natural process in which the numbers of trees per unit area decrease as the mean size of the trees increases over time [25,38]. It is a process intrinsic not only to the forest types used in this study, but also to all forest types and plant communities whose compositions and structures are influenced by competitive interactions among the individuals [25,38]. Stand attributes, such as mean height and mean diameter at breast height, are extremely difficult to measure when self-thinning occurs, which is more obvious in mixed species stands [25,38]. Therefore, in this study, the annual BAI of a stand was obtained based on the assumption that the density of the stand would remain stationary. In reality, the stands selected for estimating BAPP are relatively stable at a chosen base age. The self-thinning phenomenon is also not obvious for these stands, and therefore, the assumption of stand growth for the same trees is feasible for estimating BAPP. An additional self-thinning algorithm of stands needs to be developed if a modeler wants to include self-thinning in the BAPP computation. We are in the process of developing such algorithms.
The differences of BAPPs among the ten site groups were quantified by parametrizing the H and B A growth models (Figure 4, Figure 5 and Figure 6). The site quality of a stand decreased with increasing site groups (from group   =   1 to group   =   10 ). For both stand types, the values of BAPP at a specific T decreased with increasing site groups, which further suggests that the BAPP proposed in this study could be suitable for effectively assessing site productivity (Figure 5). In addition, at present, because of the state of abandonment and decay of the stands, it is necessary to establish a priority area where the resources should be allocated to improve the stands [39], and BAPP may be a key tool for this purpose.
The utility of any approach for estimating the site productivity of a multi-aged and mixed species stand is largely dependent on its application conditions. In reality, the application conditions for BAPP are easily met for different stands. The BAPP could provide a quick and simple approach for quantifying site productivity for multi-aged and mixed stands. The main drawback of this approach is that the accuracy of the site productivity estimates depends largely on the prediction accuracies of the H and B A growth models, as these models cause an uncertainty regarding the computation of BAPP. However, this should not be a major issue because of the rapid development of software and techniques that can be easily applied for modeling forest growth and site productivity. In addition, since BAPP was defined as the maximum annual BAI with the optimal stand density, it could guide silvicultural practices to adjust the stand density close to the optimal one. This needs to be further studied in the future.
It is worth noting that, because of the uncertainty in climate change (e.g., extreme climate), the predictions using empirical H and BA growth models (e.g., Equations (12) and (13)) should not be made very far ahead of the current conditions [40]. For making a short-term site quality evaluation (such as ten years or a shorter time interval), Equations (12) and (13) with the estimates of parameters could be directly applied because the structure of multi-aged and mixed forests and the site-related variables would not be obviously changed [41]. However, for making a long-term site quality evaluation, besides the growth of dominant species in the multi-aged and mixed forests spatially affected by climate change, the distribution of habitats and the structure of the multi-aged and mixed forests could also substantially change [42,43]. Therefore, when Equations (12) and (13) are used, sampling surveys for predicting H and B A of each multi-aged and mixed forest in a study area should be conducted spatially and periodically, and used to recalibrate and validate the existing models.

Supplementary Materials

Available online at www.mdpi.com/1999-4907/8/4/119/s1, Code S1: The codes for the golden section and dichotomy iteration algorithm implemented in ForStat 2.2.

Acknowledgments

This work was supported by the Forestry Public Welfare Scientific Research Project (grant No. 201504303) and the Chinese National Natural Science Foundation (grant Nos. 31470641, 31300534, and 31570628). We also appreciate the valuable comments and constructive suggestions from three anonymous referees and the Associate Editor that helped improve the manuscript.

Author Contributions

L.F., R.P.S., Y.L., X.L., and S.T. conceived the study. L.F., G.Z., H.L., L.H., H.G., G.D., and C.S. performed the analysis and wrote the initial draft of the paper. All authors contributed to interpreting results and the improvement of the paper.

Conflicts of Interest

The authors declare that they have no conflict of interest.

References

  1. Skovsgaard, J.P.; Vanclay, J.K. Forest site productivity: A review of the evolution of dendrometric concepts for even-aged stands. Forestry 2008, 81, 13–31. [Google Scholar] [CrossRef]
  2. Jiang, H.; Radtke, P.J.; Weiskittel, A.R.; Coulston, J.W.; Guertin, P.J. Climate- and soil-based models of site productivity in eastern US tree species. Can. J. For. Res. 2015, 45, 325–342. [Google Scholar] [CrossRef]
  3. Del Río, M.; Pretzsch, H.; Alberdi, I.; Bielak, K.; Bravo, F.; Brunner, A.; Condés, S.; Ducey, M.J.; Fonseca, T.; von Lüpke, N.; et al. Characterization of the structure, dynamics, and productivity of mixed-species stands: Review and perspectives. Eur. J. For. Res. 2016, 135, 23–49. [Google Scholar] [CrossRef]
  4. Schnur, G.L. Yield, Stand, and Volume Tables for Even-Aged Upland Oak Forests; USDA Technical Bulletin 560; US Department of Agriculture: Washington, DC, USA, 1937.
  5. Carmean, W.H. Forest site quality evaluation in the United States. Adv. Agron. 1975, 27, 209–267. [Google Scholar]
  6. Vanclay, J.K. Assessing site productivity in tropical moist forests. For. Ecol. Manag. 1992, 54, 257–287. [Google Scholar] [CrossRef]
  7. Pokharel, B.; Dech, J.P. An ecological land classification approach to modeling the production of forest biomass. For. Chron. 2011, 87, 23–32. [Google Scholar] [CrossRef]
  8. Sharma, R.P.; Brunner, A.; Eid, T. Site index prediction from site and climate variables for Norway spruce and Scots pine in Norway. Scand. J. For. Res. 2012, 27, 619–636. [Google Scholar] [CrossRef]
  9. Sharma, R.P.; Brunner, A.; Eid, T.; Øyen, B.-H. Modelling dominant height growth from national forest inventory individual tree data with short time series and large age errors. For. Ecol. Manag. 2011, 262, 2162–2175. [Google Scholar] [CrossRef]
  10. Berrill, J.; O’Hara, K.L. Estimating site productivity in irregular stand structures by indexing the basal area or volume increment of the dominant species. Can. J. For. Res. 2014, 44, 92–100. [Google Scholar] [CrossRef]
  11. Monserud, R.A. Height growth and site index curves for inland Douglas-fir based on stem analysis data and forest habitat type. For. Sci. 1984, 30, 943–965. [Google Scholar]
  12. Huang, S.; Titus, S.J. An index of site productivity for uneven-aged or mixed-species stands. Can. J. For. Res. 1993, 23, 558–562. [Google Scholar] [CrossRef]
  13. Peng, C. Growth and yield models for uneven-aged stands: Past, present and future. For. Ecol. Manag. 2000, 132, 259–279. [Google Scholar] [CrossRef]
  14. Pokharel, B.; Froese, R.E. Representing site productivity in the basal area increment model for FVS-Ontario. For. Ecol. Manag. 2009, 258, 657–666. [Google Scholar] [CrossRef]
  15. Aertsen, W.; Kint, V.; Van Orshoven, J.; Özkan, K.; Muys, B. Comparison and ranking of different modelling techniques for prediction of site index in Mediterranean mountain forests. Ecol. Model. 2010, 221, 1119–1130. [Google Scholar] [CrossRef]
  16. Herrera-Fernández, J.J.; Campos, J.J.; Kleinn, C. Site productivity estimation using height-diameter relationships in Costa Rican secondary forests. Investig. Agrar. Sist. Recur. Fo. r 2004, 13, 295–303. [Google Scholar]
  17. Diaci, J.; Kerr, G.; O’Hara, K. Twenty-first century forestry: Integrating ecologically based, uneven-aged silviculture with increased demands on forests. Forestry 2011, 84, 463–465. [Google Scholar] [CrossRef]
  18. State Forestry Administration of China (SFA). Technical Regulation on Sample Collections for Tree Biomass Modeling; China Standard Press: Beijing, China, 2015; 11p. (In Chinese) [Google Scholar]
  19. Chen, Y.F. Research on standard age affecting analysis of site quality evaluation. For. Res. 2010, 23, 283–287, (In Chinese with English Abstract). [Google Scholar]
  20. Shen, C.C.; Lei, X.D.; Liu, H.Y.; Wang, L.L.; Liang, W.J. Potential impacts of regional climate change on site productivity of Larixolgensis plantations in Northeast China. iForest 2015, 8, 642–651. [Google Scholar] [CrossRef]
  21. Zhao, L.; Ni, C.C.; Nigh, G. Generalized algebraic difference site index model for ponderosa pine in British Columbia, Canada. Sci. Silva. Sin. 2012, 48, 74–81, (In Chinese with English Abstract). [Google Scholar]
  22. Raulier, F.; Lambert, M.; Pothier, D.; Ung, C. Impact of dominant tree dynamics on site index curves. For. Ecol. Manag. 2003, 184, 65–78. [Google Scholar] [CrossRef]
  23. Rozas, V. Tree age estimates in Fagus sylvatica and Quercusrobur: Testing previous and improved methods. Plant. Ecol. 2003, 167, 193–212. [Google Scholar] [CrossRef]
  24. Reineke, L.H. Perfecting a stand-density index for even-aged forests. J. Agric. Res. 1933, 46, 627–638. [Google Scholar]
  25. Tang, S.; Meng, C.H.; Meng, F.; Wang, Y.H. A growth and self-thinning model for pure even-age stands: Theory and applications. For. Ecol. Manag. 1994, 70, 67–73. [Google Scholar] [CrossRef]
  26. Zhu, G. Site Quality Classification and Site Productivity Evaluation for Forest Lands in Jilin Province; Postdoctoral Research Report; Chinese Academy of Forestry: Beijing, China, 2015. (In Chinese) [Google Scholar]
  27. Lou, M.; Zhang, H.; Lei, X.; Li, C.; Zang, H. Spatial Autoregressive Models for Stand Top and Stand Mean Height Relationship in Mixed Quercus mongolica Broadleaved Natural Stands of Northeast China. Forests 2016, 7, 43. [Google Scholar] [CrossRef]
  28. Schwefel, P.H.P. Evolution and Optimum Seeking: The Sixth Generation; John Wiley & Sons, Inc.: New York, NY, USA, 1993. [Google Scholar]
  29. Tang, S.Z.; Li, Y.; Fu, L.Y. Statistical Foundation for Bio-Mathematical Models, 2nd ed.; Higher Education Press: Beijing, China, 2015; 435p. (In Chinese) [Google Scholar]
  30. Tang, S.; Lang, K.; Li, H. Statistical and Biological Mathematical Model (ForStat Tutorial); Science Press: Beijing, China, 2008; 584p. (In Chinese) [Google Scholar]
  31. Tang, S. Integrated stand growth model of Masson pine (Pinusmassoniana Lamb.) and its application. For. Res. 1991, 4, 8–14, (In Chinese with English Abstract). [Google Scholar]
  32. Adame, P.; Cañellas, I.; Roig, S.; Río, M.D. Modelling dominant height growth and site index curves for rebollo oak (Quercuspyrenaica Willd.). Ann. For. Sci. 2006, 63, 929–940. [Google Scholar] [CrossRef]
  33. Sturtevant, B.R.; Seagle, S.W. Comparing estimates of forest site quality in old secon-growth oak forests. Forest Ecol. Manag. 2004, 191, 311–328. [Google Scholar] [CrossRef]
  34. Smith, V.G. Asymptotic site-index curves, fact or artifact? For. Chron. 1984, 60, 150–156. [Google Scholar] [CrossRef]
  35. Alemdag, I.S. National site-index and height-growth curves for white spruce growing in natural stands in Canada. Can. J. For. Res. 1991, 21, 1466–1474. [Google Scholar] [CrossRef]
  36. Meng, S.X.; Huang, S. Improved calibration of nonlinear mixed-effects models demonstrated on a height growth function. For. Sci. 2009, 55, 239–248. [Google Scholar]
  37. Fu, L.Y.; Li, Y.C.; Li, C.M.; Tang, S.Z. Study of the dominant height for Chinese Fir plantation using two-level nonlinear mixed effects model. For. Res. 2011, 24, 720–726, (In Chinese with English Abstract). [Google Scholar]
  38. Tang, S.; Meng, F.; Meng, C. The impact of initial stand density and site index on maximum stand density index and self-thinning index in a stand self-thinning model. For. Ecol. Manag. 1995, 75, 61–68. [Google Scholar] [CrossRef]
  39. Cañellas, I.; Del Río, M.; Roig, S.; Montero, G. Growth response to thinning in Quercuspyrenaica Willd. coppice stands in Spanish central mountain. Ann. For. Sci. 2004, 61, 243–250. [Google Scholar] [CrossRef]
  40. Knutti, R. Should we believe model predictions of future climate change? Philos. Trans. R. Soc. 2008, 366, 4647–4664. [Google Scholar] [CrossRef] [PubMed]
  41. Wang, C. Biomass allometric equations for 10 co-occurring tree species in Chinese temperate forests. For. Ecol. Manag. 2006, 222, 9–16. [Google Scholar] [CrossRef]
  42. Leng, W.; He, H.S.; Bu, R.; Dai, L.; Hu, Y.; Wang, X. Predicting the distributions of suitable habitat for three larch species under climate warming in Northeastern China. For. Ecol. Manag. 2008, 254, 420–428. [Google Scholar] [CrossRef]
  43. Lei, X.; Yu, L.; Hong, L. Climate-sensitive integrated stand growth model (CS-ISGM) of Changbai larch (Larixolgensis) plantations. For. Ecol. Manag. 2016, 376, 265–275. [Google Scholar] [CrossRef]
Figure 1. Location of the permanent sample plots (PSPs) in two main multi-aged and mixed species stands (859 PSPs in oak-dominated stands (stand type I) and 1053 PSPs in other broadleaf stands (stand type II)) distributed across the middle and eastern parts of Jilin Province in northeast China.
Forests 08 00119 g001
Figure 2. The relationships of stand mean height and stand age for ten site groups (group = 1, 2, …, 10) for oak-dominated stands (stand type I) and other broadleaf stands (stand type II).
Forests 08 00119 g002
Figure 3. A framework showing all important computational steps to derive the basal area potential productivity index (BAPP).
Forests 08 00119 g003
Figure 4. The distribution of the annual basal area increment ( B A I ) and stand density index ( S ) for the first site group ( group   =   1 ) at the stand ages of T = 20, 50, 100, and 150 years for oak-dominated stands.
Forests 08 00119 g004
Figure 5. The clusters of stand basal area potential productivity (BAPP) curves with group   =   1 , ... , 10 for oak-dominated stands (stand type I) and other broadleaf stands (stand type II).
Forests 08 00119 g005
Figure 6. The basal area potential productivity (BAPP) and basal area realized productivity (BARP) of each permanent sample plot against stand age T for group   =   1 , ... , 10 for stand type I. B A I is the annual basal area increment.
Forests 08 00119 g006
Figure 7. The basal area potential productivity (BAPP) and basal area realized productivity (BARP) of each permanent sample plot against stand age T for group   =   1 , ... , 10 for stand type II. B A I is the annual basal area increment.
Forests 08 00119 g007
Figure 8. The potential improvement of the annual basal area increment ( Δ B A I ) for each permanent sample plot of oak-dominated stands for the ten site groups ( group   =   1 , ... , 10 ), where T is the stand age.
Forests 08 00119 g008
Figure 9. The distribution of the potential improvement of the basal area increment of stand type I at the current stand age of each sub-compartment in the Wangqing Forestry Bureau, which is a main distribution region of this stand type in Jilin province based on the national forest inventory data acquired in 2009.
Forests 08 00119 g009
Table 1. Summary statistics of the stand variables for two main multi-aged and mixed species stand types: oak-dominated stands (stand type I) and other broadleaf stands (stand type II) ( B A , stand basal area (m2 ha−1); S , stand density index; T , stand age (years); H , stand mean height (m); Std., standard deviation).
Stand TypeVariableMax.Min.MeanStd.
I B A (m2 ha−1)61.190.2120.8710.30
S 1857.9710.45731.24321.56
T (year)16965929
H (m)21.515.0413.512.71
II B A (m2 ha−1)55.470.0718.939.15
S 1541.273.90651.37279.07
T (year)19876331
H (m)24.244.1115.082.81
Table 2. Parameter estimates of Equations (12) and (13) for stand types I and II; a , b , c are the parameters of Equation (12), and β 1 , β 2 , β 3 , β 4 are the parameters of Equation (13).
Stand TypeSite GroupEquation (12)Equation (13)
a b c β 1 β 2 β 3 β 4
I group   =   1 22.88150.00590.181857.337054.42065.44390.1843
group   =   2 22.00100.00630.221668.012654.42065.44390.1843
group   =   3 21.56560.00670.261566.646654.42065.44390.1843
group   =   4 21.21490.00700.301372.828454.42065.44390.1843
group   =   5 20.80840.00740.341262.874454.42065.44390.1843
group   =   6 20.41390.00780.381060.264754.42065.44390.1843
group   =   7 19.95690.00820.420964.676454.42065.44390.1843
group   =   8 19.38550.00860.460767.797154.42065.44390.1843
group   =   9 18.67870.00900.500665.648454.42065.44390.1843
group   =   10 17.41380.00940.540465.458654.42065.44390.1843
II group   =   1 27.53750.00160.125370.166311.65755.14630.1919
group   =   2 26.50080.00280.176783.132011.65755.14630.1919
group   =   3 25.46420.00400.228080.112611.65755.14630.1919
group   =   4 24.42750.00520.279483.950611.65755.14630.1919
group   =   5 23.39090.00640.330878.348811.65755.14630.1919
group   =   6 22.35420.00760.382276.400411.65755.14630.1919
group   =   7 21.31750.00880.433586.658811.65755.14630.1919
group   =   8 20.28090.01000.484973.088311.65755.14630.1919
group   =   9 19.24420.01130.536390.488711.65755.14630.1919
group   =   10 18.20750.01250.587774.813411.65755.14630.1919

