
Volume and Carbon Estimates for the Forest Area of the Amhara Region in Northwestern Ethiopia


Institute of Silviculture, Department of Forest and Soil Sciences, University of Natural Resources and LifeSciences, Vienna 1190, Austria
*
Author to whom correspondence should be addressed.
Forests 2017, 8(4), 122; https://doi.org/10.3390/f8040122
Submission received: 20 February 2017
/
Revised: 3 April 2017
/
Accepted: 11 April 2017
/
Published: 15 April 2017
Abstract
:Sustainable forest management requires a continuous assessment of the forest conditions covering the species distribution, standing tree volume as well as volume increment rates. Forest inventories are designed to record this information. They, in combination with ecosystem models, are the conceptual framework for sustainable forest management. While such management systems are common in many countries, no forest inventory system and/or modeling tools for deriving forest growth information are available in Ethiopia. This study assesses, for the first time, timber volume, carbon, and Net Primary Production (NPP) of forested areas in the Amhara region of northwestern Ethiopia by combining (i) terrestrial inventory data, and (ii) land cover classification information. The inventory data were collected from five sites across the Amhara region (Ambober, Gelawdiwos, Katassi, Mahiberesilasse and Taragedam) covering three forest types: (i) forests, (ii) shrublands (exclosures) and (ii) woodlands. The data were recorded on 198 sample plots and cover diameter at breast height, tree height, and increment information. In order to extrapolate the local terrestrial inventory data to the whole Amhara region, a digital land cover map from the Amhara’s Bureau of Agriculture was simplified into (i) forest, (ii) shrubland, and (iii) woodland. In addition, the forest area is further stratified in five elevation classes. Our results suggest that the forest area in the Amhara region covers 2% of the total land area with an average volume stock of 65.7 m3·ha−1; the shrubland covers 27% and a volume stock of 3.7 m3·ha−1; and the woodland covers 6% and an average volume stock of 27.6 m3·ha−1. The corresponding annual volume increment rates are 3.0 m3·ha−1, for the forest area; 1.0 m3·ha−1, for the shrubland; and 1.2 m3·ha−1, for the woodland. The estimated current total volume stock in the Amhara region is 59 million m3.
Keywords:
volume; volume increment; carbon; Net Primary Production (NPP); forest inventory; Ethiopia1. Introduction
Forest ecosystems provide goods and services [1] and have a higher carbon sequestration potential versus any other terrestrial ecosystems [2]. Deforestation leads to a loss of provided goods and services, induces soil degradation effects and contributes to anthropogenic carbon emissions [3]. Global warming, due to the release of greenhouse gases, is causing unprecedented environmental and social changes. Therefore, the idea of Reducing Emissions from Deforestation and forest Degradation (REDD) was conceived by United Nations Framework Convention on Climate Change (UNFCCC) as the main carbon emission reduction mechanism for developing countries such as Ethiopia [4]. REDD was extended to REDD+ in 2014 by adding the carbon sink potential as well as conservation and sustainable forest management issues [5]. Forest management plays an important role in mitigating impacts of climate change and in sustaining the supply of ecosystem goods and services [6]. Thus, forest inventory data are essential to assess the available forest resources including their productivity potential. They serve as the basic input data for implementing the REDD+ objectives [5].
Forest inventories collect data about forest conditions by estimating the volume, biomass, carbon and net primary production (NPP) [7]. Based on a certain grid design, sampling plots are established to record the forest data. Another option for deriving forest productivity estimates can be obtained from remote sensing information in combination with ecosystem modeling theories. As a result, several studies [8] combine both methods to assess the forest area, species distribution, volume, carbon and NPP [7,8,9,10,11,12].
Sustainable forest management requires forest inventories. In combination with modeling tools, forest growth information can be derived and sustainable harvesting or cutting plans are developed [13]. While such systems are common in many parts of the world [9], Ethiopia has no standardized forest inventory system in place and no information about the growing stock and increment rates of the limited remaining forest areas available. This lack of information makes sustainable forest management and harvesting difficult or even impossible. A few studies have analyzed the extent of different forest areas and their changes as a result of land use changes [14,15,16,17,18,19,20]. These studies are restricted to local forest areas and/or watersheds and provide no information on the forest conditions (e.g., volume or biomass) and/or its change over time (increment rates). In addition, some studies have estimated aboveground biomass and carbon stocks of specific savannah woodland, forest and agroforestry areas [21,22]. However, up until this study, no information is available about the stocking volume, volume increment rates, carbon stocks and NPP for the forest areas in northwestern Ethiopia.
The purpose of this study is to provide a consistent methodology to derive such productivity estimates of different vegetation types in the Amhara region in northwestern Ethiopia. We establish local forest inventories covering different agro-ecological zones and extrapolate these inventory results to the whole Amhara region by obtaining a remotely sensed land cover classification scheme to provide total numbers for the stocking timber volume, volume increment, aboveground carbon, and NPP estimates.
2. Materials and Methods
2.1. Forest Inventrory
2.1.1. Study Area
The Amhara region, in northwestern Ethiopia, has a land area of 15.7 Mha, of which one-third is covered with woody vegetation. For our analysis, we selected study areas covering different agro-ecological zones with typical vegetation types: (i) forests, (ii) shrubland/exclosure, and (iii) woodland.
The selected study areas and vegetation types are Ambober (shrubland), Gelawdiwos (forest), Katassi (forest), Mahibereselassie (woodland), and Taragedam (forest) (Figure 1).
Even though the regional and/or local governments declared these forests as protected, human activities and cattle grazing are still active and common. The Mahibereselassie woodland has the highest cattle population and agricultural activities. The Ambober exclosure is guarded and protected since its establishment in 2009. Human and animal activities are minor at the Gelawdiwos and Katassi sites. The Taragedam forest has a minor anthropogenic disturbance history [18]. The most common types of human activities occurring within these forest areas are cutting and harvesting trees for energy, production of different household and farm implements and clearing for agriculture and grazing activities [23].
2.1.2. Sampling Technique
Our five study regions (see Figure 1) cover the main ecological zones of the area and differ in size: the largest area is the Mahibereselassie woodland with 19,162 ha followed by the forest areas in Katassi (553 ha), Taragedam (324 ha) and Gelawdiwos (68 ha). The Ambober shrubland/exclosure covers 6 ha.
The decision on the grid size, and thus the number of sample plots was derived based on statistical principles by achieving a minimum number of inventory plots. After a number of pilot studies in the different forest inventory areas and test calculations, we defined the following grid size by study region: for the Mahibereselassie woodland area, a 3 km by 3 km grid size with 21 sampling plots was established. For the forest areas in Katassi, a 300 m by 300 m with 63 sampling plots; Taragedam 250 m by 250 m with 52 sampling plots; and for Gelawdiwos, 250 m by 250 m with 34 sampling plots were established. For the Ambober shrubland/exclosure, a 50 m by 50 m sampling design with 28 sampling plots was established. This resulted in a total number of 198 sampling plots. A typical example (Taragedam) is given in Figure 2. The data collection was carried out during the summer 2014 (July to September).
Each sample plot consists of two concentric circles and four rectangular plots (1 m × 2 m) (see Figure 2). The plot area was corrected as a function of the slope angle [4]. The radius of the larger circle records all trees with a DBH ≥ 10 cm and exhibits a radius of 10 m for the study areas in Gelawdiwos, Taragedam, and Ambober and 15 m for Katassi and Mahibereselassie. For each tree found within the specified radial range, we recorded the tree species, diameter at breast height (DBH) in cm, and the tree position on the plot.
One of the important goals of the study is to derive annual growth information. Since we have no repeated tree records, increment cores are taken according to the following procedure: Based on the DBH records on a given sampling plot, we selected the so-called “central” stem or tree—this is the 60 percentile of the DBH distribution—on a given sampling plot. We follow here a procedure suggested by [24], which showed in their studies that the “central” stem represents the “mean” tree (=quadratic mean DBH) on a given plot, and cuts the basal area in two equal halves. The “mean” tree dimension is derived from the per hectare values, e.g., the tree represents the quadratic mean DBH (basal area divided by the stem number/ha) and consequently approximately the average volume (volume/ha divided by the stem number/ha). Thus, the growth rates of the “central” stem (60 percentile of the DBH distribution on a given plot) are proportional to the growth rates of the per hectare values assuming that the stem number remains equal for the growth period.
One important precondition of this approach is that each tree ring represents one year. According to Worbes [25] and Zhang et al. [26], distinct tree rings are formed in response to annual precipitation pattern. Sisay et al. [27] confirmed this pattern by showing that the rainy season in the Amhara region is between June and August.
Based on the DBH distribution on a given inventory plot, for each tree species a “central” stem according to the DBH distribution was selected. For this tree, the tree height (h (m)), the height to the live crown base (HLC (m)), and an increment core was taken to derive the ten-year increment rate. Although obtaining full cross-sectional discs may minimize the effect of false and/or missing tree rings [28], destructive sampling (e.g., cutting trees and taking discs to the lab) is forbidden in the area. Moreover, it is neither a requirement nor is it carried out within the scope of routine inventory data collection [29].
For each central plot and species-specific “central” stem, an increment core sample was taken towards the plot center at the DBH to address potential slope effects in the tree form (e.g., ellipse). All sample cores were checked for potentially missing tree rings by comparing the increment core with a so-called “standard” [30], which compares single increment rates of a given core versus so-called “signal” years of the “standard” (>90% of the increment rates increase or decrease versus the previous year). In total, 424 increment cores are available for our study (see Table 1).
Trees with a tree height >1.3 m and a DBH of <10 cm are considered as saplings and were recorded on the smaller circle with a radius of 5 m. The 5-m radius was applied to all our study areas for recording saplings. Due to the large number of trees, we simplified the design by creating DBH classes ranging from ≤4 cm, 4–6 cm and 7–9.9 cm. We counted all individuals by species and assigned the numbers according to the DBH classes. We selected one representative tree by species and DBH class and recorded the tree height.
All trees with a tree height of ≤1.3 m are seedlings and are recorded on the four 1 m by 2 m rectangular (total 8 m2) (see Figure 2). Again, the seedlings were grouped in two classes according to tree height: Group 1 (≤50 cm) and Group 2 (50 cm to 1.3 m). The numbers were recorded by species and height class (Table 1).
We recorded the DBH for each tree on a given plot but only the tree height from the central trees. This is a common procedure within routine inventory designs to enhance data collection activities especially in difficult terrain [13,31,32]. However, this approach requires DBH–height functions to derive missing tree heights [31,33]. We also defined the five most frequent tree species within each study area plus a species group “others” and collected at least 20 trees per species, within the study areas (not limited to the plots) covering the full DBH and height range. The only exception was Ambober, where no DBH–tree height data were recorded because the area was covered with shrubs and thus the trees were too small. The Petterson’s [34] height–diameter function was chosen to derive missing tree heights:
where h is the tree height (m) and DBH is the diameter at breast height (cm), a0 and a1 are the resulting parameter estimates. We used R standard software package [35] to run non-linear regressions. The results are given in Table 2.
This dataset is used for calibrating species-specific diameter–height functions for deriving missing tree heights. In total, we recorded more than 1154 trees, of which 870 trees cover the 20 tree species, and 284 trees cover the species groups “other trees” by region.
Timber Volume
Based on the results of Table 2, we calculated the missing tree heights and the corresponding standing timber volume on a given inventory plot. The general formula for deriving standing timber volume for each tree (V) (m3) can be expressed as [24]:
where f is the form factor addressing the shape of the tree, and all other parameters are as previously defined. Since no form factor functions for the tree species in the region exist, we decided to follow the suggestions by [36,37,38] and use a form factor of 0.5.
Volume Increment
Within sustainable forest management, the assessment of annual volume increment rates is important to ensure sustainable harvesting [13,39]. Up until this point, no such information exists for the forest areas in the Amhara region of northwestern Ethiopia. For our work, we have systematically collected increment cores for all our study regions. As outlined in the sampling technique section, these increment cores were taken from the “central” stem (the mean tree which is approximately the 60 percentile of the DBH distribution) by species on a given plot [24].
After determining the 10-year increment rates (2005 to 2014) with a 0.01 mm precision using the Velmex TA measuring system (Velmex Inc. Bloomfield, New York, NY, USA), the DBH of the “central” stem and inventory plot can be calculated for the year 2005. Applying the DBH–height function (Equation (1)) using the species parameter estimates of Table 2, and inserting in the volume function (Equation (2)), the corresponding volume in 2005 was calculated.
With this information, the volume ratios by plot and tree species can be calculated as:
where inci refers to the individual tree volume increment ratio, V2005i and V2014i are the timber volume derived from the “central stem” in 2005 and 2014, respectively. Since this tree volume increment ratio is equal to the total volume increment ratio of a given plot, we can multiply the total plot volume V2014 with inci to derive the plot volume in 2005. With these numbers, we can calculate the 10-year periodic mean annual volume increments (IV) (m3·h−1·year−1) by inventory plot:
where V2014 and V2005 are the tree volumes (m3) in 2014 and 2005, respectively; 10 is the 10-year increment interval. Dead trees due to mortality are included if recorded.
Aboveground Carbon and Carbon Increment
The aboveground carbon estimations through destructive sampling is the most recommended and accurate method [40,41,42]. Given the small amount of forest resources, the high species diversity and the current forest conservation policy by the state, it is nearly impossible to undertake destructive sampling for the development of allometric functions in Ethiopia as well as for the Amhara region. Thus, we considered existing allometric functions developed for commercial tree species in Ethiopia [43,44,45,46]. Since Sileshi [47] has shown that these functions introduce a potential source of uncertainty, especially if applied in a very diverse structured of natural forests, we decided to use the mixed species allometric biomass function developed for tropical forests by Chave et al. [48], which has the following form:
where ln(AGB) is the natural logarithm of the aboveground biomass (kg) and is wood density (ton·m−3).
A wood density of 𝜌 = 0.614 ton·m−3 developed for Africa is used [49,50]. A total of 50% of the resulting aboveground biomass (AGB) of Equation (5) provides the final carbon estimates [51,52].
Similar to the volume calculation, we calculated the aboveground biomass and carbon estimates for each tree then at the plot level and finally for each study area. Similar to the periodic mean annual volume increment rates, the periodic mean annual carbon increment rates for the period 2005 to 2014 can be derived. Again, we use here the approach of the “central” tree with the corresponding tree dimensions as outlined in the previous section.
Net Primary Production (NPP)
NPP is the amount of carbon remaining and allocated in the plant parts after autotrophic respiration (cellular and maintenance respiration) per growth period [12,53,54]. The growth period is determined depending on the interval between the repeated measurements which usually vary from 5 to 10 years [12,55]. We calculated NPP (gC·m−2·year−1) as the sum of periodic (2005–2014) carbon accumulation in the fine root turnover, aboveground woody parts and litter fall (Equation (6)) [55,56].
where Cwoody (gC·m−2·year−1) is the dry carbon increment of the woody biomass resulting from repeated plot observations between time2 and time1. Cfineroots and Clitter (gC·m−2·year−1) are the carbon flow in to fine roots and litter, respectively.
The annual aboveground dry carbon in the woody part of the tree (Cwoody) is calculated as follows:
where g2014 and g2005 are the tree basal area (m2·ha−1) in 2014 and 2005, respectively, 10 is the 10-year increment interval. C2014 (gC·m−2) is the aboveground woody dry carbon content in 2014.
For Ethiopia, a reliable model for estimating the proportion of fine root turnover and litter fall does not exist. Malhi [57] and Raich and Nadelhoffer [58] found that for a given time period, the proportion of dry carbon turnover through fine roots and litter fall comprises 60% of the total dry carbon accumulation and that the carbon uptake by fine roots and litter is equal. The proportion of the increment of aboveground dry carbon in the woody part of the tree also comprises 40% of the total dry carbon increment. With this information, we assume that the dry carbon increment in the fine roots and foliage turnovers can be calculated from the dry carbon increment of the aboveground woody biomass. For all trees (DBH ≥ 10 cm) and saplings (DBH < 10 cm), the procedure was applied.
2.2. Land Cover Data
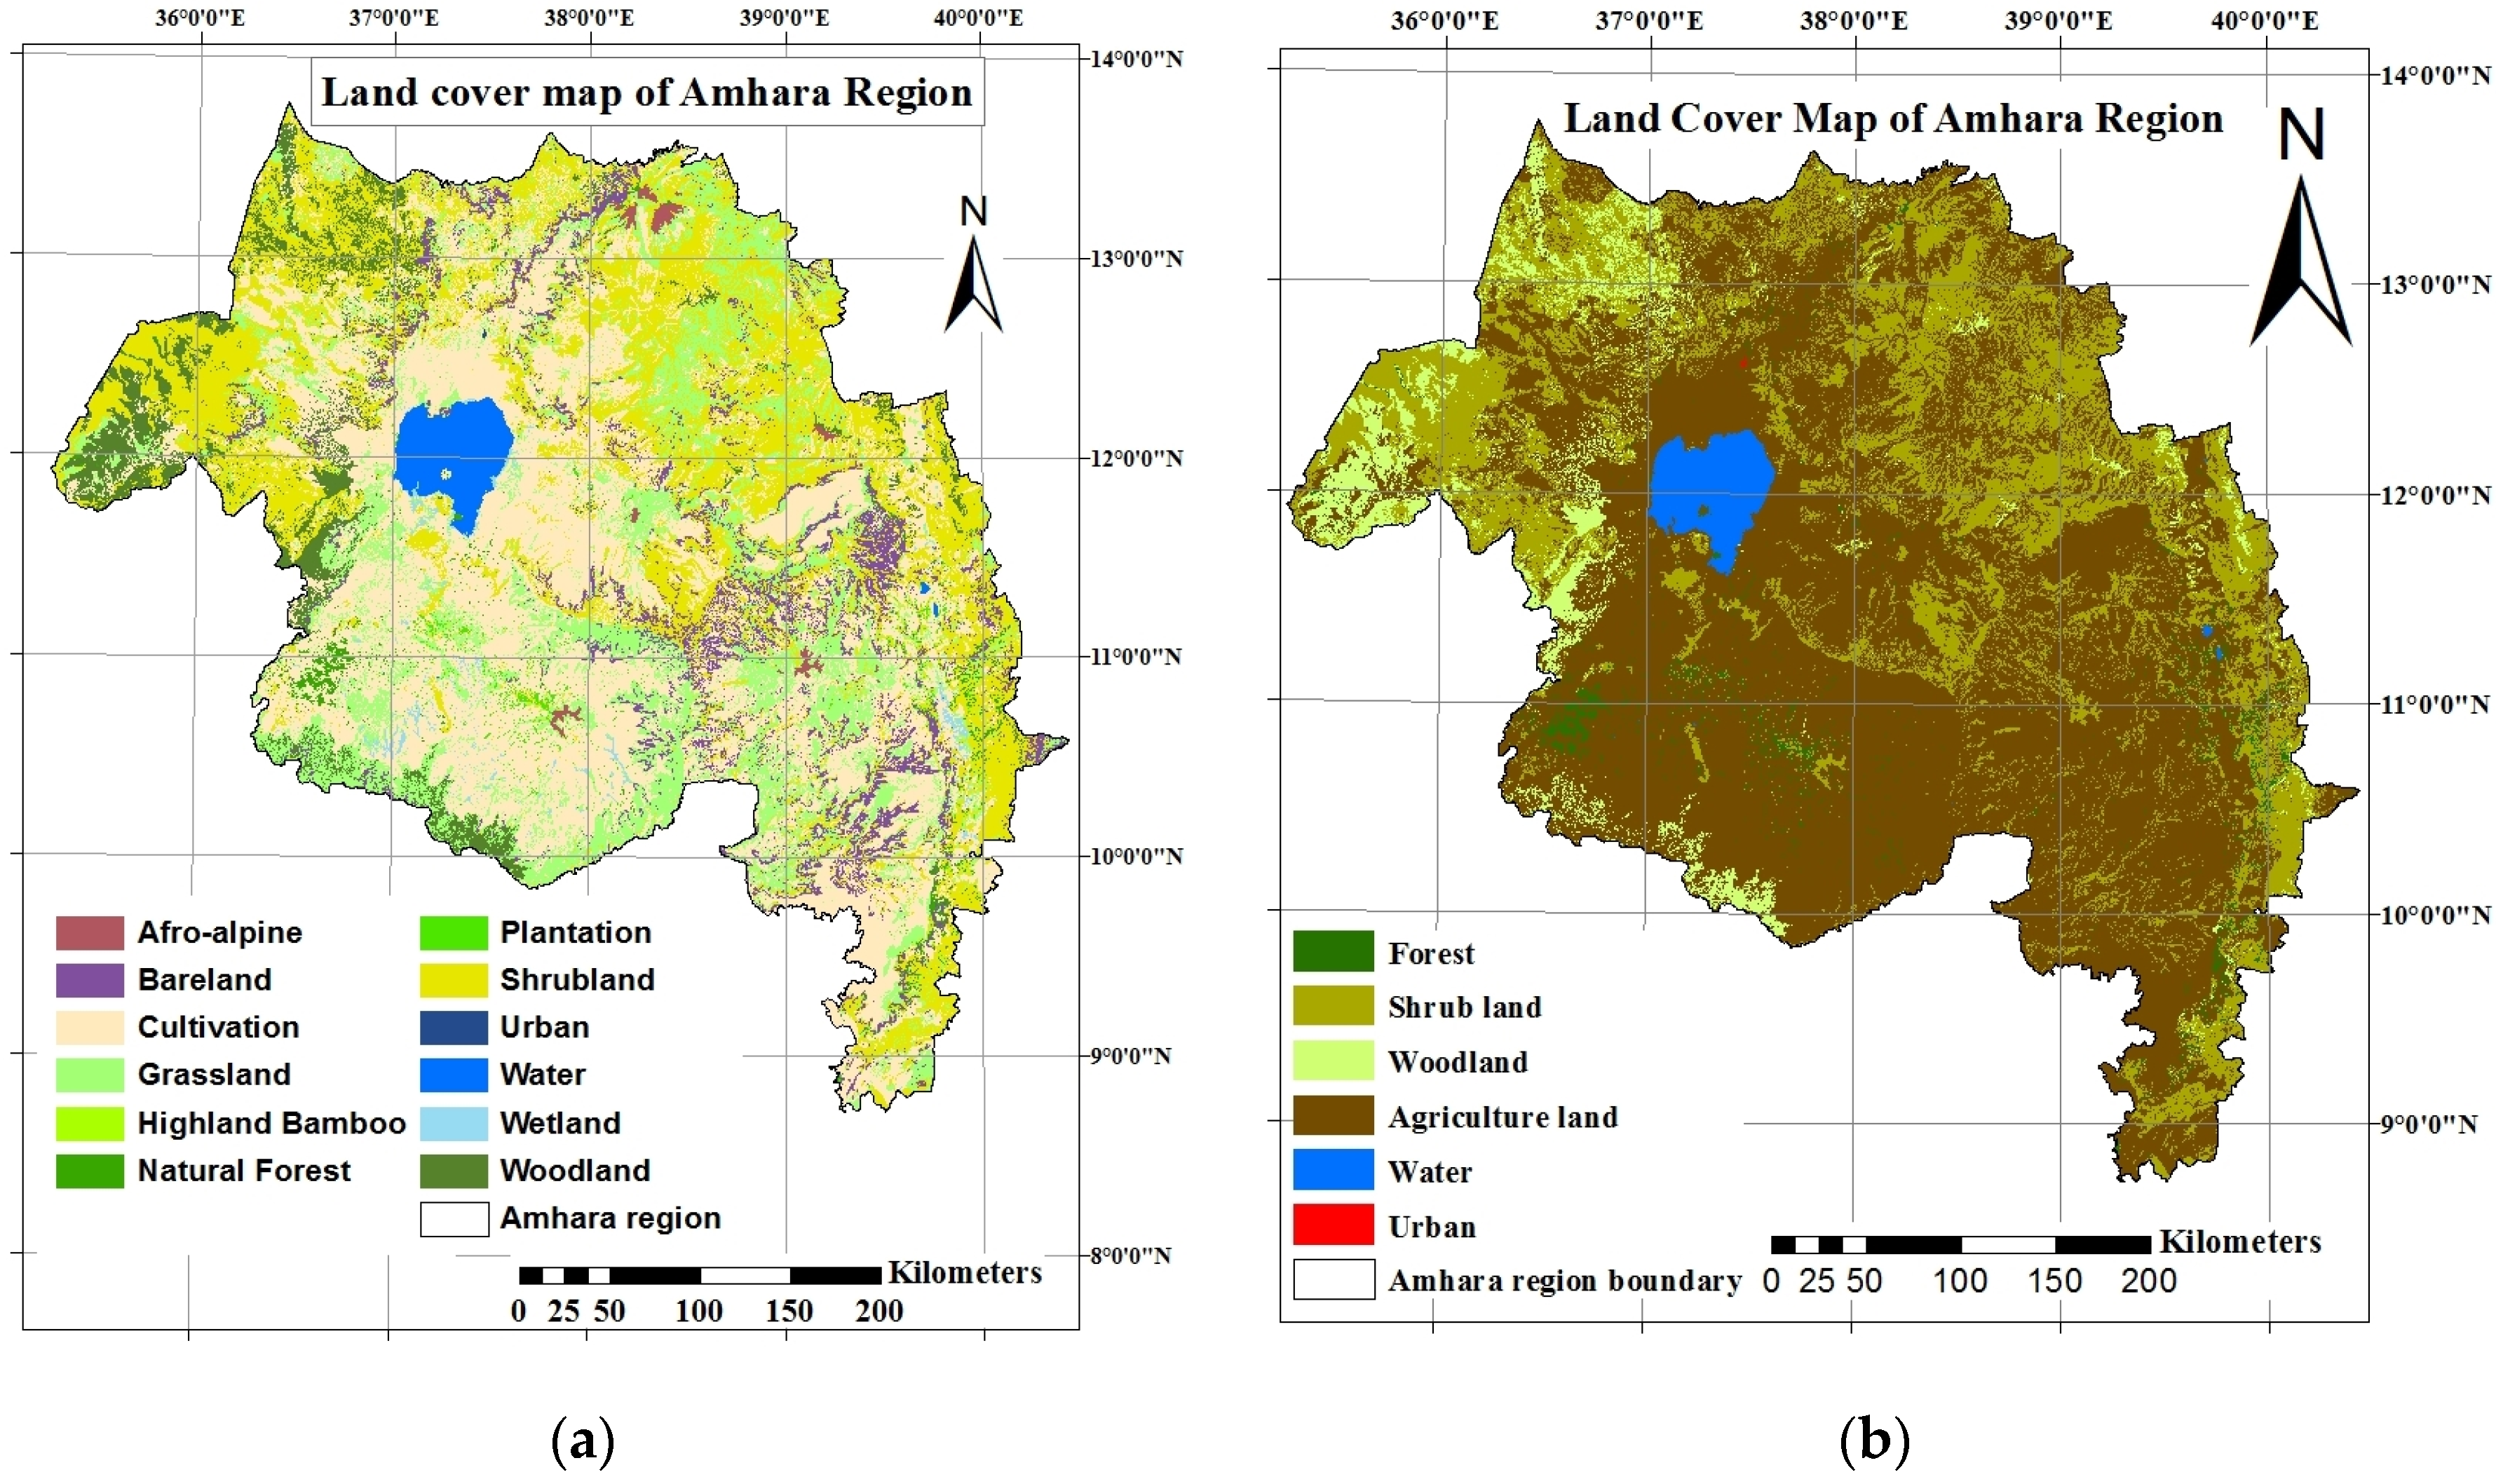
The Amhara region in northwestern Ethiopia covers a land area of 15.7 Mha, of which approximately 35% are either forests, shrublands or woodlands. The area is characterized by highly fragmented land use forms and a large variety of growing conditions due to the elevational gradients and the different agro-ecological zones. Mekonnen [17] and Gizachew et al. [59] carried out a land cover classification of the entire Amhara region, however, they failed to provide their methodology and digital data. Therefore, their study could not be verified. Other studies on land use and land cover classification of the Amhara region are limited to small scale areas within the region [14,60,61,62]. Finally, we obtained the land use and land cover map produced by the office of Amhara National Regional State (ANRS) covering 12 classes with 200 m × 200 m pixel spatial resolution, based on Landsat satellite images (Figure 3). The 12 land cover classes are afro-alpine, bare land, cultivation, grassland, highland bamboo, natural forest, plantation, shrubland, woodland, urban, wetland and water.
We aggregated the 12 land cover classes to six classes based on their vegetation characteristics for fitting our terrestrial inventory land cover types as follows: plantation, highland bamboo and natural forest are grouped as forest. Afro-alpine and shrubland are aggregated into shrubland. Woodland remained as woodland. Bare land, cultivation, grassland and wetland are grouped as non-vegetation. Water and urban classes remained as water and urban, respectively. Our final land cover classes relevant for our analysis are (i) forest, (ii) shrubland, and (iii) woodland. The remaining land cover classes are (iv) non-vegetation areas, (v) water and (vi) urban areas, which are not relevant for our analysis. Figure 3 shows the spatial distribution of land cover classes within the Amhara region.
The accuracy of our regrouped classified map was evaluated by performing stratified sampling. For land cover classifications, the calculation of the appropriate sample size was computed using the multinomial distribution [63]. With an expected accuracy of 90% and an error probability of 5%, the numbers of samples were determined. In total, 607 stratified sample points were randomly selected and distributed over the areas of the aggregated classes. The class of each of the 607 pixels was assigned with the help of finer resolution reference data combined with visual interpretation [64]. Bing and Google Earth images were used for the independent reference data. Due to the low spatial resolution (200 m × 200 m) of the land cover map and the high land fragmentation in the Amhara region, single pixels are often composed of multiple land cover types. Therefore, we assigned the main (largest areas) class of a pixel as the class (land cover type) of the pixel. Table 3 provides a detailed description of the characterizations of the land cover classes.
We defined the three simplified forestry relevant land cover classes (see Table 3): (i) forest, (ii) shrubland, and (iii) woodland plus the non-vegetated area. Since elevational gradients are one of the main factors affecting the growing conditions and thus the species distribution of Ethiopian mountains forests [65,66], we adopted Hurni’s [67] elevation classes for agro-ecological zonation resulting in five elevation classes: (i) low land (500–1500 meters above sea level (m.a.s.l.)), (ii) mid altitude (1500–2300 m.a.s.l.), (iii) high land (2300–3200 m.a.s.l.), (iv) sub-alpine (3200–3700 m.a.s.l.) and (v) alpine (3700–4530 m.a.s.l.). Then, we assigned the land area derived from Landsat data to each vegetation type and elevation classes.
3. Results
3.1. Terrestrial Inventory
Timber Volume, Aboveground Carbon and NPP
We began our analysis by estimating the height diameter coefficients of the Petterson [34] function using the available tree data (DBH and height measurements) (see Table 1). The results by tree species are presented in Table 2. Next, the plot values for timber volume, aboveground carbon and NPP are calculated and the mean values per hectare plus the corresponding standard deviation by study region are calculated. The mean timber volume ranges from 3.7 m3·ha−1 (Ambober) to 92.4 m3·ha−1 (Gelawdiwos). The corresponding mean aboveground carbon values are between 1.11 Mg·ha−1 (Ambober) and 54.6 Mg·ha−1 (Gelawdiwos). Table 4 provides the results of the stand situation in 2014, the year of the data recording.
The volume increment rates are 3.5 m3·ha−1 (Gelawdiwos), 3.6 m3·ha−1 (Katassi) and 1.0 m3·ha−1 (Taragedam). The mean annual aboveground carbon increments of inventory regions are between 0.22 Mg·ha−1 year (Ambober) and 1.9 Mg·ha−1 year (Gelawdiwos).
The mean NPP of Gelawdiwos forest is 597.2 gC·m−2·year−1 followed by Kattassi (486.8 gC·m−2·year−1) and Taragedam (305.4 gC·m−2·year−1). The NPP at the Ambober shrubland is very low with 55.4 gC·m−2·year−1 while the Mahibereselassie woodland NPP exhibited 150.4 gC·m−2·year−1. The values for the annual volume and carbon increments and NPP are presented in Table 5.
3.2. Land Cover Classification
After we have assigned the land cover classes of the 607 pixels, based on the independent reference images, we assessed the accuracy of the map by comparing the land cover map produced by ANRS (Amhara National Regional State) with our independent reference data. The accuracy assessment was applied by using error matrix, according to Olofsson et al. [68], which compares the known reference data with the corresponding results of automated classification [68,69]. Considering the coarse resolution (200 m × 200 m) of the map and the highly land fragmentation within the Amhara region [18], the accuracy of the land cover classification was good (Table 6).
3.3. The Forest Conditions of the Amhara Region
Fifteen forestry relevant clusters (five elevational classes and three vegetation types) are created. The summary of the results is shown in Table 7.
We assigned each of our forest inventory areas to the corresponding clusters. The idea here is that we created a kind of a “reference stand approach”, where we assumed that regional forest inventory information can be used as a proxy for a given cluster and thus allows us to extrapolate local inventories results (our regional sites) to the whole Amhara region. Considering our regional sites, Mahibereselassie is located in the low land—woodland (500–1500 m.a.s.l.) cluster, Ambober belongs to the mid altitude—shrubland area (1500–2300 m.a.s.l.), Katassi and Taragedam to the mid altitude—forest (1500–2300 m.a.s.l.) and Gelawdiwos to the high land—forest area (2300–3200 m.a.s.l.). Most of the woodland is located in the low land and most of the shrubs are in the elevation class low land and mid altitude. Thus, for the total woodland, we decided to use the results of the forest inventory in Mahibereselassie and for the total shrubland, we decided to use the results of the inventory in Ambober as reference stand information. Most of the forest area is located in the mid altitude and the high land area where our forest inventories in Katassi and Taragedam as well as Gelawdiwos are located. Thus, we decided to create reference productivity values according to the following procedure. We averaged the forest inventory productivity estimates of Katassi and Taragedam. We used these numbers for the low land and the mid altitude clusters. For the remaining elevational classes (high land, sub-alpine and alpine), we used the inventory results of Gelawdiwos as reference numbers. Obtaining the number presented in Table 5 and Table 6 and multiplying these numbers with the corresponding land area by vegetation type and elevation class, provides the total productivity estimates for the forested area of the Amhara region (see Table 8).
4. Discussion
The Amhara region in northwestern Ethiopia consists of a forested area of about 251,000 ha or 2% of the total land area (15.7 Mha); 4,287,000 ha or 27% of shrubland; and 930,000 ha or 6% of woodland. The total stocking tree volume is 59 million m3 or 19.1 Tg stored carbon (Table 7 and Table 8). Gibbs et al. [70] estimated a total aboveground carbon stock for Ethiopia within a range of 153 to 867 Tg. Note that the total land mass of Ethiopia is about seven times the size of the Amhara region and most of the forest areas are located in the southwestern part of Ethiopia [23].
In our analysis, we estimated, for the forested area (251,000 ha), a stocking timber volume of approximately 17.6 million m3 and a total carbon of 7.8 Tg with annual volume and carbon increment rates of 0.7 million m3 and 0.34 Tg, respectively (Table 8). These numbers show that the stocking timber volume and annual productivity rates are fairly low: For example, the volumes of our investigated forests range from 28.9 ± 56.5 m3·ha−1 in Taragedam to 92.4 ± 68.1 m3·ha−1 in Gelawdiwos and 75.9 ± 60.2 m3·ha−1 in Katassi (Table 5). Mokria et al. [40] reported much lower carbon stocks for similar dry afro-montane forests in northern Ethiopia. Compared to other moist afro-montane forests in Southwest Ethiopia [71,72] and Mozambique woodlands [73], our numbers are low. Since the forest sites are highly sensitive, any removal of forest plants leads to erosion problems [18,74], which suggests that careful planning of any harvesting operation is essential to ensure sustainability.
The shrubland area of the Amhara region covers 27% or 4,287,000 ha of the land area in the Amhara region. The estimated total stocking volume is 15.9 million m3 with an average annual volume increment of 3.86 m3·ha−1. The total carbon stock stored in the shrublands is 4.8 Tg with 0.95 Tg annual increment (Table 8). The shrubland may be seen as a result of deforestation and cattle grazing activities. In our assessment, the Ambober site provided the reference area for the shrubland assessment. Although the forest inventory covered a rather small area, it may be seen as a typical shrubland in northwestern Ethiopia with an estimated volume stock of 3.7 ± 3.4 m3·ha−1 and a mean annual volume increment rates of 0.9 m3 ± 0.9 m3·ha−1 (Table 5 and Table 6).
The Amhara woodland area covers 6% (930,000 ha) of the land area with an estimated total volume and carbon stock of 25.68 million m3 and 11.1 Tg, respectively. The shrublands exhibited annual volume and carbon increments of 3.86 million m3 and 0.21 Tg. The inventory in Mahibereselassie served as the reference with a volume stock of 27.6 ± 10.7 m3·ha−1 and a mean annual volume increment rate of 1.2 ± 0.5 m3·ha−1 (Table 5 and Table 6). Comparing the woodland inventory in Mahibereselassie with the forest inventories in Gelawdiwos, Katassi, and Taragedam (Table 5), one can see that the forest area in Taragedam exhibits a similar stoking volume as the woodland area in Mahibereselassie. This suggests that the historic and current forest management impacts in Taragedam must be high. Wondie et al. [18] showed a strong relationship between population growth and deforestation in the Taragedam area since 1957.
The mean NPP of forests in the Amhara region is 484.3 gC·m−2·year−1. The NPP of the shrubland is estimated with 55.4 gC·m−2·year−1, while the woodland NPP estimates are with 150.4 gC·m−2·year−1 (Table 8).
A literature search revealed that studies in Ethiopia related to biomass and carbon stock are concentrated in the southwestern part of the country where most of the country’s larger undisturbed moist montane forests are growing [1,21,45,75]. In contrast, the vegetation types in the Amhara region are fragmented dry-afromontane evergreen forests [40,76,77,78]. The forest carbon stock decreases from moist to dry vegetation types [70]. Climate, topography and human and animal activity are the main factors for our low productivity estimated numbers versus the moist afro-montane forests [79]. For example, Muluken et al. [65] and Mokria et al. [35] reported carbon stocks above 278.03 MgC·ha−1 and 19.3 ± 3.9 MgC·ha−1 in southwestern moist-montane community forests and northern dry-afromontane forests in Ethiopia, respectively.
Our aboveground carbon estimations are consistent with estimates provided by Mekuria et al. [80]. The protection of shrublands (=exclosures) from livestock appears to have an important potential to improve vegetation cover and aboveground productivity [23,81,82].
One important result of our study is the development of height–DBH (Diameter at Breast Height) functions for more than 20 tree species in the area for deriving missing tree heights (Table 2) and thus resulting in an easy estimation of tree volume. This substantially improves the data collection in the future, however, we suggest that our calibrated height–DBH functions should be used only within the area where we obtained data for calibration (the Amhara region, Figure 3).
5. Conclusions
For the first time, this study provides forest growth information for the Amhara region as it is essential for sustainable forest management decisions. We developed diameter–height functions for all major tree species in the region. The regional forest inventory data also exhibited tree volume and carbon stocks in combination with the volume and carbon increment data. Prior to this study, no forest productivity information was available and the data collection in the area is extremely difficult. Hence, we selected only five local forest inventories and based our approach on a “reference stand” concept. This assumes that our five established forest inventories cover the key regions and are representative of the remotely sensed vegetation classes (Table 7). With this procedure, we are able to combine regional forest inventory information and remote sensing techniques to provide estimates of the forest productivity in the Amhara region. The methodology is simple and can be easily improved if more local forest inventory data are available. Therefore, this study is critical in pioneering a full forest inventory system in the Amhara region.
Acknowledgments
This work is part of the project “Carbon storage and soil biodiversity in forest landscapes in Ethiopia: Knowledge base and participatory management”. We are grateful for the financial support provided by the Austrian Federal Ministry of Agriculture, Forestry, Environment and Water Management. We thank Hadera Abraha, Khlot Gebrehana, Sibhatu Abera and Tesfaye Teklehaymanot for the success of data collection and compilation. We would like to thank Hirut Hailu Alle for all her indispensable help. Special thanks to Abrham Abiyu for providing us 2009 Ambober data. The comments made by Elisabeth Pötzelsberger and the two anonymous reviewers greatly improved the manuscript. We thank Brady Mattsson for English language corrections.
Author Contributions
Kibruyesfa Sisay designed the study, coordinated data collection, analyzed the data and wrote the manuscript, Christopher Thurnher designed and coordinated the R-scripts and helped the data analysis, Beyene Belay helped on the data collection, data analysis and interpretation, Gerald Lindner coordinated and managed the land cover classification analysis and Hubert Hasenauer designed, coordinated and supervised the methods, analysis, interpretation and the manuscript writing.
Conflicts of Interest
The authors declare no conflict of interest.
References
- Hailemariam, S.N.; Soromessa, T.; Teketay, D. Non-carbon benefits for effective implementation of REDD+: The case of Bale Mountains Eco-Region, Southeastern Ethiopia. Afr. J. Environ. Sci. Technol. 2015, 910, 747–764. [Google Scholar]
- Lal, R. Forest soils and carbon sequestration. For. Ecol. Manag. 2005, 220, 242–258. [Google Scholar] [CrossRef]
- Groom, B.; Palmer, C. REDD+ and rural livelihoods. Biol. Conserv. 2012, 154, 42–52. [Google Scholar] [CrossRef]
- Vanderhaegen, K.; Verbist, B.; Hundera, K.; Muys, B. REALU vs. REDD+: Carbon and biodiversity in the Afromontane landscapes of SW Ethiopia. For. Ecol. Manag. 2015, 343, 22–33. [Google Scholar] [CrossRef]
- United Nations Framework Convention on Climate Change (UNFCCC). Key Decisions Relevant for Reducing Emissions from Deforestation and Forest Degradation in Developing Countries (REDD+); United Nations Framework Convention on Climate Change (UNFCCC): Bonn, Germany, 2014. [Google Scholar]
- Spittlehouse, D.L. Integrating climate change adaptation into forest management. For. Chron. 2005, 81, 691–695. [Google Scholar] [CrossRef]
- van Tuyl, S.; Law, B.E.; Turner, D.P.; Gitelman, A.I. Variability in net primary production and carbon storage in biomass across Oregon forests—An assessment integrating data from forest inventories, intensive sites, and remote sensing. For. Ecol. Manag. 2005, 209, 273–291. [Google Scholar] [CrossRef]
- Moreno, A.; Neumann, M.; Hasenauer, H. Optimal resolution for linking remotely sensed and forest inventory data in Europe. Remote Sens. Environ. 2016, 183, 109–119. [Google Scholar] [CrossRef]
- Neumann, M.; Moreno, A.; Mues, V.; Härkönen, S.; Mura, M.; Bouriaud, O.; Lang, M.; Achten, W.M.J.; Thivolle-Cazat, A.; Bronisz, K.; et al. Comparison of carbon estimation methods for European forests. For. Ecol. Manag. 2016, 361, 397–420. [Google Scholar] [CrossRef]
- Magcale-Macando, D.; Delgado, M.E.; Ty, E.; Villarin, J. A GIS-based model to improve estimation of aboveground biomass of secondary forests in the Philippines. J. Trop. For. Sci. 2006, 18, 8–21. [Google Scholar]
- Muukkonen, P.; Heiskanen, J. Biomass estimation over a large area based on standwise forest inventory data and ASTER and MODIS satellite data: A possibility to verify carbon inventories. Remote Sens. Environ. 2007, 107, 617–624. [Google Scholar] [CrossRef]
- Hasenauer, H.; Petritsch, R.; Zhao, M.; Boisvenue, C.; Running, S.W. Reconciling satellite with ground data to estimate forest productivity at national scales. For. Ecol. Manag. 2012, 276, 196–208. [Google Scholar] [CrossRef]
- Thurnher, C.; Klopf, M.; Hasenauer, H. Forests in transition: A harvesting model for uneven-aged mixed species forests in Austria. Forestry 2011, 84, 517–526. [Google Scholar] [CrossRef]
- Wondie, M.; Schneider, W.; Melesse, A.M.; Teketay, D. Spatial and Temporal Land Cover Changes in the Simen Mountains National Park, a World Heritage Site in Northwestern Ethiopia. Remote Sens. 2011, 3, 752–766. [Google Scholar] [CrossRef]
- Gebrehiwot, S.G.; Bewket, W.; Gärdenäs, A.I.; Bishop, K. Forest cover change over four decades in the Blue Nile Basin, Ethiopia: Comparison of three watersheds. Reg. Environ. Chang. 2014, 14, 253–266. [Google Scholar] [CrossRef]
- Dessie, G.; Kleman, J. Pattern and Magnitude of Deforestation in the South Central Rift Valley Region of Ethiopia. Mt. Res. Dev. 2007, 27, 162–168. [Google Scholar] [CrossRef]
- Mekonnen, M.; Sewunet, T.; Gebeyehu, M.; Azene, B.; Melesse, A.M. GIS and Remote Sensing-Based Forest Resource Assessment, Quantification, and Mapping in Amhara Region, Ethiopia; Melesse, A.M., Abtew, W., Eds.; Springer: Cham, Switzerland, 2016. [Google Scholar]
- Wondie, M.; Schneider, W.; Katzensteiner, K.; Mansberger, R.; Teketay, D. Modelling the dynamics of landscape transformations and population growth in the highlands of Ethiopia using remote-sensing data. Int. J. Remote Sens. 2016, 37, 5647–5667. [Google Scholar] [CrossRef]
- Hailemariam, S.; Soromessa, T.; Teketay, D. Land Use and Land Cover Change in the Bale Mountain Eco-Region of Ethiopia during 1985 to 2015. Land 2016, 5, 41. [Google Scholar] [CrossRef]
- Sisay, K.; Yitaferu, B.; Garedew, E.; Ziadat, F. Assessment of forest cover change and its environmental impacts using multi-temporal and multi-spectral satellite images. In Mitigating Land Degradation and Improving Livelihoods; Ziadat, F., Bayu, W., Eds.; Routledge: New York, NY, USA, 2015; pp. 85–98. [Google Scholar]
- Negash, M.; Starr, M. Biomass and soil carbon stocks of indigenous agroforestry systems on the south-eastern Rift Valley escarpment, Ethiopia. Plant Soil 2015, 393, 95–107. [Google Scholar] [CrossRef]
- Feyisa, K.; Beyene, S.; Megersa, B.; Said, M.Y.; de Leeuw, J.; Angassa, A. Allometric equations for predicting above-ground biomass of selected woody species to estimate carbon in East African rangelands. Agrofor. Syst. 2016. [Google Scholar] [CrossRef]
- Lemenih, M.; Kassa, H. Re-greening Ethiopia: History, challenges and lessons. Forests 2014, 5, 1896–1909. [Google Scholar] [CrossRef]
- Assmann, E. The Principles of Forest Yield Study: Studies in the Organic Production, Structure, Increment and Yield of Forest Stands; Davis, P.W., Ed.; Pergamon Press: Oxford, UK, 1970. (In German) [Google Scholar]
- Worbes, M. One hundred years of tree-ring research in the tropics—A brief history and an outlook to future challenges. Dendrochronologia 2002, 20, 217–231. [Google Scholar] [CrossRef]
- Zhang, X.; Friedl, M.A.; Schaaf, C.B.; Strahler, A.H.; Liu, Z. Monitoring the response of vegetation phenology to precipitation in Africa by coupling MODIS and TRMM instruments. J. Geophys. Res. 2005, 110, 1–14. [Google Scholar] [CrossRef]
- Sisay, K.; Thurnher, C.; Hasenauer, H. Daily climate data for the Amhara region in Northwestern Ethiopia. Int. J. Climatol. 2016. [Google Scholar] [CrossRef]
- Gebrekirstos, A.; Bräuning, A.; Sass-Klassen, U.; Mbow, C. Opportunities and applications of dendrochronology in Africa. Curr. Opin. Environ. Sustain. 2014, 6, 48–53. [Google Scholar] [CrossRef]
- Tomppo, E.; Gschwantner, T.; Lawrence, M.; McRoberts, R.E. National Forest Inventories; Tomppo, E., Gschwantner, T., Lawrence, M., McRoberts, R.E., Eds.; Springer: Dordrecht, The Netherlands, 2010. [Google Scholar]
- Vins, B. Die Auswertung jahrringchronologischer Untersuchungen in rauchgeschädigten Fichtenwäldern des Erzgebirges. Wiss. Z. Techn. Univ. Dresden 1962, 11, 579–580. [Google Scholar]
- Arcangeli, C.; Klopf, M.; Hale, S.E.; Jenkins, T.A.R.; Hasenauer, H. The uniform height curve method for height-diameter modelling: An application to Sitka spruce in Britain. Forestry 2014, 87, 177–186. [Google Scholar] [CrossRef]
- Feldpausch, T.R.; Banin, L.; Phillips, O.L.; Baker, T.R.; Lewis, S.L.; Quesada, C.A. Height-diameter allometry of tropical forest trees. Biogeosci. Discuss. 2011, 8, 1081–1106. [Google Scholar] [CrossRef]
- Wonn, H.T.; O’hara, K.L. Height:Diameter Ratios and Stability Relationships for Four Northern Rocky Mountain Tree Species. West. J. Appl. For. 2001, 16, 87–94. [Google Scholar]
- Schmidt, A. Der rechnerische Ausgleich von Bestandeshöhenkurven. Forstwiss. Centralbl. 1967, 86, 370–386. [Google Scholar] [CrossRef]
- R Development Core Team. R: A Language and Environment for Statistical Computing; The R Foundation for Statistical Computing: Vienna, Austria, 2014. [Google Scholar]
- Masota, A.M. Volume Models for Single Trees in Tropical Rainforests in Tanzania. J. Energy Nat. Resour. 2014, 3, 66. [Google Scholar] [CrossRef]
- Petrokofsky, G.; Kanamaru, H.; Achard, F.; Goetz, S.J.; Joosten, H.; Holmgren, P.; Lehtonen, A.; Menton, M.C.; Pullin, A.S.; Wattenbach, M. Comparison of methods for measuring and assessing carbon stocks and carbon stock changes in terrestrial carbon pools. How do the accuracy and precision of current methods compare? A systematic review protocol. Environ. Evid. 2012, 1, 6. [Google Scholar] [CrossRef]
- Teklehaymanot, T. Development of Form Factor and Height-Diameter Functions for Selected Tree Species in the Amhara Region, Ethiopia. Master’s Thesis, University of Natural Resources and Life Sciences, Vienna, Austria, 2015. [Google Scholar]
- Ledermann, T. Using Logistic Regression to Model Tree Selection Preferences for Harvesting in Forests in Conversion. In Continuous Cover Forestry; Springer Netherlands: Dordrecht, The Netherlands, 2002; pp. 203–216. [Google Scholar]
- Mokria, M.; Gebrekirstos, A.; Aynekulu, E.; Bräuning, A. Tree dieback affects climate change mitigation potential of a dry afromontane forest in northern Ethiopia. For. Ecol. Manag. 2015, 344, 73–83. [Google Scholar] [CrossRef]
- Hasenauer, H.; Eastaugh, C.S. Assessing Forest Production Using Terrestrial Monitoring Data. Int. J. For. Res. 2012, 2012, 8. [Google Scholar] [CrossRef]
- Clark, D.B.; Kellner, J.R. Tropical forest biomass estimation and the fallacy of misplaced concreteness. J. Veg. Sci. 2012, 23, 1191–1196. [Google Scholar] [CrossRef]
- Berhe, L.; Assefa, G.; Teklay, T. Models for estimation of carbon sequestered by Cupressus lusitanica plantation stands at Wondo Genet, Ethiopia. South. For. J. For. Sci. 2013, 75, 113–122. [Google Scholar]
- Berhe, L.; Arnoldsson, G. Tree taper models for Cupressus lusitanica plantations in Ethiopia. South. For. J. For. Sci. 2008, 70, 193–203. [Google Scholar]
- Negash, M.; Starr, M.; Kanninen, M.; Berhe, L. Allometric equations for estimating aboveground biomass of Coffea arabica L. grown in the Rift Valley escarpment of Ethiopia. Agrofor. Syst. 2013, 87, 953–966. [Google Scholar] [CrossRef]
- Hunde, T.; Duguma, D.; Gizachew, B.; Mamushet, D.; Teketay, D. Growth and form of Eucalyptus grandis provenances at Wondo Genet, Southern Ethiopia. Aust. For. 2003, 66, 170–175. [Google Scholar] [CrossRef]
- Sileshi, G.W. A critical review of forest biomass estimation models, common mistakes and corrective measures. For. Ecol. Manag. 2014, 329, 237–254. [Google Scholar] [CrossRef]
- Chave, J.; Andalo, C.; Brown, S.; Cairns, M.A.; Chambers, J.Q.; Eamus, D.; Fölster, H.; Higuchi, N.; Kira, T.; Lescure, J.-P.; et al. Tree allometry and improved estimation of carbon stocks and balance in tropical forests. Oecologia 2005, 145, 87–99. [Google Scholar] [CrossRef] [PubMed]
- Reyes, G.; Brown, S.; Chapman, J.; Lugo, A.E. Wood densities of Tropical tree species. Gen. Tech. Rep. 1992, 88, 1–18. [Google Scholar]
- Brown, S. Estimating Biomass and Biomass Change of Tropical Forests: A Primer; Food and Agriculture Organization of the United Nations: Rome, Italy, 1997; Volume 134, p. 55. [Google Scholar]
- Brown, S.; Lugo, A.E. The Storage and Production of Organic Matter in Tropical Forests and Their Role in the Global Carbon Cycle. Biotropica 1982, 14, 161–187. [Google Scholar] [CrossRef]
- Malhi, Y.; Baker, T.R.; Phillips, O.L.; Almeida, S.; Alvarez, E.; Arroyo, L.; Chave, J.; Czimczik, C.I.; Di Fiore, A.; Higuchi, N.; et al. The above-ground coarse wood productivity of 104 Neotropical forest plots. Glob. Chang. Biol. 2004, 10, 563–591. [Google Scholar] [CrossRef]
- Piao, S.; Luyssaert, S.; Ciais, P.; Janssens, I.A.; Chen, A.; Chao, C.A.O.; Fang, J.; Friedlingstein, P.; Luo, Y.; Wang, S. Forest annual carbon cost: A global-scale analysis of autotrophic respiration. Ecology 2010, 91, 652–661. [Google Scholar] [CrossRef] [PubMed]
- Zhao, M.; Heinsch, F.A.; Nemani, R.R.; Running, S.W. Improvements of the MODIS terrestrial gross and net primary production global data set. Remote Sens. Environ. 2005, 95, 164–176. [Google Scholar] [CrossRef]
- Neumann, M.; Zhao, M.; Kindermann, G.; Hasenauer, H. Comparing MODIS Net Primary Production Estimates with Terrestrial National Forest Inventory Data in Austria. Remote Sens. 2015, 7, 3878–3906. [Google Scholar] [CrossRef]
- He, L.; Chen, J.M.; Pan, Y.; Birdsey, R.; Kattge, J. Relationships between net primary productivity and forest stand age in U.S. forests. Glob. Biochem. Cycles 2012, 26, 1–19. [Google Scholar] [CrossRef]
- Malhi, Y. The productivity, metabolism and carbon cycle of tropical forest vegetation. J. Ecol. 2012, 100, 65–75. [Google Scholar] [CrossRef]
- Raich, J.W.; Nadelhoffer, K.J. Belowground Carbon Allocation in Forest Ecosystems: Global Trends. Ecology 1989, 70, 1346–1354. [Google Scholar] [CrossRef]
- Gizachew, B.; Solberg, S.; Næsset, E.; Gobakken, T.; Bollandsås, O.M.; Breidenbach, J.; Zahabu, E.; Mauya, E.W. Mapping and estimating the total living biomass and carbon in low-biomass woodlands using Landsat 8 CDR data. Carbon Balance Manag. 2016, 11, 13. [Google Scholar] [CrossRef] [PubMed]
- Tesfaye, S.; Guyassa, E.; Raj, A.J.; Birhane, E.; Wondim, G.T. Land Use and Land Cover Change, and Woody Vegetation Diversity in Human Driven Landscape of Gilgel Tekeze Catchment, Northern Ethiopia. Int. J. For. Res. 2014, 2014, 614249. [Google Scholar] [CrossRef]
- Garede, N.M.; Minale, A.S. Land Use/Cover Dynamics in Ribb Watershed, North Western Ethiopia. J. Nat. Sci. Res. 2014, 4, 9–16. [Google Scholar]
- Tolessa, T.; Senbeta, F.; Abebe, T. Land use/land cover analysis and ecosystem services valuation in the central highlands of Ethiopia. For. Trees Livelihoods 2016, 26, 111–123. [Google Scholar] [CrossRef]
- Congalton, R. Assessing the Accuracy of Remotely Sensed Data: Principles and Practices, 2nd ed.; CRC Press: Boca Raton, FL, USA, 2008. [Google Scholar]
- Morisette, J.T.; Privette, J.L.; Justice, C.O. A framework for the validation of MODIS Land products. Remote Sens. Environ. 2002, 83, 77–96. [Google Scholar] [CrossRef]
- Berhanu, A.; Woldu, Z.; Demissew, S. Elevation patterns of woody taxa richness in the evergreen Afromontane vegetation of Ethiopia. J. For. Res. 2016. [Google Scholar] [CrossRef]
- Schmitt, C.B. Montane Rainforest with Wild Coffea Arabica in the Bonga Region (SW Ethiopia): Plant Diversity, Wild Coffee Management and Implications for Conservation; Cuvillier Verlag: Göttingen, Germany, 2006. [Google Scholar]
- Hurni, H. Agroecologial Belts of Ethiopia: Explanatory Notes on Three Maps at a Scale of 1:1,000,000; Research Report for Soil Conservation Research Program: Addis Ababa, Ethiopia, 1998; p. 43. [Google Scholar]
- Olofsson, P.; Foody, G.M.; Stehman, S.V.; Woodcock, C.E. Making better use of accuracy data in land change studies: Estimating accuracy and area and quantifying uncertainty using stratified estimation. Remote Sens. Environ. 2013, 129, 122–131. [Google Scholar] [CrossRef]
- Liu, C.; Frazier, P.; Kumar, L. Comparative assessment of the measures of thematic classification accuracy. Remote Sens. Environ. 2007, 107, 606–616. [Google Scholar] [CrossRef]
- Gibbs, H.K.; Brown, S.; Niles, J.O.; Foley, J.A. Monitoring and estimating tropical forest carbon stocks: Making REDD a reality. Environ. Res. Lett. 2007, 2, 45023. [Google Scholar] [CrossRef]
- Muluken, N.B.; Teshome, S.; Eyale, B. Carbon stock in Adaba-Dodola community forest of Danaba District, West-Arsi zone of Oromia Region, Ethiopia: An implication for climate change mitigation. J. Ecol. Nat. Environ. 2015, 7, 14–22. [Google Scholar] [CrossRef]
- Wondrade, N.; Dick, O.B.; Tveite, H. Estimating above Ground Biomass and Carbon Stock in the Lake Hawassa Watershed, Ethiopia by Integrating Remote Sensing and Allometric Equations. For. Res. 2015, 4, 151. [Google Scholar]
- Williams, M.; Ryan, C.M.; Rees, R.M.; Sambane, E.; Fernando, J.; Grace, J. Carbon sequestration and biodiversity of re-growing miombo woodlands in Mozambique. For. Ecol. Manag. 2008, 254, 145–155. [Google Scholar] [CrossRef]
- Zeleke, G.; Hurni, H. Implications of Land Use and Land Cover Dynamics for Mountain Resource Degradation in the Northwestern Ethiopian Highlands. Mt. Res. Dev. 2001, 21, 184–191. [Google Scholar] [CrossRef]
- De Beenhouwer, M.; Geeraert, L.; Mertens, J.; van Geel, M.; Aerts, R.; Vanderhaegen, K.; Honnay, O. Biodiversity and carbon storage co-benefits of coffee agroforestry across a gradient of increasing management intensity in the SW Ethiopian highlands. Agric. Ecosyst. Environ. 2016, 222, 193–199. [Google Scholar] [CrossRef]
- Abiyu, A.; Teketay, D.; Glatzel, G.; Gratzer, G. Tree seed dispersal by African civets in the Afromontane Highlands: Too long a latrine to be effective for tree population dynamics. Afr. J. Ecol. 2015, 53, 588–591. [Google Scholar] [CrossRef]
- Wassie, A.; Sterck, F.J.; Bongers, F. Species and structural diversity of church forests in a fragmented Ethiopian Highland landscape. J. Veg. Sci. 2010, 21, 938–948. [Google Scholar] [CrossRef]
- Aerts, R.; van Overtveld, K.; November, E.; Wassie, A.; Abiyu, A.; Demissew, S.; Daye, D.D.; Giday, K.; Haile, M.; TewoldeBerhan, S.; et al. Conservation of the Ethiopian church forests: Threats, opportunities and implications for their management. Sci. Total Environ. 2016, 551–552, 404–414. [Google Scholar] [CrossRef] [PubMed]
- Clark, D.B.; Clark, D.A. Landscape-scale variation in forest structure and biomass in a tropical rain forest. For. Ecol. Manag. 2000, 137, 185–198. [Google Scholar] [CrossRef]
- Mekuria, W.; Langan, S.; Johnston, R.; Belay, B.; Amare, D.; Gashaw, T.; Desta, G.; Noble, A.; Wale, A. Restoring aboveground carbon and biodiversity: A case study from the Nile basin, Ethiopia. For. Sci. Technol. 2015, 11, 86–96. [Google Scholar] [CrossRef]
- Neelo, J.; Teketay, D.; Kashe, K.; Masamba, W. Stand Structure, Diversity and Regeneration Status of Woody Species in Open and Exclosed Dry Woodland Sites around Molapo Farming Areas of the Okavango Delta, Northeastern Botswana. Open J. For. 2015, 5, 313–328. [Google Scholar] [CrossRef]
- Birhane, E.; Teketay, D.; Barklund, P. Enclosures to Enhance Woody Species Diversity in the Dry Lands of Eastern Tigray. East Afr. J. Sci. 2007, 1, 136–147. [Google Scholar] [CrossRef]
Figure 1.
Location of study areas.
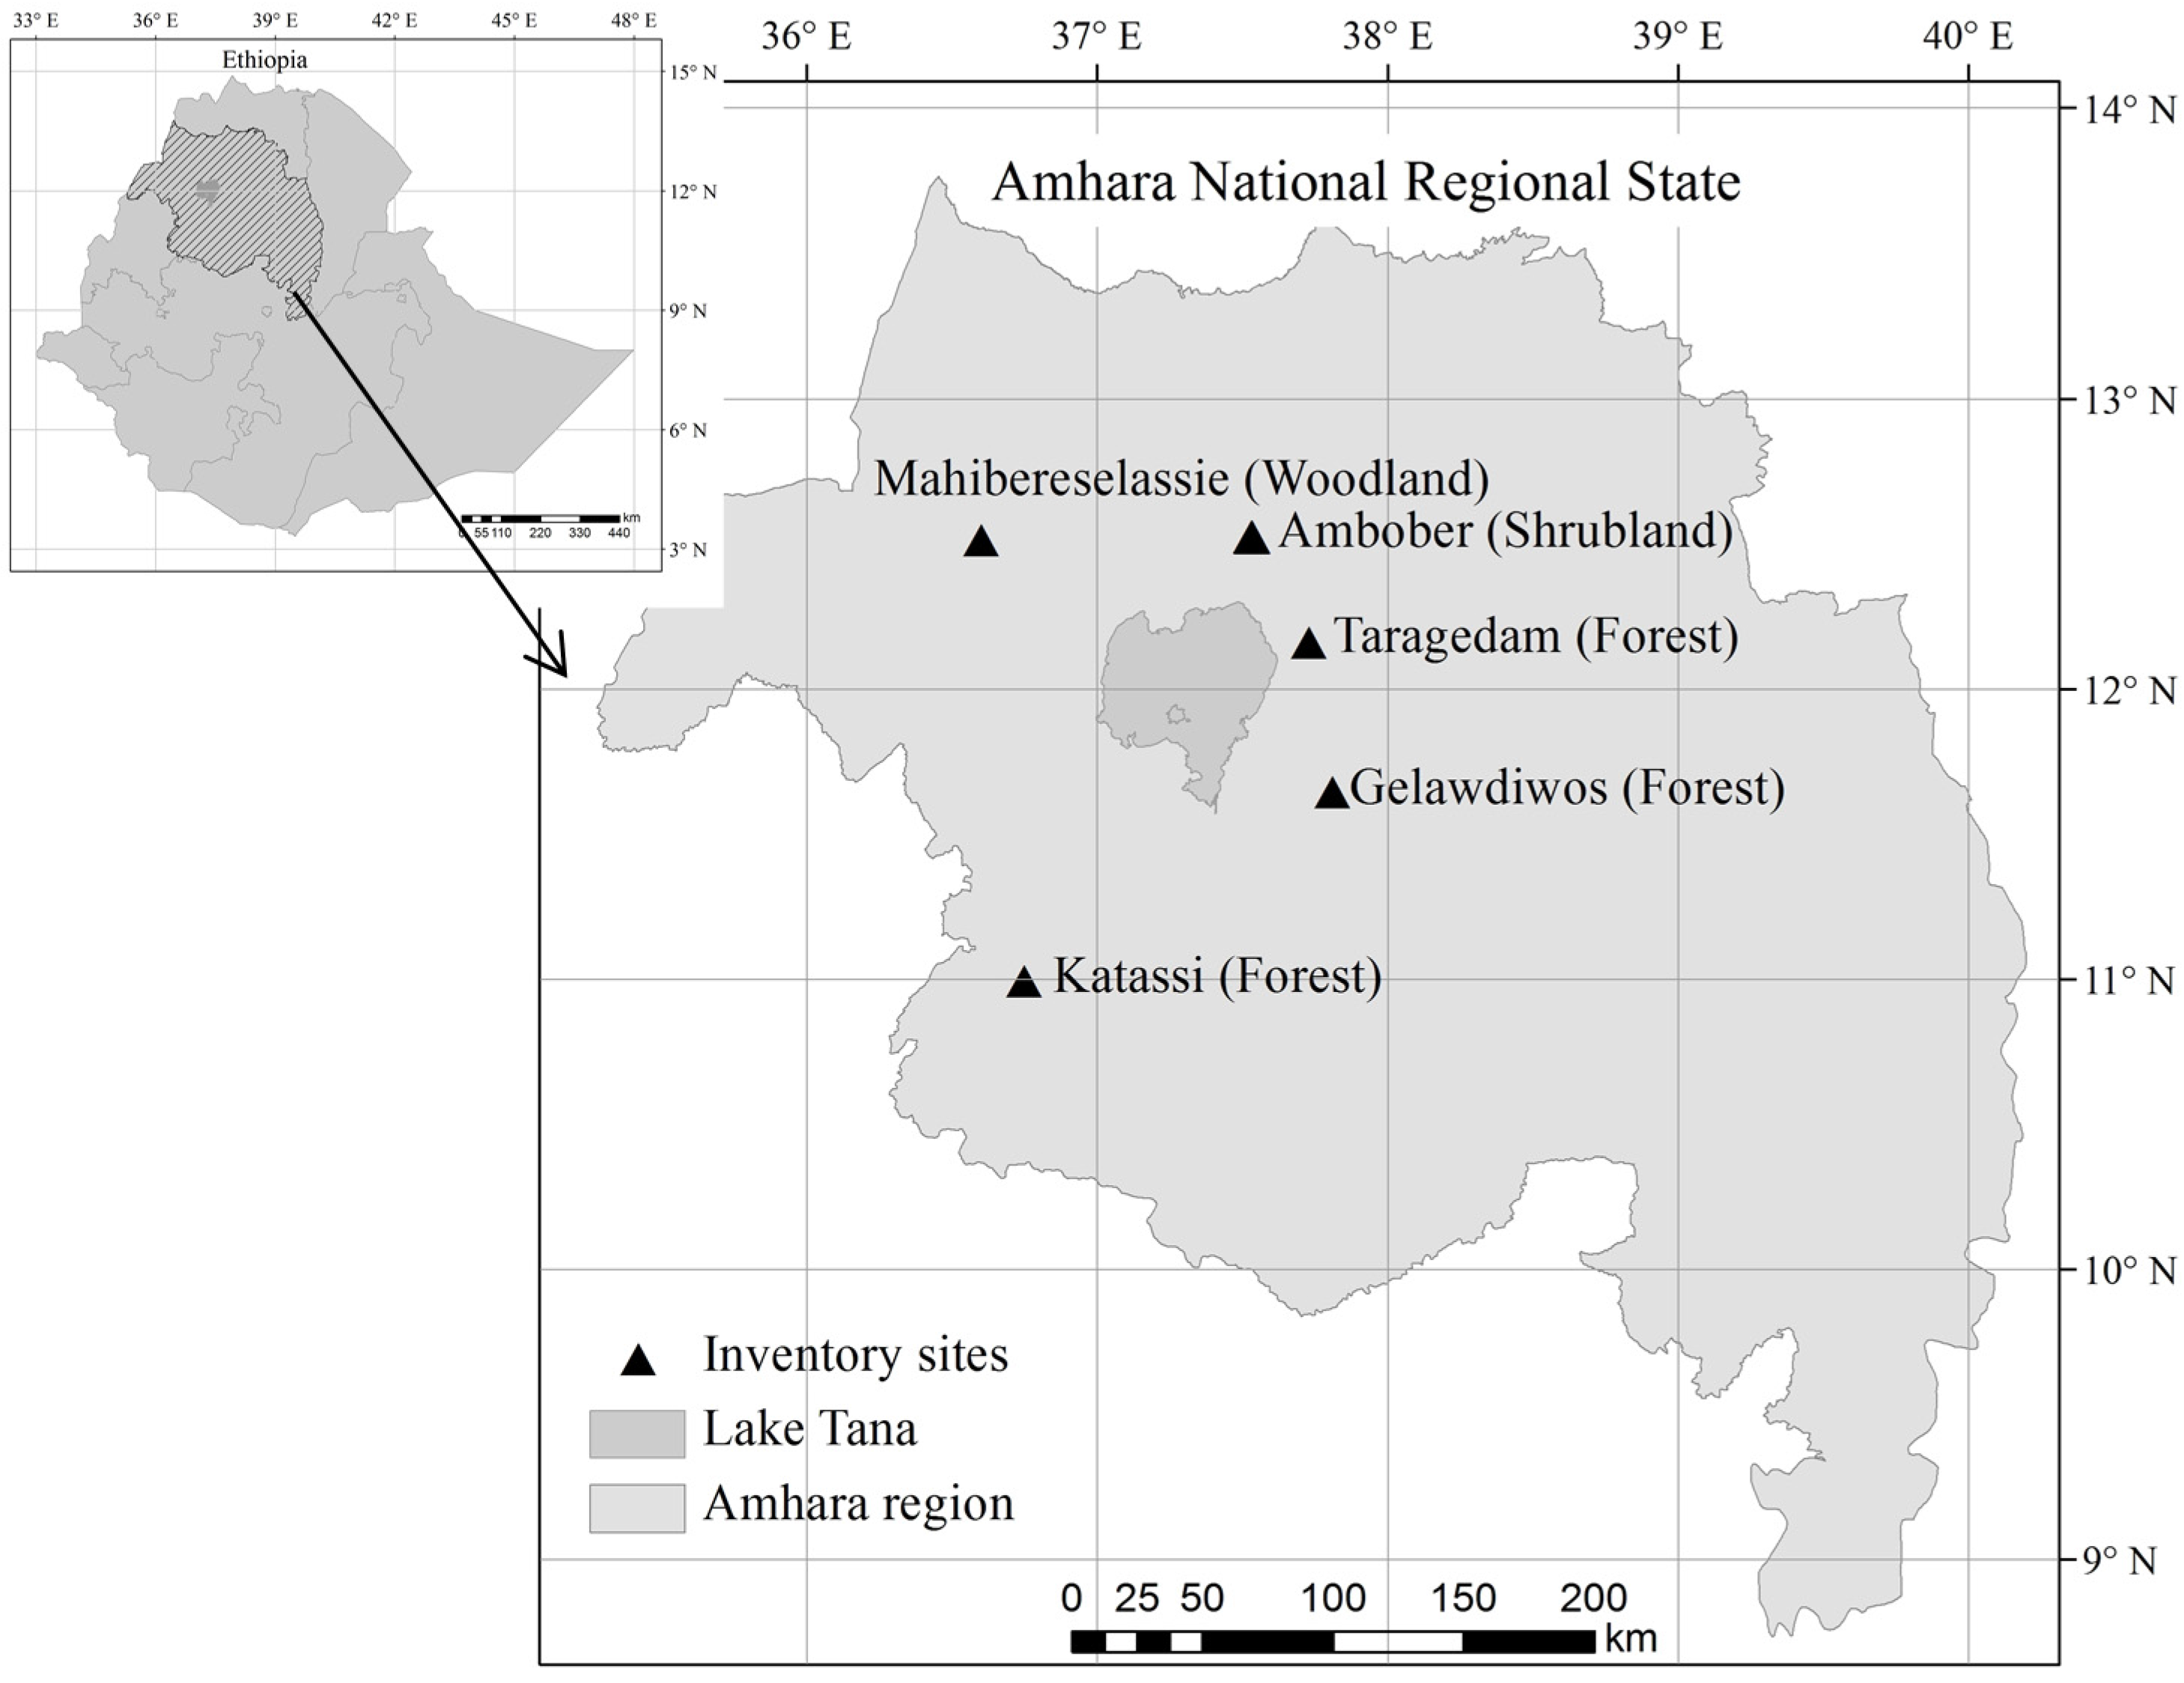
Figure 2.
Sampling plot design and sample grid design (Taragedam site). A 10-m radius plot was used in Ambober, Gelawdiwos and Taragedam. A 15-m radius plot was used in Katassi and Mahibereselassie.
Figure 2.
Sampling plot design and sample grid design (Taragedam site). A 10-m radius plot was used in Ambober, Gelawdiwos and Taragedam. A 15-m radius plot was used in Katassi and Mahibereselassie.
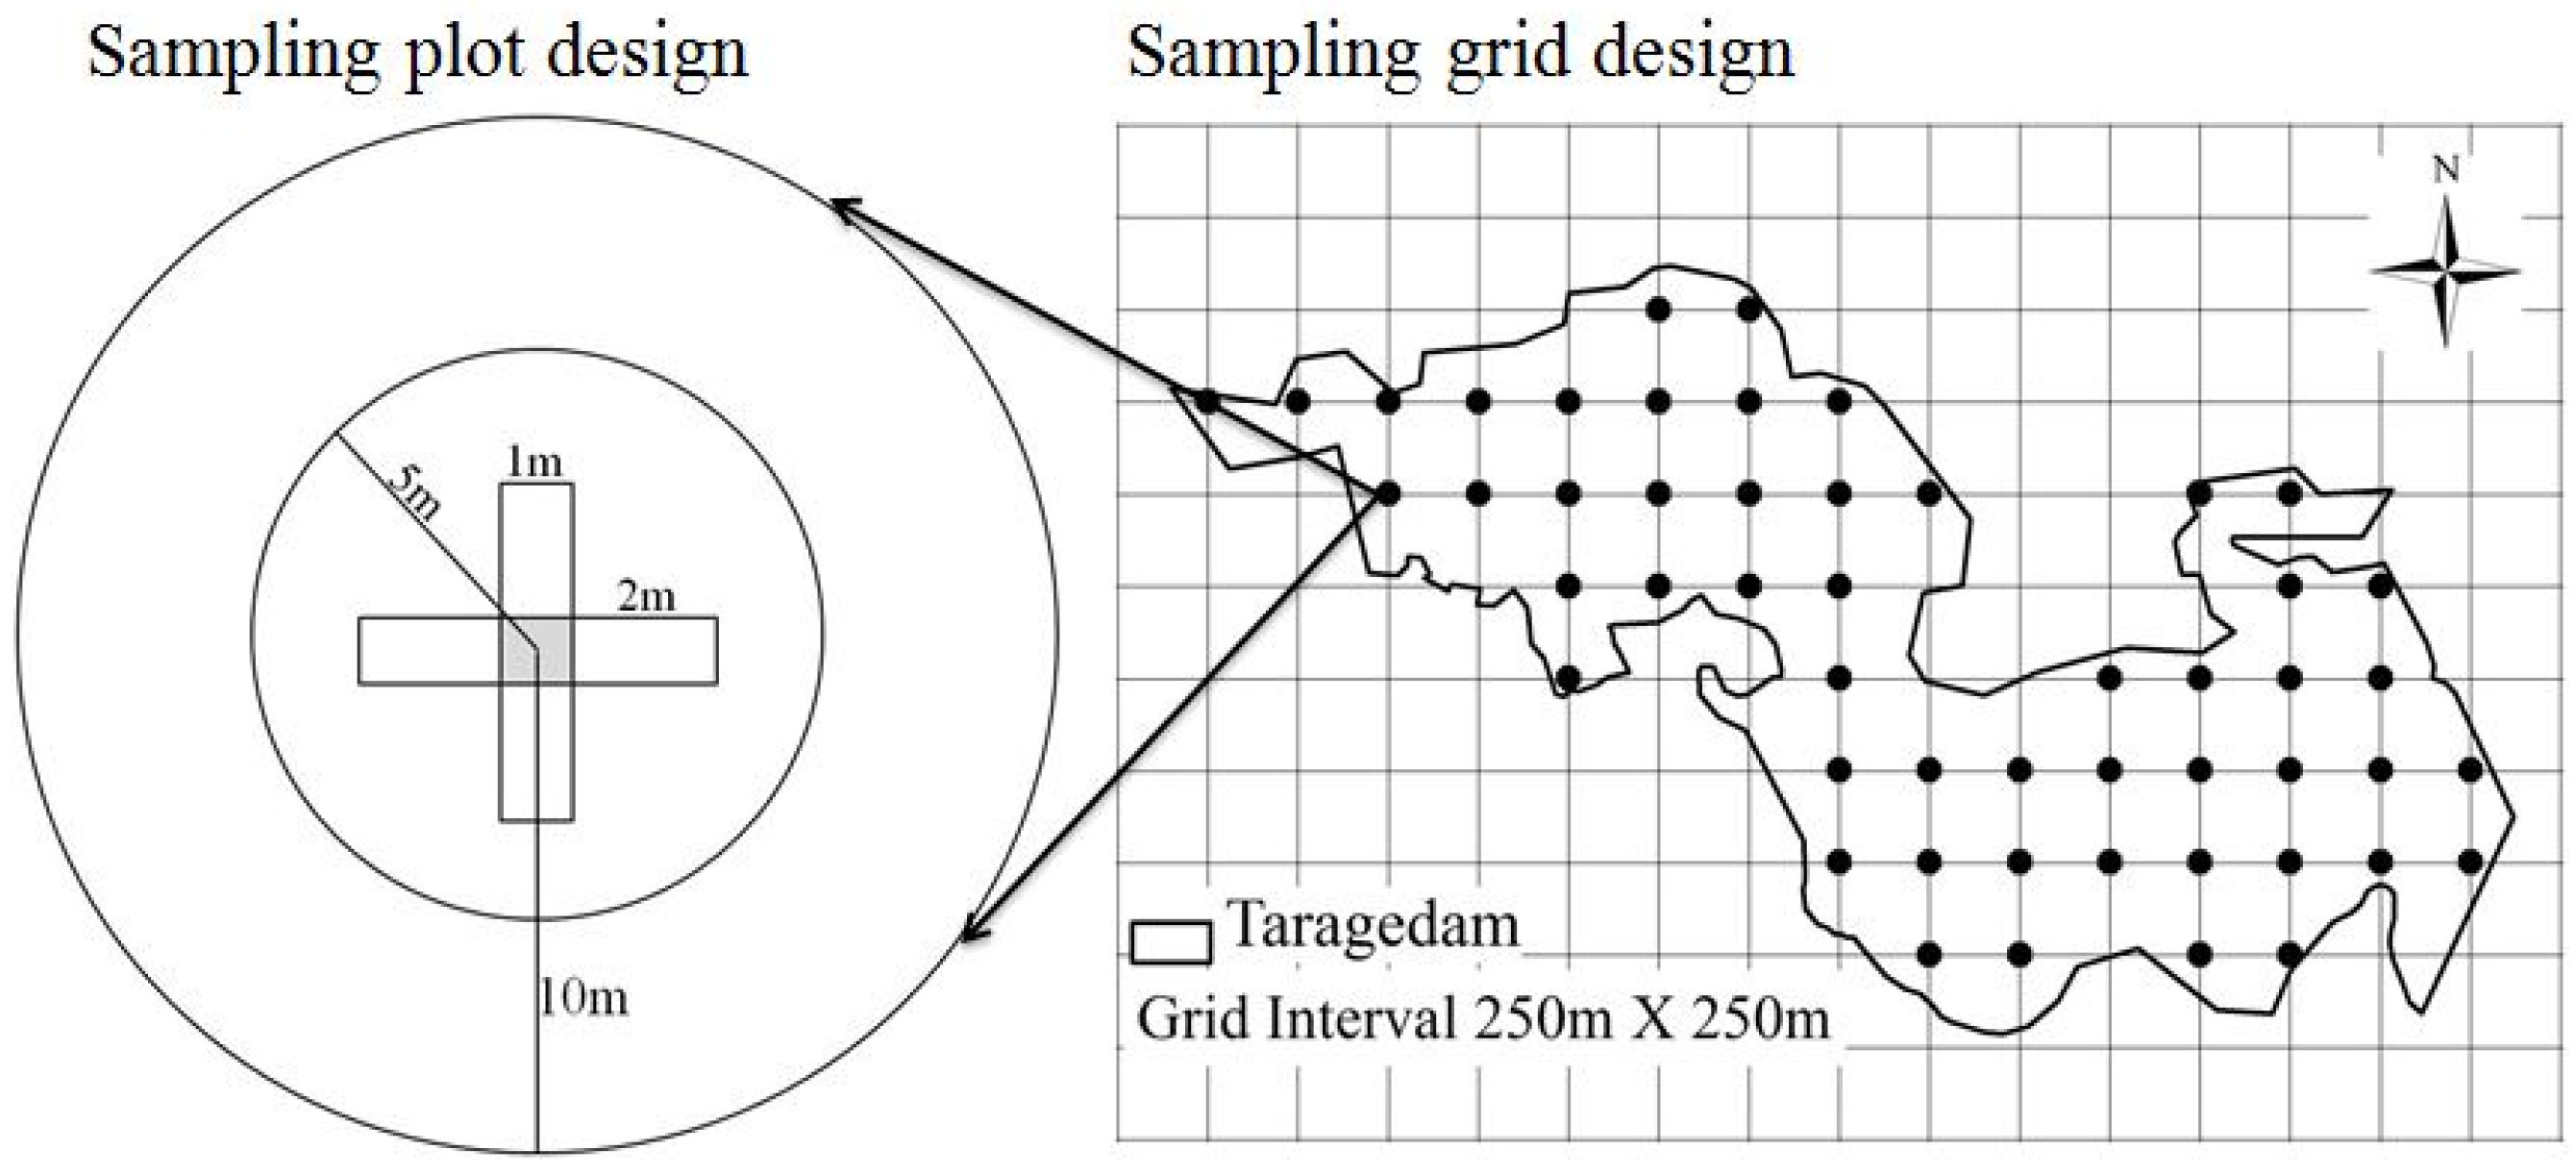
Figure 3.
Land cover map of Amhara region (a) before land cover aggregation and (b) after aggregation of the land cover classes.
Figure 3.
Land cover map of Amhara region (a) before land cover aggregation and (b) after aggregation of the land cover classes.

Table 1.
Summary of the stand characteristics by region, where x is mean, Sd is standard deviation, min is minimum, max is maximum and show the range of the data, and DBH is diameter at breast height.
Table 1.
Summary of the stand characteristics by region, where x is mean, Sd is standard deviation, min is minimum, max is maximum and show the range of the data, and DBH is diameter at breast height.
| Variable | Forest | Woodland | Shrubland | ||
|---|---|---|---|---|---|
| Gelawdiwos | Katassi | Taragedam | Mahibereselassie | Ambober | |
| x ± Sd | x ± Sd | x ± Sd | x ± Sd | x ± Sd | |
| (min–max) | (min–max) | (min–max) | (min–max) | (min–max) | |
| Number of sample plots | 34 | 63 | 52 | 21 | 28 |
| Number of increment cores | 106 | 196 | 58 | 84 | - |
| Number of trees (ha−1) | 314.5 ± 197.6 | 207.1 ± 119.8 | 175.1 ± 131.0 | 191.4 ± 89.5 | NA |
| (63.7–859.4) | (14.1–509.3) | (31.8–541.1) | (70.7–410.3) | ||
| Number of sapling (ha−1) | 4231.7 ± 3195.8 | 1954.3 ± 1988.6 | 3447.7 ± 3893.1 | 660.9 ± 878.1 | 3676.5 ± 2679.7 |
| (0.0–11586.5) | (0.0–9294.7) | (0.0–16297.5) | (0.0–3310.4) | (127.3–16170.1) | |
| Quadratic mean DBH (cm) | 29.3 ± 12.8 | 28.6 ± 14.4 | 25.1 ± 13.4 | 22.5 ± 4.1 | 3.4 ± 0.9 |
| (13.7–73.7) | (14.4–111.9) | (11.5–69.9) | (13.6–31.8) | (1.9–6.9) | |
| Tree height (m) | 10.2 ± 3.6 | 11.0 ± 4.9 | 10.5 ± 2.9 | 7.7 ± 1.6 | 1.9 ± 0.5 |
| (5.1–27.5) | (3.5–29.1) | (4.2–23.5) | (5.0–12.1) | (1.7–4.8) | |
Table 2.
Estimated coefficients of Petterson [34] height-diameter function, where N is the number of inventory plots, and R2 is coefficient of determination.
Table 2.
Estimated coefficients of Petterson [34] height-diameter function, where N is the number of inventory plots, and R2 is coefficient of determination.
| Species | N | DBH (cm) | Height (m) | Coefficients | R2 | |
|---|---|---|---|---|---|---|
| x ± Sd (min–max) | x ± Sd (min–max) | a0 | a1 | |||
| Acacia abyssinica | 50 | 27.8 ± 10.0 (10.0–55.0) | 9.8 ± 3.1 (2.9–20.0) | 0.2000 | 3.8238 | 0.60 |
| Ameja | 28 | 17.2 ± 4.2 (11.0–29.0) | 7.4 ± 1.8 (3.8–10.5) | 0.2343 | 2.8516 | 0.45 |
| Boswellia papyrifera | 33 | 23.5 ± 4.8 (17.1–37.0) | 8.8 ± 1.3 (6.4–12.0) | −0.3113 | −1.2048 | 0.09 |
| Combretum hartmannianum | 27 | 18.5 ± 3.9 (10.0–27.6) | 8.9 ± 1.7 (5.2–11.6) | 0.2162 | 2.6838 | 0.54 |
| Croton macrostachyus | 94 | 18.7 ± 7.9 (10.0–56.0) | 10.3 ± 4.4 (4.3–28.3) | 0.1818 | 2.6777 | 0.43 |
| Eucalyptus camaldulensis | 72 | 24.0 ± 12.8 (10.0–60.0) | 16.4 ± 7.8 (4.0–36.3) | 0.1589 | 2.0771 | 0.60 |
| Juniperus procera | 52 | 27.0 ± 7.3 (11.0–39.0) | 12.5 ± 2.8 (4.3–18.5) | 0.2473 | 1.3106 | 0.19 |
| Lannea fruticose | 30 | 18.3 ± 3.8 (12.0–30.0) | 7.6 ± 1.8 (4.7–11.8) | −0.3196 | −1.4110 | 0.08 |
| Olea europaea | 27 | 34.0 ± 21.9 (10.2–103.0) | 9.7 ± 4.6 (2.5–28.5) | 0.1937 | 4.6001 | 0.61 |
| Sterculia setigera | 28 | 28.7 ± 5.7 (16.0–43.0) | 8.2 ± 1.0 (6.2–10.3) | −0.3274 | −1.4856 | 0.17 |
| Albizia schimperiana | 116 | 23.1 ± 13.2 (10.0–86.0) | 13.0 ± 6.2 (5.3–30.7) | 0.1633 | 2.7559 | 0.53 |
| Allophylus abyssinicus | 35 | 29.2 ± 12.2 (13.0–54.5) | 13.4 ± 4.7 (6.0–23.1) | 0.2110 | 2.0123 | 0.33 |
| Bugtsi | 27 | 20.6 ± 6.0 (11.0–37.0) | 10.8 ± 2.7 (5.7–17.4) | 0.2351 | 1.7723 | 0.28 |
| Chionanthus mildbraedii | 38 | 49.3 ± 15.8 (11.9–95.0) | 14.2 ± 3.9 (4.0–24.2) | −0.2123 | −3.0405 | 0.29 |
| Gimblitini | 37 | 22.0 ± 8.3 (11.0–38.0) | 9.2 ± 2.5 (4.6–13.0) | 0.2531 | 2.0776 | 0.47 |
| Kanabal | 37 | 15.7 ± 4.7 (10.0–28.5) | 7.9 ± 2.1 (3.4–11.3) | 0.2746 | 1.7087 | 0.26 |
| Nuxia congesta | 48 | 15.6 ± 4.1 (10.0–29.0) | 8.8 ± 3.2 (3.1–23.1) | 0.3273 | 0.5572 | 0.01 |
| Podocarpus falcatus | 24 | 20.8 ± 4.9 (12.0–27.0) | 13.1 ± 1.7 (9.9–16.2) | −0.2244 | −1.3208 | 0.67 |
| Prunus Africana | 42 | 39.5 ± 20.8 (13.0–132.0) | 18.1 ± 6.2 (6.6–34.7) | 0.1781 | 2.2629 | 0.47 |
| Teclea nobilis | 25 | 21.3 ± 10.5 (10.0–44.0) | 9.3 ± 1.7 (7.0–14.4) | −0.3169 | −0.6551 | 0.17 |
| Other Species Gelawdiwos | 121 | 26.0 ± 22.7 (10.0–108.0) | 10.4 ± 5.3 (3.5–29.9) | 0.2170 | 2.2612 | 0.17 |
| Other species Katassi | 58 | 24.1 ± 16.7 (10.0–102.0) | 11.1 ± 7.6 (3.8–33.8) | 0.1772 | 3.0084 | 0.46 |
| Other species Taragedam | 33 | 21.5 ± 17.8 (11.0–114.0) | 10.7 ± 4.9 (4.4–28.8) | 0.1894 | 2.6257 | 0.39 |
| Other species Mahibereselassie | 72 | 21.4 ± 9.5 (10.0–50.0) | 8.0 ± 2.7 (3.5–15.9) | 0.2514 | 2.6596 | 0.33 |
Table 3.
Land cover classes and characterization features.
| Land Cover Class | Characterization Features |
|---|---|
| Forest | More than or equal to half of the pixel should be first covered with vegetation. The vegetation part was checked for its relative density, color and consistency. If the vegetation is relatively dense and consistently became greater than or equal 1 ha, the class of the pixel is assigned as a forest cover. |
| Shrubland | Scattered shrubs, bushes: If the half or larger part of the pixel is vegetation with scattered, light green and inconsistent pattern, the class of the pixel is assigned as a shrubland. |
| Woodland | Woodlands are mainly situated in the northwestern low land parts of Amhara region. The agricultural fields and grass lands in the lowland parts are clearly and easily detectable due to their distinct color and pattern. Woodlands have green and grey color. Unlike to woodlands, shrubs lands have bright color. |
| Non-Vegetation (Cultivation, Grassland, bare land) | Cultivation: Agricultural fields can be identified with their patterns, proximity to rural resident areas and dark to grey color. |
| Grassland: Grasslands appear from bright grey to white areas. It is often between vegetation and agriculture fields. | |
| Bare land: Similar to grassland but remain grey to white during even the rainy season unlike grasslands. | |
| Urban | Built ups, main roads, bright reflectance. |
| Water | Lake Tana consists of more than 95% of the water bodies in the Amhara region. The lake is easily detectable. Pond-like structures. Rivers are not included as a water body as they often cover small parts of the 4-ha pixel. |
Table 4.
Results of the stand situation in 2014.
| Region | N | Volume (m3·ha−1) | Carbon (Mg·ha−1) |
|---|---|---|---|
| x ± sd (min–max) | x ± sd (min–max) | ||
| Gelawdiwos | 34 | 92.4 ± 68.1 (6.0–317.4) | 54.6 ± 43.6 (2.3–175.4) |
| Katassi | 63 | 75.9 ± 60.2 (2.5–270.1) | 37.7 ± 32.6 (0.0–144.7) |
| Taragedam | 52 | 28.9 ± 56.5 (0.0–352.8) | 13.8 ± 32.7 (0.0–210.4) |
| Ambober | 28 | 3.7 ± 3.4 (0.3–18.2) | 1.11 ± 0.92 (0.1–4.6) |
| Mahibereselassie | 21 | 27.6 ± 10.7 (7.1–48.5) | 11.9 ± 5.2 (2.1–23.7) |
Table 5.
Annual volume increment, carbon increments and Net Primary Production (NPP) of inventory plots by region.
Table 5.
Annual volume increment, carbon increments and Net Primary Production (NPP) of inventory plots by region.
| Region | N | Volume Increment (m3·ha−1·year−1) | Carbon Increment (Mg·ha−1·year−1) | NPP (gC·m−2·year−1) |
|---|---|---|---|---|
| x ± sd (min–max) | x ± sd (min–max) | x ± sd (min–max) | ||
| Forest | ||||
| Gelawdiwos | 34 | 3.5 ± 2.7 (0.2–11.3) | 1.9 ± 1.5 (0.1–6.5) | 597.2 ± 393.8 (101.4–1705.5) |
| Katassi | 63 | 3.6 ± 2.6 (0.0–11.2) | 1.7 ± 1.3 (0.0–5.6) | 486.8 ± 322.7 (46.5–1306.5) |
| Taragedam | 52 | 1.0 ± 1.4 (0.0–6.2) | 0.5 ± 0.7 (0.0–3.7) | 305.4 ± 313.2 (0.0–1506.8) |
| Shrubland | ||||
| Ambober | 28 | 0.9 ± 0.9 (0.0–4.6) | 0.22 ± 0.18 (0.02–0.93) | 55.4 ± 46.0 (4.8–231.2) |
| Woodland | ||||
| Mahibereselassie | 21 | 1.2 ± 0.5 (0.3–2.6) | 0.5 ± 0.2 (0.1–1.1) | 150.4 ± 62.9 (61.4–296.2) |
Table 6.
Land cover classification accuracy assessment.
| Automated Result | Independent Data | Total | |||||
|---|---|---|---|---|---|---|---|
| Forest | Shrubland | Woodland | Non-Vegetation | Water | Urban | ||
| Forest | 23 | 1 | 11 | 8 | 1 | 1 | 45 |
| Shrubland | 19 | 45 | 29 | 28 | - | - | 121 |
| Woodland | 1 | 20 | 33 | 3 | - | - | 57 |
| Non-vegetation | 56 | 72 | 27 | 123 | - | - | 278 |
| Water | 1 | - | - | - | 99 | - | 100 |
| Urban | - | - | - | - | - | 6 | 6 |
| Total | 100 | 138 | 100 | 162 | 100 | 7 | 607 |
Table 7.
Land cover classes and their respective area by agroecological zones of Amhara region.
| Agroecological Zones | Elevation (m.a.s.l.) | Forest (ha) | Shrubland (ha) | Woodland (ha) | Non-Vegetation (ha) | Inventory Sites |
|---|---|---|---|---|---|---|
| Low Land (Kolla) | 500–1500 | 25,098 | 1,855,284 | 780,448 | 1,752,212 | Mahibereselassie |
| Mid Altitude (Weyna Dega) | 1500–2300 | 115,838 | 1,845,350 | 131,030 | 4,643,435 | Ambober, Katassi and Taragedam |
| High Land (Dega) | 2300–3200 | 100,692 | 473,927 | 13,621 | 3,169,069 | Gelawdiwos |
| Sub-Alpine (Wurch) | 3200–3700 | 9354 | 52,847 | 5192 | 355,661 | - |
| Alpine (High Wurch) | 3700–4530 | 104 | 60,111 | 93 | 10,088 | - |
| Total | 251,088 | 4,287,519 | 930,384 | 9,930,464 | ||
| Grand Total | 15,399,456 | |||||
Table 8.
Total volume stock, annual increment, carbon stock, annual increment, and NPP for the Amhara region. The results are obtained through: Total Volume/Carbon = the size of forest areas in elevation classes (Table 7) × corresponding to the mean terrestrial forest inventory volume/carbon estimates (Table 5). We used the mean volume/carbon estimates of Mahibereselassie woodland and Ambober shrubland to extrapolate to the total volume/carbon estimates of woodland and shrubland, respectively found in all elevation classes of the Amhara region.
| Land Cover | Volume (million m3) | Volume Increment (million m3·year−1) | Carbon (Tg) | Carbon Increment (Tg·year−1) | NPP (gC·m−2·year−1) |
|---|---|---|---|---|---|
| Forest | 17.56 | 0.71 | 7.78 | 0.34 | 484.32 |
| Shrubland | 15.86 | 3.86 | 4.76 | 0.95 | 55.4 |
| Woodland | 25.68 | 1.12 | 11.07 | 0.47 | 150.40 |
© 2017 by the authors. Licensee MDPI, Basel, Switzerland. This article is an open access article distributed under the terms and conditions of the Creative Commons Attribution (CC BY) license (http://creativecommons.org/licenses/by/4.0/).
Share and Cite
MDPI and ACS Style
Sisay, K.; Thurnher, C.; Belay, B.; Lindner, G.; Hasenauer, H. Volume and Carbon Estimates for the Forest Area of the Amhara Region in Northwestern Ethiopia. Forests 2017, 8, 122. https://doi.org/10.3390/f8040122
AMA Style
Sisay K, Thurnher C, Belay B, Lindner G, Hasenauer H. Volume and Carbon Estimates for the Forest Area of the Amhara Region in Northwestern Ethiopia. Forests. 2017; 8(4):122. https://doi.org/10.3390/f8040122
Chicago/Turabian StyleSisay, Kibruyesfa, Christopher Thurnher, Beyene Belay, Gerald Lindner, and Hubert Hasenauer. 2017. "Volume and Carbon Estimates for the Forest Area of the Amhara Region in Northwestern Ethiopia" Forests 8, no. 4: 122. https://doi.org/10.3390/f8040122
Note that from the first issue of 2016, this journal uses article numbers instead of page numbers. See further details here.