
Modeling Variation in Crown Profile with Tree Status and Cardinal Directions for Planted Larix olgensis Henry Trees in Northeast China


Department of Forest Management, School of Forestry, Northeast Forestry University, Harbin 150040, China
*
Author to whom correspondence should be addressed.
Forests 2017, 8(5), 139; https://doi.org/10.3390/f8050139
Submission received: 25 January 2017
/
Revised: 19 April 2017
/
Accepted: 19 April 2017
/
Published: 26 April 2017
Abstract
:Crown profile models were developed for north, east, south, and west crown directions of dominant trees, intermediate trees, and suppressed trees in planted stands of Larix olgensis Henry in Northeast China. A total of 139 sample trees were randomly selected, and all branches of each tree were measured. A segmented power equation, segmented polynomial equation, modified Weibull equation, and Kozak equation were selected as the candidate models. A traditional approach that did not consider the differences between tree status and crown directions was also developed. Three steps were conducted to analyze the effect of tree status (dominant, intermediate, and suppressed tree) and crown direction (north, east, south, and west) on the crown profiles using a dummy variable approach. Step 1 considered only tree status, Step 2 considered only crown direction, and Step 3 took both tree status and crown direction into account. Nonlinear mixed-effects model was used to express the effect of individual tree level on crown shape, and was also compared to the ordinary least-squares and generalized least-squares model. The results demonstrated that the modified Kozak equation showed good performance in the crown profile description. The nonlinear mixed-effects model significantly improved the model performance compared to the ordinary least-squares and generalized least-squares model. There were differences among the crown profiles among the four directions of dominant, intermediate, and suppressed trees. South-oriented crowns had the tendency to be the largest, which is likely to be mainly a result of light conditions. The competition status of the subject tree was the main reason leading to an asymmetric crown. Individual trees with strong competition levels had smaller crowns.
1. Introduction
Crown size exhibits an intimate relationship to species diversity and ecosystem stability; it is directly related to the growth and yield of individual trees within a specified stand and provides a reference for decision-making in forest management [1]. The light conditions at different latitudes is the most decisive factor in determining the crown profile in comparison to other factors, such as the competition index, water and nutrient variations [2], or genetics and the physical environment [3]. However, the potential influence of inter-tree competition should not be ignored, as it can factor into determining the asymmetric shape of a tree’s crown [4].
Various variables have been widely used to reflect the gross crown size, such as crown length or crown ratio [5], crown width [6], crown surface area, crown volume [7], and leaf area and biomass distribution [8]. Crown length and crown width focus on the crown features in vertical and horizontal directions, respectively. In comparison, crown volume, crown surface area, and leaf features are more effective variables in describing the spatial characteristics of the crown, and can reflect the competition level of an individual tree in forest stands; however, these characteristics are difficult to measure directly. Crown profile is another crown attribute that can reflect crown size and which can be modeled through easily-measured tree variables. Furthermore, the largest crown width, crown volume, and surface area can be calculated based on a crown profile model. A crown profile model can also be invaluable in evaluating inter-tree competition [9], tree vigor, and biodiversity evaluation [10]. Because tree and stand variables are continuously changing during the growth period, developing a crown profile model represents an efficient alternative to direct measurements, as it is costly and time consuming to measure crown profiles for all trees [3].
Generally, crown profiles are modeled using two approaches. The first approach divides the entire crown into two sections: the “light crown” and the “shade crown”, with models developed separately for each of the two parts [11]. The second method uses a single equation without a break point to model the entire crown [9,12,13]. The disadvantage of the first approach is that the continuity of the entire crown is not considered; thus, the second approach has become increasingly popular. Today, the polynomial equation and variable exponent equation are frequently used in directly or indirectly modeling crown profiles [14,15,16]. The polynomial equation was usually defective in the prediction accuracy of the maximum radius, and the variable exponent equation would express various shapes of the outer crown by changing the exponent of the function [9].
Heilongjiang Province is located in Northeast China, and has rich forest resources. The total area of forest in the Heilongjiang Province of Northeast China is approximately 19.63 million hectares, with a forest coverage of about 43.16%. Larix olgensis Henry is one of the most important coniferous and afforestation tree species in Heilongjiang Province. The area planted with Larix olgensis amounts to about 45% and 36% of the total forested planted tree area and standing volume, respectively [17]. To date, there are limited studies on the outer crown profile of Larix olgensis plantations in China. To the best of our knowledge, most current crown profile models emphasize the hypothesis that the crown shape is symmetrical in all directions. In contrast, the shape of the crown in our study may be asymmetrical because of inter-tree competition. Thus, the goals of the present study were to: (1) select the best equation to develop the entire outer crown profile model for individual trees in planted stands of Larix olgensis in Heilongjiang Province, Northeast China; (2) evaluate the differences in crown profiles between tree statuses (dominant, intermediate, and suppressed), assuming that the crown is symmetrical, and then between the four crown directions (i.e., north, east, south, and west) with the assumption of no differences existing between tree statuses, and then by considering the tree status and crown directions together.
2. Materials and Methods
2.1. Study Area and Data Collection
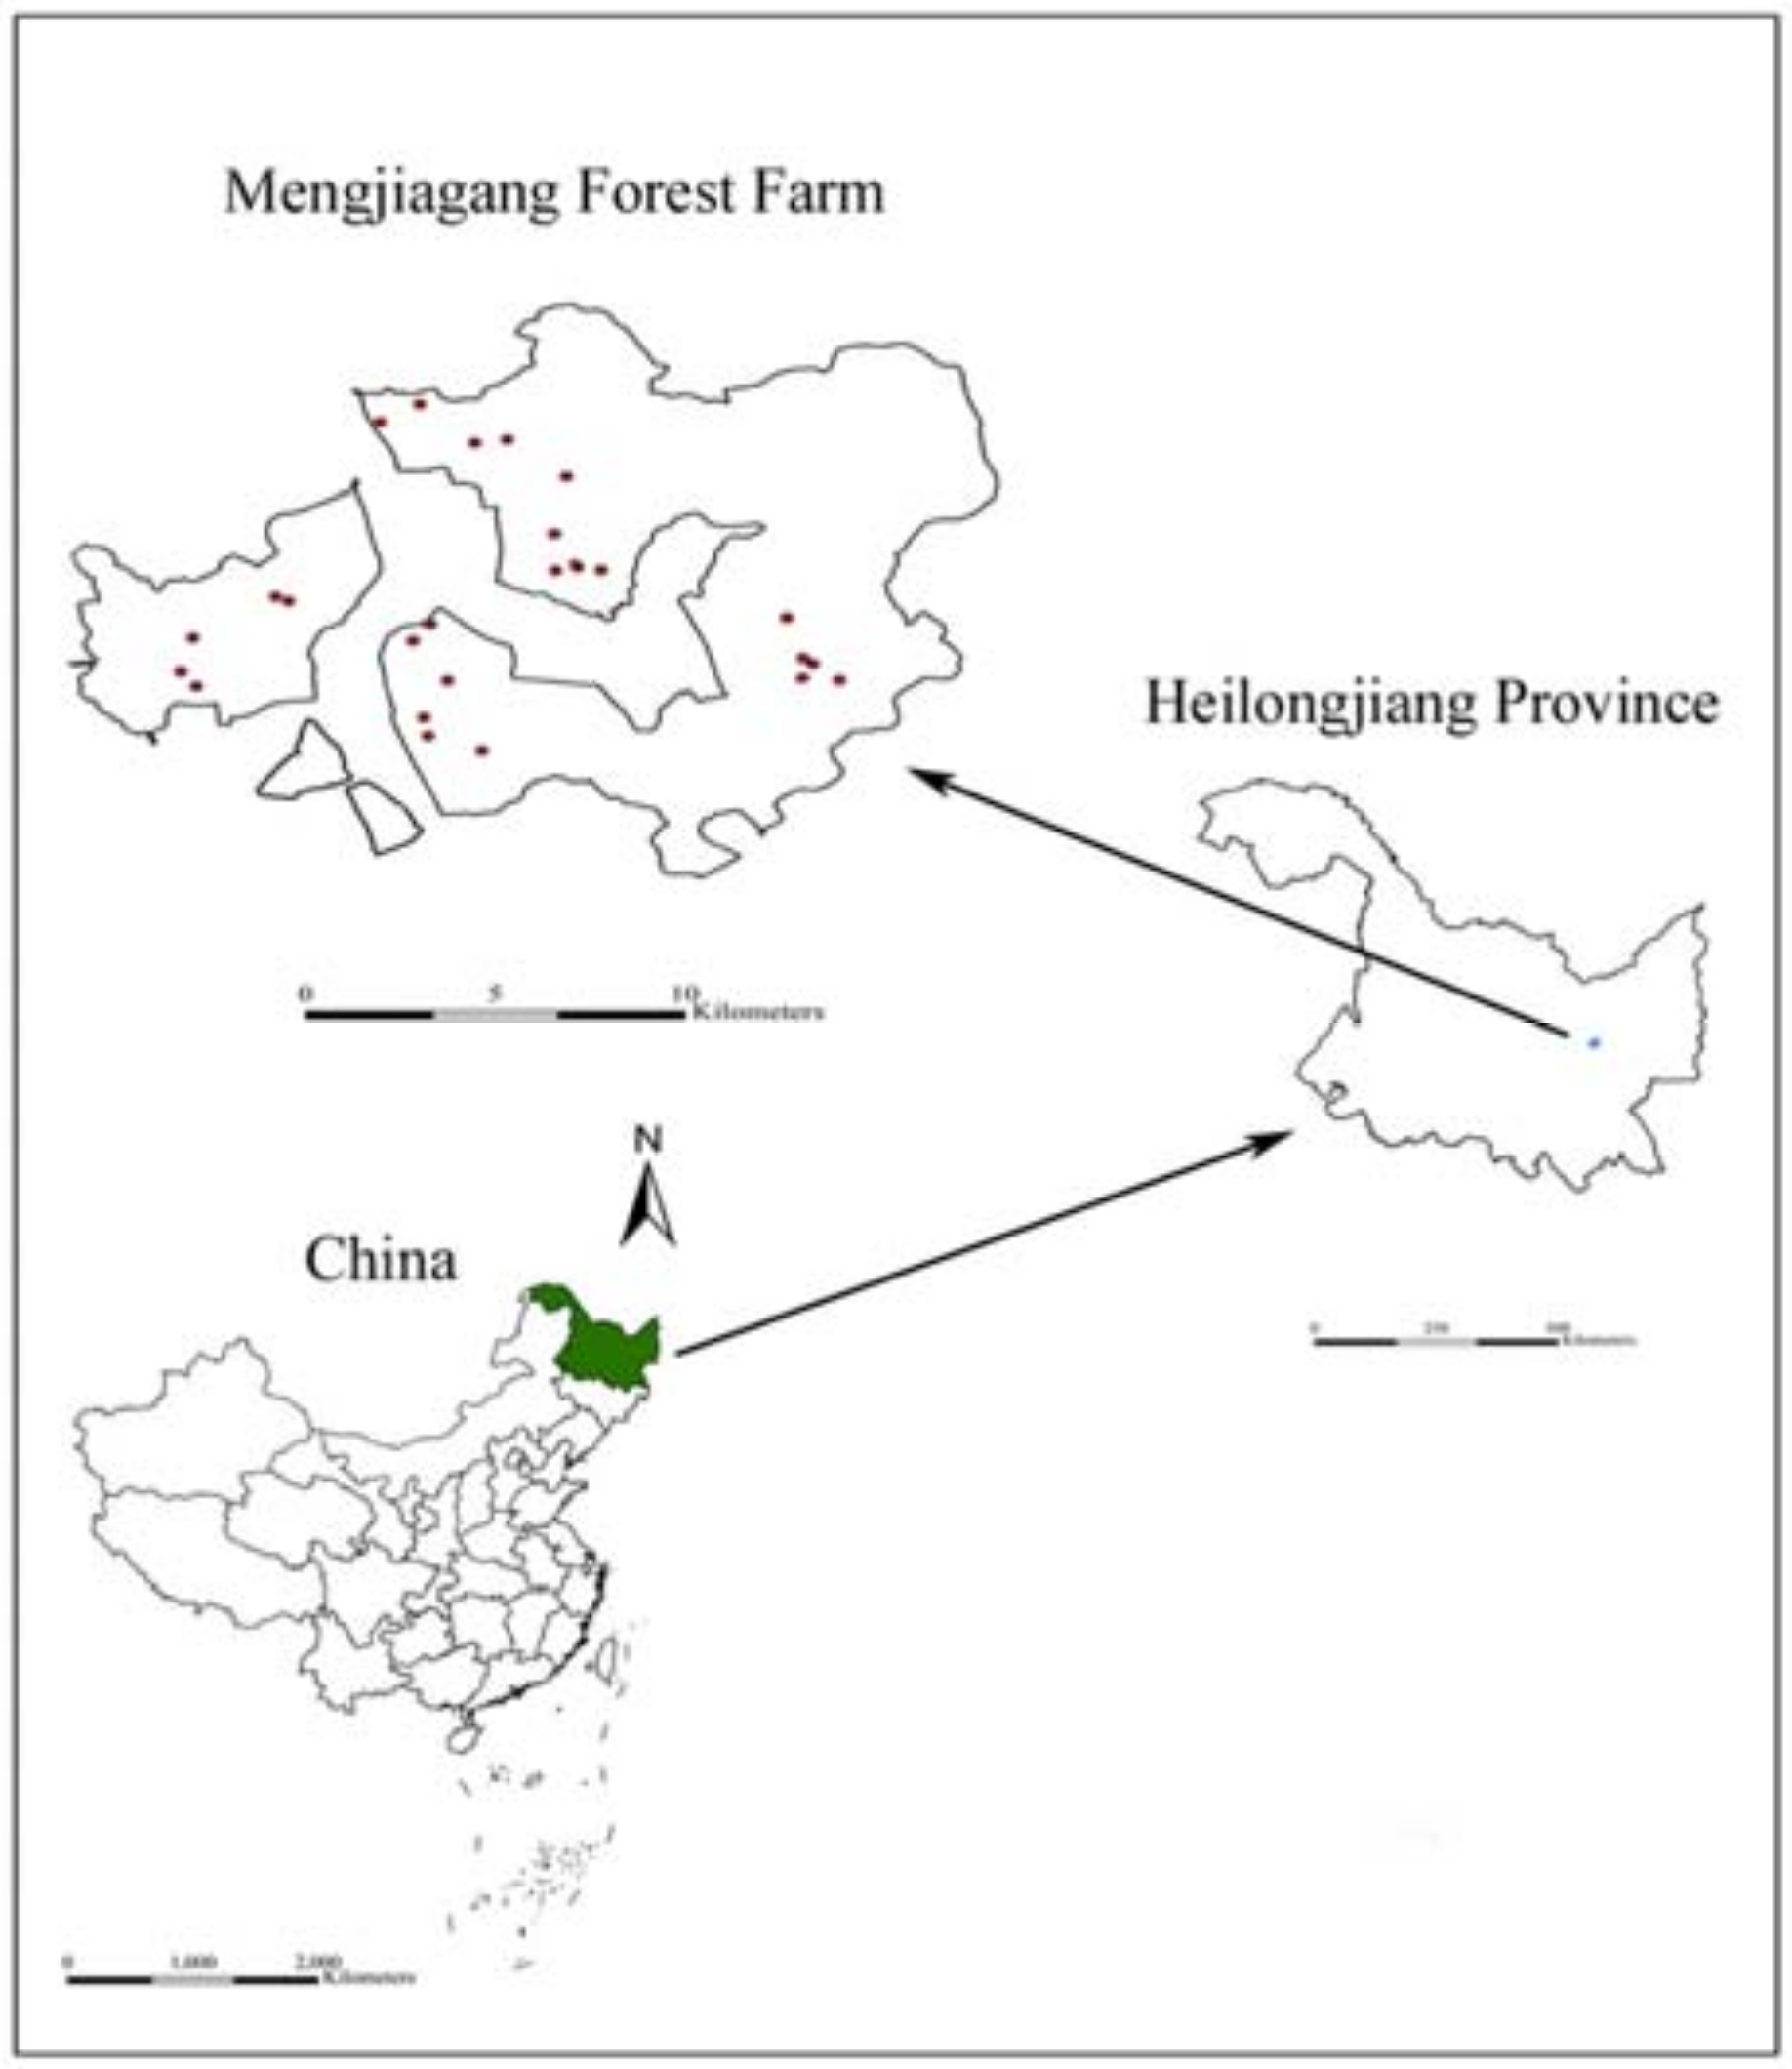
The study was conducted at the Mengjiagang forest farm (130°32′–130°52′ E, 46°20′–46°30′ N), which is in the Heilongjiang Province of Northeast China (Figure 1). The altitude of this area ranges from 168 to 575 m. The slope ranges from 10 to 20°, with an average of 15°. The mean annual rainfall is 550 mm, and approximately 83–94% of the precipitation falls during the growing season. The maximum and minimum temperatures are, respectively, 35.6 °C and −34.7 °C, with an average of 2.7 °C, and frost usually occurs in September and concludes at the end of April.
A total of 26 plots that were either 30 × 20 m or 20 × 20 m in size were established in July and August of 2007, 2008, and 2015. The number of plots that were <20, 20–30, 30–40, 40–50, and >50 years old were 3, 3, 5, 10, and 5, respectively. Summary statistics for the plots are listed in Table 1. A total of 139 sample trees with healthy and undamaged crowns—including 32 dominant trees, 52 intermediate trees, and 55 suppressed trees—were collected, and the summary statistics of the sample trees are listed in Table 2.
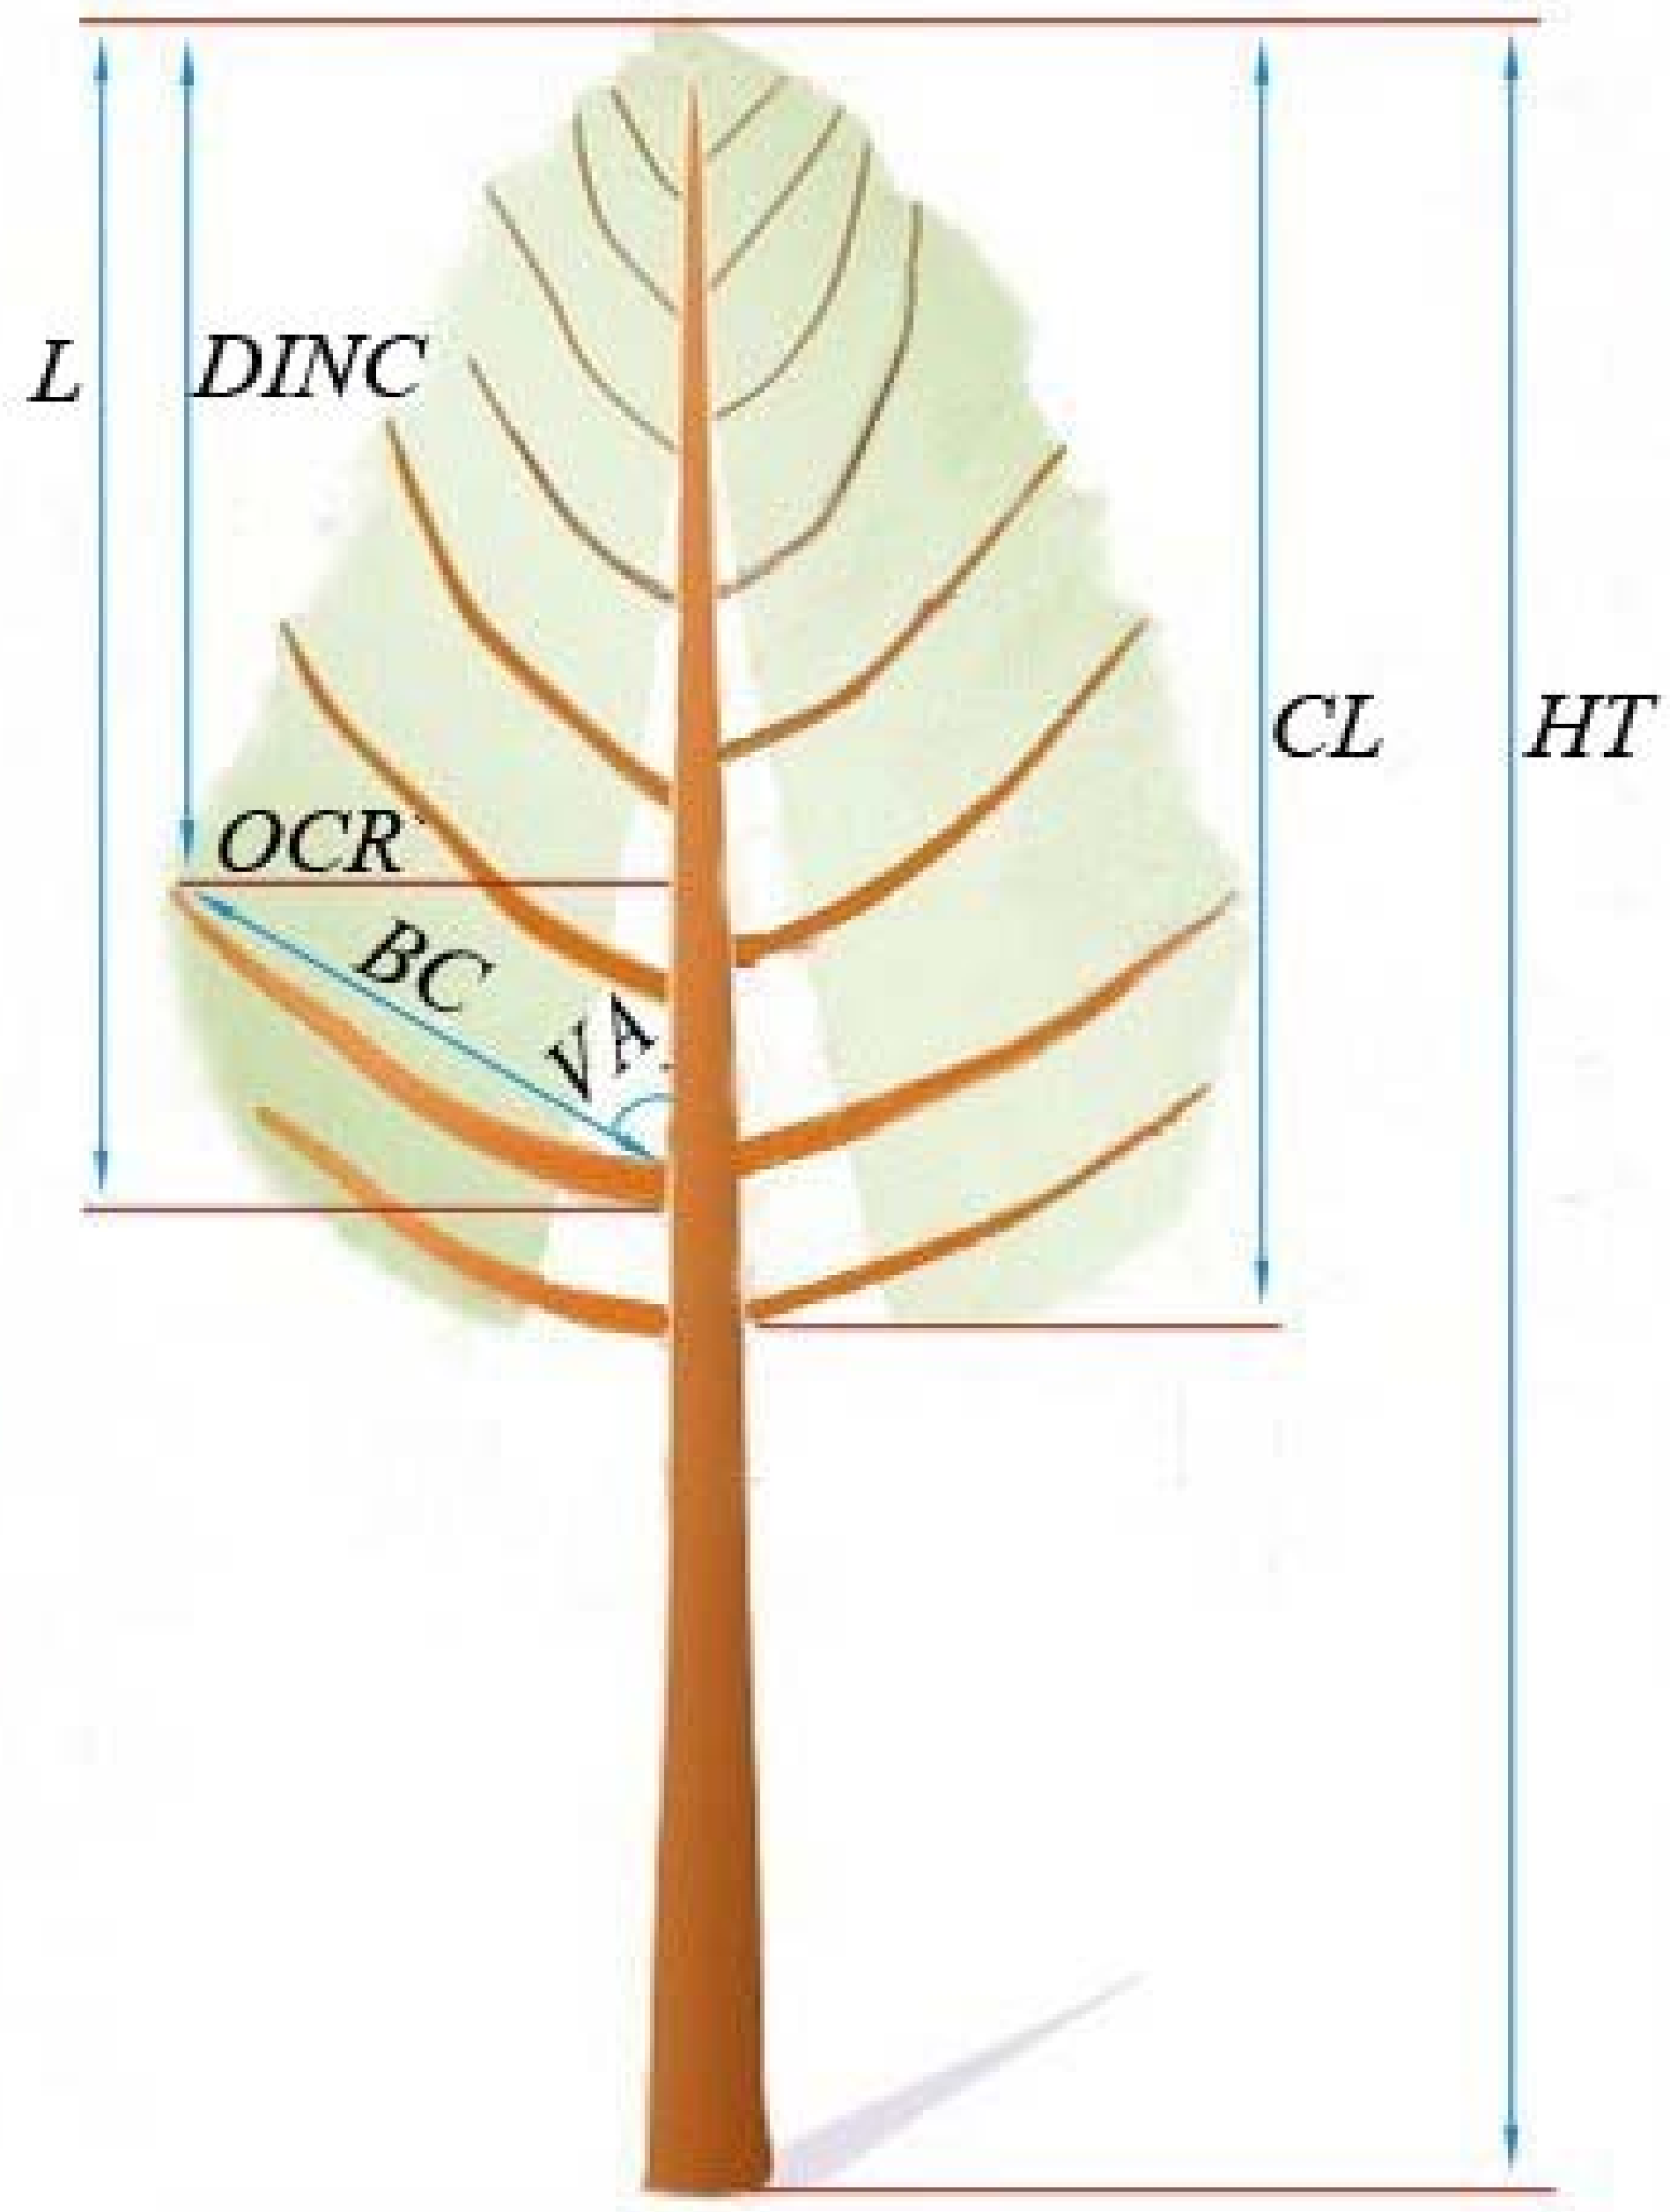
Diameter at breast height (DBH, cm)—defined as 1.3 m above the ground—for all sample trees was measured before the trees were felled. A vertical line from the ground to breast height was marked on the trunk with chalk to denote the magnetic northern side. The sample tree was felled carefully to reduce the damage to the crown, and the total tree height (HT, m) from the stump to tree tip was measured. The ratio of total tree height to DBH (HD) was calculated by HT/DBH. The lowest whorl that contained at least one live branch was defined as the crown base. The length from tree tip to the crown base was defined as the crown length (CL, m), and crown ratio (CR) was calculated by CL/HT. The marked line on the trunk was extended to the tree tip through the trunk. The stem was cut into 1-m sections from the ground to tree tip. From the tree tip to the crown base, each section was placed upright, all branches were numbered clockwise, and the azimuth angles were determined using an angle meter. The following branch attributes of branch length (BL, cm), branch chord length (BC, cm), branch angle (VA, °), branch diameter (BD, mm), and absolute depth into the crown from the tree tip down to the position of the branch basis (L, cm) were measured sequentially. The absolute depth into the crown radius of interest (DINC, cm) was the difference between the length from the tree tip to the branch base, and the projection onto the trunk of the branches was based on the trigonometric relationship. All symbols used for individual branch attributes in the study are explained in Figure 2. A total of 12,605 live and undamaged branches were measured, including 3706 for dominant trees, 4577 for intermediate trees, and 4322 for suppressed trees.
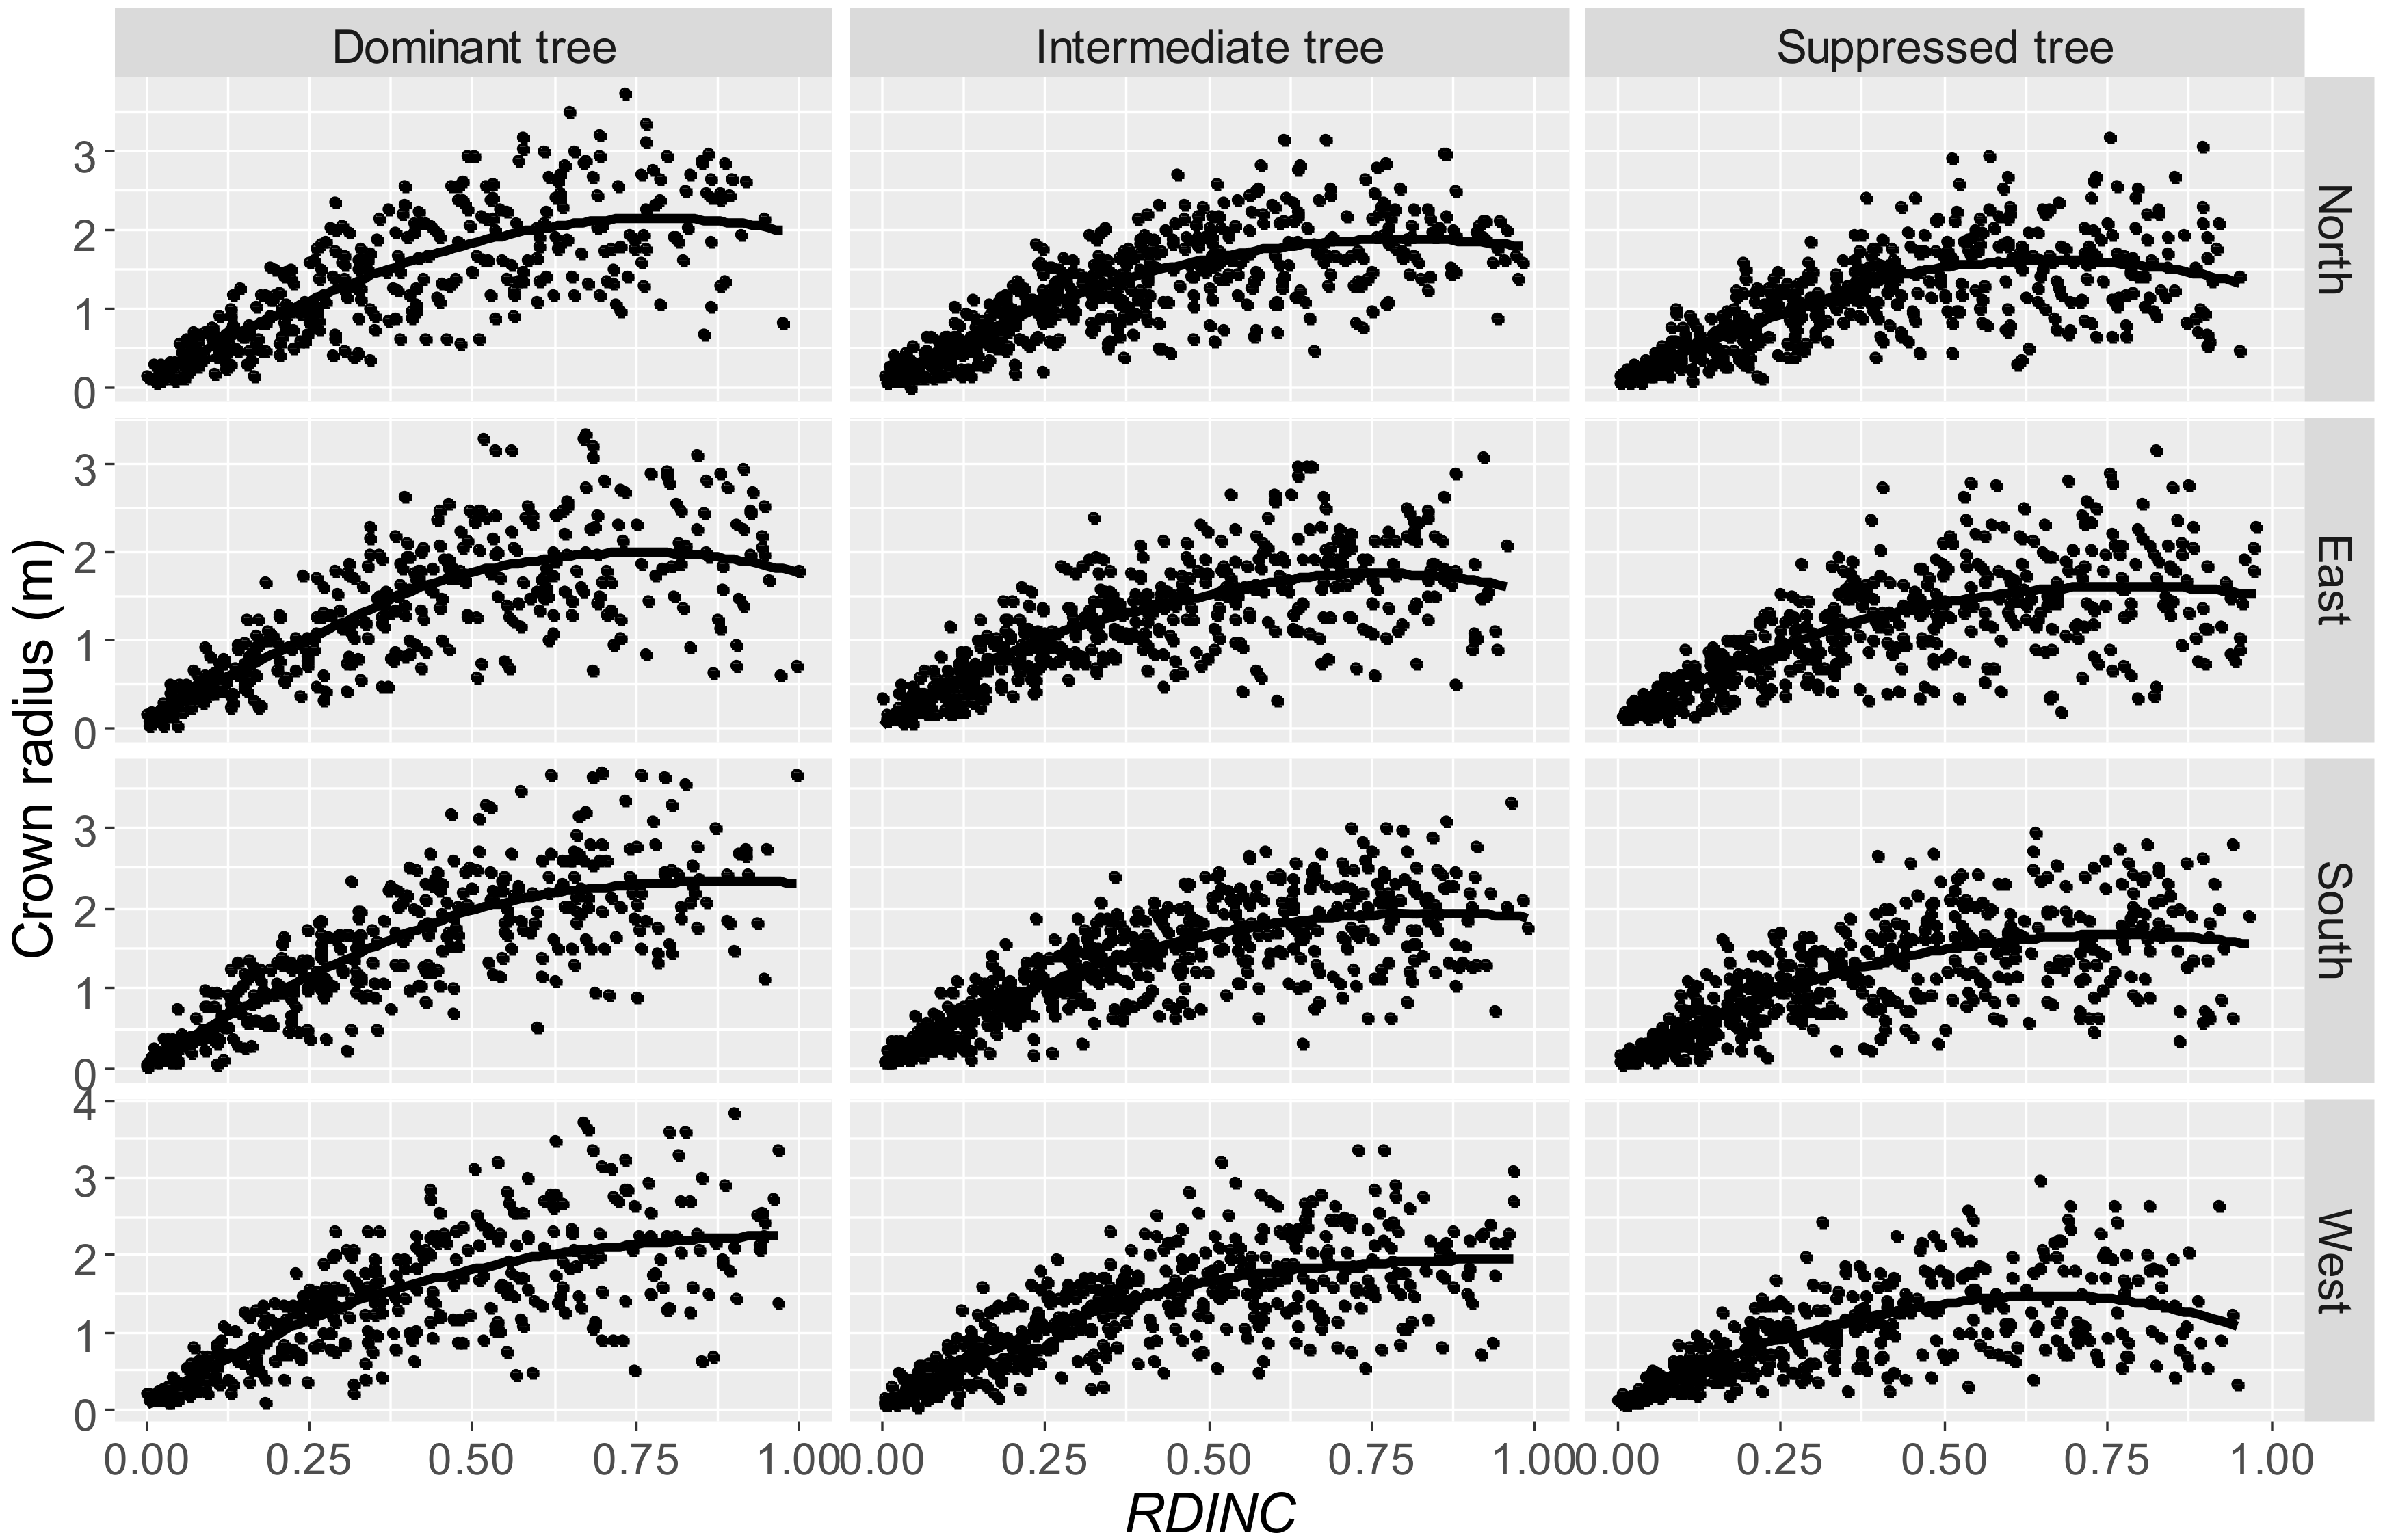
To describe the entire outer crown profile of each crown direction, only the largest branches (with the largest crown radius) of each whorl from each direction were used. Due to difficulty in differentiating the whorls of Larix olgensis from the sprouting branches between whorls, we divided the entire crown of all sample trees into sections with equal lengths of 0.5 m. The data was disaggregated per the following procedures. All branches from all trees were divided into four directions, with the azimuth of branch ranging from 315 to 360° and from 0 to 45° defined as north, from 45 to 135° defined as east, from 135 to 225° defined as south, and from 225 to 315° defined as west. Firstly, the largest branch from each direction of all trees was selected and defined as dataset A. Then, dataset A was divided into three categories based on three tree statuses and defined as dataset B. Thirdly, dataset A was divided into four categories according to the four directions and defined as dataset C. Lastly, dataset A was further classified into twelve categories based on the three tree statuses and four directions, and was defined as dataset D. Scatterplots of the largest branches selected from the four directions for dominant trees, intermediate trees, and suppressed trees plotted against RDINC (defined as DINC/CL) are shown in Figure 3.
2.2. Best Model Selection
Candidate equations used in our study were derived from the existing crown profile equation and the equation developed by our research. Due to the similarity between the maximum branch diameter distribution within the live crown, taper profile, and the outer crown profile, the equations used in these studies were also applied.
Ferrarese et al. [13] modified the Weibull equation to model the outer crown profile. We used this equation and modified it in Equation (1).
where OCR is the outer crown radius; DBH, CR, and HD are the diameter at breast height, crown ratio, and the ratio of total tree height to DBH, respectively; RDINC is the relative depth into the crown; and a1–a7 are parameters to be estimated.
A segmented power equation joined by two sub-equations and formulated as a single model was developed in Equation (2).
- where , RDINC [0,1].
- where a1–a10 are model parameters.
A segmented polynomial equation that has previously been used in describing the largest branches diameter distribution within the entire live crown [16] was modified in Equation (3).
The Kozak (1988) model has been modified and showed good performance in previous research studying the maximum branches diameter distribution [18]. We further modified it, and the final model is defined in Equation (4).
All the selected equations took the following form:
where OCRik was the outer crown radius of the ith branch from the kth tree; RDINCik was the relative depth into crown of the ith branch from the kth tree; was the tree variables of the kth tree; was the parameters vector; and eik was the error term.
The candidate equations were fitted by ordinary least-squares. All candidate equations were compared in terms of the adjusted coefficient of determination (Ra2), the root mean squared error (RMSE), Akaike’s information criterion (AIC), and the Bayesian information criterion (BIC) using dataset A. The equation which had the largest Ra2 and the smallest RMSE, AIC, and BIC performed best. The number of parameters was another factor that was considered, as the selected model should have a low number of parameters, but give the best model performance.
Branches were collected from different trees and different plots, indicating the hierarchical or nested data structure. The mixed-effects model had potential advantages in solving this problem by considering the within-group correlation [19]. Based on the best model selected, the nonlinear mixed-effects model on tree level was generally defined as:
where OCRij is the jth largest observed crown radius on the ith subject tree; M is the number of trees; Mi is the number of the largest branches in group i; f(·) is the regression function with the group-specific parameter vector θij and covariate vector Xij; εij is the within-tree error term; θij is formulated by θij = Aijα + Bijδ, in which Aij and Bij are design matrixes, α is a p × 1 vector of fixed effects parameters, and δ is q × 1 vector of random effects. All the possible expansions of only one parameter were considered mixed-effects parameters, and the model with the smallest AIC and BIC and the largest Log-likelihood was selected as the best model. The first-order autoregressive structure AR(1) was used to explain the autocorrelation in the residuals within the same crown [20]. The AIC and BIC were used to compare the models. The error variance was modelled to avoid heteroscedasticity problems by using power and exponential variance function. The model was also fitted by generalized least-squares, which enables the inclusion of a specific function to model the error variance but excludes the random effects. The complex covariance structure is explained directly by the variance structure of the εij term.
2.3. Crown Profile Models for Three Tree Status and Four Directions
Once the final model was selected, a crown profile model that did not differentiate the tree status and crown direction was developed, which was similar to the studies of Hann [11] and Marshall et al. [23]. We defined this method as the traditional approach, and the largest branches from each direction (dataset A) were used to fit the model. In addition, three steps were carried out to sequentially quantify the effects of tree status and the crown direction on the crown profiles of trees. In Step 1, only the effect of tree status on the condition of the symmetric crown was considered, and the largest branches of each direction selected for dominant, intermediate, and suppressed trees (dataset B) were used to fit the model. In Step 2, without taking tree status into consideration, we analyzed the effect of the crown direction on the crown profiles using the largest branches selected from the north-, east-, south-, and west-oriented crown directions, respectively, for all the trees (dataset C); and Step 3 considered the tree status and crown direction effect together using the largest branches from north-, east-, south-, and west-oriented crown directions for dominant trees, intermediate trees, and suppressed trees, respectively (dataset D). A dummy variable approach was used in the three steps to indicate the effect of tree status and direction on crown profiles. In Step 1, three dummy variables were used (1 if it was a specific tree status, otherwise 0). In Step 2, four dummy variables were used (1 if it was a specific crown direction, otherwise 0). As for Step 3, 12 dummy variables were needed (1 if it was a specific direction from a specific tree status, otherwise 0). A comparison between the traditional approach and the three steps we identified was conducted. The crown profile models of the traditional approach and the three steps were all fitted by nonlinear mixed-effects approach and compared with the models fitted by ordinary least-squares and generalized least-squares.
To compare differences in the predictions of crown profiles between the traditional approach and the three steps, the mean error (E), mean absolute error (), and mean absolute percentage error () were used. The equations are defined as follows:
where yi is the observed value; is the predicted value; and n is the number of observations.
3. Results
3.1. Selection of the Best Model
Fitting results for the candidate equations are listed in Table 3. The Ra2 of all equations was within the range of 0.82–0.85, and the RMSE was within the range of 0.27–0.31 m. The segmented power equation (Equation (2)) had the lowest AIC and BIC, followed by the modified Kozak (1988) equation (Equation (4)). However, the number of parameters in the modified Kozak (1988) equation was the lowest, while the segmented power equation had the highest number of parameters. Thus, the modified Kozak (1988) equation was selected as the best equation for further analysis.
3.2. Modeling Crown Profile
The model with the dummy variable approach for the three steps took the same form as Equation (10). Equations (11)–(13) indicate the dummy variable forms for the first step, the second step, and the third step, respectively.
where DT, IT, and ST in Equation (11) indicate dominant trees, intermediate trees, and suppressed trees; N, E, S, and W in Equation (12) indicate north, east, south, and west crown profile directions; and DN, DE, DS, DW, IN, IE, IS, IW, SN, SE, SS, and SW in Equation (13) indicate north, east, south, and west crown profile directions for dominant, intermediate, and suppressed trees, respectively. a1–a6 and a31–a32 are the parameters to be estimated, in which a31–a312 belong to parameter a3 where dummy variables are included.
Parameter a4 is the mixed-effect parameter for the traditional approach, and achieved the smallest AIC, BIC and largest Log-likelihood. In contrast, the three steps with a2 expanding with random effect performed best. To facilitate a fair comparison between the traditional approach and the three steps, we considered a2 as a mixed-effect parameter for the traditional approach. By comparing power and exponential variance function, the exponential function achieved the smallest AIC and BIC and the largest Log-likelihood, and was determined to be significantly different from the power function based on the likelihood ratio test (p < 0.05). The statistics in Table 4 show that the nonlinear mixed-effects model performed best when compared to ordinary least-squares and generalized least-squares model. The estimates for the fixed parameters and the variance-covariance structure of the random effects of the nonlinear mixed-effects model for the traditional approach and the three steps are shown in Table 5.
The residuals of the nonlinear mixed-effects model, ordinary least-squares model, and generalized least-squares model were plotted against the predicted outer crown radius. The range of residuals for the nonlinear mixed-effects model was decreased compared to ordinary least-squares and generalized least-squares model, and no serious heteroscedasticity problem was detected in the mixed-effects models. Taking the four crown directions of intermediate tree as an example, the residuals of the nonlinear mixed-effects model for the north, east, south, and west crown directions plotted against the predicted outer crown radius are shown in Figure 4. No serious heteroscedasticity trends with the predicted outer crown radius were found in dominant and suppressed trees.
3.3. Crown Profile Differences between Tree Status and Crown Direction
Step 1 only considered the effect of tree status on the crown profiles by assuming a symmetric crown based on the fitted value by nonlinear mixed-effects model (Equations (10) and (11)). The mean error ranged from −0.0006 to 0.0518 m for dominant, intermediate, and suppressed trees. The dominant trees showed the largest mean absolute error, and the suppressed trees showed the smallest mean absolute error (Table 6). In comparison, the mean error produced by traditional approach ranged from −0.0008 to 0.0810 m. As for the mean absolute error, the largest was still the dominant tree, followed by intermediate tree and suppressed tree (Table 6).
Step 2 analyzed the effect of crown direction on the crown profiles without considering the tree status. The mean error of the four crown directions ranged from −0.0031 to 0.0190 m. The mean absolute error ranged from 0.2771 to 0.2821 m for the four crown directions. The largest mean absolute error was produced in the south direction, and the smallest was produced in west direction (Table 7). For the traditional approach, the range of mean error for the four directions was −0.0378 to 0.0385 m (Table 7). The range of mean absolute error of the traditional approach was 0.2778–0.2994 m, for which the mean absolute error of all the four directions was larger than Step 2.
Step 3 analyzed the effect of tree status and crown direction on crown profiles (Table 8). The mean error of the four directions produced by Step 3 was −0.0177 to 0.0181 m for dominant trees, −0.0177 to 0.0107 m for intermediate trees, and −0.0049 to 0.0112 m for suppressed trees. The range of mean absolute error of four directions was from 0.2912 to 0.3086 m for dominant tree, from 0.2483 to 0.2590 m for intermediate tree, and from 0.2061 to 0.2270 m for suppressed tree. The mean absolute errors all decreased from dominant tree to suppressed tree for the specific crown direction. In comparison, the range of mean error of the four crown directions of the traditional approach were all larger than Step 3 for all the three tree statuses, and it was the same for the mean absolute error. In addition, the mean absolute error of the four directions all decreased from dominant tree to suppressed tree. Based on the mean absolute error, the west direction of dominant and intermediate tree, and east direction of suppressed tree produced the largest error, while the east direction of dominant tree, north direction of intermediate tree, and west direction of suppressed tree produced the smallest mean absolute error. The error produced from the four directions was closely related to the types of trees.
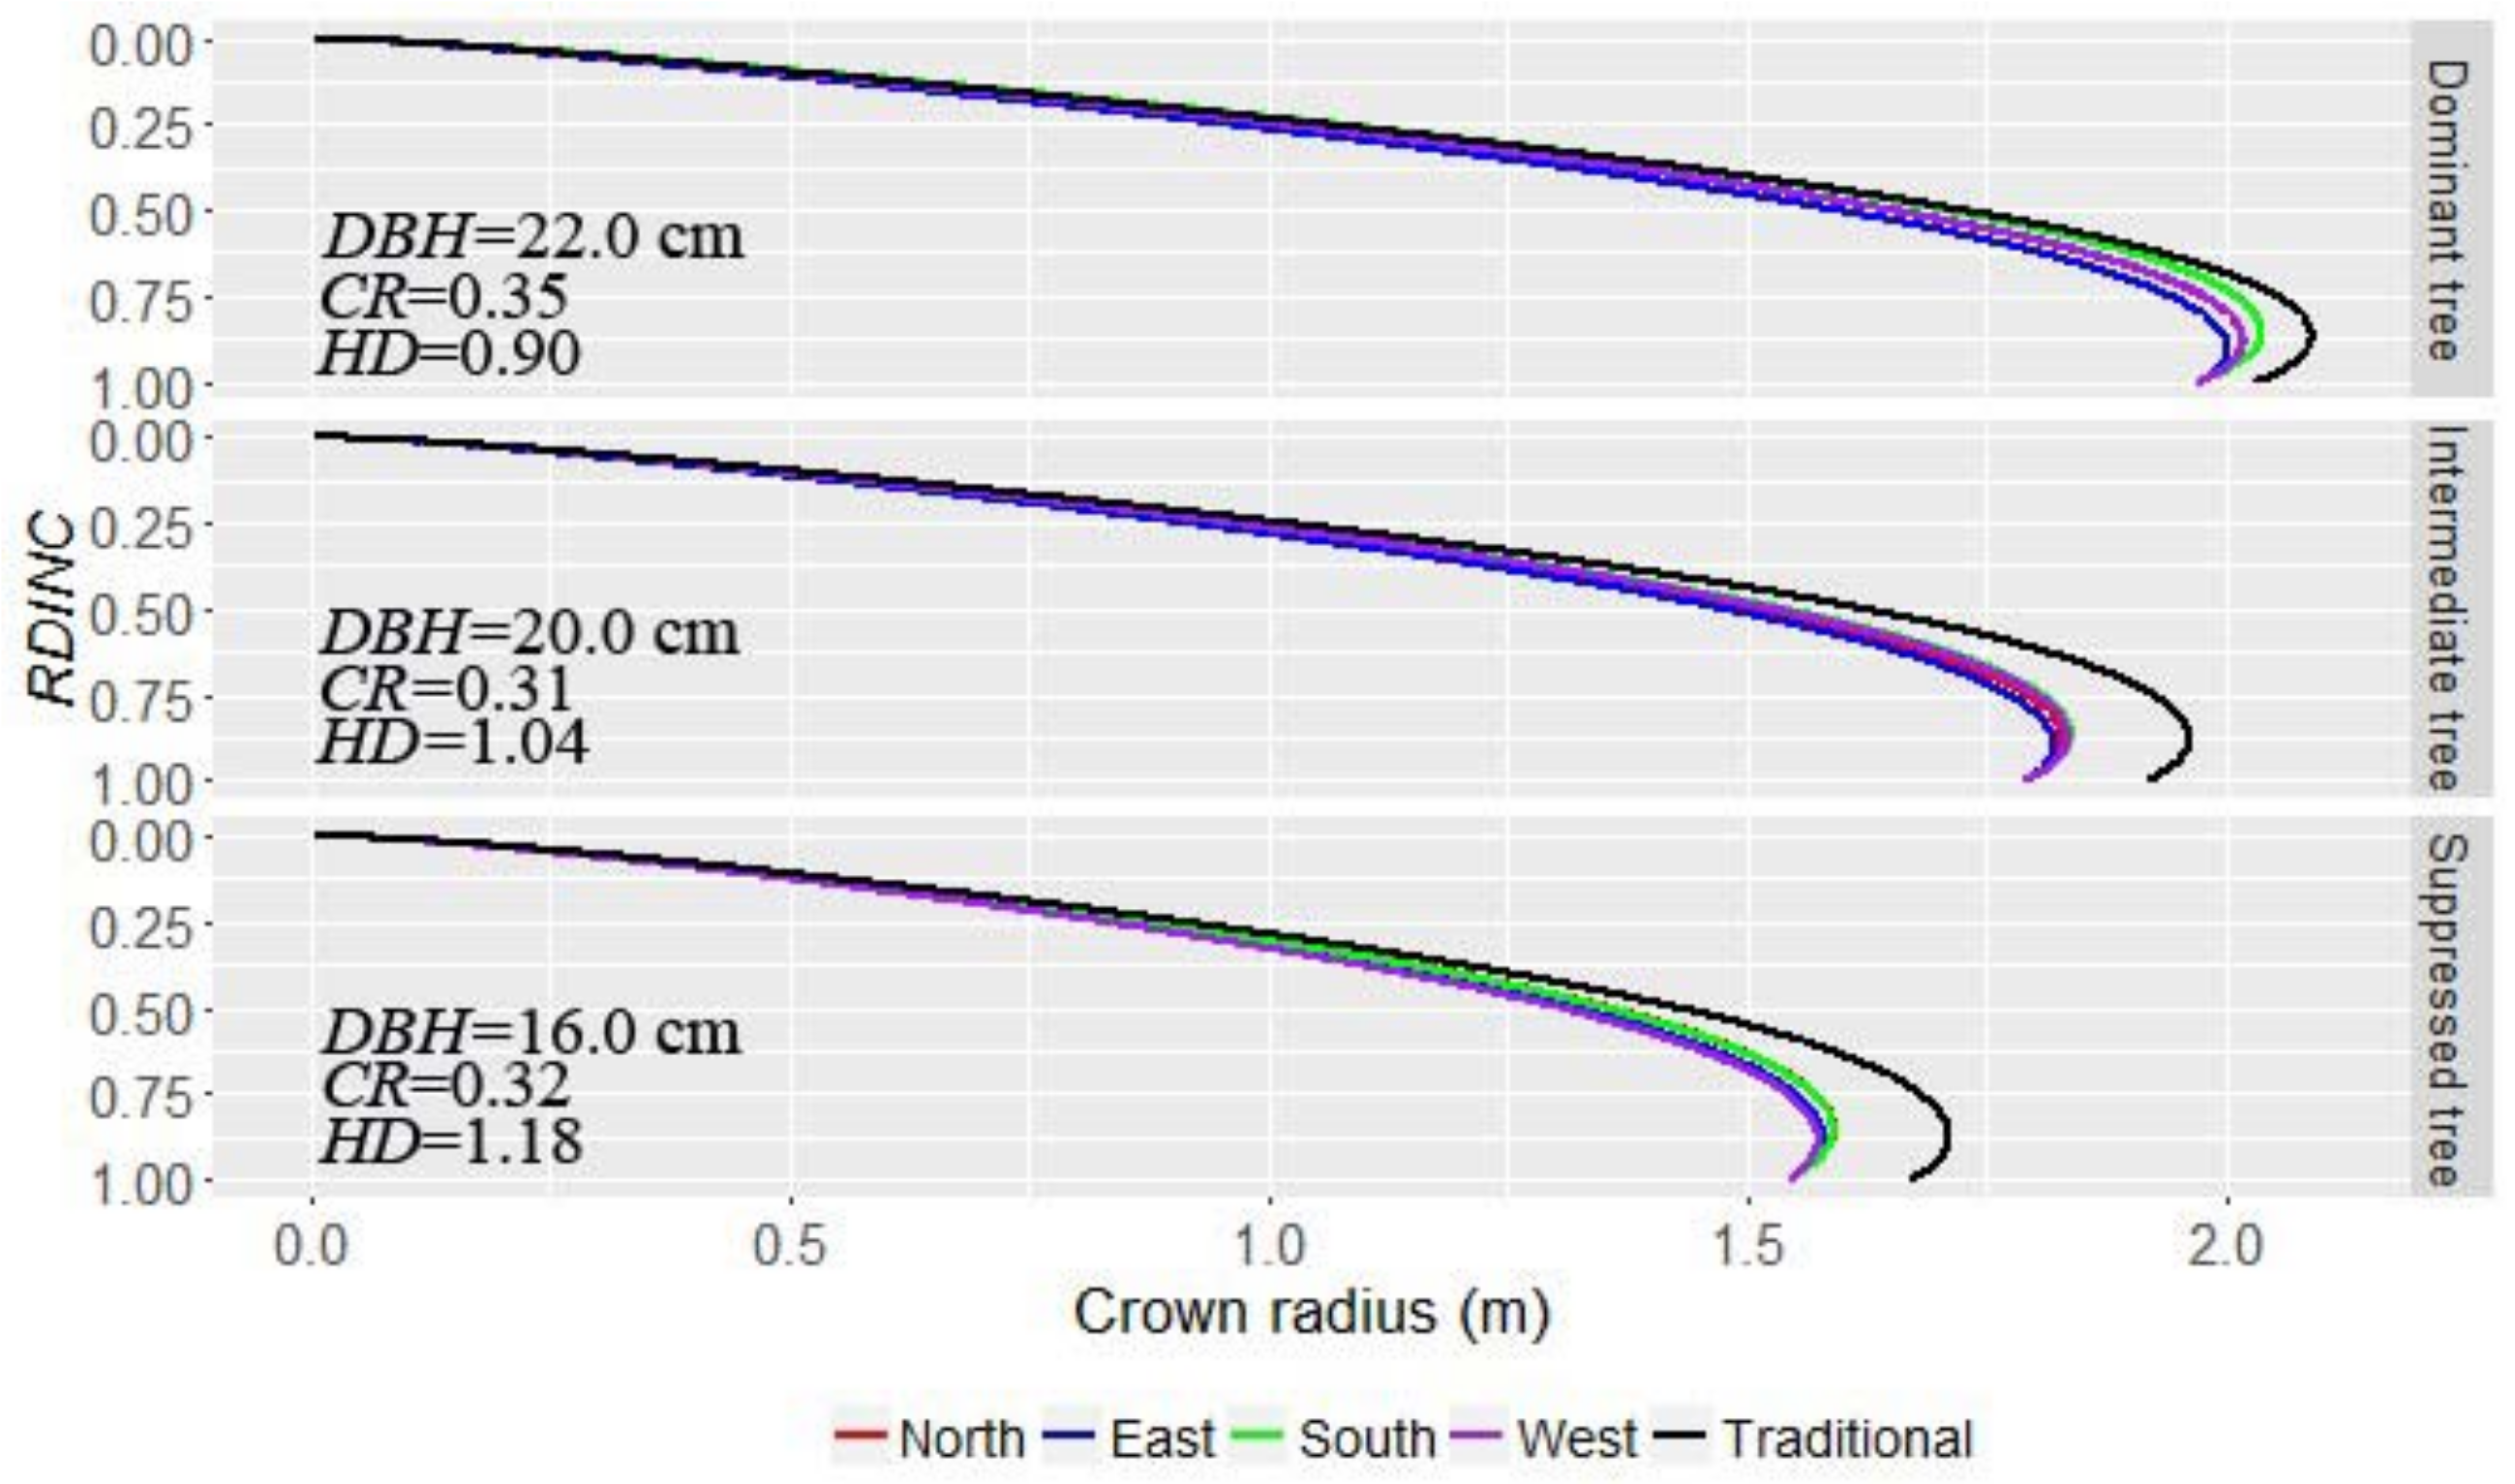
Based on the nonlinear mixed-effects model from Step 3 (Equations 10 and 13), the predicted north, east, south, and west crown profiles of dominant, intermediate, and suppressed trees respectively are shown in Figure 5. In Step 3, for dominant trees, the predicted crown radii for the four directions followed the regular pattern of south > west > north > east, and the predicted crown radii for north and west directions were almost equivalent. For intermediate trees, the pattern was south > west > north > east, and the predicted crown radii for west and south directions were almost equivalent, while the pattern was south > north > east > west for suppressed trees.
4. Discussion
The data used in our study varied a great deal, and even the crown radii in different directions show large variation (Figure 2). Tree variables explain the heterogeneity of the crown radius from different directions of dominant, intermediate, and suppressed trees. Thus, the final model (Equation 10) involved DBH, CR, and HD. DBH is always the most commonly used variable in the development of crown profile models [9]. Crown width expressed the space an individual tree occupied and strongly influenced the crown profile, so DBH could also be used as a single independent variable in the crown width prediction models [24]. Based on the analysis, crown radius increased significantly with the increase of DBH. The crown shape of Larix olgensis in our study was also influenced by CR. The crown ratio is an indicator of stand density [25], competition, and survival in the forest stand [26], and has been used as the predictor in the crown profile model [23]. CR strongly influenced the crown profile within the upper crown, and the crown radius increased with an increase in CR.
The density expressed the crowding of the individual trees in the stands so that the crown shape would be affected, which conformed to the studies of previous research [7]. Since HD is the response to comprehensive management activities and reflects the slenderness of a tree as affected by forest management, it is usually included in the crown profile model [9,11,15]. In our study, it was also a significant variable that influenced the crown profile. With respect to the simulation of the effect of HD on crown shape in our study, HD affected the crown shape of individual trees, even though it was not as pronounced when compared to other variables. The crown radius within the crown above the largest crown radius increased with the increase of HD, and the crown radius decreased with the increase of HD for the lower part, in which the largest crown radius occurred. Our study confirmed the findings of Sharma et al. [1], where crown width decreased with the increase of the tree slenderness coefficient (HD).
The dummy variable approach was used to model the crown profiles for different tree statuses (Step 1), different crown directions (Step 2), and tree status and crown directions in combination (Step 3). In our study, the results demonstrated that the crown profiles were affected by tree status (Table 5), with tree status representing the reason why large error was produced using the traditional approach to predict the crown profiles for three tree statuses (Table 6). Peltola et al. [27] found that tree status affected the radial growth of individual trees, and that radial growth of trees was closely related to the crown. In addition, the light in the forest stand intercepted by larger trees was larger than that of the smaller trees, so the smaller trees had no chance to compete for light [28]. The dominant trees occupied large enough spaces to utilize the light resources in the forest stand compared to intermediate and suppressed trees, which may be why the crown profiles of different tree statuses were different. Getzin and Wiegand [29] described the asymmetric characteristics of tree crowns; however, the present crown profile models have seldom considered this aspect. In our study, the effect of crown directions alone on the crown profiles was further analyzed and the range of mean error was within ±0.0190 m, while the range of mean error for the traditional approach was ±0.0385 m (Table 7). We also analyzed the tree status and crown directions at the same time (Step 3), and results indicate that the north-, east-, south-, and west-orientated crown profiles for dominant, intermediate, and suppressed trees were different, which further demonstrated the asymmetries in the crown profiles (Figure 5 and Table 8). The crown radius in the south direction for dominant, intermediate, and suppressed trees was still the largest. This suggests that light was the main factor that affected crown shape, as the south side of the crown intercepts a relatively larger amount of solar radiation in Northeast China. Our results confirmed the study of Marshall et al. [30], who revealed that individual trees in forest stands express intra-specific genetic variation both within and among populations, and that growth rates of individual trees were affected by the photosynthetic traits in the uniform environmental conditions. Thus, the light source was the main factor leading to the largest crown radius in the south direction, while the differences produced between other directions may derive from the unbalanced competition status from neighboring trees.
The physiological patterns of intermediate trees were distinct from either saplings or larger trees [31]. Thomas and Ickes [32] documented that leaf size peaked at intermediate trees in several tropical species. Despite the difference in climate for the trees growing between our study and that of the study by Thomas and Ickes [32], it confirms that the growth state of intermediate trees is different from that of dominant trees. The crowns of intermediate trees have the potential to grow into the upper layer, even when faced with strong competition from other trees. For suppressed trees, the competition level was much stronger compared to that of dominant and intermediate trees. In addition, many biological processes are size-dependent, and the rate of the biological processes change during the growth of individual trees [33]. Thus, as the main component of the individual tree, the growth and development of the crown may be affected and leads to the differences of crown shapes between tree statuses. However, the entire crown surface of individual trees modeled in our study was not continuous, and this is an issue we will seek to address in future research as we strive to lay the foundation for the development of competition indices.
5. Conclusions
Our study results determined that it is not reasonable to consider the crown profile of an individual tree to be a symmetrical shape, as crown asymmetries occur in trees due to differences in light conditions and competitive neighboring trees around the subject trees. The Kozak (1988) model has been widely used in stem profile description and maximum branch diameter distribution within the entire live crown. The modified Kozak (1988) model also showed excellent performance in describing the crown profile, as it satisfies the conditions in which the crown radius equals zero at the tree tip and has only one inflection point within the entire crown. A dummy variable approach could efficiently reflect the difference in crown profiles of different directions from dominant, intermediate, and suppressed trees. The dummy variable with a mixed-effects model improved the fitting efficiency of the model compared to the ordinary least-squares regression. DBH, CR, and HD tree variables were the final variables selected in the model. There were significant differences observed among the north-, east-, south-, and west-oriented crown profiles.
Acknowledgments
This research was financially supported by the National Natural Science Foundation of China (31570626) and the Ministry of Science and Technology of the People’s Republic of China (Grant number 2015BAD09B01). The authors thank the teachers and students of the Department of Forest Management, Northeast Forestry University (NEFU), China, who collected and provided the data for this study.
Author Contributions
Huilin Gao participated in the field work and collected data, undertook data analysis, and wrote most of the paper. Lihu Dong helped in data analysis and modified the paper. Fengri Li supervised and coordinated the research paper, designed and installed the experiment, took some measurements, and contributed to writing the paper.
Conflicts of Interest
The authors declare no conflict of interest.
References
- Sharma, R.P.; Vacek, Z.; Vacek, S. Individual tree crown width models for Norway spruce and European beech in Czech Republic. For. Ecol. Manag. 2016, 366, 208–220. [Google Scholar] [CrossRef]
- Salemaa, M.; Lindgren, M. Crown Condition. In Forest Condition in a Changing Environment; Mälkönen, E., Ed.; Springer Science+Business Media B.V.: Dordrecht, The Netherlands, 2000; pp. 121–132. [Google Scholar]
- Kozlowski, T.T.; Kramer, P.J.; Pallardy, S.G.; Roy, J. The Physiological Ecology of Woody Plants; Academic Press, Inc.: San Diego, CA, USA; London, UK, 1991. [Google Scholar]
- Piboule, A.; Collet, C.; Frochot, H.; Dhôte, J.F. Reconstructing crown shape from stem diameter and tree position to supply light models. I. Algorithms and comparison of light simulations. Ann. For. Sci. 2005, 62, 645–657. [Google Scholar] [CrossRef]
- Antos, J.A.; Parish, R.; Nigh, G.D. Effects of neighbours on crown length of Abies lasiocarpa and Picea engelmannii in two old-growth stands in British Columbia. Can. J. For. Res. 2010, 40, 638–647. [Google Scholar] [CrossRef]
- Condés, S.; Sterba, H. Derivation of compatible crown width equations for some important tree species of Spain. For. Ecol. Manag. 2005, 217, 203–218. [Google Scholar] [CrossRef]
- Larocque, G.R.; Marshall, P.L. Crown development in red pine stands. I. Absolute and relative growth measures. Can. J. For. Res. 1993, 24, 762–774. [Google Scholar] [CrossRef]
- Weiskittel, A.R.; Kershaw, J.A.; Hofmeyer, P.V.; Seymour, R.S. Species differences in total and vertical distribution of branch- and tree-level leaf area for the five primary conifer species in Maine, USA. For. Ecol. Manag. 2009, 258, 1695–1703. [Google Scholar] [CrossRef]
- Crecente-Campo, F.; Marshall, P.; LeMay, V.; Diéguez-Aranda, U. A crown profile model for Pinus radiata D. Don in northwestern Spain. For. Ecol. Manag. 2009, 257, 2370–2379. [Google Scholar] [CrossRef]
- Dong, C.; Wu, B.; Wang, C.; Guo, Y.; Han, Y. Study on crown profile models for Chinese fir (Cunninghamia lanceolata) in Fujian Province and its visualization simulation. Scand. J. For. Res. 2015, 31, 302–313. [Google Scholar] [CrossRef]
- Hann, D.W. An adjustable predictor of crown profile for stand-grown Douglas-fir trees. For. Sci. 1999, 45, 217–225. [Google Scholar]
- Baldwin, V.C.; Peterson, K.D. Predicting the crown shape of loblolly pine trees. Can. J. For. Res. 1997, 27, 102–107. [Google Scholar] [CrossRef]
- Ferrarese, J.; Affleck, D.; Seielstad, C. Conifer crown profile models from terrestrial laser scanning. Silva Fenn. 2015, 49, 1106. [Google Scholar] [CrossRef]
- Roeh, R.L.; Maguire, D.A. Crown profile models based on branch attributes in coastal Douglas-fir. For. Ecol. Manag. 1997, 96, 77–100. [Google Scholar] [CrossRef]
- Crecente-Campo, F.; Álvarez-González, J.G.; Castedo-Dorado, F.; Gómez-García, E.; Diéguez-Aranda, U. Development of crown profile models for Pinus pinaster Ait. and Pinus sylvestris L. in northwestern Spain. Forestry 2013, 86, 481–491. [Google Scholar] [CrossRef]
- Colin, F.; Houllier, F. Branchiness of Norway spruce in northeastern France: Predicting the main crown characteristics from usual tree measurements. Ann. For. Sci. 1992, 49, 511–538. [Google Scholar] [CrossRef]
- State Forestry Administration. The Eighth National Forest Inventory-General Situation of Forest Resource in China; China Forestry Press: Beijing, China, 2014. (In Chinese)
- Weiskittel, A.R.; Seymour, R.S.; Hofmeyer, P.V.; Kershaw, J.A. Modelling primary branch frequency and size for five conifer species in Maine, USA. For. Ecol. Manag. 2010, 259, 1912–1921. [Google Scholar] [CrossRef]
- Vonesh, E.F.; Chinchilli, V.M. Linear and Nonlinear Models for the Analysis of Repeated Measurement; Marcel Dekker: New York, NY, USA, 1997. [Google Scholar]
- Biging, G.S.; Gill, S.G. Stochastic models for conifer tree crown profiles. For. Sci. 1997, 43, 25–34. [Google Scholar]
- Pinheiro, J.; Bates, D.; DebRoy, S.; Sarkar, D. Nlme: Linear and Nonlinear Mixed Effects Models. R Package Version 3.1-122. Available online: http://CRAN.R-project.org/package=nlme (accessed on 20 May 2015).
- R Core Team. R: A language and Environment for Statistical Computing; R Foundation for Statistical Computing: Vienna, Austria, 2016; Available online: https://www.R-project.org/ (accessed on 21 June 2016).
- Marshall, D.D.; Johnson, G.P.; Hann, D.W. Crown profile equations for stand-grown western hemlock trees in northeastern Oregon. Can. J. For. Res. 2003, 33, 2059–2066. [Google Scholar] [CrossRef]
- Pretzsch, H.; Biber, P.; Uhl, E.; Dahlhausen, J.; Rötzer, T.; Caldentey, J.; Koike, T.; Con, T.V.; Chavanne, A.; Seifert, T.; et al. Crown size and growing space requirement of common tree species in urban centres, parks, and forests. Urban For. Urban Green. 2015, 14, 466–479. [Google Scholar] [CrossRef]
- Soares, P.; Tomé, M. A tree crown ratio prediction equation for eucalypt plantations. Ann. For. Sci. 2001, 58, 193–202. [Google Scholar] [CrossRef]
- Temesgen, H.; Lemay, V.; Mitchell, S.J. Tree crown ratio models for multi-species and multi-layered stands of southeastern British Columbia. For. Chron. 2005, 81, 133–141. [Google Scholar] [CrossRef]
- Peltola, H.; Kilpeläinen, A.; Sauvala, K.; Räisänen, T.; Ikonen, V.-P. Effects of early thinning regime and tree status on the radial growth and wood density of Scots pine. Silva Fenn. 2007, 41, 489–505. [Google Scholar] [CrossRef]
- Hao, Z.; Zhang, J.; Song, B.; Ye, J.; Li, B. Vertical structure and spatial associations of dominant tree species in an old-growth temperate forest. For. Ecol. Manag. 2007, 252, 1–11. [Google Scholar] [CrossRef]
- Getzin, S.; Wiegand, K. Asymmetric tree growth at the stand level: Random crown patterns and the response to slope. For. Ecol. Manag. 2007, 242, 165–174. [Google Scholar] [CrossRef]
- Marshall, J.D.; Rehfeldt, G.E.; Monserud, R.A. Family differences in height growth and photosynthetic traits in three conifers. Tree Physiol. 2001, 21, 727–734. [Google Scholar] [CrossRef] [PubMed]
- Thomas, S.C. Photosynthetic capacity peaks at intermediate size in temperate deciduous trees. Tree Physiol. 2010, 30, 555–573. [Google Scholar] [CrossRef] [PubMed]
- Thomas, S.C.; Ickes, K. Ontogenetic Changes in Leaf Size in Malaysian Rain Forest Trees. Biotropica 1996, 27, 427–434. [Google Scholar] [CrossRef]
- Thomas, S.C.; Winner, W.E. Photosynthetic differences between saplings and adult trees: An integration of field results by meta-analysis. Tree Physiol. 2002, 22, 117–127. [Google Scholar] [CrossRef] [PubMed]
Figure 1.
The plot distribution (red dots) and location of the study area in Heilongjiang Province, China.
Figure 1.
The plot distribution (red dots) and location of the study area in Heilongjiang Province, China.

Figure 2.
Attributes of individual trees and branches for characterizing the crown profile. L is absolute depth into the crown from tree tip down to the position of the branch basis, DINC is absolute depth into the crown radius of interest, OCR is outer crown radius, BC is branch chord length, VA is branch angle, CL is crown length, and HT is total tree height.

Figure 3.
Scatterplots of RDINC and the observed north-, east-, south-, and west-oriented crown radii from dominant, intermediate, and suppressed trees. RDINC is defined as DINC/CL. DINC is the absolute depth into the crown radius of interest, CL is crown length.
Figure 3.
Scatterplots of RDINC and the observed north-, east-, south-, and west-oriented crown radii from dominant, intermediate, and suppressed trees. RDINC is defined as DINC/CL. DINC is the absolute depth into the crown radius of interest, CL is crown length.

Figure 4.
Residuals of nonlinear mixed-effects model for the four crown directions of intermediate tree plotted against the predicted OCR. OCR is the outer crown radius.
Figure 4.
Residuals of nonlinear mixed-effects model for the four crown directions of intermediate tree plotted against the predicted OCR. OCR is the outer crown radius.
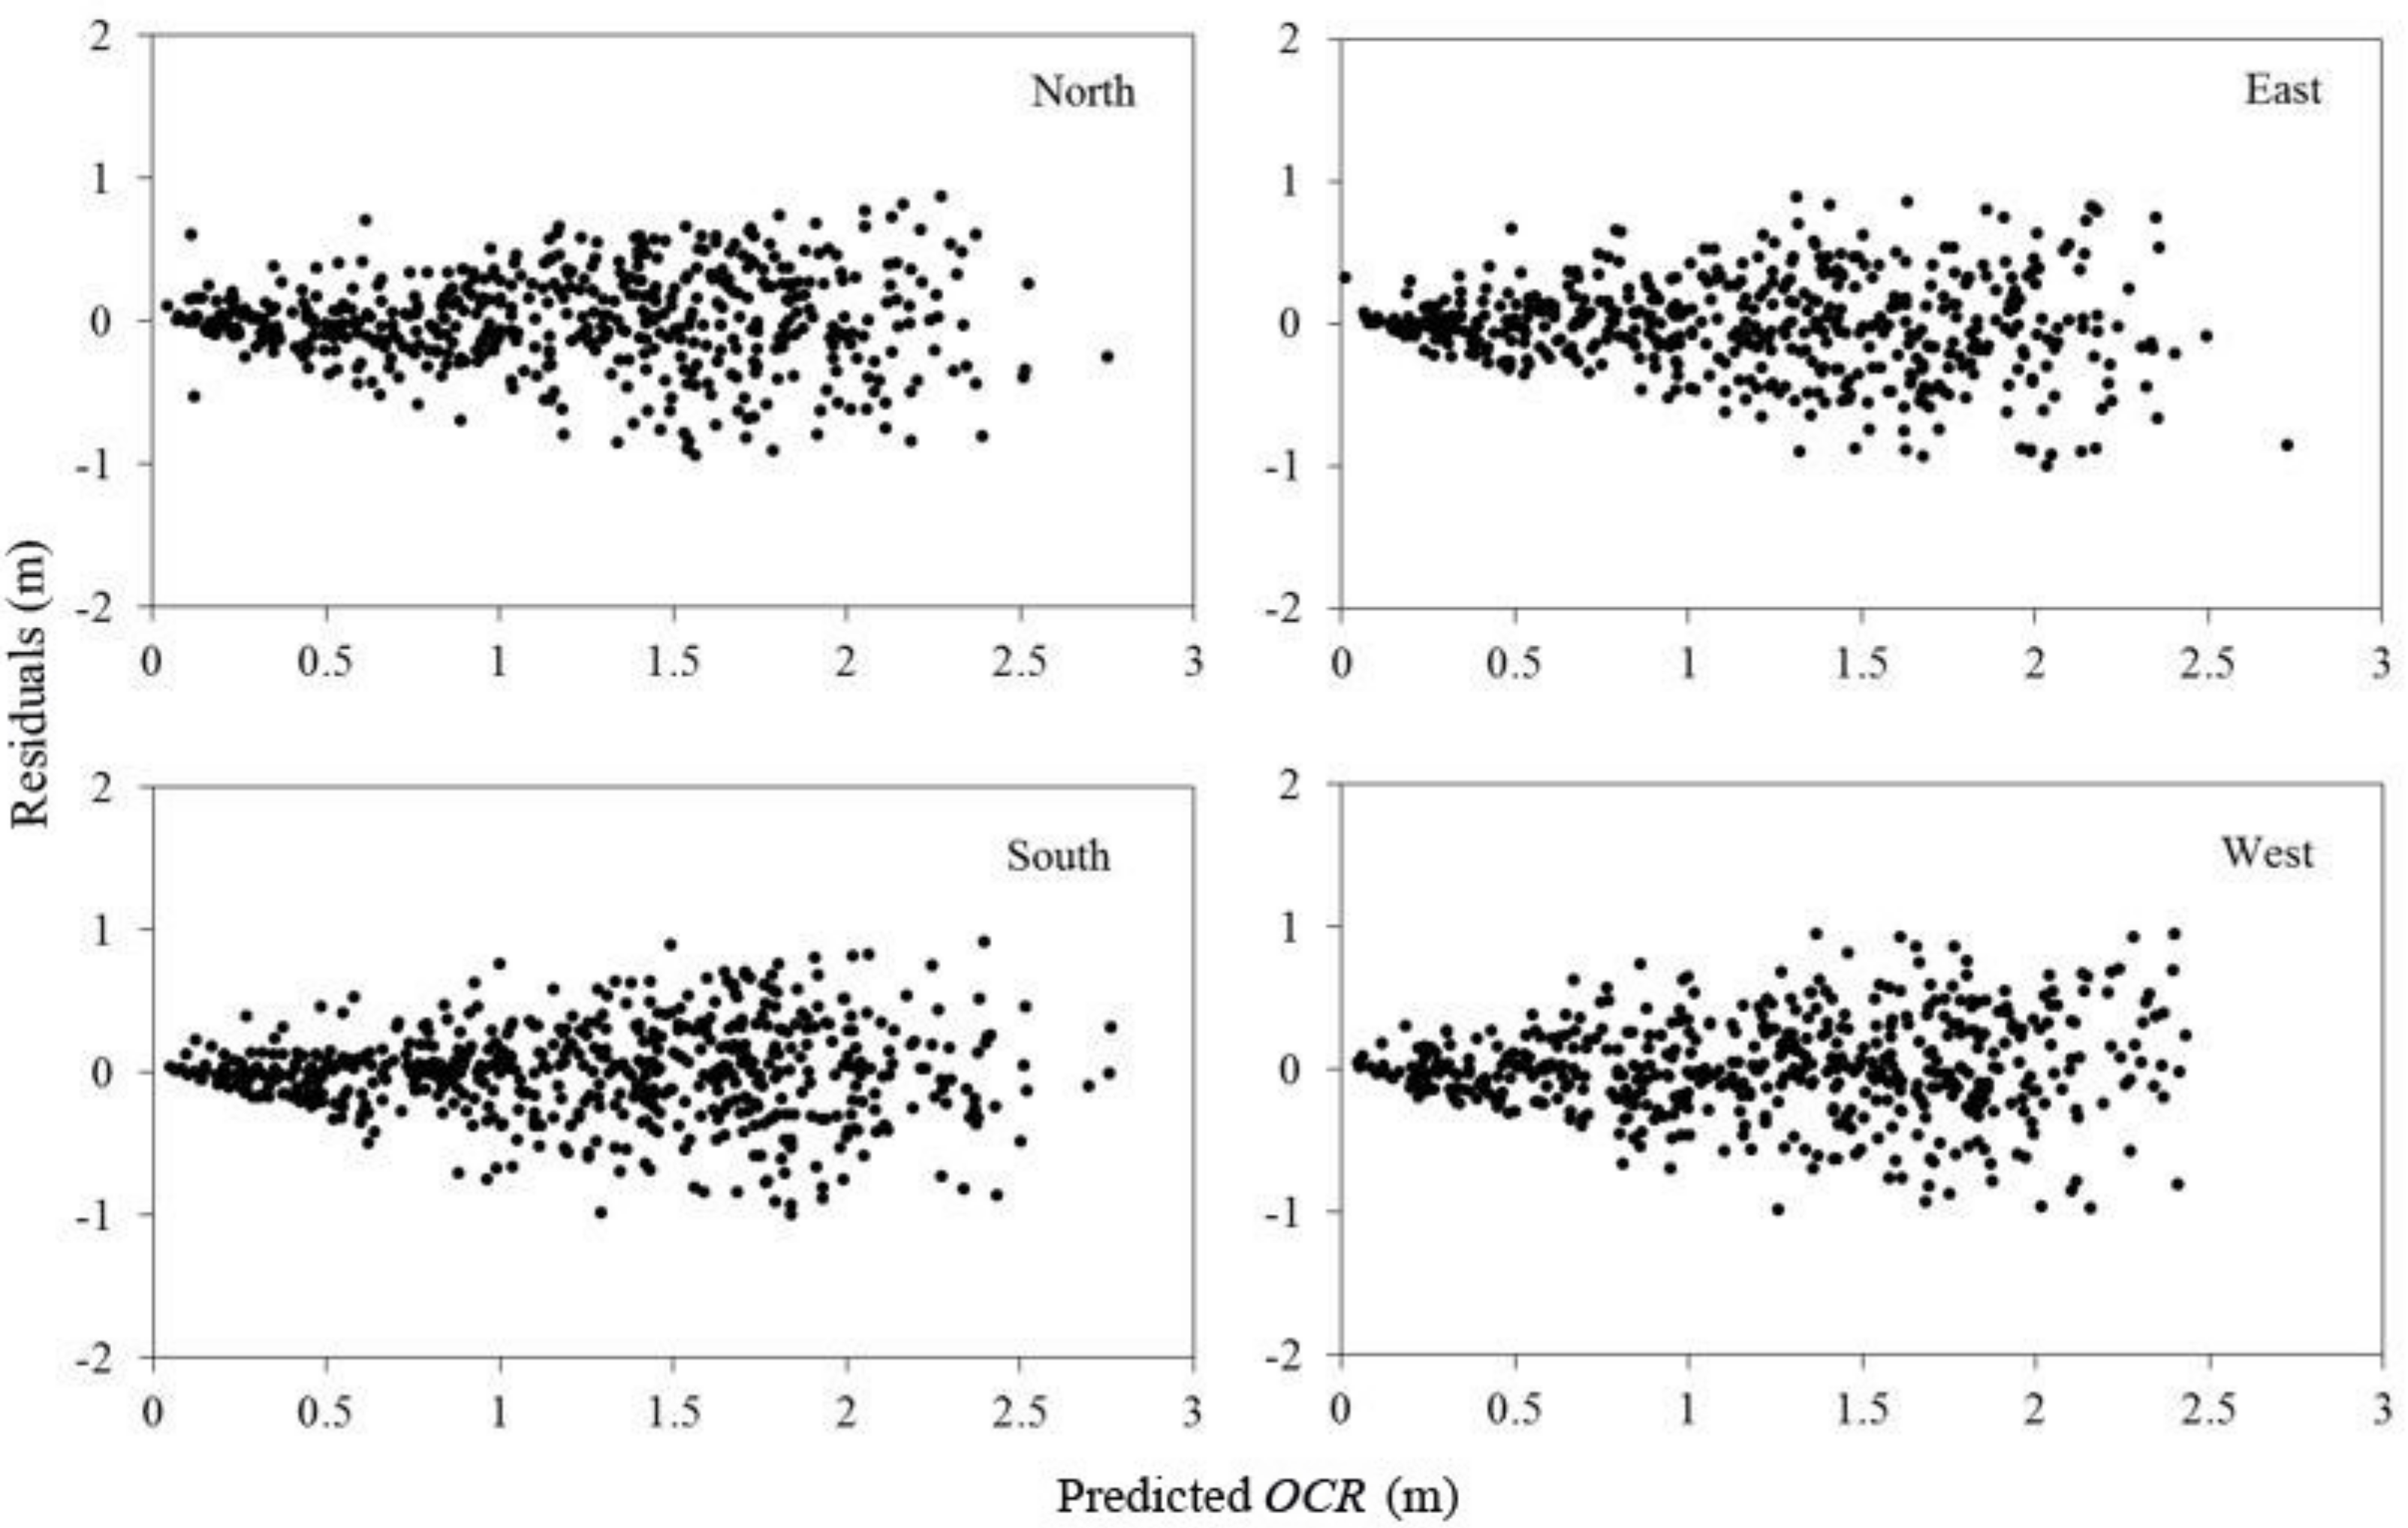
Figure 5.
The crown profiles predicted for the four directions of the three tree statuses by Step 3 for three trees with different sizes.
Figure 5.
The crown profiles predicted for the four directions of the three tree statuses by Step 3 for three trees with different sizes.

Table 1.
Summary of the characteristics of the sample plots (n = 26).
| Statistics | Age (Year) | Dg (cm) | Density (Trees·ha−1) | Slope (°) | Altitude (m) |
|---|---|---|---|---|---|
| Mean | 39 | 19.7 | 1628 | - | 229 |
| SD | 12 | 5.9 | 654 | - | 24 |
| Min | 9 | 5.8 | 833 | <5° | 141 |
| Max | 53 | 29.9 | 3060 | 12.5° | 260 |
Note: SD is the standard deviation; Age is the total age of the plots since planting; Dg is the average diameter at breast height. The slope which is lower than 5° was recorded as <5°. So, the mean value and SD of the slope are not available.
Table 2.
Statistics for the attributes of the sample trees and branches of planted Larix olgensis trees.
Table 2.
Statistics for the attributes of the sample trees and branches of planted Larix olgensis trees.
| Trees | Statistics | Tree Attributes | Branch Attributes | |||||||
|---|---|---|---|---|---|---|---|---|---|---|
| DBH (cm) | HT (m) | HD | CL (m) | CR | BL (cm) | BC (cm) | VA (°) | BD (mm) | ||
| Dominant tree | Numbers of sample trees = 32 | Numbers of largest branches = 516 | ||||||||
| Mean (SD) | 23.0 (6.2) | 19.2 (4.9) | 0.86 (0.11) | 8.43 (1.43) | 0.49 (0.17) | 206 (101) | 193 (96) | 67 (15) | 10.08 (10.22) | |
| Range | 9.1–35.7 | 8.9–26.8 | 0.66–1.25 | 5.45–11.86 | 0.25–0.89 | 11–452 | 11–435 | 20–95 | 0.20–45.06 | |
| Intermediate tree | Numbers of sample trees = 52 | Numbers of largest branches = 752 | ||||||||
| Mean (SD) | 21.1 (5.7) | 19.7 (4.5) | 0.95 (0.10) | 7.54 (1.61) | 0.42 (0.17) | 181 (87) | 169 (81) | 65 (15) | 5.91 (6.74) | |
| Range | 6.4–32.6 | 6.8–27.0 | 0.76–1.34 | 4.88–12.63 | 0.22–0.97 | 5–388 | 5–378 | 20–120 | 0.12–31.13 | |
| Suppressed tree | Numbers of sample trees = 55 | Numbers of largest branches = 658 | ||||||||
| Mean (SD) | 16.2 (6.4) | 17.3 (5.6) | 1.12 (0.20) | 6.47 (2.03) | 0.41 (0.16) | 163 (81) | 153 (76) | 64 (14) | 4.92 (5.48) | |
| Range | 3.8–28.6 | 5.3–26.1 | 0.83–2.06 | 2.73–12.85 | 0.20–0.83 | 16–435 | 16–415 | 20–100 | 0.09–34.88 | |
Note: DBH is diameter at breast height, HT is total tree height, HD is the ratio of total tree height to DBH, CL is crown length, CR is crown ratio defined as CL/HT, BL is branch length, BC is branch chord length, VA is branch angle, BD is branch diameter.
Table 3.
Fitting statistics for the modified Weibull, segmented power, segmented polynomial, and modified Kozak (1988) equation.
Table 3.
Fitting statistics for the modified Weibull, segmented power, segmented polynomial, and modified Kozak (1988) equation.
| Models | Number of Parameters | Ra2 | RMSE | AIC | BIC |
|---|---|---|---|---|---|
| Weibull modified | 7 | 0.8408 | 0.2787 | 121 | 153 |
| Segmented power | 10 | 0.8272 | 0.3086 | 23 | 67 |
| Segmented polynomial | 8 | 0.8283 | 0.3020 | 52 | 89 |
| Kozak modified | 6 | 0.8338 | 0.2965 | 48 | 73 |
Note: RMSE, root mean squared error; AIC, Akaike’s information criterion; BIC, Bayesian information criterion.
Table 4.
Fitting and validation statistics for the nonlinear mixed-effects model (NLME), ordinary least-squares model (OLS) and generalized least-squares model (GLS) for the traditional approach and three steps.
Table 4.
Fitting and validation statistics for the nonlinear mixed-effects model (NLME), ordinary least-squares model (OLS) and generalized least-squares model (GLS) for the traditional approach and three steps.
| Index | Traditional Approach | Step 1 | Step 2 | Step 3 | ||||||||
|---|---|---|---|---|---|---|---|---|---|---|---|---|
| NLME | OLS | GLS | NLME | OLS | GLS | NLME | OLS | GLS | NLME | OLS | GLS | |
| Ra2 | 0.8513 | 0.8399 | 0.8153 | 0.8601 | 0.8145 | 0.8185 | 0.7885 | 0.7323 | 0.7341 | 0.7869 | 0.7363 | 0.7521 |
| RMSE | 0.2713 | 0.3055 | 0.2985 | 0.2702 | 0.3302 | 0.3105 | 0.3401 | 0.3782 | 0.3789 | 0.3393 | 0.3775 | 0.3781 |
| AIC | 2675 | 5065 | 2967 | 2623 | 5028 | 2963 | 2595 | 4998 | 2949 | 2552 | 4921 | 2952 |
| BIC | 2732 | 5111 | 3026 | 2709 | 5108 | 3036 | 2695 | 5071 | 3035 | 2698 | 5046 | 3090 |
| E | 0.0098 | 0.0110 | 0.0108 | 0.0087 | 0.0001 | 0.0086 | 0.0065 | 0.0008 | 0.0043 | 0.0013 | 0.0015 | 0.0015 |
| |E| | 0.2201 | 0.2520 | 0.2405 | 0.2158 | 0.2502 | 0.2415 | 0.2573 | 0.2810 | 0.2799 | 0.2418 | 0.2813 | 0.2807 |
| |Ep| (%) | 18.21 | 20.35 | 20.10 | 18.02 | 20.58 | 20.12 | 31.26 | 32.89 | 32.80 | 30.52 | 32.21 | 32.82 |
Note: Steps 1, 2, and 3 indicate the effect of tree status only, crown direction only, and altogether on the crown profile, respectively. E is mean error, |E| is mean absolute error, |Ep| (%) is mean absolute percentage error.
Table 5.
Estimates for the fixed parameter of the nonlinear mixed-effects model for the traditional approach and three steps.
Table 5.
Estimates for the fixed parameter of the nonlinear mixed-effects model for the traditional approach and three steps.
| Parameter | Traditional Approach | Step 1 | Step 2 | Step 3 | ||||
|---|---|---|---|---|---|---|---|---|
| Estimate | SD | Estimate | SD | Estimate | SD | Estimate | SD | |
| a1 | 0.3048 | 0.0269 | 0.2951 | 0.04277 | 0.3039 | 0.0275 | 0.3171 | 0.0231 |
| a2 | 0.6139 | 0.0305 | 0.6238 | 0.0323 | 0.6145 | 0.0313 | 0.6019 | 0.0253 |
| a3 | 0.4768 | 0.0415 | ||||||
| a4 | 0.5021 | 0.1079 | 0.5225 | 0.1093 | 0.4784 | 0.1046 | 0.4963 | 0.1038 |
| a5 | 0.4311 | 0.0459 | 0.4646 | 0.0538 | 0.4279 | 0.0468 | 0.4331 | 0.0470 |
| a6 | 0.0871 | 0.0156 | 0.0764 | 0.0182 | 0.0888 | 0.0159 | 0.0835 | 0.0158 |
| a31 | 0.4587 | 0.0451 | 0.4814 | 0.0445 | 0.4544 | 0.0496 | ||
| a32 | 0.4903 | 0.0492 | 0.4104 | 0.0412 | 0.3716 | 0.0492 | ||
| a33 | 0.5265 | 0.0604 | 0.5180 | 0.0449 | 0.5370 | 0.0489 | ||
| a34 | 0.4579 | 0.0429 | 0.4569 | 0.0487 | ||||
| a35 | 0.4494 | 0.0518 | ||||||
| a36 | 0.3918 | 0.0505 | ||||||
| a37 | 0.4964 | 0.0516 | ||||||
| a38 | 0.4801 | 0.0520 | ||||||
| a39 | 0.5159 | 0.0638 | ||||||
| a310 | 0.4422 | 0.0616 | ||||||
| a311 | 0.5127 | 0.0627 | ||||||
| a312 | 0.4143 | 0.0622 | ||||||
| var (a2) | 0.0255 | 0.0244 | 0.0436 | 0.0390 | ||||
Table 6.
Analysis of the effect of tree status (dominant, intermediate, and suppressed tree) on the crown profiles without considering the effect of crown direction.
Table 6.
Analysis of the effect of tree status (dominant, intermediate, and suppressed tree) on the crown profiles without considering the effect of crown direction.
| Approach | Dominant Tree | Intermediate Tree | Suppressed Tree | ||||||
|---|---|---|---|---|---|---|---|---|---|
| E | |E| | |Ep| (%) | E | |E| | |Ep| (%) | E | |E| | |Ep| (%) | |
| Step 1 | 0.0518 | 0.2980 | 23.81 | −0.0006 | 0.2555 | 22.46 | 0.0015 | 0.2253 | 21.25 |
| Traditional approach | 0.0810 | 0.3062 | 32.65 | 0.0040 | 0.2584 | 31.84 | −0.0008 | 0.2208 | 30.05 |
Table 7.
Analysis of the effect of crown direction on the crown profiles without considering the effect of tree status.
Table 7.
Analysis of the effect of crown direction on the crown profiles without considering the effect of tree status.
| Directions | Step 2 | Traditional Approach | ||||
|---|---|---|---|---|---|---|
| E | |E| | |Ep| (%) | E | |E| | |Ep| (%) | |
| North | 0.0190 | 0.2777 | 32.66 | 0.0154 | 0.2784 | 33.45 |
| East | −0.0031 | 0.2811 | 32.73 | −0.0378 | 0.2978 | 32.92 |
| South | 0.0151 | 0.2821 | 31.24 | 0.0385 | 0.2994 | 31.49 |
| West | 0.0127 | 0.2771 | 33.39 | 0.0186 | 0.2778 | 33.41 |
Table 8.
Analysis of the effect of tree status and crown direction on the crown profiles.
| Approach | Direction | Dominant Tree | Intermediate Tree | Suppressed Tree | ||||||
|---|---|---|---|---|---|---|---|---|---|---|
| E | |E| | |Ep| (%) | E | |E| | |Ep| (%) | E | |E| | |Ep| (%) | ||
| Step 3 | North | 0.0060 | 0.2983 | 31.12 | 0.0040 | 0.2499 | 32.99 | 0.0112 | 0.2163 | 28.15 |
| East | −0.0177 | 0.2912 | 31.15 | −0.0177 | 0.2529 | 30.73 | 0.0011 | 0.2270 | 30.50 | |
| South | 0.0163 | 0.2919 | 31.62 | −0.0026 | 0.2483 | 27.32 | 0.0052 | 0.2183 | 30.59 | |
| West | 0.0181 | 0.3086 | 32.55 | 0.0107 | 0.2590 | 32.15 | −0.0049 | 0.2061 | 29.52 | |
| Traditional approach | North | 0.0166 | 0.3074 | 32.00 | 0.0035 | 0.2512 | 34.22 | 0.0273 | 0.2224 | 28.04 |
| East | −0.0552 | 0.2941 | 33.59 | −0.0450 | 0.2572 | 32.88 | −0.0169 | 0.2307 | 31.57 | |
| South | 0.0877 | 0.3109 | 31.65 | 0.0160 | 0.2517 | 27.90 | 0.0158 | 0.2217 | 29.60 | |
| West | 0.0289 | 0.3124 | 33.38 | 0.0287 | 0.2672 | 32.75 | −0.0349 | 0.2063 | 31.12 | |
© 2017 by the authors. Licensee MDPI, Basel, Switzerland. This article is an open access article distributed under the terms and conditions of the Creative Commons Attribution (CC BY) license (http://creativecommons.org/licenses/by/4.0/).
Share and Cite
MDPI and ACS Style
Gao, H.; Dong, L.; Li, F. Modeling Variation in Crown Profile with Tree Status and Cardinal Directions for Planted Larix olgensis Henry Trees in Northeast China. Forests 2017, 8, 139. https://doi.org/10.3390/f8050139
AMA Style
Gao H, Dong L, Li F. Modeling Variation in Crown Profile with Tree Status and Cardinal Directions for Planted Larix olgensis Henry Trees in Northeast China. Forests. 2017; 8(5):139. https://doi.org/10.3390/f8050139
Chicago/Turabian StyleGao, Huilin, Lihu Dong, and Fengri Li. 2017. "Modeling Variation in Crown Profile with Tree Status and Cardinal Directions for Planted Larix olgensis Henry Trees in Northeast China" Forests 8, no. 5: 139. https://doi.org/10.3390/f8050139
Note that from the first issue of 2016, this journal uses article numbers instead of page numbers. See further details here.