
Spatial Analysis of a Haloxylon Ammodendron Plantation in an Oasis-Desert Ecotone in the Hexi Corridor, Northwestern China

1
Linze Inland River Basin Research Station, Chinese Ecosystem Research Network, Key Laboratory of Eco-Hydrology of Inland River Basin, Northwest Institute of Eco-Environment and Resources, Chinese Academy of Sciences, Lanzhou 730000, China
2
University of Chinese Academy of Sciences, Beijing 100049, China
*
Author to whom correspondence should be addressed.
Forests 2017, 8(6), 200; https://doi.org/10.3390/f8060200
Submission received: 31 March 2017
/
Revised: 28 May 2017
/
Accepted: 6 June 2017
/
Published: 8 June 2017
(This article belongs to the Special Issue Successional Dynamics of Forest Structure and Function)
Abstract
:Haloxylon ammodendron is a commonly used sand-fixing species in the desert area of northwestern China; it has been abundantly planted in areas where annual precipitation is about 120 mm in the Hexi Corridor since the 1970s. Spatial patterns and associations of an H. ammodendron plantation in five stages of community development were analyzed in an oasis-desert ecotone to gain insights into population dynamics over a course of succession. Five 0.3-ha (50 m × 60 m) permanent plots were established in each of five developmental stages; H. ammodendron was classified as seedlings, juvenile and mature trees, and all individuals were measured and stem-mapped. The univariate spatial analysis by the L-function and the bivariate L12-function were used to describe the spatial patterns of all trees and examine the spatial association among trees between different tree size-classes. Results showed that at scales >2 m, the spatial pattern of H. ammodendron shifted from initially clustered to random, and back to clustered; at scales <2 m, a transition from uniform to clustered was observed with stand age. In 5–10-year, 10–20-year and 20–30-year stages, competition between conspecifics may be the dominant factor which influenced plant survival. In 30–40-year and >40-year stages, interactions between conspecifics may be the dominant factor in conditions of tree-size-asymmetric competition, but abiotic stress may be more important in tree-size-symmetric competition. The H. ammodendron plantation experienced highest mortality at the 5–10-year stage as a result of fierce competition for soil water, while with respect to growth, it entered into a relatively stable stage, where the gaps generated due to mortality of adult trees and improved soil conditions provided opportunities for regeneration. In the >40-year stage, the regeneration experienced a decline under enhanced competition for water, and the plantation showed a clustered pattern at all scales due to water stress.
1. Introduction
Arid zones, which make up about 30 percent of China’s total territory, are areas characterized by sparse vegetation, shortage of water resources, and fragile environment [1]. The oasis-desert ecotone plays an important ecological role in the arid region. Called the “transitional belt”, the oasis-desert ecotone is sensitive to changes, and is mutable under disturbances [2,3]. Maintaining the stability of these transitional zones is critical to the preservation of stability and ensuring the sustainable development of oases [4].
Over the last few decades, ecological protective projects have been established in China to protect the oasis-desert ecotone [5]. The sand-binding vegetation system established in the Linze region in the middle of the Hexi Corridor and the middle-reaches of the Heihe River basin is perceived as a successful model of artificial-vegetation establishment for preventing further desertification in arid desert regions, especially in transitional belts [6]. However, artificial-vegetation in the Linze region is characterized by single-species plantations of high density that underwent extensive degradation [7], while little information is available on the dynamics of artificial vegetation in this area.
Landscapes in many semiarid and arid regions frequently present a striking mosaic of vegetation and bare land, particularly where water becomes a limiting factor for vegetation growth or survival [8,9,10]. The main factors that influence spatial patterns of a plant population are environmental heterogeneity and interactions between individuals [11,12]. Spatial patterns of vegetation are an expression of ecological processes, for example, uniform spatial patterns may indicate homogeneous habitat conditions, while clustered patterns may result from heterogeneous microhabitats, facilitative interactions or local seed dispersal [13,14,15]. Spatial interactions may help to reveal the complex balance of competition and facilitation. Competition and facilitation exist simultaneously; under favorable environmental conditions, competition predominates, while under stressful conditions, facilitation prevails. Different spatial interactions may result in specific spatial patterns [16]. It is a considerable problem to separate the effects of environmental heterogeneity from the effects of interactions between individuals [17], especially for the artificial-vegetation management. An increased understanding of spatial patterns and interactions may provide insights into forest dynamics and early warning signs of desertification [18,19,20,21,22].
Vegetation patterns in forests may be related to the developmental stages and may change with succession driven by resource competition and changes in environmental conditions [16,23,24]. Therefore, analysis of the spatial patterns and associations of successional communities may provide a direct and comprehensive knowledge that can guide efforts in vegetation restoration and close-to-nature forestry and serve as a realistic reference to model plant patterns and dynamics [25,26,27].
Previous research focused mostly on the spatial distributions of populations from a statistical perspective. Further, although spatial patterns in natural habitats have been widely studied, the dynamics of spatial patterns of plantations with succession have remained largely unexplored, and they are fully unknown for Haloxylon ammodendron plantations in the Hexi Corridor [16,28,29,30,31,32,33].
H. ammodendron is one of the important and commonly used sand-fixing species in the northwestern desert area of China. It is abundant when planted in the Hexi Corridor, despite low annual precipitation of <50 mm in the west to about 200 mm in the east. Because of its rapid growth, high adaptability, hardiness and drought-resistance, H. ammodendron sand-fixing systems have been established in transitional belts in the Linze area since the 1970s. While the mobile dunes have been effectively stabilized, plantations exhibit extensive degradation. In the past forty years, plant communities have undergone distinct succession. H. ammodendron, initially distributed uniformly, has declined to different degrees, resulting in a plant pattern that resembles natural vegetation with patchy distribution and representative self-organized characteristics.
The specific objectives of this study were to (1) investigate the spatial patterns of H. ammodendron at different stages of development using univariate spatial analyses; (2) examine the spatial associations of H. ammodendron in different size classes in different developmental stages using bivariate spatial analyses; and (3) analyse the main abiotic factors affecting the spatial patterns and associations of H. ammodendron in a plantation. This vegetative community assessment will provide insight into the population dynamics of H. ammodendron, a realistic reference for modeling efforts, and primary data for the establishment and management of plantations.
2. Materials and Methods
2.1. Study Area
This study was conducted in H. ammodendron plantation communities located in an oasis-desert ecotone. The area is at the intersection between the southern edge of the Badain Jaran Desert and an inclined oasis plain, and near the Linze Inland River Basin Research Stations of the Chinese Academy of Sciences (CAS) (100°08′ E, 39°20′ N), in the middle-reaches of the Heihe River basin in the northwestern region of China (Figure 1). The study area is at an elevation of about 1350 m. The climate is typical continental arid-temperate, characterized by cold winters, and hot and dry summers with sparse rainfall and intense evaporation. Annual precipitation is about 116.8 mm (1965–2000), and annual pan water evaporation is about 2390 mm. Rainfall is concentrated in July to September and accounts for about 65% of the annual precipitation. The average annual temperature is 7.6 °C with a mean maximum of 39.1 °C in July and minimum of −27.3 °C in January. The annual frost-free period is about 165 days. The prevailing wind is from the northwest.
Surface soil is classified as sand and sandy loam. Sand deposits are 30–500 cm deep, marked by loose structure and low organic matter content (0.12–0.83%); they are highly susceptible to wind erosion [34]. The subsoil contains a clay pan. Groundwater can be divided into an upper layer in a shallow, unconfined aquifer, and a lower layer with a multi-layered structure. Vegetation in the region is sparse and discontinuous, with shrub patches surrounded by bare areas. The main shrub species include Tamarix chinensis, Caragana korshinskii, Hedysarum scoparium, Populus bolleana, Calligonum mongolicum, Nitraria sphaerocarpa Maxim, Reaumuria soongorica, Bassia dasyphylla, Eragrostis pilosa and other, less common ones. Additionally, monospecific H. ammodendron plantations are present in different stages of development since a sand-prevention program was started in the 1970s. Shrubs were manually planted in rows 2 m apart with 2 m plant spacing.
2.2. Field Investigation
It may be difficult to characterize the dynamics of spatial patterns and associations with the development of community restoration stages, as vegetation succession is a long-term process which often stretches over decades, even centuries [35]. A common method for investigating spatial patterns and associations over the course of succession is to use a chronosequence, a spatial rather than a temporal, representation of different stages of plant development. This study focuses on H. ammodendron in five stages of development (5–10, 10–20, 20–30, 30–40, and >40 years). Developmental stages (based on years since planting) broadly characterize the successional stage of a population and are generally defined in terms of historical data and live tree number and volume, tree proportion in different diameter size classes, and other plant populations properties. Five 0.3-ha (50 m × 60 m) permanent plots were established in the study area in the summer of 2015. We used a plot size of 50 m × 60 m because previous studies have confirmed this to be an appropriate size for structure-related and spatial-pattern studies, and considering the consistency among plots size of different developmental stages [36]. The study area had not been disturbed by logging or grazing. All of the selected plots were on flat land, with nearly homogeneous terrain within plots to avoid the influence of topography on plant patterns. We recorded the location (x, y coordinates), height, crown width, stem diameter at the base, and the relative proportion of dead branches of every live tree. We also mapped the spatial location of each individual using corrected distance and azimuth from a reference point (the northwestern corner of each plot), and then transformed the distances and azimuths to Cartesian coordinates. We assessed the natural regeneration of all seedlings in the same manner as mature trees. Because pseudo-annual rings are found in the growth of H. ammodendron, it is difficult to estimate the age from annual rings. Therefore, we classified H. ammodendron based on basal diameter of the stem into seedlings (<1.2 cm), juvenile trees (>1.2 and <6.5 cm), and mature trees (>6.5 cm) [37].
2.3. Data Analysis
Processes underlying the observed patterns can be elucidated with point-pattern analysis, which combines a set of tools for describing the spatial distribution of discrete points. Plants are represented as points and are mapped individually with Cartesian coordinates within a study area [38,39]. Univariate spatial analysis using the L-function was chosen to describe the spatial patterns of all trees in the five developmental stages. The L-function [40] is derived from the Ripley’s K-function [41]. The Ripley’s K-function characterizes the point pattern over a range of distance scales, estimates the expected number of neighbor points in a circle of radius r from an arbitrary point divided by overall point density in the study site, and can, therefore, detect mixed patterns. The L-function stabilizes and linearizes the variance of the K-function, which simplifies the interpretation of results. To assess the significance of the L-function, Monte Carlo simulations were used under a given null model to achieve a 95% confidence interval with 199 simulations. We applied the edge-effect correction method for rectangular study areas extended by Goreaud and Pe´lissier based on Ripley’s local weighting factor [42]. The spatial pattern can then be described as random, regular, and aggregated, when the values of L(r) fell within, below or above the confidence envelope, respectively [43]. The univariate estimators of the K- and L-functions are calculated as:
where A is the sample plot area, n is the number of trees in A, δ(rij) is an indicator function of the mean number of neighbors within a circle around each tree with the distance r being the radius, where rij is the distance from the ith tree to the jth tree.
To examine the spatial association among trees between different tree size-classes, the bivariate L12-function was used [38,43]. The L12-function is a linearized version of the K12-function. The bivariate K12-function is defined as the expected number of neighbors in a class B within a circle with a given radius r, centered on an arbitrary point in a class A, divided by the density of points in class B [38,43]. Similar to the univariate case, Monte Carlo simulation was used under a given null model to achieve a 95% confidence interval with 199 simulations. The bivariate estimators of the K12- and L12-functions are calculated as:
where np and nq are the number of points in class A and class B, and other aparameters are the same as in (1) and (2).
The spatial analysis L-function was completed using the ‘‘spatstat’’ package of the statistical software package R [44,45]. The L12-function analysis was completed with the “ads” package of R [46]. A geostatistical tool (semivariance analysis) was used to further describe the spatial dependence of plant populations (i.e., plant height, crown width, and the proportion of dead branches) in the five developmental stages. The geostatistical analysis was completed with the software package GS+ version 9 (Mail Gamma Design Software, LLC, Plainwell, MI, USA). ANOVA statistical analysis was performed using the software program SPSS (version 18.0, IBM, New York, NY, USA).
3. Results
3.1. H. ammodendron Characteristics and Spatial Dependence Among Stages of Revegetation
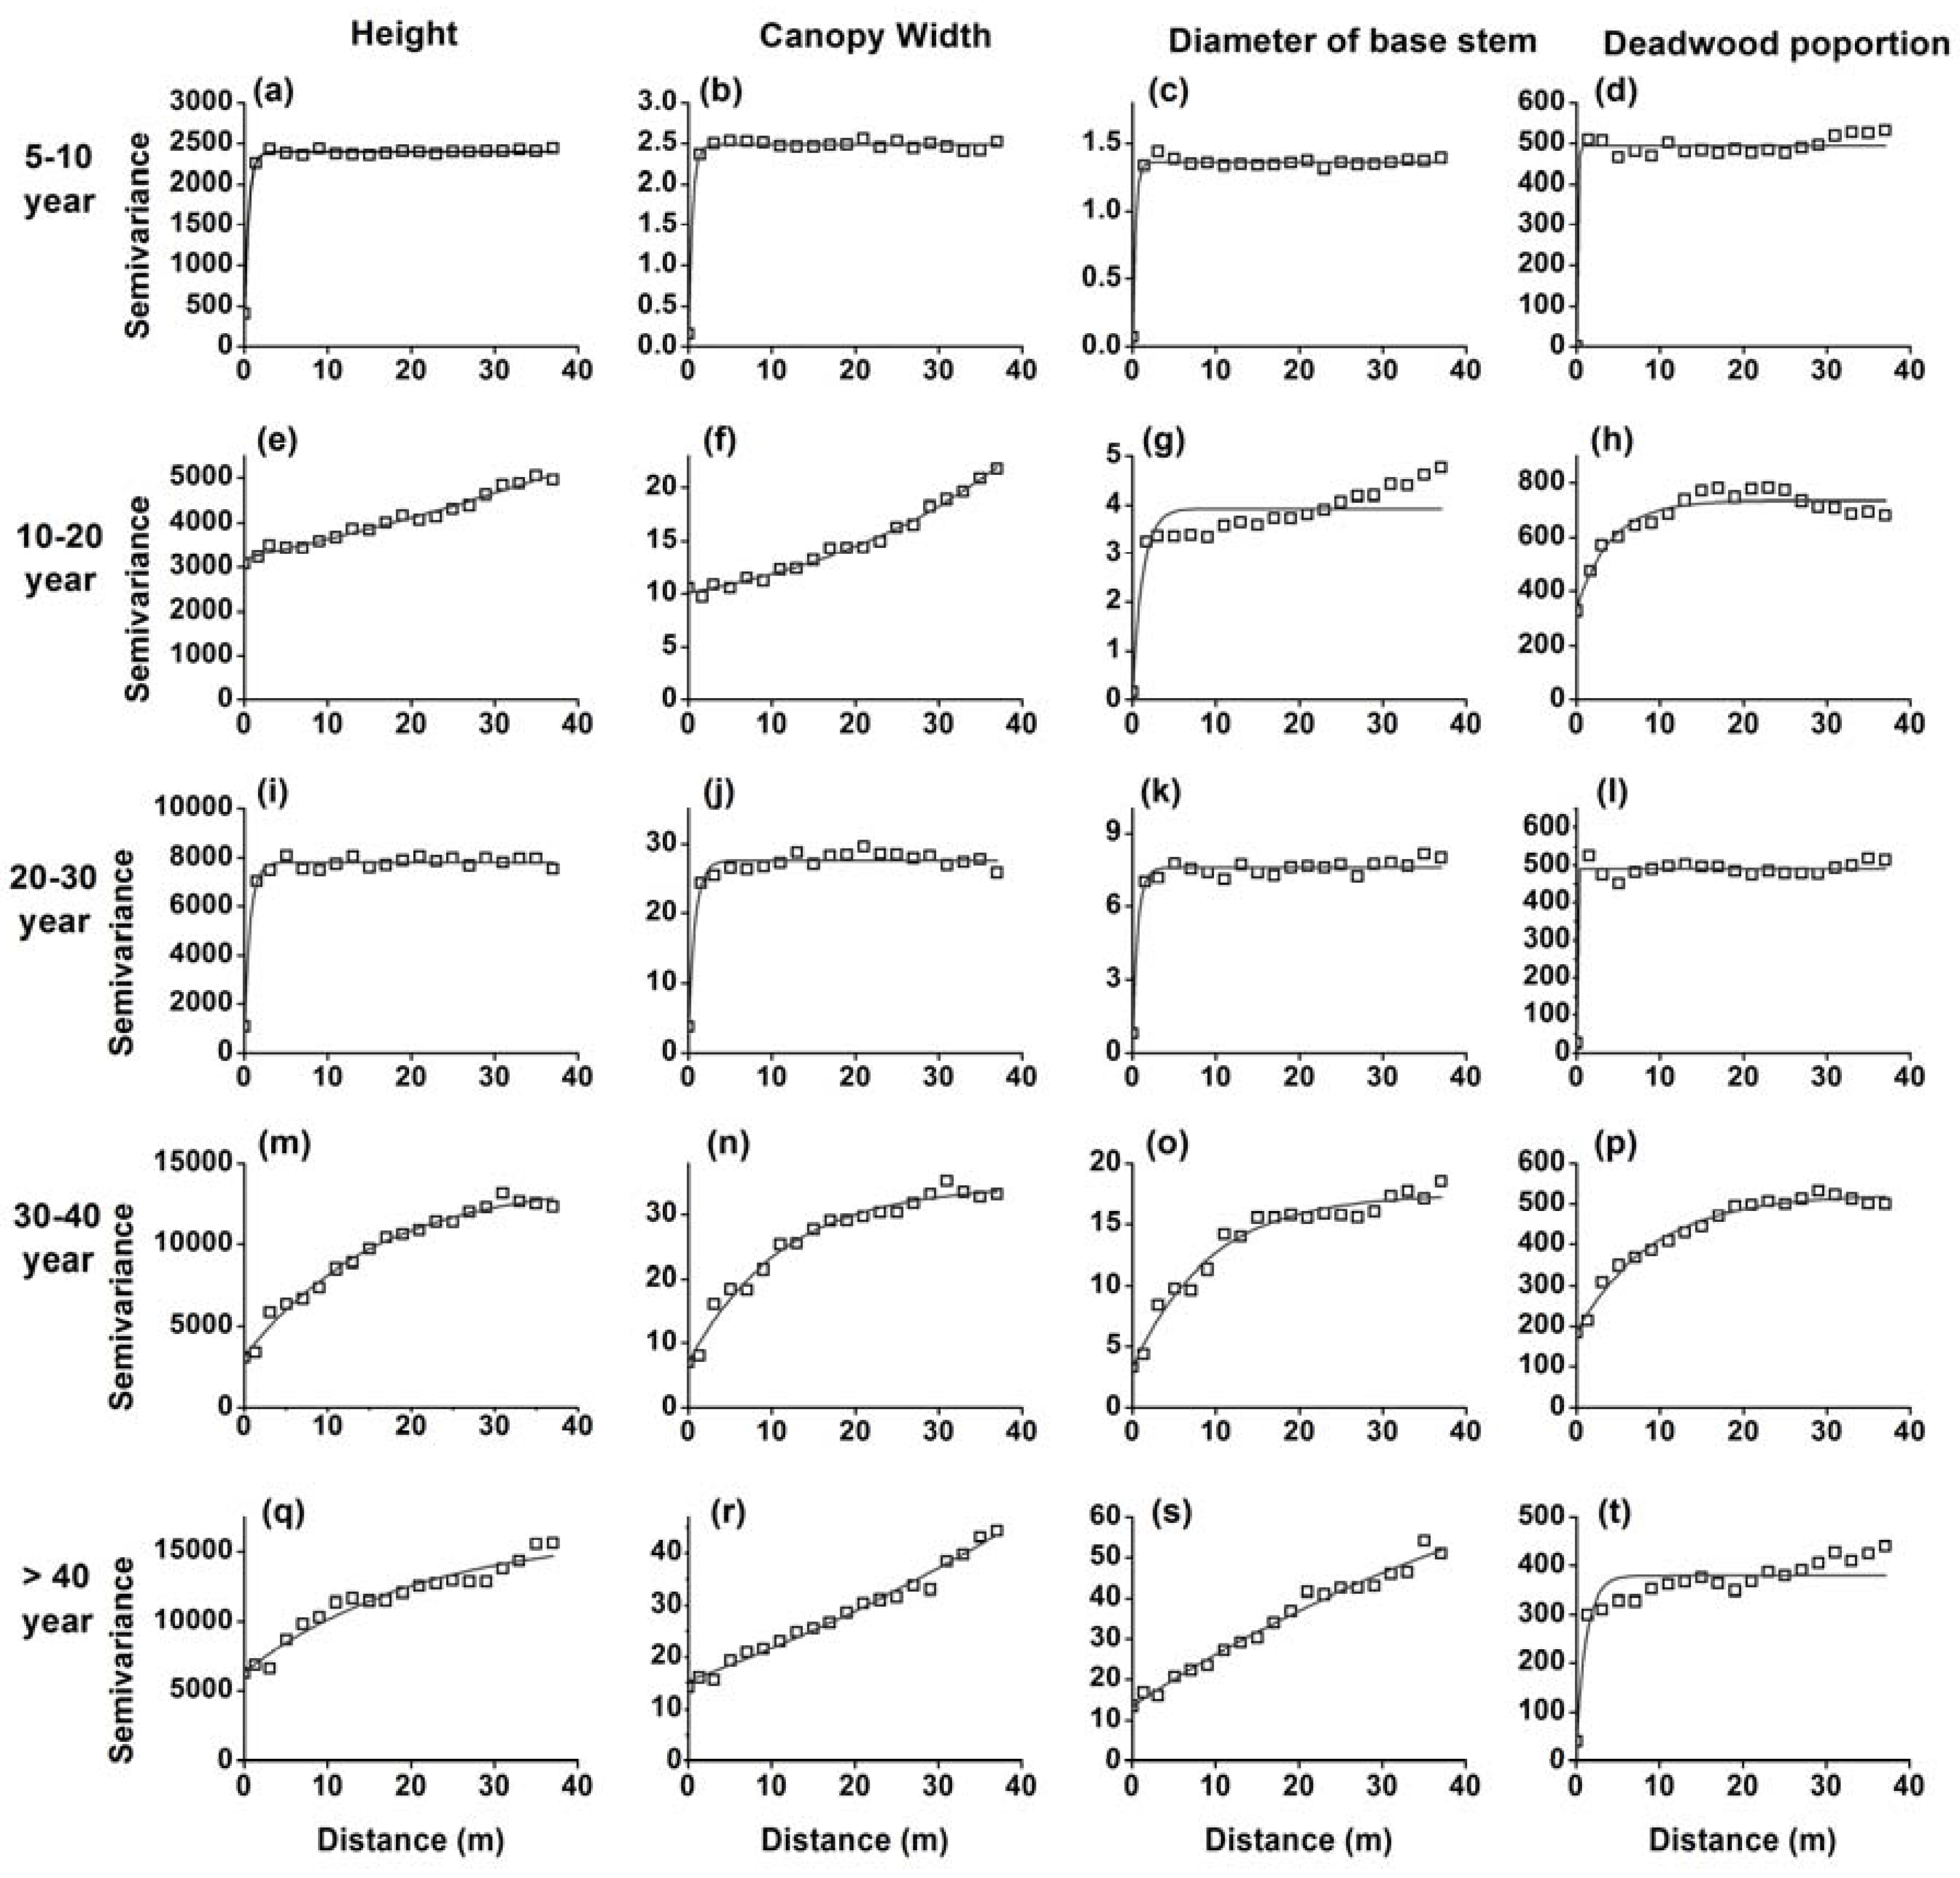
Significant differences in height, crown width, diameter at stem base, deadwood proportion, and stem density in different developmental stages were apparent (Table 1). The semi-variance analyses of height, crown width, diameter at stem base, and the proportion of dead branches in H. ammodendron in five developmental stages are shown in Figure 2. The 5–10-year and 20–30-year stages exhibited a homogeneous distribution of all four variables. While the 10–20-year stage exhibited high variation in tree-height and average crown width, there was a homogeneous distribution of diameter at stem base and dead wood proportion. The 30–40-year and >40-year stages showed high variation in tree height, average crown width, and diameter at the stem base, indicating strong patch patterns.
3.2. Spatial Patterns of H. ammodendron in Five Stages of Development
The overall spatial patterns of H. ammodendron in five stages of development are shown in Figure 3. Plots of L-functions against distance that are below the lower confidence interval indicate regular spatial patterns, those that are above the upper interval indicate clustered patterns, and those within the confidence intervals indicate random spatial patterns. The results indicate that at relatively small distances (around 2 m), trees in the 5–10-year, 10–20-year, and 20–30-year stages are regularly distributed. Trees in the 5–10-year stage showed clustered patterns when the distance was >2 m. Trees in the 10–20-year stage were randomly distributed at distances of 2–6 m, and aggregated when the distance was >6 m. Trees in the 20–30-year stage were randomly distributed when the distance was >2 m. Trees in the 30–40-year and >40-year stages showed clustered patterns for all distances.
The left column: maps of trees showing the locations of individuals. The size of trees is indicated by symbol sizes proportional to the diameter of stem base. The right column: univariate results for the L-function; solid lines represent the observed values of L-function, green dotted lines indicate the upper and lower limits of the 95% Monte Carlo intervals of the null hypothesis of complete spatial randomness.
3.3. Spatial Associations among Different Tree-Size Classes
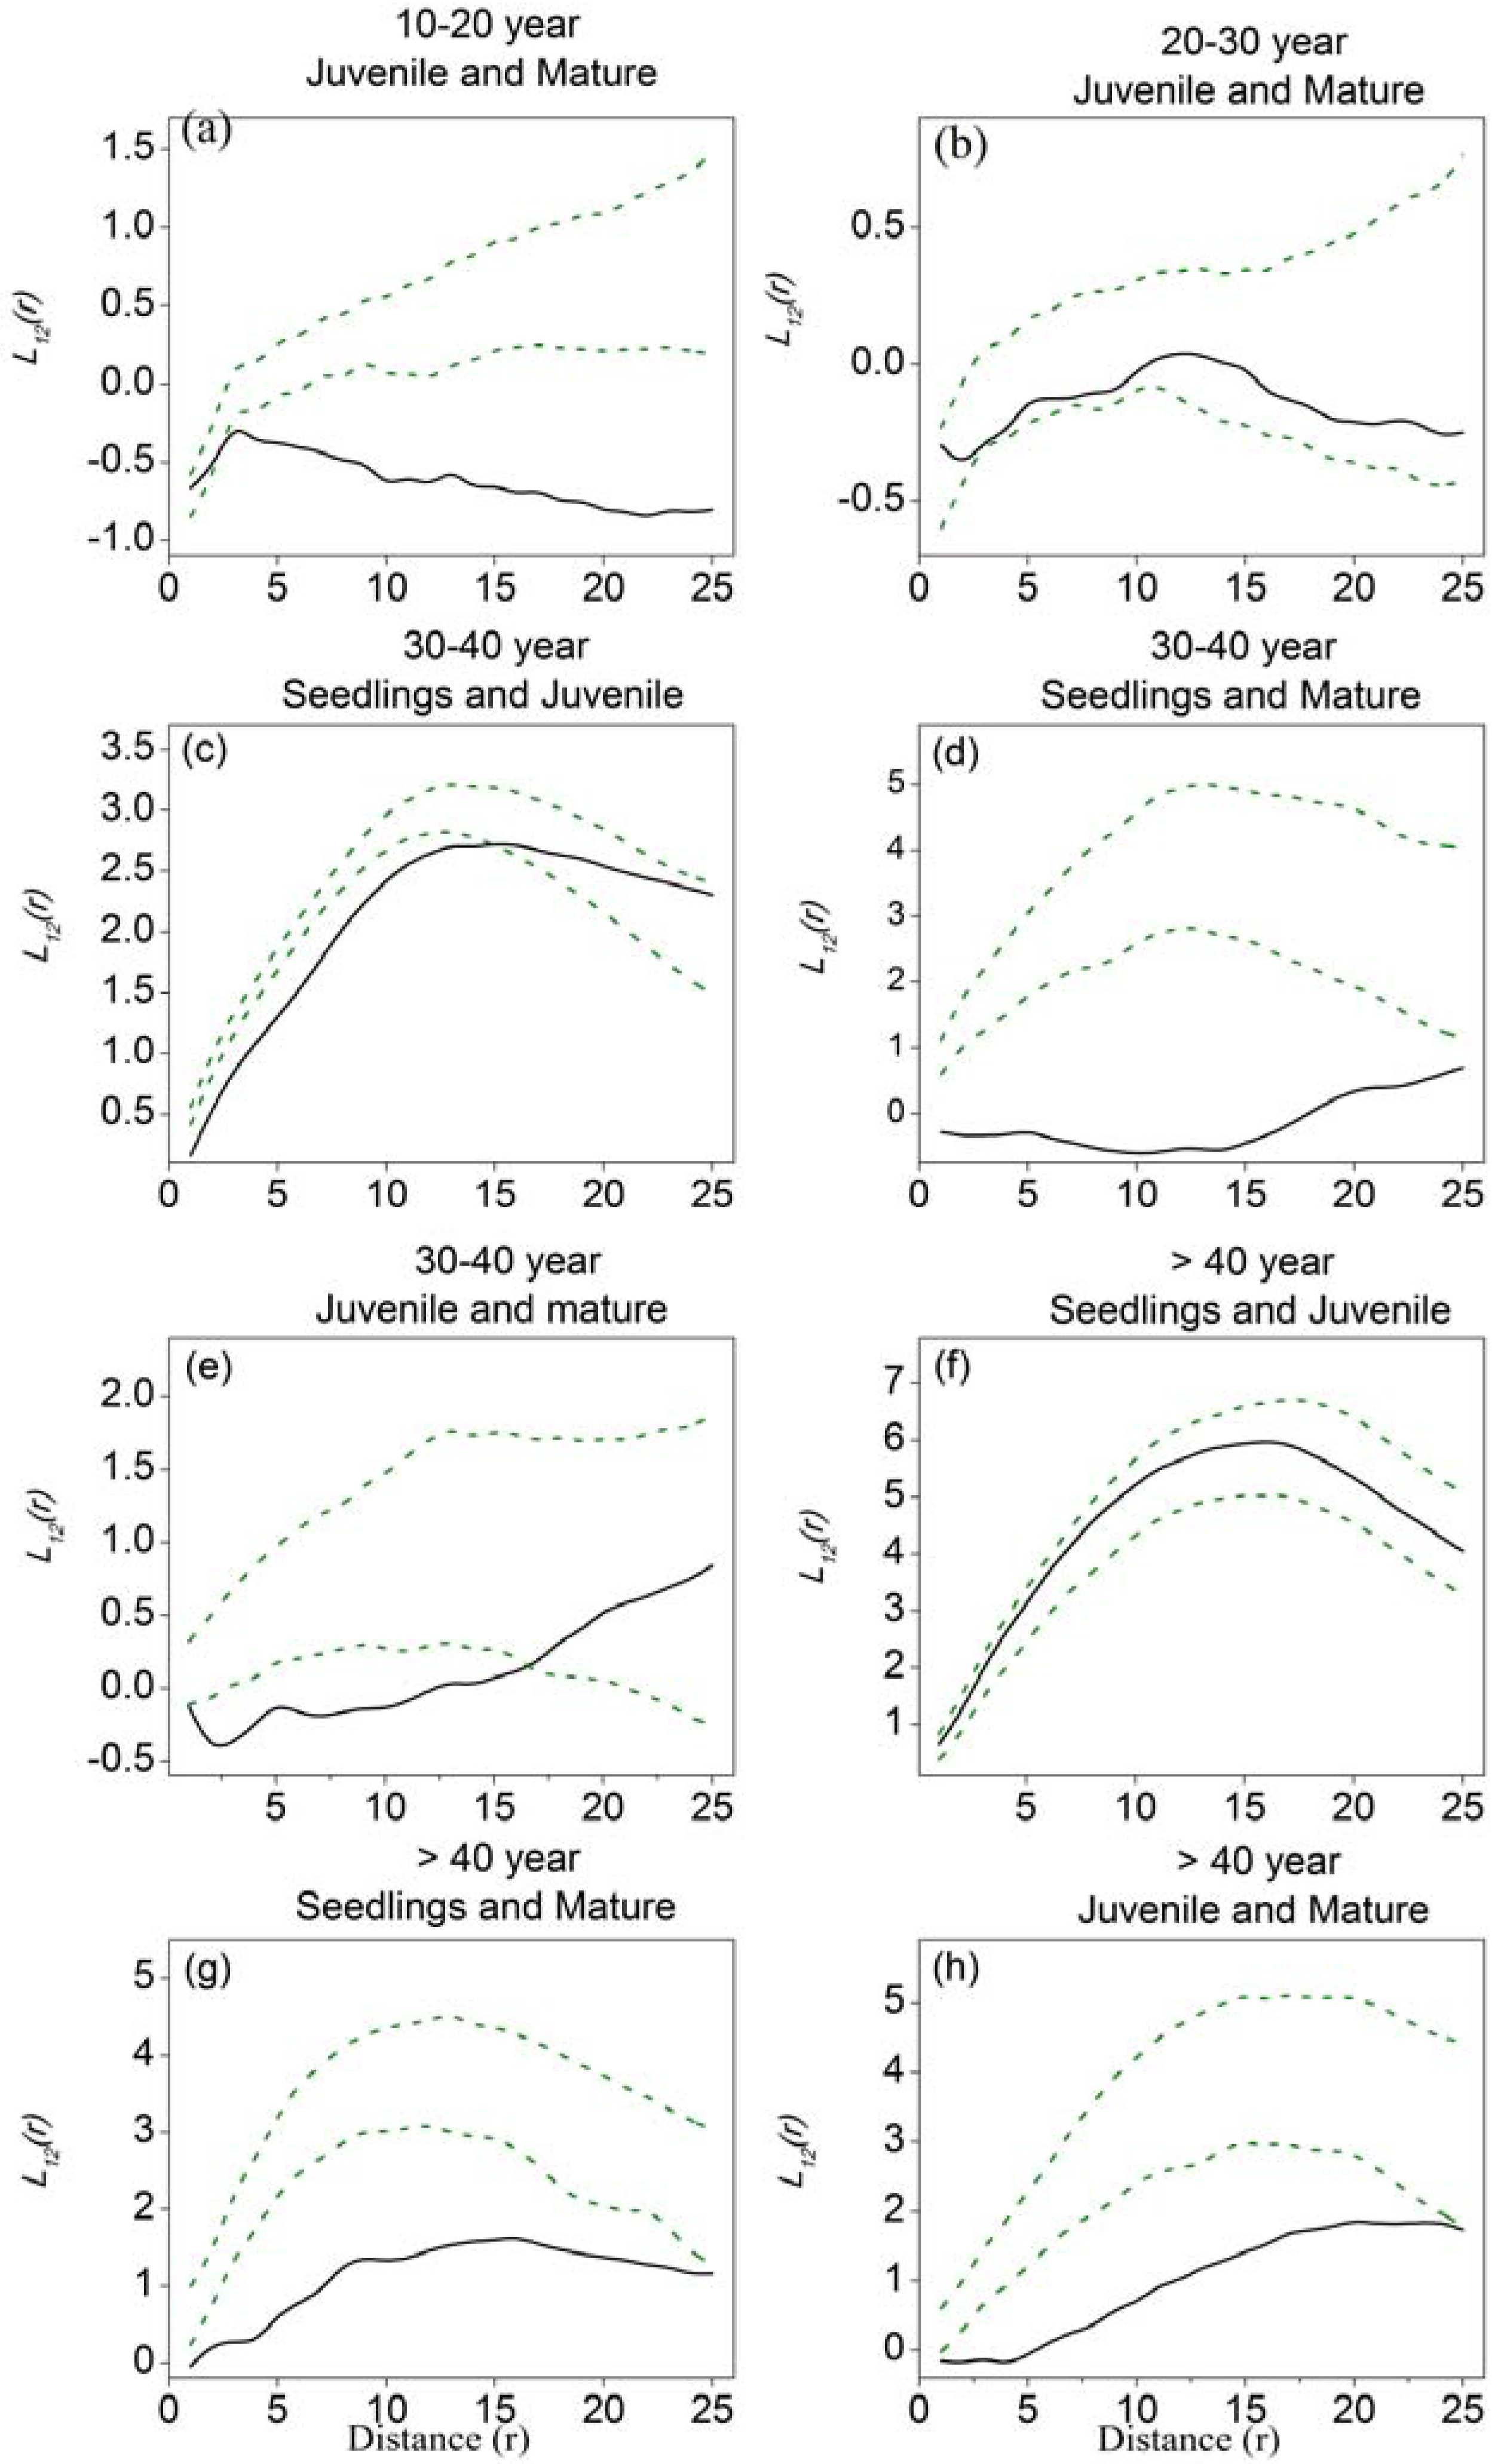
Spatial associations of H. ammodendron among different tree-size classes in five stages of development are shown in Figure 4. Plots of L12-functions against distance that fall below the lower confidence interval indicate negative associations (i.e., repulsion), those that are above the upper interval indicate positive associations (i.e., attraction), and those within the confidence intervals indicate spatial independence. Because the number of seedlings and mature trees was very low in the 5–10-year stage, and there were few seedlings in both the 10–20-year and the 20–30-year stages, we analyzed the associations between juvenile and mature trees in 10–20-year and the 20–30-year stages only. In the 10–20-year stage, the juvenile and mature trees showed independence at small scales (around 2 m), shifting to repulsion at large scales. In the 20–30-year stage, juvenile and mature trees showed independence at all distance scales. In the 30–40-year stage, a large number of seedlings appeared; the seedlings and juvenile trees exhibited repulsion at scales of 15 m, and spatial independence at large scales. Seedlings and juvenile trees in the >40-year stage exhibited spatial independence at all distance scales. Seedlings and mature trees in the 30–40-year stage exhibited negative associations at all distance scales, while those in >40-year stage exhibited negative associations at scales of 22 m and spatial independence at larger scales. Juvenile and mature trees in the 30–40-year stage had negative associations at scales of 17 m and were spatially independent at large scales, while in the >40-year stage, they exhibited negative associations revealing spatial repulsion at all distance scales.
4. Discussion
4.1. Regeneration Dynamics across Stages of Revegetation
Homogeneous spatial patterns were detected for height, crown width, diameter at stem base, and the proportion of dead branches in early stages, and patchy patterns in older stages. Similar patterns were observed in high-altitude forests in the Alps [47]. High density and limited resources at the 5–10-year stage led to density-dependent mortality, the spatial heterogeneity of height and crown was significantly enhanced in the 10–20-year stage, while with respect to growth, H. ammodendron plantation entered into a relatively stable stage in the 20–30-year stage. Considerable seedling recruitment was observed in the 30–40-year stage, with a strong tendency for aggregation; this was in agreement with gap-phase regeneration, where seedlings germinate in gaps created by death of over-mature trees [48]. However, high seedling mortality was observed in subsequent stages probably due to self-thinning, and the initial increase in the density of juveniles in the 30–40-year stage decreased in the >40-year stage. Processes of early gap-regeneration and later intra-specific competition were also detected in a coniferous forest in Japan [49].
4.2. Changes in Spatial Patterns in the H. ammodendron Plantation
The results of our univariate spatial analyses clearly revealed an increase in the degree of small-scale (<2 m) aggregation from the 5–10-year stage to the >40-year stage. At large scales (>2 m), cluster patterns were present in the 5–10-year, 30–40-year, and >40-year stages, and random distributions occurred in the 10–20-year and 20–30-year stages. It has been shown that some species can be aggregated in small diameter classes, while others become aggregated in large diameter classes [50,51,52]. Our results supported the conclusions of Stoll and Bergius [15], i.e., that the spatial distribution of conspecifics under tree-size asymmetrical (rather than symmetrical) competition can shift from initially clustered, via random, to regular, as a result of density-dependent mortality. However, in our study, at scales <2 m, a transition from uniform to clustered was observed with age of stand, and at scales >2 m, a transition from initially clustered via random, back to clustered was observed. This pattern indicated that high stem density in the 5–10-year stage resulted in increasing competition for resources as trees increased in size, and in self-thinning, which led to a reduction in the degree of aggregation in later stages. Murrell [53] pointed out that it is entirely possible for species in large diameter classes to be more aggregated, when mature tree recruitment rates are low and dispersal is poor, even if density-dependence is strong, and the area lacks abiotic heterogeneities, such as differences in slope or elevation. The same is valid for H. ammodendron: low fecundity, high mortality, and resource scarcity led to a decrease in the number of mature trees; this resulted in an aggregation pattern in the large-diameter class. Few mature trees were recruited into the 30–40-year and >40-year stages, resulting in a decrease in interactions between individuals and in self-thinning. While recruitment takes place in the close vicinity of the trees, juveniles and seedlings are clustered around the mature trees. Alternatively, as can be observed in the south-eastern corners of the 30–40 and >40 years, gaps were generated due to the mortality of adult trees, and clusters of seedlings/juveniles are present. In arid environments, under harsh and stressful conditions, not only self-thinning, but also abiotic stress, may affect plant growth and survival, with possible effects on the spatial patterns of populations [54]. Therefore, in the 30–40-year and >40-year stages, the H. ammodendron plantation exhibited a cluster rather than a regular pattern due to the scarcity of resources.
4.3. Spatial Associations and the Balance between Facilitation and Competition
The results from the bivariate spatial analysis of H. ammodendron in different size classes provide evidence for the balance between facilitation and competition. We hypothesized that under high stress conditions, local density is high and trees are distributed in an aggregated pattern; if competition is the dominant interaction, the density will be reduced, and the degree of aggregation will decline with the growth of trees. If facilitation is the dominant interaction, the reverse will be true. In this study, we found that the effects of plant interactions were coincident with the local population density along stages of revegetation. Under high density and limited resources in the 10–20-year stage, juvenile and mature trees showed independence at small scales (around 2 m), shifting to strong repulsion at large scales; this indicated that competition was the dominant interaction. In the 20–30-year stage, density was reduced to one-fourth of that of the 5–10-year stage, decreasing the level of competitive intensity of juvenile and mature trees; the two size classes exhibited independence at all distance scales, which was coincident with random distribution. In the 30–40-year stage, the seedlings and juvenile trees exhibited weak repulsion at 15 m and independence at larger distance scales, while the seedlings and mature trees had strong repulsion which began to decrease at 15 m. These patterns may be indicative of gap-phase regeneration because competition between seedlings and mature trees was greater than that between seedlings and juvenile trees, enabling the establishment and release of regeneration. In the >40-year stage, the number of seedlings was greatly reduced, and seedlings and juvenile trees exhibited independence rather than repulsion, which suggested that competition and facilitation achieved a balance; competition between seedlings and mature trees was also in decline. Competition between juvenile and mature trees was weaker in the 30–40-year than in the >40-year stage, as demonstrated by a lower degree of aggregation in the 30–40-year than in the >40-year stage. Consequently, competition between conspecifics in the 5–10-year stage, 10–20-year and 20–30-year stages may be the dominant factor influencing plant growth and survival. Dominant factors in the 30–40-year and >40-year stages may be interactions between conspecifics under tree-size asymmetric competition and abiotic stresses under tree-size symmetric competition.
4.4. Main Abiotic Factors Affected the Spatial Patterns and Associations
Spatial patterns and associations of plant populations are a consequence of localized dispersal, biotic interactions, abiotic stresses, and disturbance [55,56]. In this study, the main factors were the interactions between conspecifics and abiotic heterogeneity. Our study site did not vary in slope, elevation, or meteorological conditions; however, there were differences due to soil fertility and moisture. Wang et al. [57] found that soil conditions improved after an H. ammodendron plantation was established, but water resources became scarcer than before. Water resources are the greatest limitation for plantations, even though H. ammodendron exhibits a much higher tolerance to water shortage than other plants. Ten-year-old H. ammodendron can use deep-soil and ground water, while younger (and smaller) individuals can only use soil moisture; plants 20 years after establishment use groundwater as their main water source [58]. These observations offer a strong support for our finding that, at scales >2 m, the spatial pattern in the H. ammodendron plantation shifted from initially clustered via random, to clustered again; the H. ammodendron plantation experienced the highest mortality at the 5–10-year stage as a result of fierce competition for soil water, while with growth, it entered into a relatively stable stage, where the gaps generated due to mortality of adult trees and improved soil conditions provided opportunities for regeneration. In the >40-year stage, the regeneration experienced a decline under enhanced competition for water, and the plantation showed a clustered pattern at all scales due to water stress.
The transitional regions between oases and deserts with fragile ecosystems are most seriously affected by desertification and sand hazards. Blind and large-scale revegetation with a single species of plant in these areas results in degradation at a different level. Furthermore, it seriously affects the ecological effects of artificial sand-fixation plants and the overall sustainability of the restoration [59]. Investigating the spatial patterns and association dynamics of artificial sand-fixing plants contributes to exploring the main causes of vegetation degeneration, would be beneficial for further study of the evolutionary process and driving mechanism of artificial sand-fixation plants, in order to provide a scientific basis for ecosystem restoration in arid areas, and would provide some reference for plantation construction and management in other transitional regions between oases and deserts.
5. Conclusions
We analyzed the spatial patterns and associations in an H. ammodendron plantation at five stages of development, providing a framework for improving our general understanding of pattern variation in a sand-fixing plantation. We discussed the factors which may be responsible for shaping the observed spatial patterns and associations. The results may provide direct and comprehensive knowledge for developing management programs and implementing a close-to-nature plantation that reproduces natural processes of vegetation succession; further, our results also serve as a realistic reference to model plant patterns and dynamics and increase understanding of sand-fixing plantation dynamics. Thus, the initial density of H. ammodendron must be reduced to decrease competitive pressure for water resources between conspecifics. When regeneration appears after 30 years of establishment, the stability and activity of H. ammodendron plantations may be maintained by applying some artificial measures to stimulate the growth of seedlings (i.e., supplemental watering). Further research on the expected optimum initial density of H. ammodendron plantations and the quantification of influential factors are needed to provide a more complete understanding of the dynamics of a sand-fixing plantation.
Acknowledgments
This study was supported by the National Natural Science Foundation of China subsidization project (Grant No. 41471435).
Author Contributions
Wenzhi Zhao and Ying Zheng conceived and designed the study; Ying Zheng performed the study; Ying Zheng and Gefei Zhang analyzed the data; Ying Zheng wrote the manuscript.
Conflicts of Interest
The authors declare no conflict of interest.
References
- Adeel, Z. Findings of the global desertification assessment by the Millennium Ecosystem Assessment—A perspective for better managing scientific knowledge. In The Future of Drylands; Lee, C., Schaaf, T., Eds.; Springer: Dordrecht, The Netherlands, 2008; pp. 677–685. [Google Scholar]
- Hufkens, K.; Scheunders, P.; Ceulemans, R. Ecotones in vegetation ecology: Methodologies and definitions revisited. Ecol. Res. 2009, 24, 977–986. [Google Scholar] [CrossRef]
- Wang, Y.G.; Li, Y. Land exploitation resulting in soil salinization in a desert-oasis ecotone. Catena 2013, 100, 50–56. [Google Scholar] [CrossRef]
- Zhao, W.Z.; Hu, G.L.; Zhang, Z.Z.; He, Z.B. Shielding effect of oasis-protection systems composed of various forms of wind break on sand fixation in an arid region: A case study in the Hexi Corridor, northwest China. Ecol. Eng. 2008, 33, 119–125. [Google Scholar] [CrossRef]
- Cao, S.; Chen, L.; Shankman, D.; Wang, C.; Wang, X.; Zhang, H. Excessive reliance on afforestation in China’s arid and semi-arid regions: Lessons in ecological restoration. Earth Sci. Rev. 2011, 104, 240–245. [Google Scholar] [CrossRef]
- Li, X.R.; Zhao, Y.; Hui, R.; Su, J.Q.; Gao, Y.H. Progress and trend of development of restoration ecology research in the arid regions of China. Prog. Geo. 2014, 33, 1435–1443. [Google Scholar]
- Li, X.R.; Zhang, Z.S.; Huang, L.; Wang, X.P. Review of the ecohydrological processes and feedback mechanisms controlling sand-binding vegetation systems in sandy desert regions of China. Chin. Sci. Bull. 2013, 58, 1483–1496. [Google Scholar] [CrossRef]
- Hardenberg, J.V.; Meron, E.; Shachak, M.; Zarmi, Y. Diversity of vegetation patterns and desertification. Phys. Rev. Lett. 2001, 87, 198101. [Google Scholar] [CrossRef] [PubMed]
- Saco, P.M.; Willgoose, G.R.; Hancock, G.R. Eco-geomorphology of banded vegetation patterns in arid and semi-arid regions. Hydrol. Earth. Syst. Sci. 2007, 11, 1717–1730. [Google Scholar] [CrossRef]
- Du, B.M.; Kang, H.Z.; Zhu, Y.H.; Zhou, X.; Yin, S.; Burgess, P.J.; Liu, C.J. Variation of Oriental Oak (Quercus variabilis) leaf delta C-13 across temperate and subtropical China: Spatial patterns and sensitivity to precipitation. Forests 2015, 6, 2296–2306. [Google Scholar] [CrossRef]
- Perry, G.L.W.; Enright, N.J.; Miller, B.P.; Lamont, B.B. Nearest-neighbour interactions in species-rich shrublands: The roles of abundance, spatial patterns and resources. Oikos 2009, 118, 161–174. [Google Scholar] [CrossRef]
- Wang, X.T.; Liang, C.Z.; Wang, W. Balance between facilitation and competition determines spatial patterns in a plant population. Chin. Sci. Bull. 2014, 59, 1405–1415. [Google Scholar] [CrossRef]
- Couteron, P.; Kokou, K. Woody vegetation spatial patterns in a semi-arid savanna of Burkina Faso, West Africa. Plant. Ecol. 1997, 132, 211–227. [Google Scholar] [CrossRef]
- Barot, S.; Gignoux, J.; Menaut, J.C. Demography of a savanna palm tree: Predictions from comprehensive spatial pattern analyses. Ecology 1999, 80, 1987–2005. [Google Scholar] [CrossRef]
- Stoll, P.; Bergius, E. Pattern and process: Competition causes regular spacing of individuals within plant populations. J. Ecol. 2005, 93, 395–403. [Google Scholar] [CrossRef]
- Malkinson, D.; Tielbörger, K. What does the stress-gradient hypothesis predict? Resolving the discrepancies. Oikos 2010, 119, 1546–1552. [Google Scholar] [CrossRef]
- Wiegand, T.; Gunatilleke, S.; Gunatilleke, N. Species associations in a heterogeneous Sri Lankan dipterocarp forest. Am. Nat. 2007, 170, E77–E95. [Google Scholar] [CrossRef] [PubMed]
- Gross, K. Positive interactions among competitors can produce species—Rich communities. Ecol. Lett. 2008, 11, 929–936. [Google Scholar] [CrossRef] [PubMed]
- Lin, Y.; Han, G.D.; Zhao, M.L.; Chang, S.X. Spatial vegetation patterns as early signs of desertification: A case study of a desert steppe in Inner Mongolia, China. Landsc. Ecol. 2010, 25, 1519–1527. [Google Scholar] [CrossRef]
- Konings, A.G.; Dekker, S.C.; Rietkerk, M.; Katul, G.G. Drought sensitivity of patterned vegetation determined by rainfall—Land surface feedbacks. J. Geophys. Res. 2011, 116, G04008. [Google Scholar] [CrossRef]
- Bestelmeyer, B.T.; Duniway, M.C.; James, D.K.; Burkett, L.M.; Havstad, K.M. A test of critical thresholds and their indicators in a desertification-prone ecosystem: More resilience than we thought. Ecol. Lett. 2013, 16, 339–345. [Google Scholar] [CrossRef] [PubMed]
- Kulasova, A.; Blazkova, S.; Beven, K.; Rezacova, D.; Cajthaml, J. Vegetation pattern as an indicator of saturated areas in a Czech headwater catchment. Hydrol. Processes 2014, 28, 5297–5308. [Google Scholar] [CrossRef]
- Powell, R.D. The role of spatial pattern in the population biology of Centaurea diffusa. J. Ecol. 1990, 78, 374–388. [Google Scholar] [CrossRef]
- Anderson, K.J. Temporal patterns in rates of community change during succession. Am. Nat. 2007, 169, 780–793. [Google Scholar] [CrossRef] [PubMed]
- Lameire, S.; Hermy, M.; Honnay, O. Two decades of change in the ground vegetation of a mixed deciduous forest in an agricultural landscape. J. Veg. Sci. 2000, 11, 695–704. [Google Scholar] [CrossRef]
- Chesson, P.; Gebauer, R.L.E.; Schwinning, S.; Huntly, N.; Wiegand, K.; Ernest, M.S.K.; Sher, A.; Novoplansky, A.; Weltzin, J.F. Resource pulses, species interactions, and diversity maintenance in arid and semi-arid environments. Oecologia 2004, 141, 236–253. [Google Scholar] [CrossRef] [PubMed]
- Sproull, G.J.; Quigley, M.F.; Sher, A.; González, E. Long-term changes in composition, diversity and distribution patterns in four herbaceous plant communities along an elevational gradient. J. Veg. Sci. 2015, 26, 552–563. [Google Scholar] [CrossRef]
- Allen, M.S.; Thapa, V.; Arévalo, J. R.; Palmer, M.W. Windstorm damage and forest recovery: Accelerated succession, stand structure, and spatial pattern over 25 years in two Minnesota forests. Plant. Ecol. 2012, 213, 1833–1842. [Google Scholar] [CrossRef]
- Larson, A.J.; Churchill, D. Tree spatial patterns in fire-frequent forests of western North America, including mechanisms of pattern formation and implications for designing fuel reduction and restoration treatments. For. Ecol. Manag. 2012, 267, 74–92. [Google Scholar] [CrossRef]
- Ross, L.C.; Woodin, S.J.; Hester, A.J.; Thompson, D.B.A.; Birks, H.J.B. Biotic homogenization of upland vegetation: Patterns and drivers at multiple spatial scales over five decades. J. Veg. Sci. 2012, 23, 755–770. [Google Scholar] [CrossRef]
- Ma, X.; Huete, A.; Yu, Q.; Coupe, N.R.; Davies, K.; Broich, M.; Ratana, P.; Beringer, J.; Hutley, L.B.; Cleverly, J.; et al. Spatial patterns and temporal dynamics in savanna vegetation phenology across the North Australian Tropical Transect. Remote Sens. Environ. 2013, 139, 97–115. [Google Scholar] [CrossRef]
- Badreldin, N.; Uria-Diez, J.; Mateu, J.; Youssef, A.; Stal, C.; El-Bana, M.; Magdy, A.; Goossens, R. A spatial pattern analysis of the halophytic species distribution in an arid coastal environment. Environ. Monit. Assess. 2015, 187, 1–15. [Google Scholar] [CrossRef] [PubMed]
- Zhao, L.J.; Xiang, W.H.; Li, J.X.; Lei, P.F.; Deng, X.W.; Fang, X.; Peng, C.H. Effects of topographic and soil factors on woody species assembly in a Chinese subtropical evergreen broadleaved forest. Forests 2015, 6, 650–669. [Google Scholar] [CrossRef]
- Su, Y.Z.; Zhao, W.Z.; Su, P.X.; Zhang, Z.H.; Wang, T.; Ram, R. Ecological effects of desertification control and desertified land reclamation in an oasis-desert ecotone in an arid region: A case study in Hexi Corridor, northwest China. Ecol. Eng. 2007, 29, 117–124. [Google Scholar] [CrossRef]
- He, F.; Duncan, R.P. Density-dependent effects on tree survival in an old-growth Douglas fir forest. J. Ecol. 2000, 88, 676–688. [Google Scholar] [CrossRef]
- Dale, M.R.T.; Fortin, M.J. Spatial Analysis: A Guide for Ecologists, 2nd ed.; Cambridge University Press: Cambridge, UK, 2014; p. 382. [Google Scholar]
- Jia, Z.Q.; Lu, Q. Haloxylon Ammodendron; China Environmental Science Press: Beijing, China, 2004; p. 67. [Google Scholar]
- Diggle, P.J. Statistical Analysis of Spatial and Spatio-Temporal Point Patternss, 3rd ed.; CRC Press: Boca Raton, FL, USA, 2013; pp. 1–5. [Google Scholar]
- Wiegand, T.; Kissling, W.D.; Cipriotti, P.A.; Aguiar, M.R. Extending point pattern analysis for objects of finite size and irregular shape. J. Ecol. 2006, 94, 825–837. [Google Scholar] [CrossRef]
- Besag, J. Contribution to the discussion of Dr. Ripley’s paper. Journal of the Royal Statistical. J. R. Stat. Soc. B 1977, 39, 193–195. [Google Scholar]
- Ripley, B.D. Modelling spatial patterns. J. R. Stat. Soc. B 1977, 39, 172–212. [Google Scholar]
- Goreaud, F.; Pe´lissier, R. On explicit formulas of edge effect correction for Ripley’s K-function. J. Veg. Sci. 1999, 10, 433–438. [Google Scholar] [CrossRef]
- Wiegand, T.; Moloney, K.A. Rings, circles, and null-models for point pattern analysis in ecology. Oikos 2004, 104, 209–229. [Google Scholar] [CrossRef]
- Baddeley, A.; Turner, R. Spatstat: An R package for analyzing spatial point patterns. J. Stat. Softw. 2005, 12, 1–42. [Google Scholar] [CrossRef]
- Baddeley, A.; Turner, R.; Møller, J.; Hazelton, M. Residual analysis for spatial point processes (with discussion). J. R. Stat. Soc. B 2005, 67, 617–666. [Google Scholar] [CrossRef]
- Pelissier, R.; Goreaud, F.; Pelissier, M.R. Package ‘ads’. Science 2015, 14, 681–692. [Google Scholar]
- Carrer, M.; Soraruf, L.; Lingua, E. Convergent space-time tree regeneration patterns along an elevation gradient at high altitude in the Alps. For. Ecol. Manag. 2013, 304, 1–9. [Google Scholar] [CrossRef]
- Cipriotti, P.A.; Aguiar, M.R. Is the balance between competition and facilitation a driver of the patch dynamics in arid vegetation mosaics? Oikos 2015, 124, 139–149. [Google Scholar] [CrossRef]
- Nishimura, N.; Kato, K.; Sumida, A.; Ono, K.; Tanouchi, H.; Iida, S.; Hoshino, D.; Yamamoto, S.; Hara, T. Effects of life history strategies and tree competition on species coexistence in a sub-boreal coniferous forest of Japan. Plant. Ecol. 2010, 206, 29–40. [Google Scholar] [CrossRef]
- Condit, R.; Ashton, P.S.; Baker, P.; Bunyavejchewin, S.; Gunatilleke, S.; Gunatilleke, N.; Hubbell, S.P.; Foster, R.B.; Itoh, A.; LaFrankie, J.V.; et al. Spatial patterns in the distribution of tropical tree species. Science 2000, 288, 1414–1418. [Google Scholar] [CrossRef] [PubMed]
- Getzin, S.; Wiegand, T.; Wiegand, K.; He, F. Heterogeneity influences spatial patterns and demographics in forest stands. J. Ecol. 2008, 96, 807–820. [Google Scholar] [CrossRef]
- Seiwa, K.; Miwa, Y.; Sahashi, N.; Kanno, H.; Tomita, M.; Ueno, N.; Yamazaki, M. Pathogen attack and spatial patterns of juvenile mortality and growth in a temperate tree, Prunus grayana. Can. J. For. Res. 2008, 38, 2445–2454. [Google Scholar] [CrossRef]
- Murrell, D.J. On the emergent spatial structure of size-structured populations: When does self-thinning lead to a reduction in clustering? J. Ecol. 2009, 97, 256–266. [Google Scholar] [CrossRef]
- Jia, X.; Dai, X.F.; Shen, Z.X.; Zhang, J.Y.; Wang, G.X. Facilitation can maintain clustered spatial pattern of plant populations during density-dependent mortality: Insights from a zone-of-influence model. Oikos 2011, 120, 472–480. [Google Scholar] [CrossRef]
- Tirado, R.; Pugnaire, F.I. Shrub spatial aggregation and consequences for reproductive success. Oecologia 2003, 136, 296–301. [Google Scholar] [CrossRef] [PubMed]
- Schurr, F.M.; Bossdorf, O.; Milton, S.J.; Schumacheret, J. Spatial pattern formation in semi-arid shrubland: A priori predicted versus observed pattern characteristics. Plant. Ecol. 2004, 173, 271–282. [Google Scholar] [CrossRef]
- Wang, G.H.; Zhao, W.Z.; Liu, H.; Zhang, G.F.; Li, F. Changes in soil and vegetation with stabilization of dunes in a desert-oasis ecotone. Ecol. Res. 2015, 30, 639–650. [Google Scholar] [CrossRef]
- Zhou, H.; Zhao, W.Z.; Zhang, G.F. Varying water utilization of Haloxylon ammodendron plantations in a desert-oasis ecotone. Hydrol. Processes 2016, 31, 825–835. [Google Scholar] [CrossRef]
- Li, X.R.; Zhang, Z.S.; Tan, H. J.; Gao, Y.H.; Liu, L.C.; Wang, X.P. Ecological restoration and recovery in the wind-blown sand hazard areas of northern China: Relationship between soil water and carrying capacity for vegetation in the Tengger Desert. Sci. China Life Sci. 2014, 57, 539–548. [Google Scholar] [CrossRef] [PubMed]
Figure 1.
Location of the study sites in the Heihe River Basin.
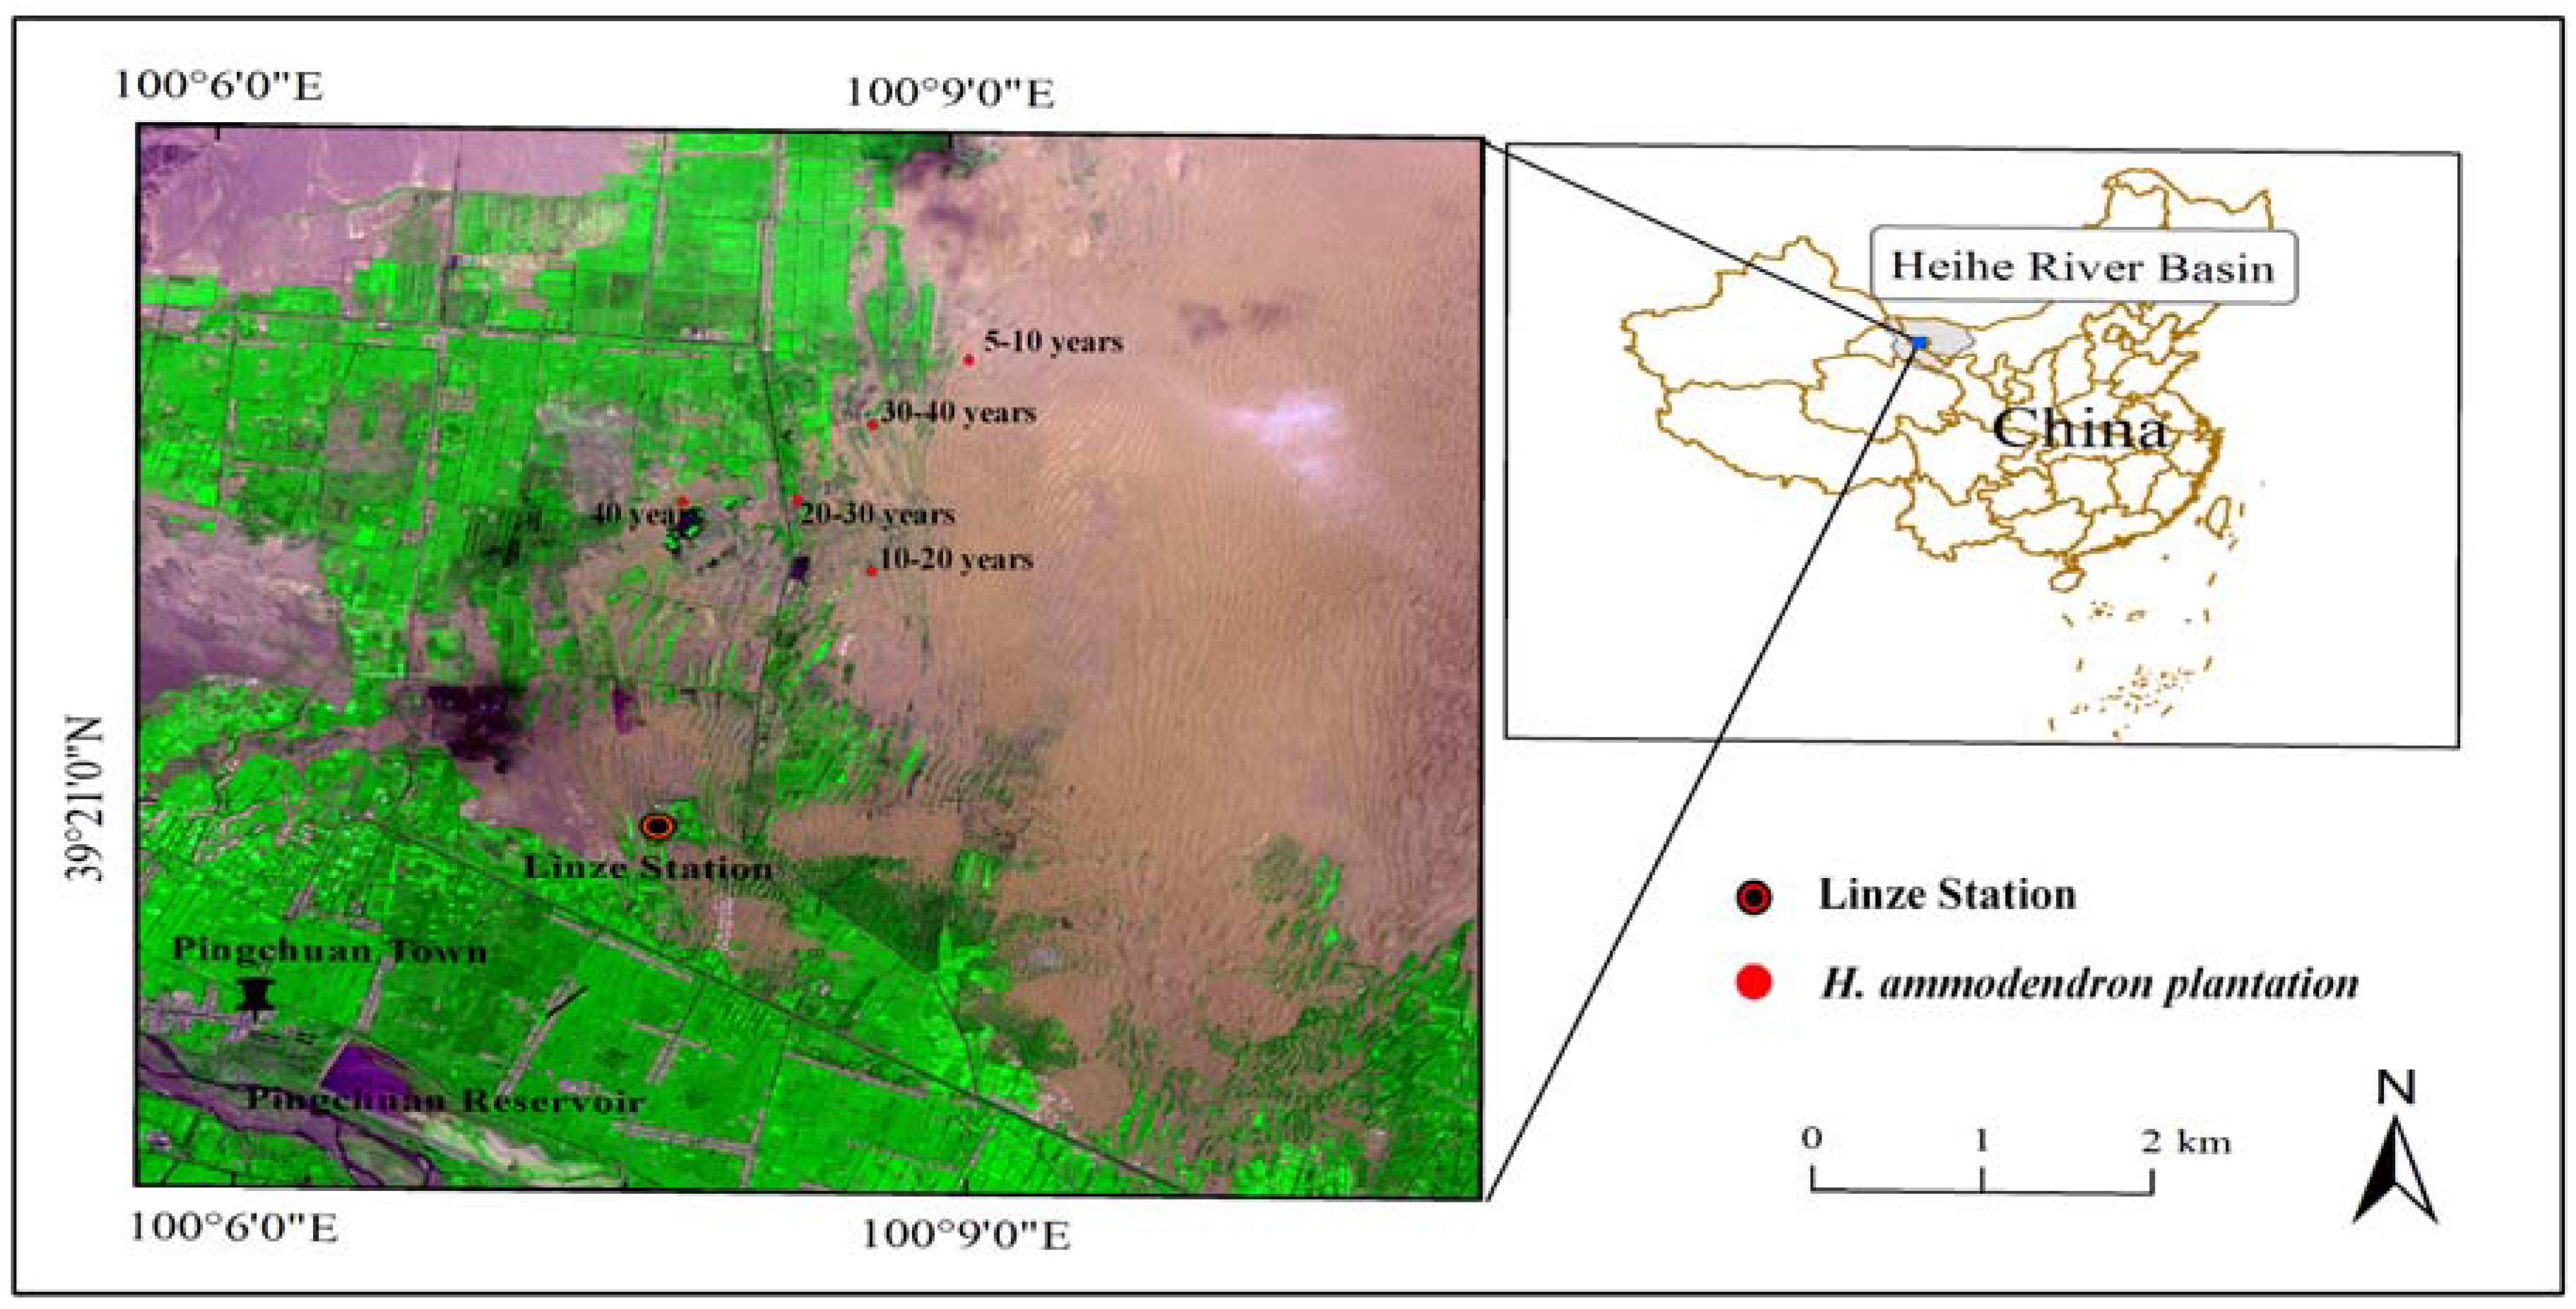
Figure 2.
Semi-variograms for the heights (a,e,i,m,q), crown width (b,f,j,n,r), diameter of the stem base (c,g,k,o,s) and deadwood proportion (d,h,l,p,t) of H. ammodendron in five stages of development.
Figure 2.
Semi-variograms for the heights (a,e,i,m,q), crown width (b,f,j,n,r), diameter of the stem base (c,g,k,o,s) and deadwood proportion (d,h,l,p,t) of H. ammodendron in five stages of development.

Figure 3.
Stem maps (a–e) and spatial patterns (f–j) of Haloxylon ammodendron in five stages of development.
Figure 3.
Stem maps (a–e) and spatial patterns (f–j) of Haloxylon ammodendron in five stages of development.
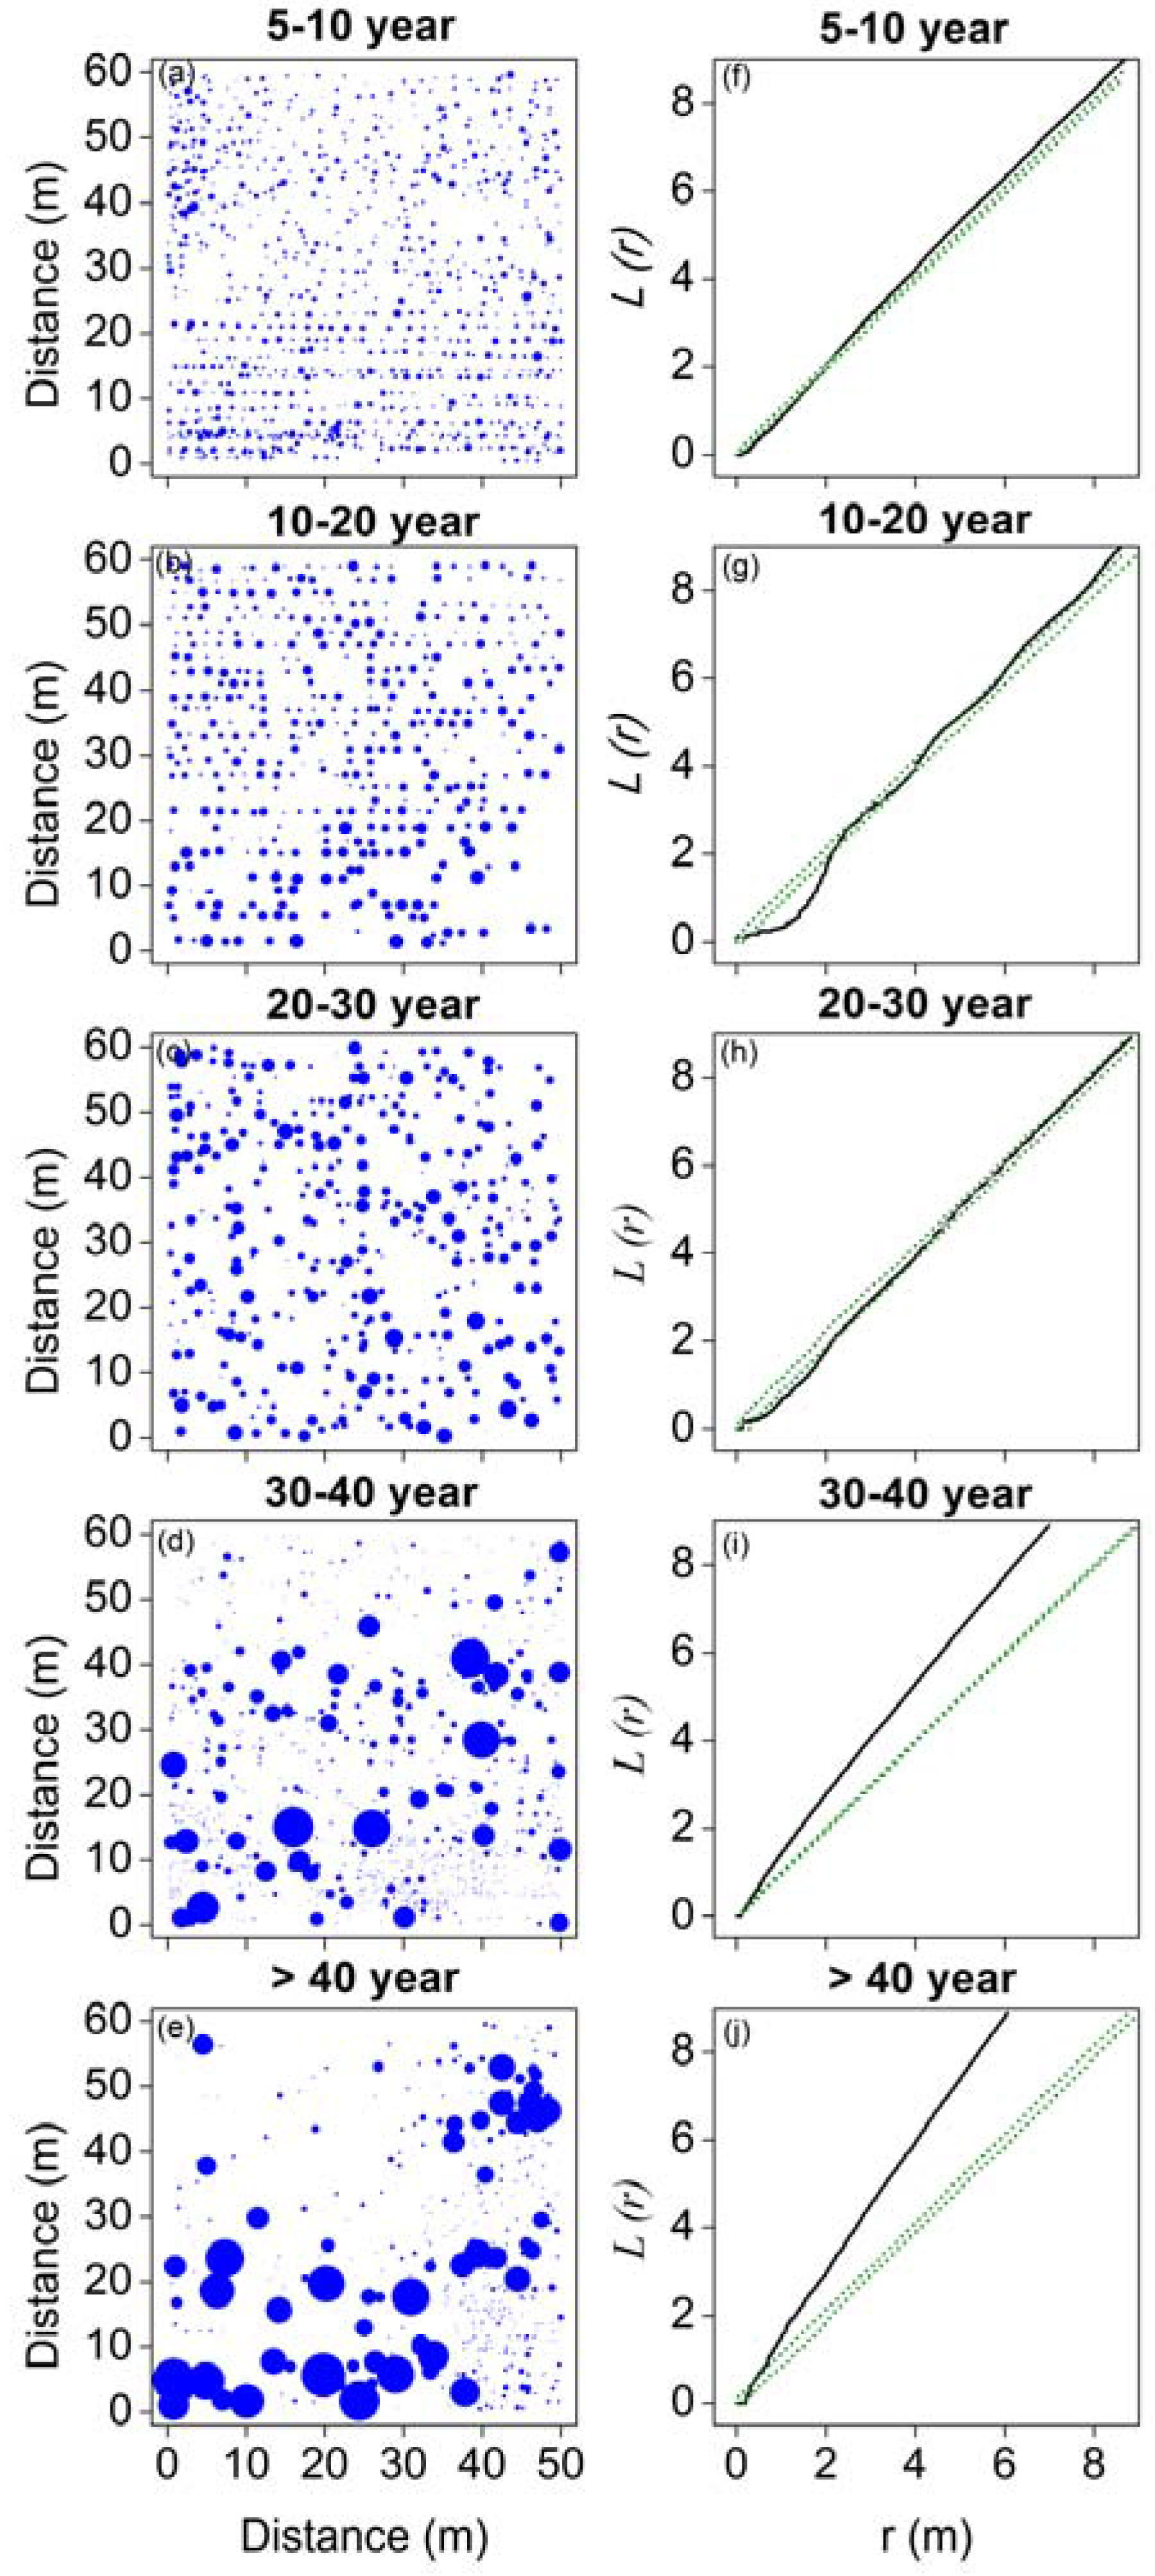
Figure 4.
Bivariate analyses using L12-function as the summary statistic to explore the association of Haloxylon ammodendron among different tree-size classes in five stages of development. (a) juvenile and mature trees in 10–20–year stage; (b) juvenile and mature trees in 20–30–year stage; (c) seedlings and juvenile trees in 30–40–year stage; (d) seedlings and mature trees in 30–40–year stage; (e) juvenile and mature trees in 30–40–year stage; (f) seedlings and juvenile trees in >40-year stage; (g) seedlings and mature trees in >40-year stage; (h) juvenile and mature trees in >40-year stage. Solid black lines represent the observed values of L12-function, green dotted lines indicate the upper and lower limits of the 95% Monte Carlo intervals of the null hypothesis of complete spatial randomness.

Table 1.
Summary of H. ammodendron characteristics in five stages of development (Values presented are means ± SD).
Table 1.
Summary of H. ammodendron characteristics in five stages of development (Values presented are means ± SD).
| Traits | Stages of Development | ||||||||||||||
|---|---|---|---|---|---|---|---|---|---|---|---|---|---|---|---|
| 5–10 Years | 10–20 Years | 20–30 Years | 30–40 Years | >40 Years | |||||||||||
| Seedling | Juvenile | Mature | Seedling | Juvenile | Mature | Seedling | Juvenile | Mature | Seedling | Juvenile | Mature | Seedling | Juvenile | Mature | |
| Frequency/(%) | 2.9 | 96 | 1 | 0 | 63.4 | 36.6 | 1.7 | 56.4 | 41.9 | 45.6 | 45.8 | 8.6 | 24.0 | 61.3 | 14.7 |
| Diameter of base stem/(cm) | 0.96 ± 0.15 | 3.06 ± 1.06 | 7.11 ± 0.42 | / | 3.82 ± 1.32 | 7.40 ± 1.03 | 0.95 ± 0.20 | 4.53 ± 1.46 | 8.91 ± 1.80 | 0.92 ± 0.18 | 2.56 ± 1.44 | 12.87 ± 6.11 | 0.98 ± 0.18 | 2.35 ± 1.16 | 17.69 ± 7.53 |
| Height/(cm) | 102.12 ± 24.79 | 193.14 ± 46.60 | 213.33 ± 78.10 | / | 220.11 ± 48.89 | 314.11 ± 57.41 | 121.67 ± 16.93 | 262.24 ± 77.47 | 355.26 ± 61.86 | 62.44 ± 21.22 | 136.2 ± 70.96 | 373.46 ± 97.14 | 74.55 ± 25.53 | 127.45 ± 57.62 | 372.94 ± 108.76 |
| Crown width/(m2) | 0.84 ± 0.57 | 3.15 ± 1.54 | 3.40 ± 1.94 | / | 4.66 ± 2.48 | 9.86 ± 4.80 | 1.35 ± 0.57 | 6.67 ± 4.18 | 12.54 ± 4.36 | 0.27 ± 0.23 | 2.29 ± 2.76 | 16.63 ± 7.49 | 0.45 ± 0.37 | 1.65 ± 2.07 | 14.95 ± 6.73 |
| Deadwood proportion/(%) | 5.96 ± 10.77 | 13.41 ± 23.39 | 10.00 ± 20.00 | / | 39.47 ± 27.93 | 43.08 ± 25.05 | 53.33 ± 36.15 | 58.30 ± 22.36 | 53.81 ± 21.34 | 15.21 ± 18.61 | 20.79 ± 22.21 | 38.96 ± 22.81 | 17.18 ± 20.07 | 19.88 ± 19.05 | 35.84 ± 17.42 |
| Density/individual/(m−2) | 0.009 | 0.284 | 0.003 | / | 0.091 | 0.053 | 0.002 | 0.068 | 0.050 | 0.128 | 0.128 | 0.024 | 0.034 | 0.086 | 0.021 |
Values represent means followed by standard deviation.
© 2017 by the authors. Licensee MDPI, Basel, Switzerland. This article is an open access article distributed under the terms and conditions of the Creative Commons Attribution (CC BY) license (http://creativecommons.org/licenses/by/4.0/).
Share and Cite
MDPI and ACS Style
Zheng, Y.; Zhao, W.; Zhang, G. Spatial Analysis of a Haloxylon Ammodendron Plantation in an Oasis-Desert Ecotone in the Hexi Corridor, Northwestern China. Forests 2017, 8, 200. https://doi.org/10.3390/f8060200
AMA Style
Zheng Y, Zhao W, Zhang G. Spatial Analysis of a Haloxylon Ammodendron Plantation in an Oasis-Desert Ecotone in the Hexi Corridor, Northwestern China. Forests. 2017; 8(6):200. https://doi.org/10.3390/f8060200
Chicago/Turabian StyleZheng, Ying, Wenzhi Zhao, and Gefei Zhang. 2017. "Spatial Analysis of a Haloxylon Ammodendron Plantation in an Oasis-Desert Ecotone in the Hexi Corridor, Northwestern China" Forests 8, no. 6: 200. https://doi.org/10.3390/f8060200
Note that from the first issue of 2016, this journal uses article numbers instead of page numbers. See further details here.