
Short Rotations in Forest Plantations Accelerate Virulence Evolution in Root-Rot Pathogenic Fungi


BIOGECO, INRA, Univ. Bordeaux, 33610 Cestas, France
*
Author to whom correspondence should be addressed.
Forests 2017, 8(6), 205; https://doi.org/10.3390/f8060205
Submission received: 7 April 2017
/
Revised: 6 June 2017
/
Accepted: 6 June 2017
/
Published: 10 June 2017
(This article belongs to the Special Issue Forest Pathology and Plant Health)
Abstract
:As disease outbreaks in forest plantations are causing concern worldwide, a clear understanding of the influence of silvicultural practices on the development of epidemics is still lacking. Importantly, silvicultural practices are likely to simultaneously affect epidemiological and evolutionary dynamics of pathogen populations. We propose a genetically explicit and individual-based model of virulence evolution in a root-rot pathogenic fungus spreading across forest landscapes, taking the Armillaria ostoyae–Pinus pinaster pathosystem as reference. We used the model to study the effects of rotation length on the evolution of virulence and the propagation of the fungus within a forest landscape composed of even-aged stands regularly altered by clear-cutting and thinning operations. The life cycle of the fungus modeled combines asexual and sexual reproduction modes, and also includes parasitic and saprotrophic phases. Moreover, the tree susceptibility to the pathogen is primarily determined by the age of the stand. Our simulations indicated that the shortest rotation length accelerated both the evolution of virulence and the development of the epidemics, whatever the genetic variability in the initial fungal population and the asexuality rate of the fungal species.
1. Introduction
While the demand for forest products is still increasing [1,2], high damage levels caused by pathogens in planted forests have emphasized the urgent need for management measures containing the development of epidemics [3,4,5]. The design and implementation of such measures require a clear understanding of the effects of common silvicultural operations on the expansion of pathogen populations in forest plantations. However, at present this understanding is far from being achieved. One key reason is that the evolutionary potential of pathogens has been widely neglected in forestry [6]. For a long time, the evolution of pathogens has indeed been assumed to be a much slower process than the development of the epidemics they cause [7]. However, there is now evidence that pathogens can rapidly evolve [8,9], particularly within ecosystems under strong human influence [10].
Among biological traits assumed to be under strong evolutionary pressure, the virulence of pathogens, generally defined as the quantitative ability of a pathogen to induce host mortality [11,12], is the focus of considerable attention from evolutionary ecologists [12] and plant pathologists [13]. Despite still imprecise experimental characterizations, mainly based on proxies, and a complex theory including the transmission–virulence trade-off hypothesis [14], the evolution at this trait is thought to be tightly related to the spread of diseases [11,15,16]. This evolutionary perspective, together with the large spatio-temporal scales considered in forestry and the often numerous uncertainties about the biology of the pathogens, make integrative experimental assessments of the effects of common forestry practices on fungal pathogen populations hardly feasible. Overall, available experimental observations about effects of silvicultural practices on the epidemiology of forest diseases remain scarce. As a consequence, when disease outbreaks are detected in forests, practitioners have very few elements at their disposal to confidently define and implement the most relevant management operations both preserving the productivity of the stands and containing the development of pathogen populations.
Within this context, modeling has much to contribute. Interestingly, a theoretical framework focused on the integration of the co-occurring epidemiological and evolutionary processes at short time-scales has been set (e.g., [17,18,19]). For instance, assuming a population made of a wild and a mutant genotype showing distinct virulence and transmission rates, Berngrüber set a mathematical model to explore the transient effects of mutation on virulence evolution in a bacteriophage virus during the onset of epidemics [11]. On the same basis and for the same kind of organism, Griette et al. showed that the level of virulence determines the speed of epidemics but also that virulence is favored at the front line of an epidemic and counter-selected behind the front [16]. Besides, other general models have investigated the evolutionary consequences of differences in life cycles. For instance Bazin et al. found that a reproduction system which combines a high rate of asexuality with a non-null sexuality rate increased the success of invasion [20]. Papaïx et al. explored the effect of dispersal and environmental heterogeneity on the specialization of organisms in a meta-population context [21]. Finally, other models were set to explore the effect of spatial heterogeneity associated with management practices on the evolutionary trajectories of both pathogens and their hosts in agrosystems of annual plants. These latter models were mostly used to investigate the durability of resistance genes deployed in crops from a qualitative definition of the host–pathogen interaction relying on gene-for-gene interactions. As examples Fabre et al. identified the optimal strategies of resistance gene deployments within agrosystems infected by plant viruses [22], and Bourget et al. investigated the adaptive dynamics of pathogen populations facing a multicomponent treatment [23].
All of these theoretical studies have yielded useful information about key determinants of the evolutionary and epidemiological dynamics of pathogenic organisms, sometimes in intensively exploited ecosystems. By their diversity, they also underlined the fact that these determinants are tightly related to the biological characteristics of the pathogen, and the specificities of the ecosystem of interest. Nevertheless, all of the previous modeling studies simultaneously investigating the evolutionary and epidemiological dynamics remain very general. Moreover, the strong assumptions made on pathogen life-history are more often not relevant to tree pathogens emerging in a forest plantation. Besides, in a general way, directly transposing existing models, theory and results into different ecosystems that often constitute distinct complex systems remains a challenge [24,25,26]. Hence, there is a need for new simple models clearly focused on pathogens spreading in a forest plantation and using existing theory in evolutionary epidemiology to address practical questions. To be helpful these new models have to account explicitly for the following aspects: (1) the key biological characteristics of the targeted fungal pathogen such as its reproduction system; (2) the specificities of forest management like the times of thinning and clear cutting; (3) the biological specificities of the planted trees such as their long lifespan; and (4) an adequate definition of the tree–pathogen interaction.
We propose here a stochastic individual-based simulation model dedicated to the study of the interplay between common forestry practices and the evolution and the propagation of a root-rot pathogenic fungus in planted forests. Individual-based modeling is a bottom-up approach that relies on algorithmic descriptions of each individual constituting the system of interest. It provides highly customizable and integrative abstractions of complex systems, making it an ideal tool to address practical questions involving many entities interacting at different levels [27,28,29]. Though this kind of modeling has been fruitfully developed in evolutionary ecology (e.g., [30,31,32,33,34,35,36,37]), it remains almost absent from the fields of phytopathology and evolutionary epidemiology (however, see [21]). Unlike most of the existing models in phytopathology, our model describes host–pathogen interactions in a quantitative way, through the exploitation of the quantitative genetics theory. Hence, the model formalizes quantitatively the phenotype of the fungus, the underlying genetic architecture of the targeted trait (here the virulence), and the effects of the main processes driving the evolutionary change: mutation, recombination, dispersal or selection. The environmental conditions affecting the evolution of the trait and the expansion of the fungus are also expressed quantitatively. They essentially consist of the susceptibility of the host trees, which is determined by the management of forest plantations. Although meant to be generic, our model was built and parameterized with the Armillaria ostoyae– Pinus pinaster pathosystem in mind. A. ostoyae is one of the main root-rot pine pathogens of the northern hemisphere [38,39]. The model meets the four aforementioned conditions and particularly considers the following elements. First, because the life cycle of an organism determines its evolutionary responses to changing environmental conditions, and thus its invasive potential [9,20,40,41], the life cycle of A. ostoyae is explicitly described. In particular, following the Armillaria model, the simulated life cycle includes sexual mating, vegetative growth and saprotrophic phases, i.e., the ability to survive in dead pine material like stump or wood [38,42,43]. Second, the host–pathogen interaction is formalized quantitatively and depends not only on the virulence of the fungus but also on the susceptibility of the tree to the fungus. Here, the tree susceptibility was assumed to be determined only by the age of the tree; young pines are known to be very sensitive to A. ostoyae, whereas adults are more resistant [44,45]. Third, the spatio-temporal heterogeneity in environmental conditions induced by management practices [22,23] is explicitly accounted for to investigate their consequences on the evolutionary and epidemiological dynamics. Clear-cutting and thinning operations constitute a central part of our model because they simultaneously act on the spatio-temporal distributions of the resistance levels through age effect, and on the number of healthy trees in each stand.
Considering a forest made of even-aged stands in which susceptibility only depends on age class, we specifically addressed the following question: how are the evolution of virulence and the expansion of the fungal population affected by changes in rotation length? We simulated multiple scenarios, each one being characterized by rotation length, asexuality rate and level of standing genetic variability in the source fungal population. Because asexuality rate [20] and standing genetic variability [46] are known to determine the adaptive and invading potential of species [47], we anticipated that depending on the values assigned to these two parameters, the effects of rotation length would result in contrasting evolutionary and epidemiological dynamics. We further discuss our results on the basis of related theory, and, finally, we make suggestions for further investigations.
2. Materials and Methods
Our model consists of a stochastic simulation program we wrote in Python from the standard [48] and Numpy [49] libraries. We also used Matplotlib [50] library to create the figures.
2.1. Fungal Pathogen
The model is based on the biology of A. ostoyae, which causes important mortality in maritime pine (Pinus pinaster) planted forests [45,51,52]. This diploid fungus combines sexual and asexual reproduction phases. It can infect pines either through mycelial growth from the root of an infected tree to the root of another healthy tree [52], or through mycelium resulting from the fusion of two basidiospores regularly released by its fruiting bodies [53]. The combination of these two modes of infection produces disease foci that correspond to large clonal patches [54], which are genetically differentiated [53]. Moreover, A. ostoyae can survive for years on dead wood material as a saprotroph. During this saprotrophic phase, A. ostoyae still sporulates and grows clonally [38,42,43,55].
We call individual a fungal genotype which successfully infects and kills one tree. Hence, in this paper, the term individual refers both to a genotype and its location in the forest. It is important to note that a single genotype can infect multiple trees through root contact in a stand (see below), which generates multiple individuals carrying the same genotype. Taking into consideration the clonal structures characterized in maritime pine plantations [53] and in natural forests [56] infected by A. ostoyae, we only allow single infections to occur in our simulations, i.e., a tree can be only infected by one individual. Each individual was characterized by its virulence defined here as the quantitative ability of a genotype to infect a tree, with all fungal infections resulting in tree mortality. Considering a diploid fungal species, we modeled virulence as a fully heritable quantitative trait Z determined additively by 10 loci without dominance nor epistasis:
where represent the allelic effects of the two alleles associated with locus l, and is an environmental variation following the uniform distribution . In the following, the term genetic value (G) refers to the additive contribution of the alleles at the 10 loci involved in the variability of the trait Z, such as .
Each simulation starts with n genetically distinct fungal individuals in a single stand. In the present study, the genetic composition of the starting fungal population was drawn randomly from sets of 200 alleles per locus, the allelic effects following a normal distribution with set here to 0.5. We assumed that the fungal pathogen population undergoes a number of annual evolutionary cycles. The evolutionary cycles are non-overlapping which means that all individuals simultaneously undergo all the events constituting a cycle. However, unlike most of the studies based on individual-based models in evolutionary ecology (e.g., [20,36]), the generations overlap, i.e., “parents” are not removed from the fungal population after having produced offspring through asexual growth or sexual reproduction. During one evolutionary cycle, two types of propagules are generated by each fungal individual. Clonal propagules, also called “clones”, are the result of asexual growth. As a consequence of clonal growth several trees can be infected by the same genotype in a stand. On the other hand, efficient sexual spores that truly deposite and germinate in stands contribute to generating, after mating, sexual propagules, i.e., “zygotes”. Following [20], the quantity of clonal propagules and sexual spores produced by each fungal individual is constant and determined a priori from a fecundity f and an asexuality rate c varying between 0 and 1. Hence, at each evolutionary cycle, each fungal individual produces clonal propagules and efficient sexual spores that will contribute to generate a total of sexual propagules after dispersal, germination and mating, being rounded to the nearest lower integer when it is an odd number. In the present study, the simulated fungal species had a constant fecundity of 5 as in [20], and was diploid ().
Each evolutionary cycle (Figure 1) starts with gametogenesis during which the fungal individuals produce haploid sexual spores through meiosis and recombination. Assuming that the loci are located on separated chromosomes, recombination occurs at a rate of 0.5 per locus. Then, dispersal of sexual spores occurs at the same time than clonal growth, simultaneously in all stands. In what follows we may use the term asexual reproduction to refer to clonal growth. While the sexual spores emitted by the individuals of a stand can reach the neighboring stands according to the stepping-stone dispersal model [57], the clones produced remain local, i.e., in the same stand. We set the proportion of the efficient sexual spores produced in a stand that germinate in neighboring stands at 5%, the remaining 95% germinating in the original stand. Finally, the dispersal step ends with the generation in each stand of the sexual propagules through the random fusion of pairs of the efficient spores that is deposited in the stands. Then, density regulation operates to determine which propagules (sexual or clonal) are kept in the stands and will attempt to infect healthy trees, when the fungal carrying capacity of a stand is exceeded, namely when the number of healthy trees is lower than the number of propagules. This step of density regulation simply consists in a random draw of individuals independent from their virulence level. At the end of the density regulation step, any propagule that cannot attempt an infection is automatically removed from the stand.
During the next step of selection, the propagules remaining after density regulation experience directional selection [58] towards a phenotypic optimum . Here the fitness value [59] assigned to each propagule weights the probability of infection success (see below) which further determines the survival and the ability to reproduce. For a trait Z, a fitness value W is computed from:
for Z values comprised in , otherwise the maximal fitness value of 1 is systematically assigned to the trait values exceeding the value. According to preliminary sensitivity analysis, we specified here uniformly in all stands a strong selection pressure through a value of 20 and a phenotypic optimum of 10, a value much greater than the mean trait value of the initial fungal populations close to 0 (see [20,32,35]). The resistance R of a stand is included in , and , where S is the mean susceptibility of the stand to the pathogen. The outcome of each infection attempt (success or failure) by a propagule i in a stand x is drawn from a binomial law weighted by a probability of success . When a propagule successfully infects a tree, a new individual is created, otherwise the propagule is removed from the stand. Here, for the sake of simplicity, each successful infection leads unavoidably to host death. This simplification is consistent with earlier results indicating an important vulnerability of maritime pine to A. ostoyae [44]. At the mutation step, the genotype of each individual mutates at a rate of per locus as in [20] according to the K-allele model [60]: when a mutation occurs, a new allele is drawn randomly among the 200 possible alleles. Given the high variance of allelic effects (), mutation is likely to generate substantial genetic variability during simulations. Due to the saprotrophism ability of the fungal pathogen [45], when an infected tree is cut (see next sub-paragraph), the fungal individual established in this tree can persist on dead substrate in the stand with a probability s, where s designates the saprotrophic ability. The saprotrophs remaining in stumps of cut trees continue to disperse both asexually and sexually until their age reaches the maximal age , and thus contribute to the production of propagules each year. Finally, a natural regulation of individuals according to their age occurs, those of age greater than are removed from the landscape. Based on [61], we set a life time of each fungal individual to 20 years. At the forest scale, this value allows clonal structures composed of several individuals at the parasitic or saprotrophic stage to persist during the whole simulation process, which is in agreement with the very long life-span of Armillaria organisms (e.g., [56]). Figure 1 summarizes the modeled evolutionary cycle and the different possible living states of the pathogenic fungus.
2.2. Forest Plantation and Silvicultural Operations
The modeled forest landscape was composed of 49 even-aged stands arranged according to a square. We considered three age classes in the tree population: young, adult and mature, associated with distinct carrying capacities, and contrasted levels of susceptibility to the fungal pathogen. Using a year as unit of time, the three age classes were arbitrarily delimited by years 15 and 32. Thereby, trees younger than 15 years were considered as young, trees between 15 and 32 years were considered as adult, and trees older than 32 years were viewed as mature. The carrying capacities associated with each age-class were 1000, 500 and 300 for young, adult and mature stands, respectively. The corresponding resistance values were arbitrarily set at 0.3, 0.8, 0.6 following earlier observations reporting that juvenile trees are particularly sensitive to fungal pathogens [44,45].
The starting point of each simulation is a randomly generated planted forest landscape with a third of stands of each age class, the maximum age being 55. During simulations, year after year, trees get older, and stands are managed through clear-cutting and thinning operations. Thinning operations occur at each age–class transition, and mainly consist in cutting the required number of trees to match the carrying capacity of the next age class. This process can however be affected by infections. Because only lethal infections are explicitly modeled here, a tree has two states: (1) “healthy” when the tree is not infected or has efficiently contained previous infection attempt(s) sufficiently early; or (2) “infected/killed” when the tree is subject to an ongoing lethal infection. Thus, we assume that symptoms of lethal infections are always visible and the forest managers make sanitary thinning; they systematically choose to cut all the infected trees during thinning. We also assume that the forest managers can decide anticipated clear-cutting operations (i.e., end of rotation) if the number of remaining trees resulting from thinning is lower than a threshold . In the default case, the number of trees cut during a thinning operation is where K and refer to the fungal carrying capacities in the lower and upper age class at each age transition, respectively. This relation holds as long as the number of infected trees is lower than . Otherwise the number of trees to be cut equals either as long as (i.e., the number of remaining trees is greater than the threshold ) or K (anticipated clear-cut) when . Taking as example a stand at the juvenile–adult transition, the forest managers should cut 500 trees in the general case. If fewer than 500 trees show symptoms of disease, the forest managers will cut 500 trees including all the infected trees. However, if more than 500 trees have been infected, for example 850, the forest managers will cut all the 850 infected trees. If the minimal threshold of remaining trees is 200 in an adult stand, an anticipated clear-cutting operation is triggered. In the normal case, clear-cutting is realized at regular intervals corresponding to the rotation length, all trees of a stand are cut, and new juvenile trees of age 0 are replanted immediately. In our simulations, , the minimal number of trees triggering an anticipated clear-cutting operation in place of a simple thinning, was set at 150. Depending on the scenario, different rotation lengths were considered.
2.3. Simulated Scenarios
By considering two initial fungal populations, combined with two asexuality rates and three distinct rotation lengths of 15, 30 and 50 years, we simulated a total of 12 scenarios, and ran 50 independent stochastic replicates for each scenario.
The starting point of each simulation was a small fungal population of individuals emerging in a single stand located near the western edge of the landscape (Figure 2). Both the initial fungal population and the forest plantation landscape were generated randomly. However, because the initial genetic composition drastically influences the evolutionary potential in populations of such limited size, the starting fungal population was randomly generated once for each level of genetic variance considered, and thus was identical among the replicates. This ensured a reasonable stochastic variability among replicates. In the default scenario, the starting fungal population was characterized by an initial mean genetic value of 0.77, and an elevated initial standing genetic variance of 4.06 that, combined with the elevated variance of mutational effect (), guarantees substantial adaptive and invasive potentials of the fungal population [46,47]. We also simulated additional scenarios starting from another initial fungal population showing a mean initial genetic value of 0.33 but a much lower initial genetic variance of 1.63. Several independent random generations of the population were realized to obtain two starting fungal populations showing similar values close to 0. This mean initial genetic value defined an initial important maladaptation level [35] in both cases: the distance between the phenotypic optimum () and the mean initial genetic value was important but of the same magnitude. Two values of the asexuality rate c were compared, 0.2 and 0.8, to investigate the effects of two contrasted dispersal and reproduction strategies, either mainly sexual or mainly clonal. In the following, fp1 refers to the mostly asexual reproductive strategy () and fp2 refers to the mostly sexual reproductive strategy (). Following the Armillaria model, we assumed that the two fungal profiles had a high saprotrophic ability s [38,42,45,55], set here to 0.9. The initial planted forest landscape (i.e., the geographical distribution of age classes in the 49 stands) was randomly generated before each run in order to eliminate the influence of the initial spatial distribution of the mean stand ages. The initial proportion of young, adult and mature stands remained however always fixed to (1/3, 1/3, 1/3). Table 1 and Table 2 summarize all the variable and fixed parameters simulated.
3. Results
3.1. Observed Epidemiological and Evolutionary Dynamics
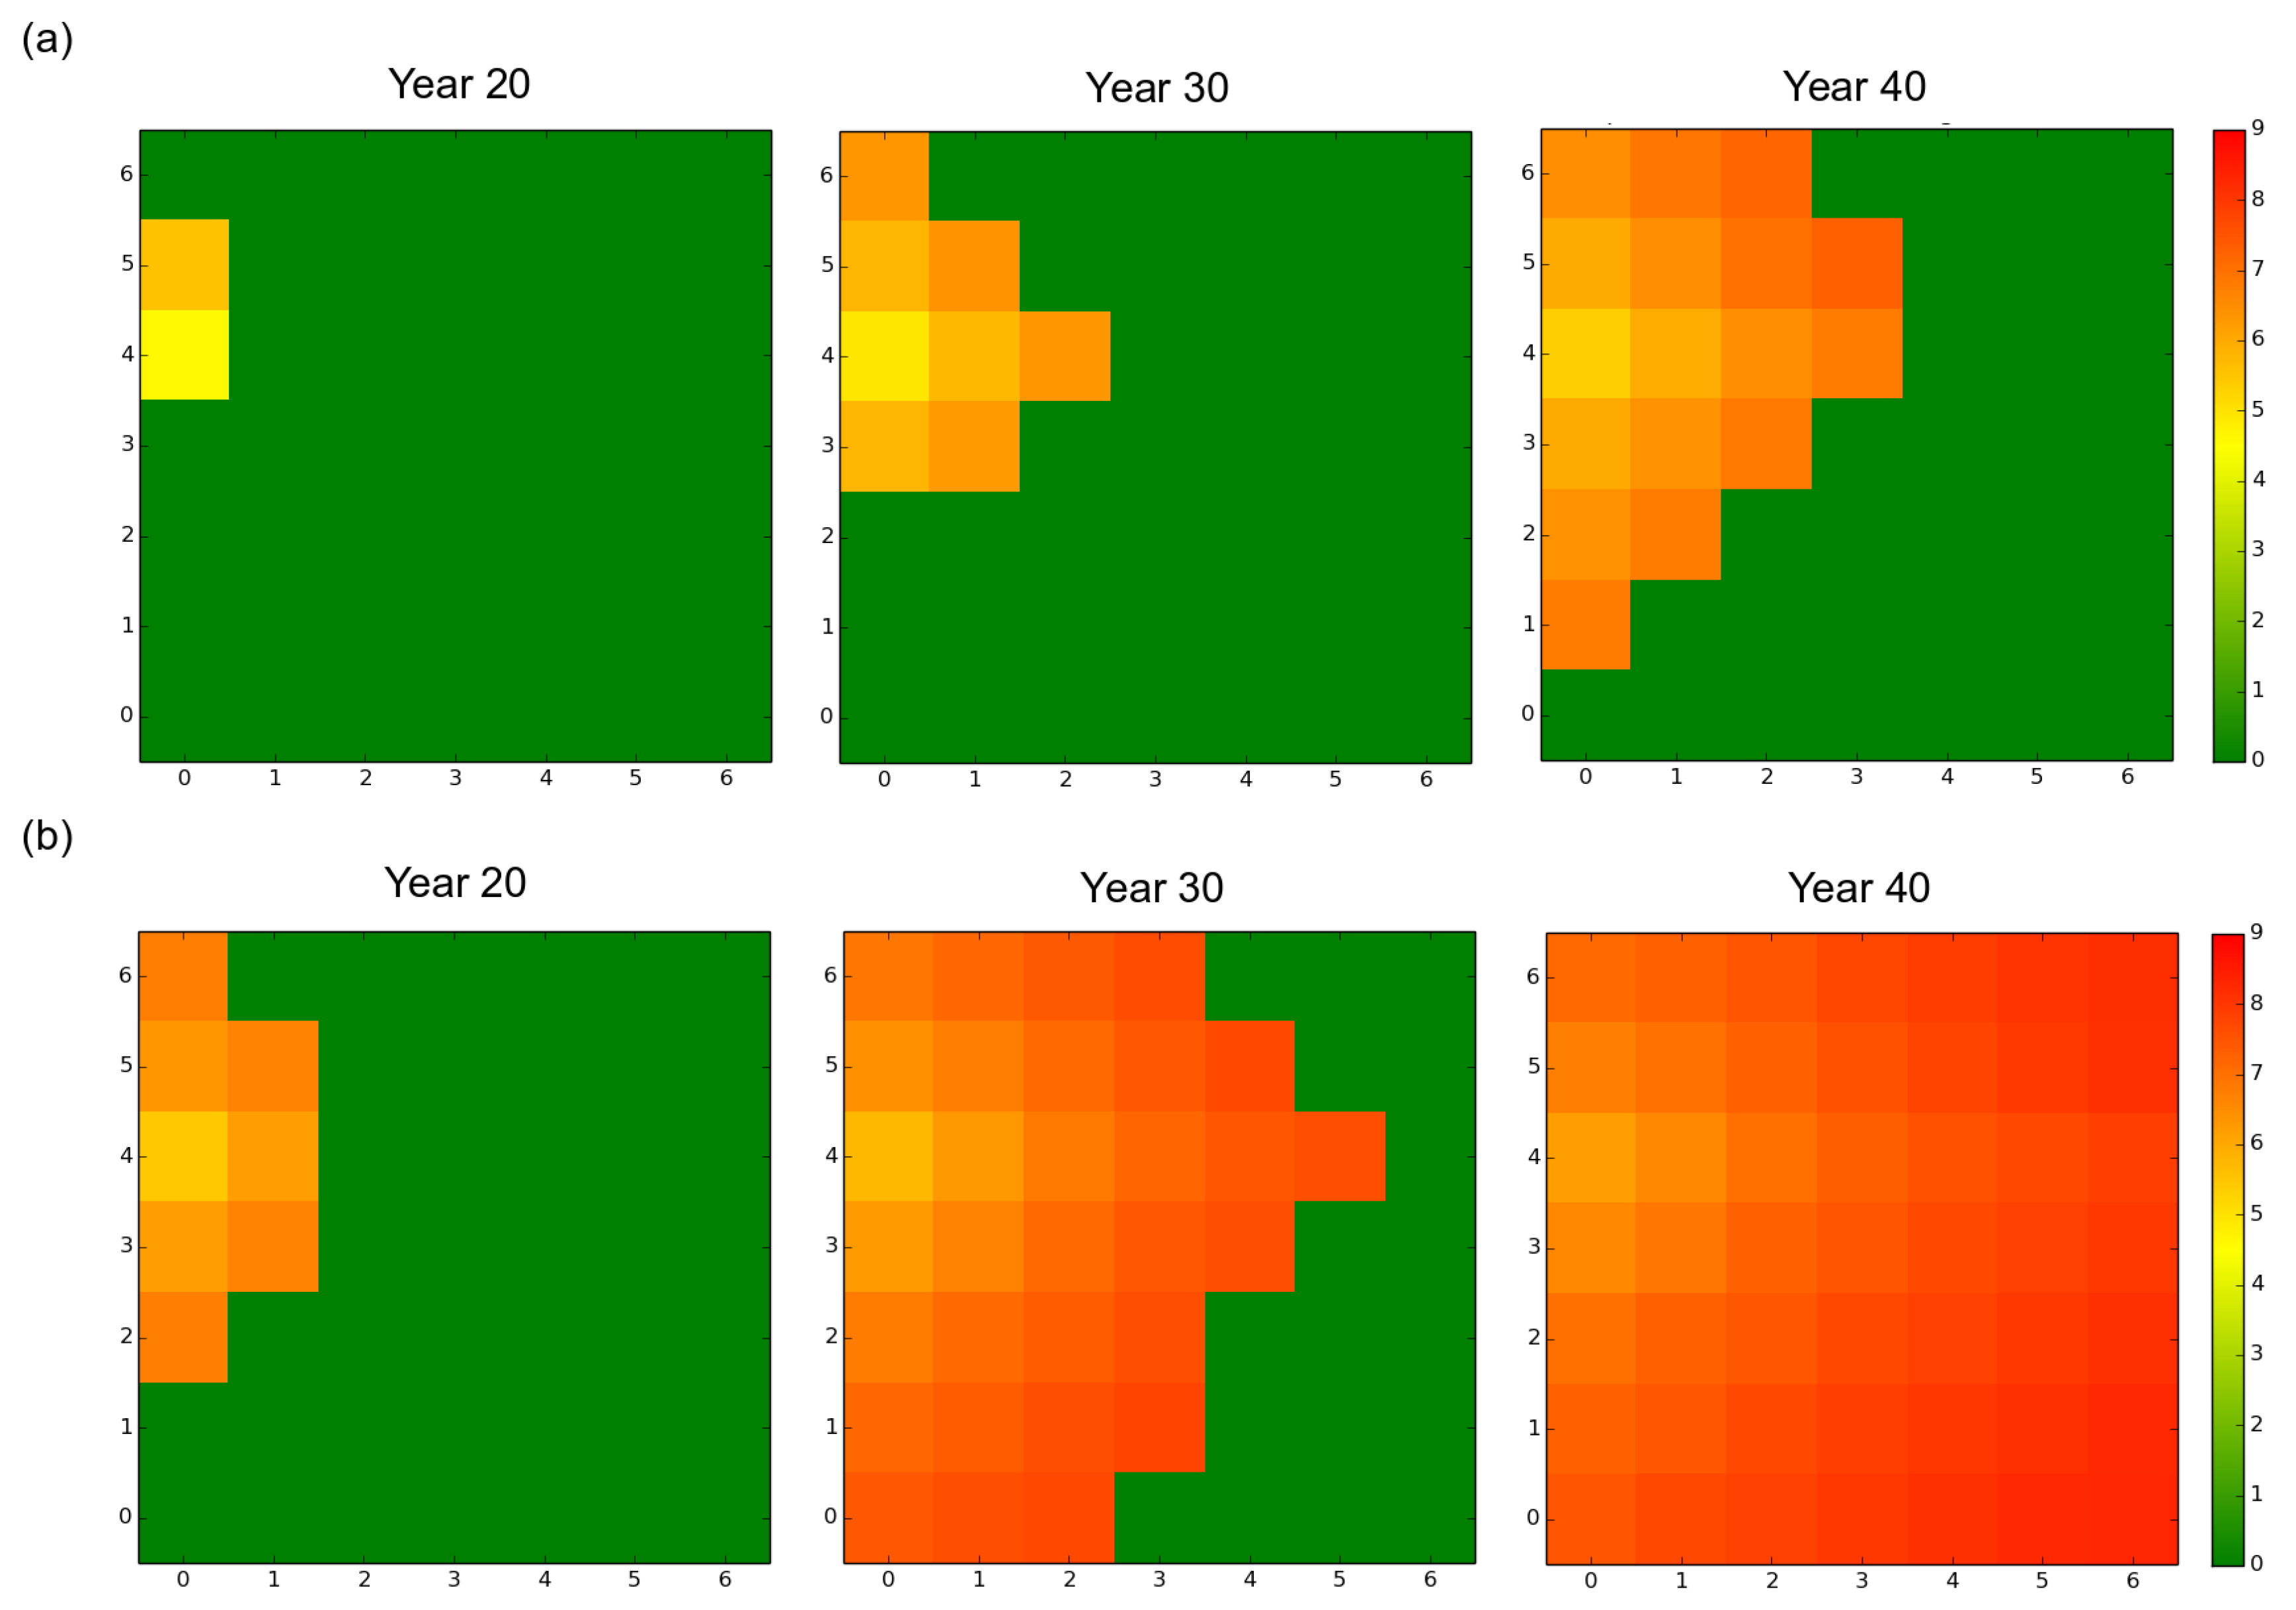
Initially present in a single stand located near the western edge of the landscape, the fungal population progressively expanded and finally reached all the stands without regressing, whatever the initial settings (Figure 2 and Figure 3). The monitoring of the number of infected trees and stands indicated that the expansion of the pathogen population was very slow during about the first ten years and was limited to the original stand. Once the pathogen reached another stand, the progression of the epidemics became exponential (Figure 3 and Figure S1). The velocity of the propagation depended on the rate of asexuality of the fungal species and the initial standing genetic variation; the lower the asexuality rate and the higher the initial genetic variation, the faster the spread of the epidemics, both at the landscape scale (Figure 2 and Figure 3) and at the stand scale (data not shown). For example, under a rotation regime of 30 years, fp2 needed 5 years to reach a first neighboring stand and 64 years to infect durably all the stands. By contrast fp1 established in a first neighboring stand after 8 years and needed 85 years to infect all the stands.
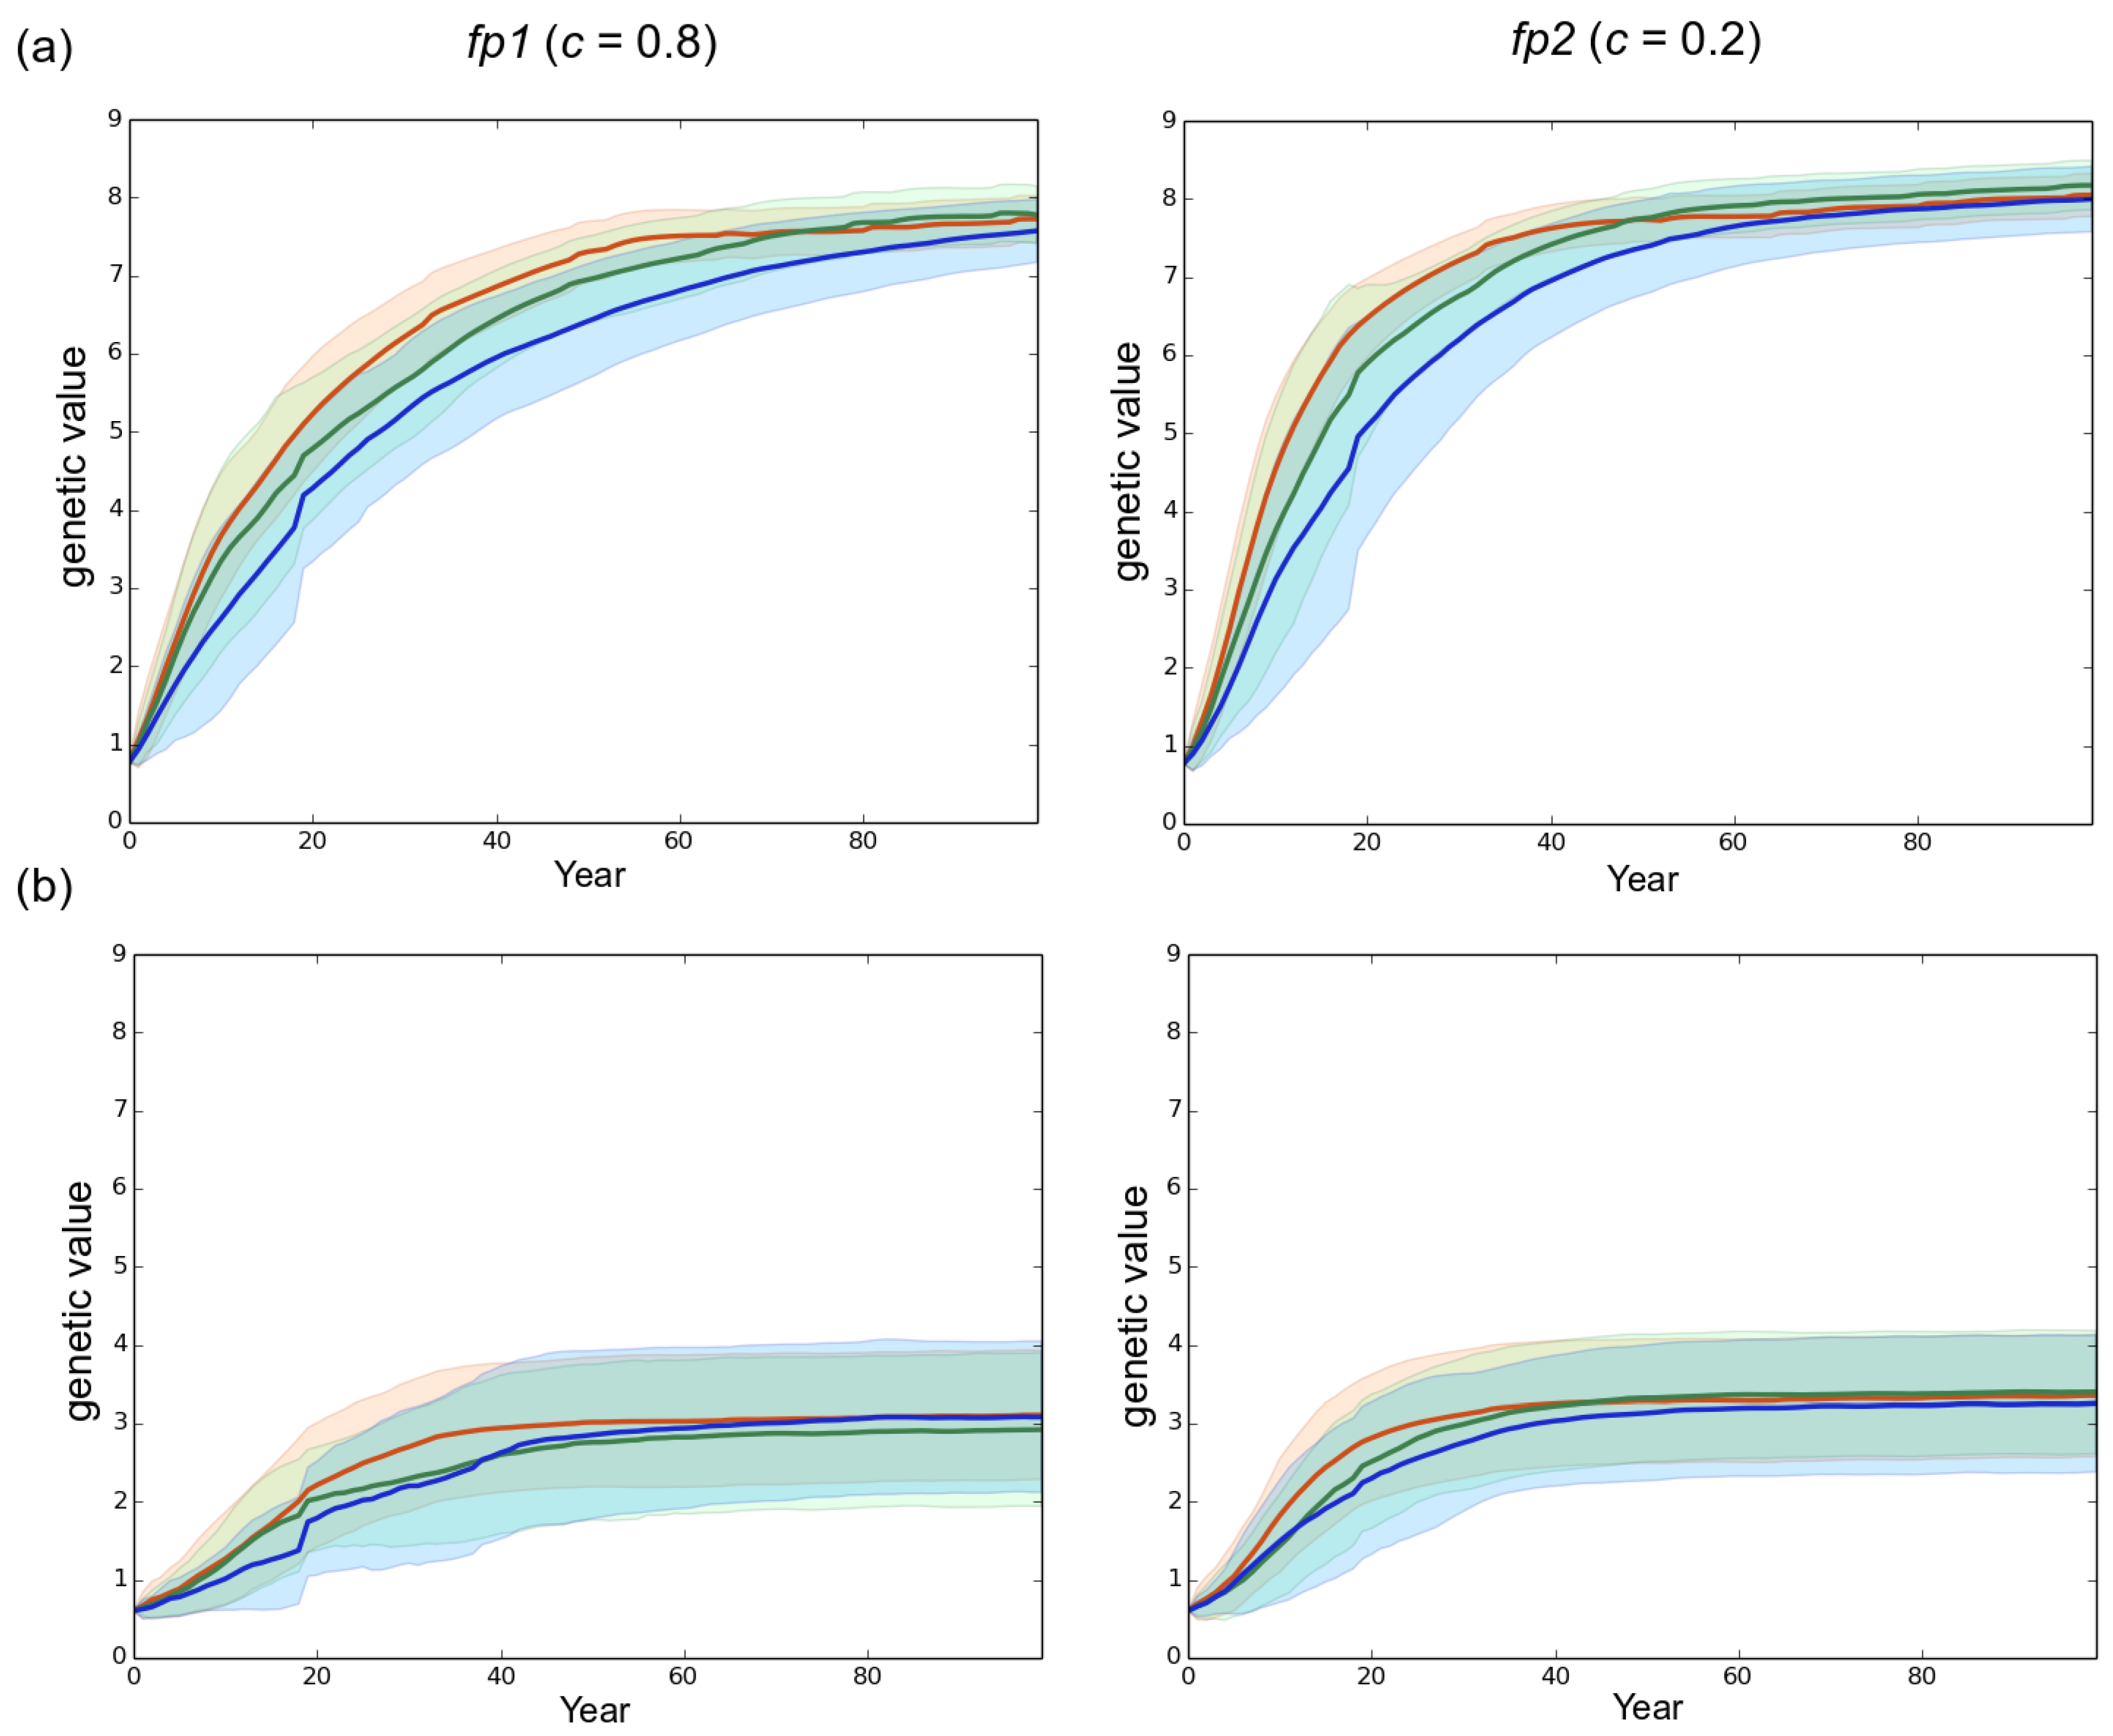
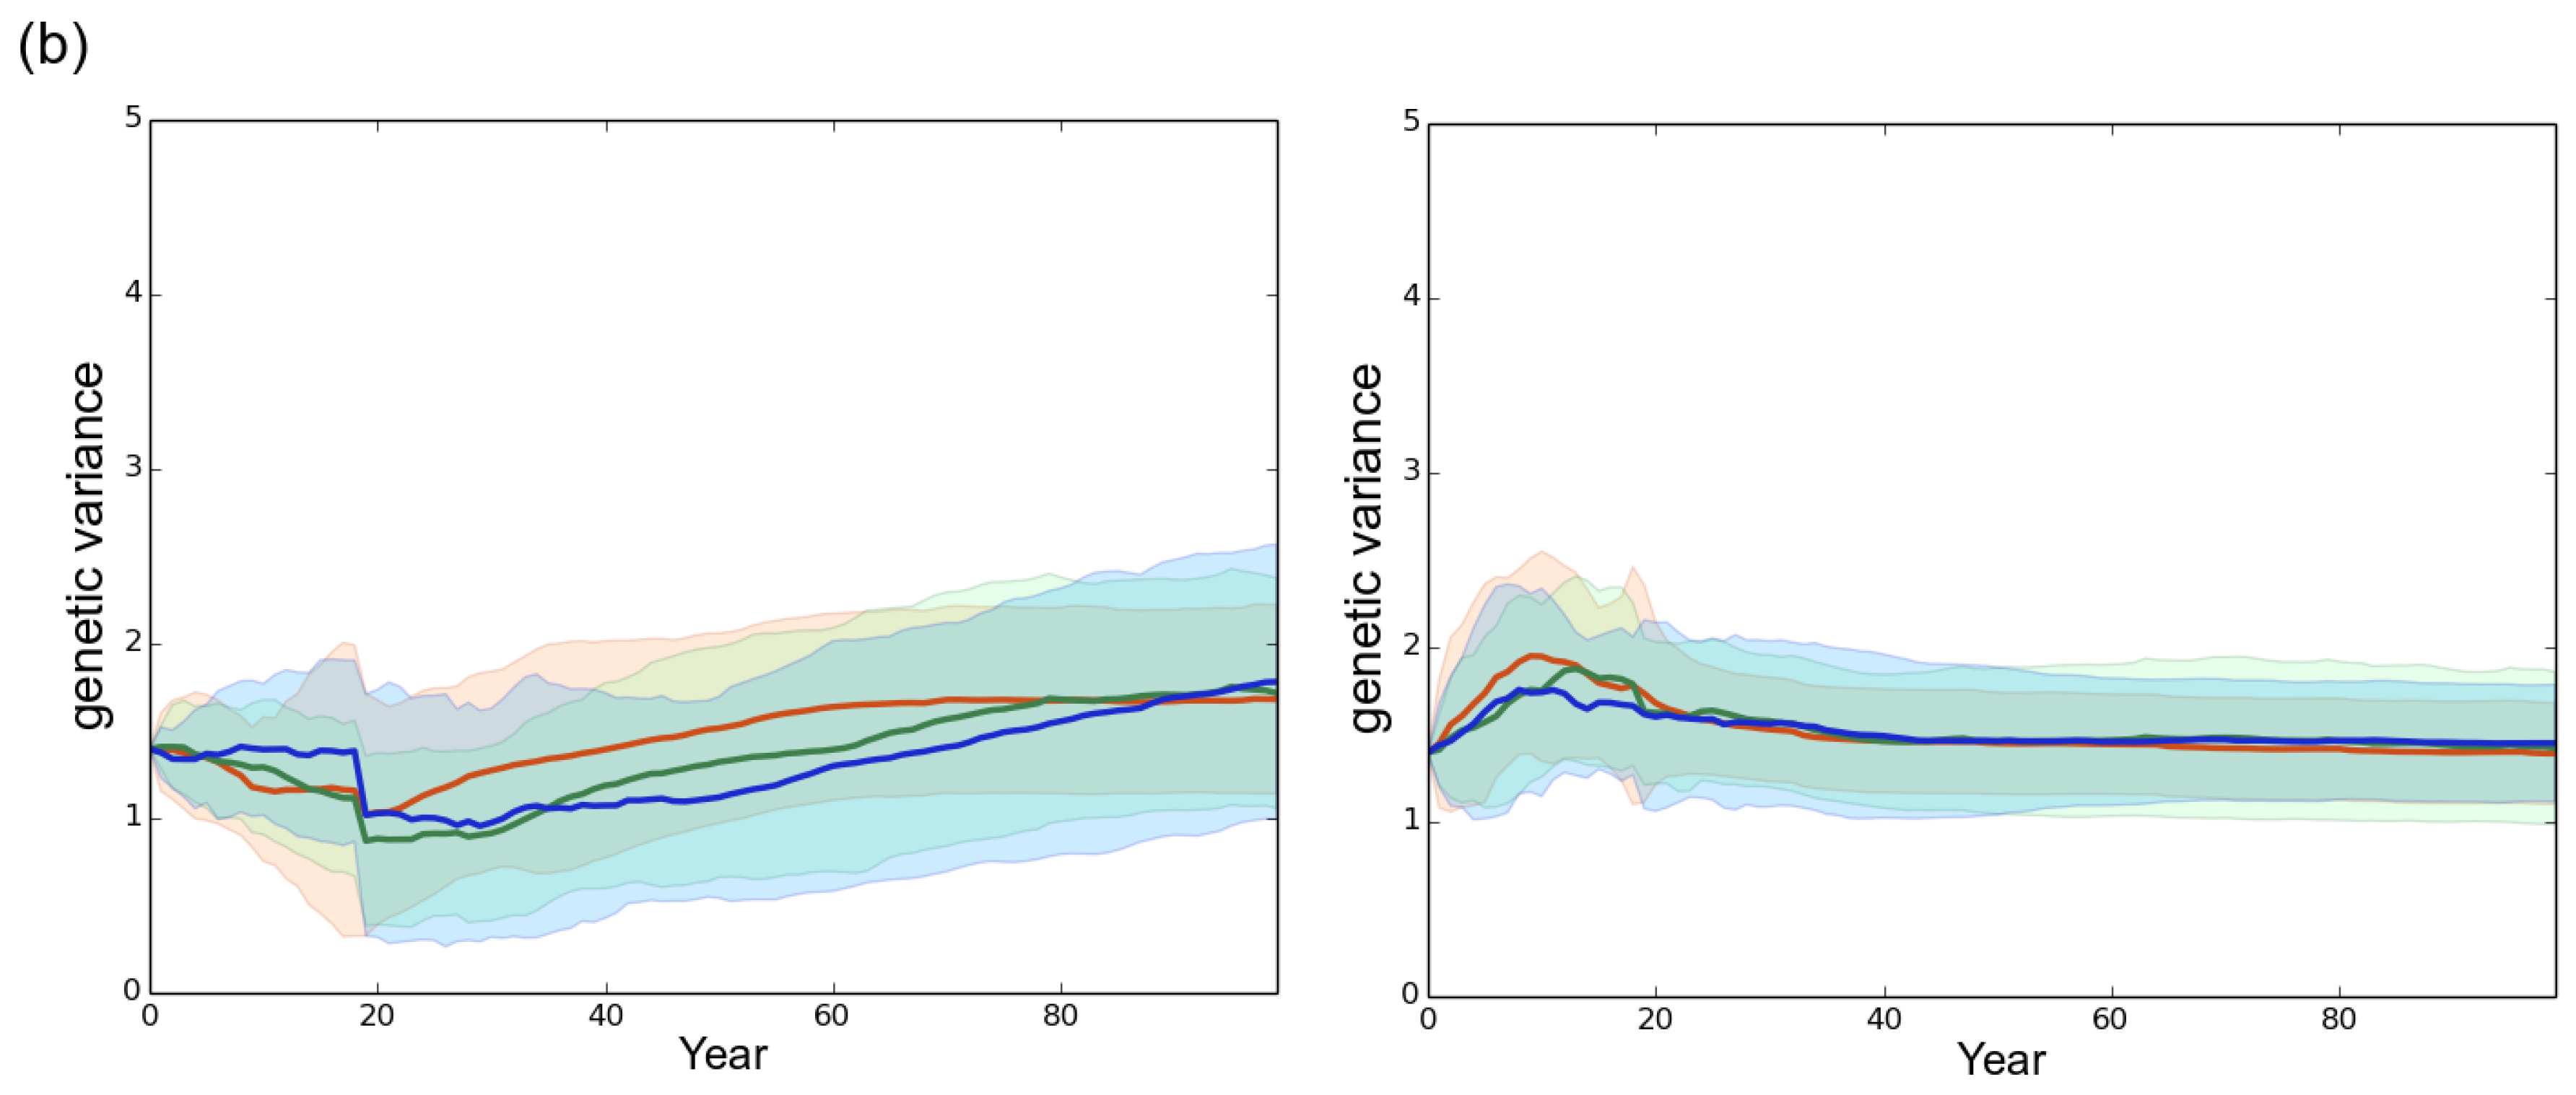
In all scenarios, the mean level of virulence Z followed a logistic growth but never reached the optimal phenotypic value (). The faster and larger evolutionary change was observed under the mostly sexual reproduction system (fp2) and when the initial standing genetic variation was large (). In this case, at year 100 the maximal level of virulence was 8.2 whereas it was only 7.7 for fp1 in our simulations (Figure 4). Hence, in our simulations, the velocity of the expansion of the fungal population was related to the evolution of virulence. The large initial genetic variance set in the default scenario rapidly decreased under the joint action of selection and genetic drift during the first 20 years despite the elevated probability of mutation set in the model (). Overall, a high sexuality rate (fp2) systematically: (1) maintained a higher level of genetic variance than a low sexuality rate (fp1) in a first phase of about 40 years; and (2) resulted in the lowest level of genetic variance at year 100 (Figure 5). It is worth noting that when was low (1.63 vs. 4.06), the level of genetic variance observed at year 100 slightly exceeded the initial level , particularly in the case of the mostly asexual species fp1 (Figure 5). Finally, a slight spatial gradient of the virulence level progressively appeared following the direction of the fungal population expansion (Figure 2).
3.2. Effect of the Rotation Length on Pathogen Propagation and Virulence Evolution
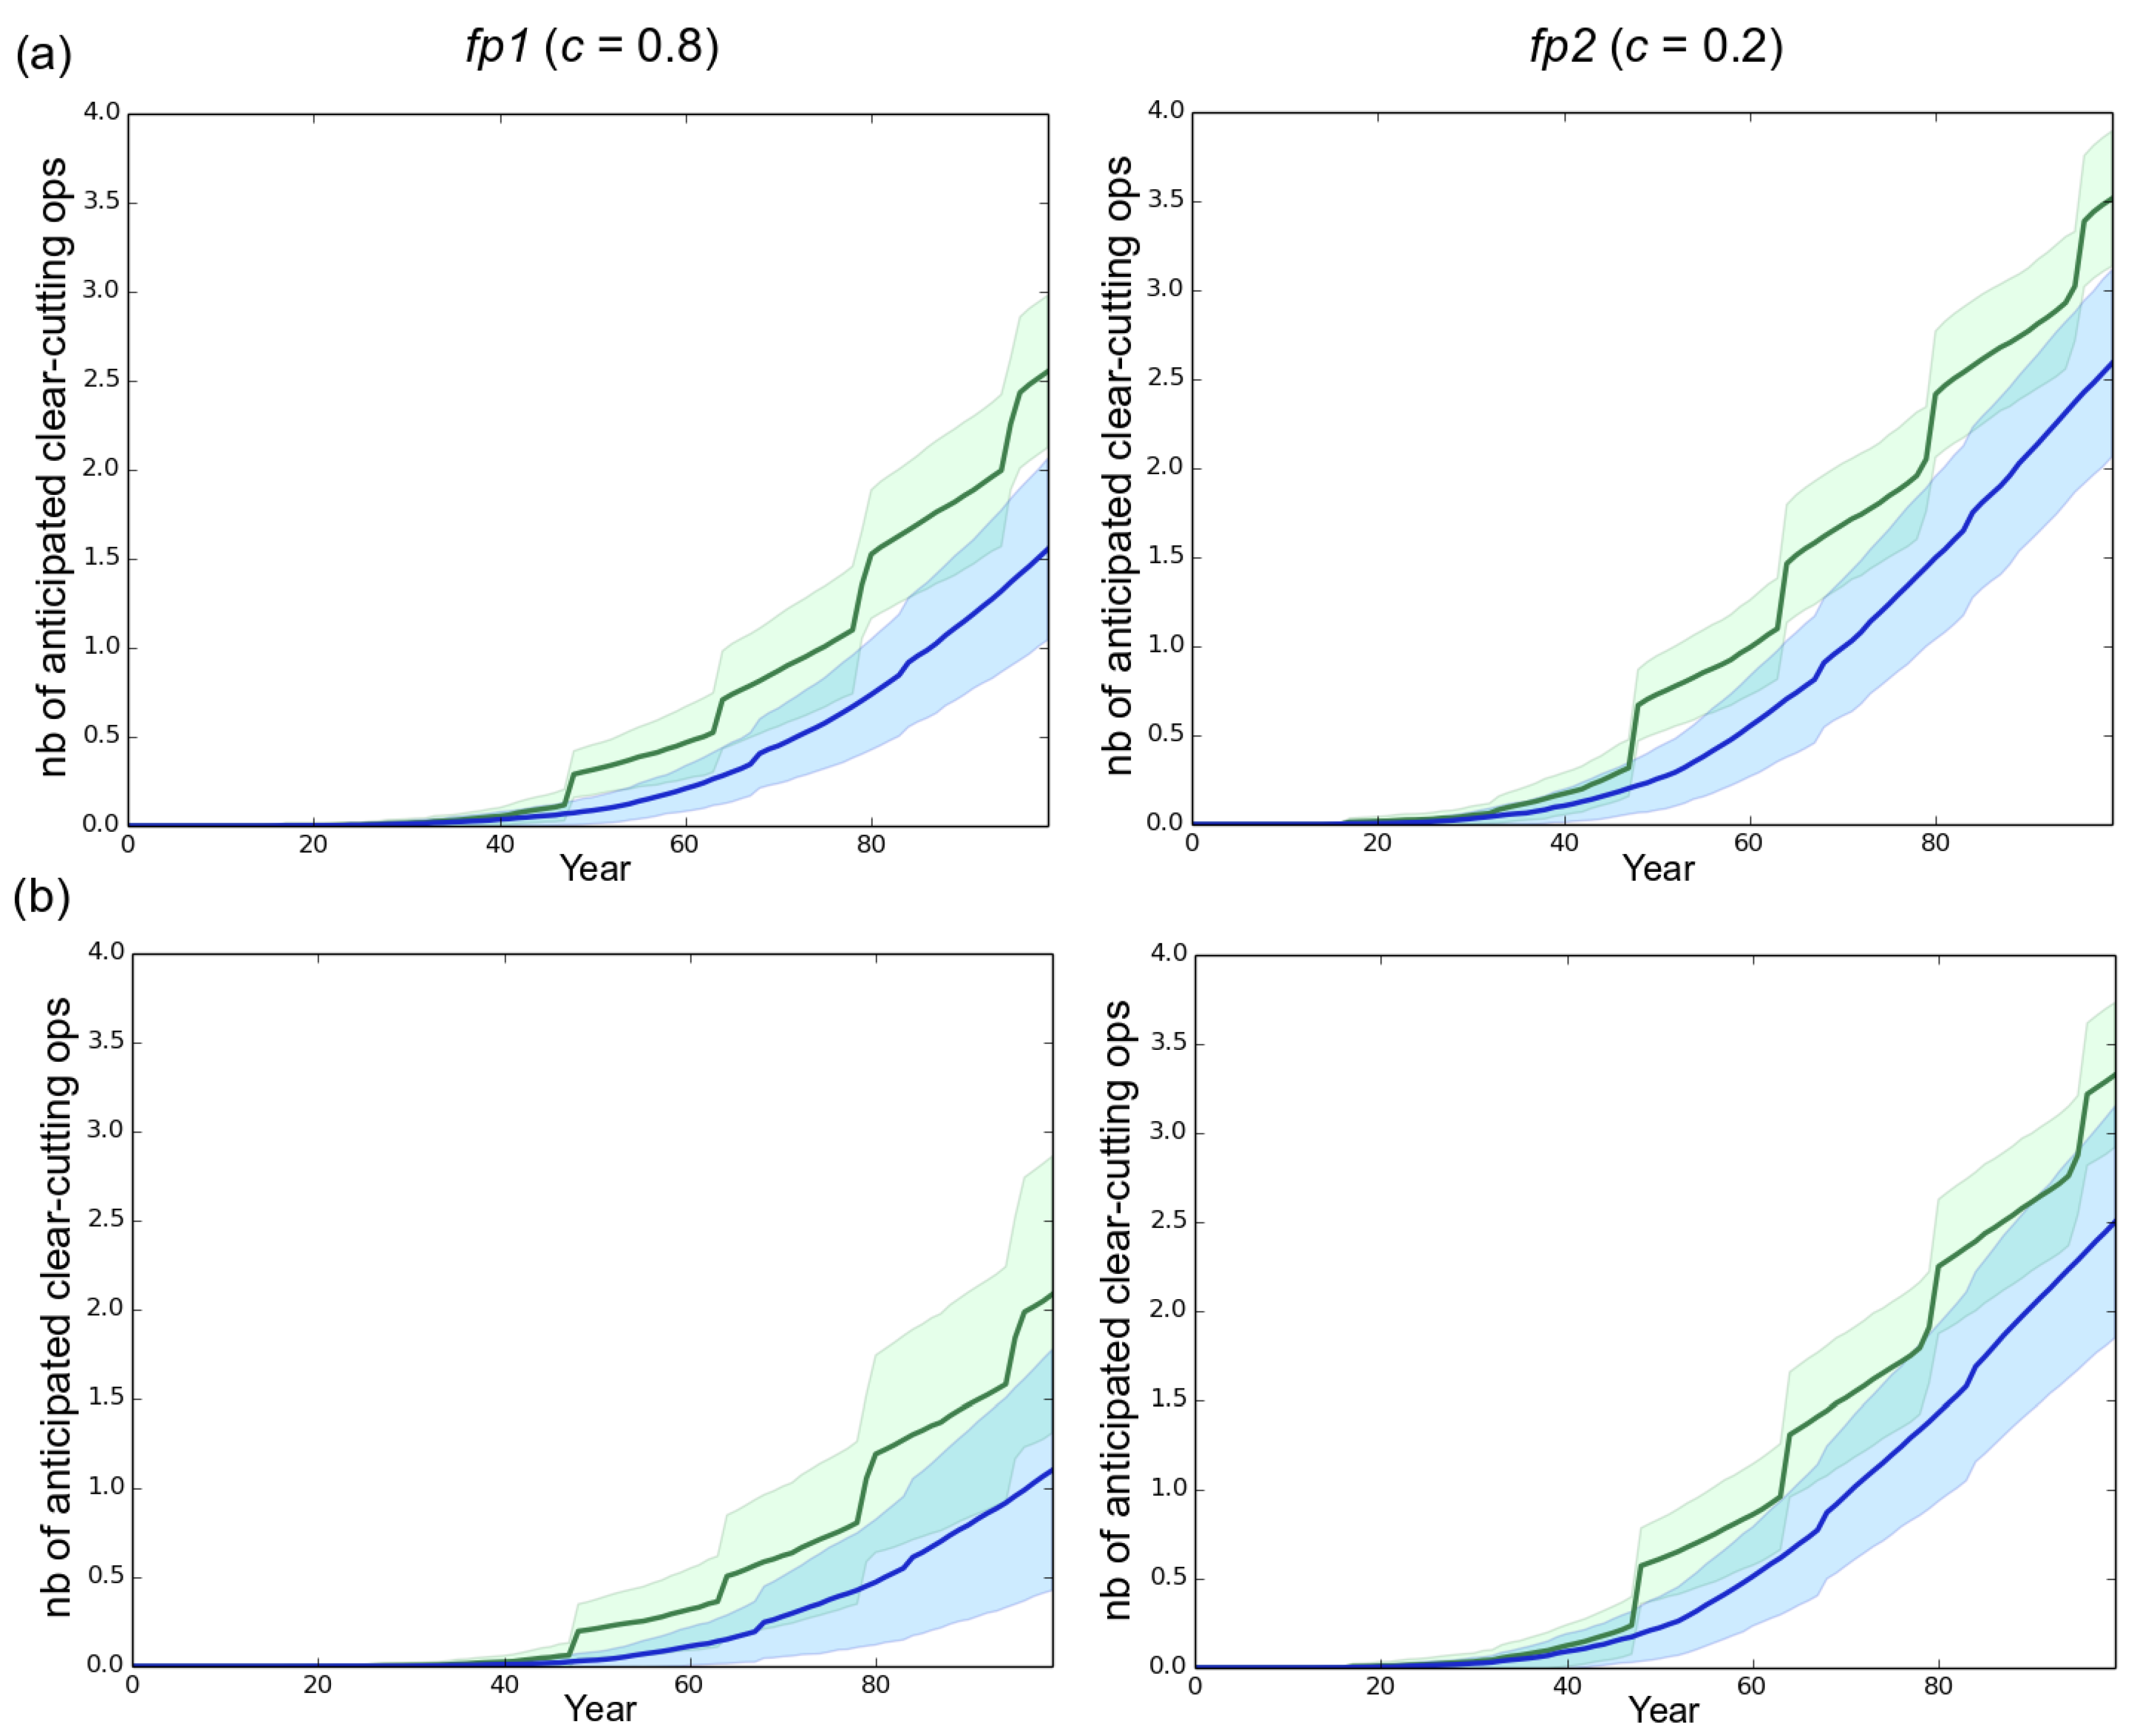
A shorter rotation length clearly resulted in faster development of the epidemics (Figure 3 and Figure S1). For instance, in our simulations the fp2 population infected all the stands in 38, 63 and 72 years when rotation lengths of 15, 30 and 50 years were specified, respectively. Besides, decreasing the rotation length substantially accelerated the evolutionary change at virulence during a first phase which lasted 70 years in the case of fp1 and 46 years in the case of fp2 in the default scenario. During this first phase, the shorter the rotation length, the faster the evolution of virulence. This relationship was however transient and progressively disappeared in the subsequent years. Taking for example the case of fp1, virulence levels of 7.2, 6.8 and 6.2 were reached at years 50 when the rotation lengths equaled 15, 30 and 50 years, respectively, but at year 100 the corresponding virulence levels equaled 7.65, 7.7 and 7.5. Importantly, the monitoring of the number of anticipated clear-cutting operations (see model) revealed that the negative correlation between the rotation length and the evolved virulence level weakened when anticipated clear-cutting operations were triggered (Figure 6). In our simulations the mostly sexual fungal pathogen fp2 induced the highest number of anticipated clear-cutting operations (Figure 6).
4. Discussion
4.1. The Effect of Silvicultural Operations on a Necrotroph Fungal Pathogen Alternating Parasitic and Saprotrophic Stages
Our simulations showed that the scenario involving the highest number of clear-cutting operations generated the largest increase in virulence and the fastest spread of epidemics. Although we purposely parameterized our simulations to allow the fungus to rapidly evolve and expand (e.g., high mutation rate, high fecundity), there were strong limitations to the evolutionary change in our simulations. First, because of the small size of the starting fungal population and the multiple founder effects accompanying its expansion, the genetic drift was likely to severely impede the adaptive response of the fungus to directional selection [62]. Second, the host death, clear-cutting and thinning rarely led to pathogen death because most of the fungal individuals remained as saprotrophs in stumps and dead wood ().
Saprotrophism facilitates the persistence of the fungal population in a stand and limits the effects of genetic drift and founder effects by massively sustaining the production of propagules that will try to infect the healthy trees available (see Model section). Nonetheless, saprotrophism is also likely to slow down the evolutionary change of the trait, by favoring the maintenance in the stands of many early individuals showing largely suboptimal virulence levels (), which dilutes the new arising virulent genotypes in the fungal population. This negative effect of saprotrophism on virulence evolution is particularly striking when many trees of a stand are previously infected by fungal individuals showing a low virulence level. In this patho-system where: (1) no coinfection can occur; and (2) the pathogen can maintain in the stand as a saprotroph (Figure 1), new infections, whatever the level of virulence of fungal individuals, can only occur when healthy trees are available, which is more likely during the early stage of epidemics. Such a process favoring early-arriving individuals over late- arriving individuals is called a priority effect [63].
Interestingly, in this context in which the pathogen virulence may be the subject of opposite pressures, one can expect the silvicultural operations to have a substantial impact on its evolution and the expansion of the pathogen population. In the case of thinning during juvenile–adult transition, the maintenance of numerous saprotrophs comes along with a rarefaction of healthy hosts (K decreased from 1000 to 500) which, at the same time, become much more resistant to the pathogen (R increased from 0.3 to 0.9). As a first consequence, the combination of a lower fungal carrying capacity with a considerable quantity of propagules largely provided by the saprotrophs is likely to induce drastic density regulations. As a second consequence, the increase in the mean resistance of the stand steadily amplifies the selection pressure exerted on virulence. A mature–adult transition induces a similar effect on the fungal carrying capacity of the stand (K decreasing from 500 to 300) but results in a moderate decrease of the resistance of the stand (R decreasing from 0.9 to 0.6). Finally, clear-cutting operations result in the replacement of resistant trees by numerous young susceptible trees, which weakens the intensity of selection during infection attempts (R falling down to 0.3 after plantation of young trees), and makes density regulation of the propagules less drastic or inexistent (K increasing from 500 or 300 to 1000). To sum up, each silvicultural operation modifies both the strength of the selection and the magnitude of the density regulation of propagules. While the strength of selection is one of the main determinant of the adaptive response of the fungal population [58], in our model the density regulation step can act against the evolution of the level of virulence in our simulation, notably when the fungal population is large and contains few virulent individuals. Let us figure a set of N propagules, N being greater than the number of healthy trees in a stand. Let us assume there are only very virulent propagules among the N existing propagules, such as . The step of density regulation reduces the probability of infection attempt by a very virulent genotype by a factor . Predicting accurately how the modifications of the selection intensity and the magnitude of density regulation interact with the effects of saprotrophism in the case of thinning and clear-cutting operations requires additional investigations. Nonetheless, the fact that the scenario involving the highest number of clear-cutting operations generated the largest increase in virulence and the fastest spread of epidemics in our simulations suggests that the release of the selection pressure at each clear-cutting was largely outweighed by the reduction of: (1) the genetic drift; (2) the founder effects; and (3) the magnitude of density regulation events. Finally, although silvicultural operations induce disturbances in a pathosystem dominated by a priority effect, it is interesting to note that in our simulations, the mean virulence level was systematically greater at the front of the epidemics than in the first stands infected (Figure 2). This result confirms the predictions of [16] in a radically different context. Nonetheless the reduction in differences in the mean virulence level between the later stands infected suggests that the priority effect was progressively canceled as the epidemics developed.
4.2. The Importance of Initial Genetic Variation
A low initial genetic variability (1.63 vs. 4.06) in the emerging fungal population did not qualitatively alter the clear-cutting effect characterized: the shorter the rotation length, the faster the evolution of virulence and the development of the epidemics. However, the level of initial genetic variability influenced quantitatively both the evolutionary change of virulence and the speed of the epidemic (Figure 3 and Figure 4). Available genetic variance strongly determines the evolutionary potential of populations (e.g., [36,64,65]) particularly in the case of an expansion across spatio-temporally heterogeneous landscapes [47,66]. Our results thus confirm and underline the crucial influence of the level of standing genetic variation in fungal pathogen populations emerging in forest plantations. Surprisingly, the simulation of a low initial genetic variance () resulted in a substantial increase in the genetic variance between year 0 and year 100 (Figure 5), the final level being almost twice greater in this case than in the default scenario () when a high asexuality rate was simulated. The very limited change in the virulence level occurring at the same time in these cases (Figure 4) indicates that the generated additive variance was not efficiently exploited by genetic adaptation, particularly in the case of the mostly asexual species fp1. This observation illustrates again the consequences of the priority effect and saprotrophism discussed in the sub-paragraph above. Indeed, an epidemic can develop in spite of a very limited genetic variation among the fungal individuals, provided they are sufficiently virulent to infect available hosts. Here, in the context of priority effect and saprotrophism, a small increase in genetic variance, without a visible effect on the mean virulence, corresponds to the arrival of new virulent genotypes that remained however much less frequent that the first early maladapted individuals. This suggests that the genetic variation in the fungal population can really sustains the increase in virulence only when it is sufficiently elevated during the early stage of the epidemics.
4.3. The Importance of the Reproduction System
Little is known about the ratio of sexual to asexual reproduction modes in populations of root-rot fungal pathogens of conifers such as A. ostoyae [53], or Heterobasidion annosum [40]. In this context our model provides new elements which contrast with existing theory. While the rate of asexuality did not alter the effects of clear-cutting-operations, the fungal profile with the highest sexuality rate (fp2, ) evolved more rapidly towards the highest virulence levels and generated the fastest epidemics in our simulations. First of all, it is important to note that in our model, at constant fecundity, a higher sexuality rate comes along with more sexual spores and thus greater spore flow between stands. Moreover the number of infections in the first infected stand grew slightly faster over 100 years in the fp2 than in the fp1 population (data not shown), as a result of a higher mean evolved virulence level. Indeed, in an evolutionary context characterized by important genetic drift and recurrent founder effects, gene flow between stands sustains the adaptive response of the pathogen to uniform directional selection by allowing the alleles with positive effects on virulence to be rapidly exchanged among stands [36]. In addition, higher sexuality rates make new genotypes potentially more virulent to be generated by recombination [67]. In contrast, fungal populations characterized by high asexuality rates have a lower capacity to break existing linkage disequilibrium, the mutations becoming the main source of genetic variability [20]. As a consequence of recombination and gene flow, the mostly sexual reproduction system induced an increase in the genetic variance during the first evolutionary cycles in our simulations (Figure 5), this increase corresponding to infections realized by new virulent genotypes. When they are generated sufficiently early (see the priority effect discussed above), these new genotypes are more likely to infect the healthy hosts compared to the early less virulent genotypes. Consequently, new virulent individuals rapidly prevail, which leads to a rapid decrease of the genetic variance in the following years and ultimately allows for the largest evolutionary change and the fastest spread of the pathogen.
Our results differ from those of Bazin et al. (2014) [20] who found that organisms that combined a very high asexuality rate (0.95) and a low sexuality rate were the best invaders. This difference stems from the fact that in their model the between-stand dispersal ability was kept constant whatever the asexuality rate, which is not the case in our model. Hence, in our study, the mostly sexual fungal population of a stand generated more infections in neighboring stands for a given population size and virulence level. Moreover, the model proposed by Bazin et al. (2014) [20] simulates non-overlapping generations, i.e., the generated offspring systematically replaces the adults at each evolutionary cycle. In contrast, generations overlap in our model, which might also explain the observed differences. Earlier works have indeed shown that describing realistic demography by simulating non-overlapping generations can affect the evolutionary outcomes (e.g., see [68]).
4.4. Generalization and Future Directions
Interestingly, our results can be generalized to other root-rot pathogenic fungi such as the Heterobasidion species which cause root-rot disease in conifers. Indeed, these fungi combine sexual and asexual reproduction modes and alternate parasitic and saprotrophic stages [40]. Moreover, although we found no experimental results on the relationship between host age and host susceptibility to these fungal species, Pukkala et al. proposed a model of the spread of H. annosum in even-aged conifer stands which explicitly formalizes a higher mortality rate for young (i.e., small) trees exposed to the pathogen than mature (i.e., large) trees, for a given period length (see Figure 6, Equations (21) and (22) in [69]. Together with the experimental results of Lung-Escarmant and Guyon regarding A. ostoyae [44], this model supports the idea that young trees of smaller size are more rapidly weakened and killed by a pathogenic fungus than mature trees of greater size.
Nonetheless, further disentangling the complex effects of the artificial disturbances induced by silviculture on the evolutionary and epidemiological dynamics of pathogenic fungal populations requires consideration of a wider range in important parameters. Within the framework of a direct extension of the present study, this will require definition and simulation of multiple tree age class structures, rotation ages, and relationships between tree resistance and tree age. On the pathogen side, this will require investigation of how different levels of saprotrophic ability, sizes and genetic composition of the initial fungal population can affect the results obtained in this work. We now detail three other points that deserve to be considered in future investigations following our study. First, it is unlikely that all the stands composing a forest plantation landscape are managed according to a unique scheme. Hence, it might be interesting to assess how heterogeneity in management practices could affect the positive relationship between the number of occurrences of clear-cutting operations and the evolution of virulence. Following earlier modeling studies in phytopathology which have assessed the effect of spatio-temporal deployments of plant resistance genes on the durability of resistance (e.g., [22,23]), we could try to characterize the spatio-temporal dynamics of silvicultural operations that maximize the productivity of a forest plantation while containing the development of the epidemics. Such a study could be the opportunity to assess the effects of stump removal on the evolutionary and epidemiological dynamics of the fungal population. Second, the reproduction system simulated here included a substantial rate of selfing that was allowed in our simulations. Accounting for sexual compatibility in our simulations on the basis of dedicated loci could modify the dynamics characterized in this study. Indeed, selfing is largely viewed as a constraint to adaptation of populations, which was recently confirmed experimentally by Noel et al. (2017) [70] in snails. This point might have important consequences in our pathosystem, especially during the early evolutionary cycles which, because of the priority effect, strongly determine the evolutionary potential of the fungal population and thus the epidemic speed. Third, integrating a transmission character that is heritable and under selection could be of great help to further consider the evolution of virulence in the more realistic context of the virulence–transmission trade-off [14] within managed forest plantations.
5. Conclusions
Our study shows that frequent clear-cutting operations accelerate virulence evolution and propagation in root-rot fungal pathogens in forest plantations. More generally, this study yields insights into the evolutionary and epidemiological dynamics of a fungus combining sexual and asexual reproduction modes and showing a saprotrophic ability. Although more investigations are needed to further characterize the dynamics identified here, this work shows that genetically-explicit and individual-based models can be useful to improve our understanding of the relationship between forest management and spread of epidemics.
Supplementary Materials
The following are available online at www.mdpi.com/1999-4907/8/6/205/s1, Figure S1: total number of infected trees.
Acknowledgments
We thank Céline Meredieu, Stéphanie Mariette and Antoine Kremer for helpful discussions during model development. We thank three anonymous reviewers for their constructive comments. Computer time for this study was provided by the computing facilities MCIA (Mésocentre de Calcul Intensif Aquitain) of the Université de Bordeaux and of the Université de Pau et des Pays de l’Adour.
Author Contributions
All of the authors designed the study, identified the different scenarios to be tested, and wrote the paper. J.P.S. developed the model and realized the simulation work.
Conflicts of Interest
The authors declare no conflict of interest.
References
- FAO. Planted forests are a vital resource for future green economies. In Planted Forests Increasing in Importance Worldwide, Proceedings of the Third International Congress on Planted Forests, Estoril, Portugal, 15–21 May 2013; FAO: Roma, Italy, 2013; p. 6. [Google Scholar]
- WWF (World Wildlife Fund). WWF’s Living Forest Report: Chapter 4—Forests and Wood Products; World Wildlife Fund: Washington, DC, USA, 2013. [Google Scholar]
- Santini, A.; Ghelardini, L.; Pace, C.D.; Desprez-Loustau, M.L.; Capretti, P.; Chandelier, A.; Hantula, J. Biogeographical patterns and determinants of invasion by forest pathogens in Europe. New Phytol. 2013, 197, 238–250. [Google Scholar] [CrossRef] [PubMed]
- Ennos, R.A. Resilience of forests to pathogens: An evolutionary ecology perspective. Forestry 2015, 88, 41–52. [Google Scholar] [CrossRef]
- Wingfield, M.J.; Brockerhoff, E.G.; Wingfield, B.D.; Slippers, B. Planted forest health: The need for a global strategy. Science 2015, 349, 832–836. [Google Scholar] [CrossRef] [PubMed]
- Desprez-Loustau, M.L.; Aguayo, J.; Dutech, C.; Hayden, K.J.; Husson, C.; Jakushkin, B.; Vacher, C. An evolutionary ecology perspective to address forest pathology challenges of today and tomorrow. Ann. For. Sci. 2016, 73, 45–67. [Google Scholar] [CrossRef]
- Perkins, T.A. Evolutionarily labile species interactions and spatial spread of invasive species. Am. Nat. 2012, 179, E37–E54. [Google Scholar] [CrossRef] [PubMed]
- Sapoukhina, N.; Durel, C.E.; Le Cam, B. Spatial deployment of gene-for-gene resistance governs evolution and spread of pathogen populations. Theor. Ecol. 2009, 2, 229–238. [Google Scholar] [CrossRef]
- Perkins, T.A.; Phillips, B.L.; Baskett, M.L.; Hastings, A. Evolution of dispersal and life history interact to drive accelerating spread of an invasive species. Ecol. Lett. 2013, 16, 1079–1087. [Google Scholar] [CrossRef] [PubMed]
- Burdon, J.J.; Thrall, P.H. Pathogen evolution across the agro-ecological interface: Implications for disease management. Evolut. Appl. 2008, 1, 57–65. [Google Scholar] [CrossRef] [PubMed]
- Berngruber, T.W.; Froissart, R.; Choisy, M.; Gandon, S. Evolution of virulence in emerging epidemics. PLoS Pathog. 2013, 9, e1003209. [Google Scholar] [CrossRef] [PubMed]
- Cressler, C.E.; McLEOD, D.V.; Rozins, C.; Van Den Hoogen, J.; Day, T. The adaptive evolution of virulence: A review of theoretical predictions and empirical tests. Parasitology 2016, 143, 915–930. [Google Scholar] [CrossRef] [PubMed]
- Lannou, C. Variation and selection of quantitative traits in plant pathogens. Annu. Rev. Phytopathol. 2012, 50, 319–338. [Google Scholar] [CrossRef] [PubMed]
- Alizon, S.; Michalakis, Y. Adaptative virulence evolution: The good old fitness-based approach. Trends Ecol. Evol. 2015, 30, 248–254. [Google Scholar] [CrossRef] [PubMed]
- Dieckmann, U. Adaptive Dynamics of Pathogen-Host Interactions; IIASA Interim Report; IIASA: Laxenburg, Austria, 2002. [Google Scholar]
- Griette, Q.; Raoul, G.; Gandon, S. Virulence evolution at the front line of spreading epidemics. Evolution 2015, 69, 2810–2819. [Google Scholar] [CrossRef] [PubMed]
- Day, T.; Proulx, S.R. A general theory for the evolutionary dynamics of virulence. Am. Nat. 2004, 163, E40–E63. [Google Scholar] [CrossRef] [PubMed]
- Day, T.; Gandon, S. Applying population-genetic models in theoretical evolutionary epidemiology. Ecol. Lett. 2007, 10, 876–888. [Google Scholar] [CrossRef] [PubMed]
- Bolker, B.M.; Nanda, A.; Shah, D. Transient virulence of emerging pathogens. J. R. Soc. Interface 2010, 7, 811–822. [Google Scholar] [CrossRef] [PubMed]
- Bazin, É.; Mathé-Hubert, H.; Facon, B.; Carlier, J.; Ravigné, V. The effect of mating system on invasiveness: Some genetic load may be advantageous when invading new environments. Biol. Invasions 2014, 16, 875–886. [Google Scholar] [CrossRef]
- Papaïx, J.; David, O.; Lannou, C.; Monod, H. Dynamics of adaptation in spatially heterogeneous metapopulations. PLoS ONE 2013, 8, e54697. [Google Scholar] [CrossRef] [PubMed]
- Fabre, F.; Rousseau, E.; Mailleret, L.; Moury, B. Epidemiological and evolutionary management of plant resistance: Optimizing the deployment of cultivar mixtures in time and space in agricultural landscapes. Evol. Appl. 2015, 8, 919–932. [Google Scholar] [CrossRef] [PubMed]
- Bourget, R.; Chaumont, L.; Sapoukhina, N. Timing of pathogen adaptation to a multicomponent treatment. PLoS ONE 2013, 8, e71926. [Google Scholar] [CrossRef] [PubMed]
- Chevin, L.M.; Lande, R.; Mace, G.M. Adaptation, plasticity, and extinction in a changing environment: Towards a predictive theory. PLoS Biol. 2010, 8, e1000357. [Google Scholar] [CrossRef] [PubMed]
- Segelbacher, G.; Cushman, S.A.; Epperson, B.K.; Fortin, M.J.; Francois, O.; Hardy, O.J.; Manel, S. Applications of landscape genetics in conservation biology: Concepts and challenges. Conserv. Genet. 2010, 11, 375–385. [Google Scholar] [CrossRef]
- Lion, S.; Gandon, S. Evolution of spatially structured host–parasite interactions. J. Evolut. Biol. 2015, 28, 10–28. [Google Scholar] [CrossRef] [PubMed]
- Borshchev, A.; Filippov, A. From system dynamics and discrete event to practical agent based modeling: Reasons, techniques, tools. In Proceedings of the 22nd International Conference of the System Dynamics Society, Oxford, UK, 25–29 July 2004; Volume 22. [Google Scholar]
- Evans, M.R.; Grimm, V.; Johst, K.; Knuuttila, T.; De Langhe, R.; Lessells, C.; Merz, M.; Wilkinson, D.J. Do simple models lead to generality in ecology? Trends Ecol. Evol. 2013, 28, 578–583. [Google Scholar] [CrossRef] [PubMed]
- Stillman, R.A.; Railsback, S.F.; Giske, J.; Berger, U.; Grimm, V. Making predictions in a changing world: The benefits of individual-based ecology. BioScience 2015, 65, 140–150. [Google Scholar] [CrossRef] [PubMed]
- Le Corre, V.; Machon, N.; Petit, R.J.; Kremer, A. Colonization with long-distance seed dispersal and genetic structure of maternally inherited genes in forest trees: A simulation study. Genet. Res. 1997, 69, 117–125. [Google Scholar] [CrossRef]
- Austerlitz, F.; Mariette, S.; Machon, N.; Gouyon, P.H.; Godelle, B. Effects of colonization processes on genetic diversity: Differences between annual plants and tree species. Genetics 2000, 154, 1309–1321. [Google Scholar] [PubMed]
- Yeaman, S.; Guillaume, F. Predicting adaptation under migration load: The role of genetic skew. Evolution 2009, 63, 2926–2938. [Google Scholar] [CrossRef] [PubMed]
- Scheiner, S.M.; Barfield, M.; Holt, R.D. The genetics of phenotypic plasticity. XI. Joint evolution of plasticity and dispersal rate. Ecol. Evolut. 2012, 2, 2027–2039. [Google Scholar] [CrossRef] [PubMed]
- Soularue, J.P.; Kremer, A. Assortative mating and gene flow generate clinal phenological variation in trees. BMC Evolut. Biol. 2012, 12, 79. [Google Scholar] [CrossRef] [PubMed]
- Soularue, J.P.; Kremer, A. Evolutionary responses of tree phenology to the combined effects of assortative mating, gene flow and divergent selection. Heredity 2014, 113, 485–494. [Google Scholar] [CrossRef] [PubMed]
- Schiffers, K.; Bourne, E.C.; Lavergne, S.; Thuiller, W.; Travis, J.M. Limited evolutionary rescue of locally adapted populations facing climate change. Philos. Trans. R. Soc. B 2013, 368, 20120083. [Google Scholar] [CrossRef] [PubMed]
- Bourne, E.C.; Bocedi, G.; Travis, J.M.; Pakeman, R.J.; Brooker, R.W.; Schiffers, K. Between migration load and evolutionary rescue: Dispersal, adaptation and the response of spatially structured populations to environmental change. Proc. R. Soc. Lond. B Biol. Sci. 2014, 281, 20132795. [Google Scholar] [CrossRef] [PubMed]
- Guillaumin, J.J.; Mohammed, C.; Anselmi, N.; Courtecuisse, R.; Gregory, S.C.; Holdenrieder, O.; Rishbeth, J. Geographical distribution and ecology of the Armillaria species in western Europe. For. Pathol. 1993, 23, 321–341. [Google Scholar] [CrossRef]
- Morrison, D.; Mallett, K. Silvicultural management of armillaria root disease in western Canadian forests. Can. J. Plant Pathol. 1996, 18, 194–199. [Google Scholar] [CrossRef]
- Garbelotto, M.; Gonthier, P. Biology, epidemiology, and control of Heterobasidion species worldwide. Annu. Rev. Phytopathol. 2013, 51, 39–59. [Google Scholar] [CrossRef] [PubMed]
- Barrett, L.G.; Thrall, P.H.; Burdon, J.J.; Linde, C.C. Life history determines genetic structure and evolutionary potential of host–parasite interactions. Trends Ecol. Evolut. 2008, 23, 678–685. [Google Scholar] [CrossRef] [PubMed]
- Redfern, D.B.; Filip, G.M. Inoculum and infection. Agric. Handb. USA 1991, 691, 48–61. [Google Scholar]
- Labbé, F.; Lung-Escarmant, B.; Fievet, V.; Soularue, J.P.; Laurent, C.; Robin, C.; Dutech, C. Variation in traits associated with parasitism and saprotrophism in a fungal root-rot pathogen invading intensive pine plantations. Fungal Ecol. 2017, 26, 99–108. [Google Scholar] [CrossRef]
- Lung-Escarmant, B.; Guyon, D. Temporal and spatial dynamics of primary and secondary infection by Armillaria ostoyae in a Pinus pinaster plantation. Phytopathology 2004, 94, 125–131. [Google Scholar] [CrossRef] [PubMed]
- Labbé, F.; Marcais, B.; Dupouey, J.L.; Bélouard, T.; Capdevielle, X.; Piou, D.; Dutech, C. Pre-existing forests as sources of pathogens? The emergence of Armillaria ostoyae in a recently planted pine forest. For. Ecol. Manag. 2015, 357, 248–258. [Google Scholar] [CrossRef]
- Bürger, R.; Lynch, M. Adaptation and extinction in changing environments. In Environmental Stress, Adaptation and Evolution; Birkhäuser: Basel, Switzerland, 1997; pp. 209–239. [Google Scholar]
- Holt, R.D.; Gomulkiewicz, R.; Barfield, M. The phenomenology of niche evolution via quantitative traits in a ‘black-hole’ sink. Proc. R. Soc. Lond. B Biol. Sci. 2008, 270, 215–224. [Google Scholar] [CrossRef] [PubMed]
- Python Software Fundation (US). Available online: https://www.python.org/ (accessed on 8 June 2017).
- Walt, S.V.D.; Colbert, S.C.; Varoquaux, G. The NumPy array: A structure for efficient numerical computation. Comput. Sci. Eng. 2011, 13, 22–30. [Google Scholar] [CrossRef]
- Hunter, J. D. Matplotlib: A 2D graphics environment. Comput. Sci. Eng. 2007, 9, 90–95. [Google Scholar] [CrossRef]
- Legrand, P.; Ghahari, S.; Guillaumin, J.J. Occurrence of genets of Armillaria spp. in four mountain forests in Central France: The colonization strategy of Armillaria ostoyae. New Phytol. 1996, 133, 321–332. [Google Scholar] [CrossRef]
- Prospero, S.; Lung-Escarmant, B.; Dutech, C. Genetic structure of an expanding Armillaria root rot fungus (Armillaria ostoyae) population in a managed pine forest in southwestern France. Mol. Ecol. 2008, 17, 3366–3378. [Google Scholar] [CrossRef] [PubMed]
- Dutech, C.; Labbé, F.; Capdevielle, X.; Lung-Escarmant, B. Genetic analysis reveals efficient sexual spore dispersal at a fine spatial scale in Armillaria ostoyae, the causal agent of root-rot disease in conifers. Fungal Biol. 2017. [Google Scholar] [CrossRef]
- Bendel, M.; Kienast, F.; Rigling, D. Genetic population structure of three Armillaria species at the landscape scale: A case study from Swiss Pinus mugo forests. Mycol. Res. 2006, 110, 705–712. [Google Scholar] [CrossRef] [PubMed]
- Prospero, S.; Holdenrieder, O.; Rigling, D. Primary resource capture in two sympatric Armillaria species in managed Norway spruce forests. Mycol. Res. 2003, 107, 329–338. [Google Scholar] [CrossRef] [PubMed]
- Ferguson, B.A.; Dreisbach, T.A.; Parks, C.G.; Filip, G.M.; Schmitt, C.L. Coarse-scale population structure of pathogenic Armillaria species in a mixed-conifer forest in the Blue Mountains of northeast Oregon. Can. J. For. Res. 2003, 33, 612–623. [Google Scholar] [CrossRef]
- Kimura, M.; Weiss, G.H. The stepping stone model of population structure and the decrease of genetic correlation with distance. Genetics 1964, 49, 561. [Google Scholar] [PubMed]
- Lynch, M.; Walsh, B. Genetics and Analysis of Quantitative Traits; Sinauer: Sunderland, MA, USA, 1998; Volume 1, p. 4. [Google Scholar]
- Orr, H.A. Fitness and its role in evolutionary genetics. Nat. Rev. Genet. 2009, 10, 531–539. [Google Scholar] [CrossRef] [PubMed]
- Peng, B.; Kimmel, M.; Amos, C.I. Forward-Time Population Genetics Simulations: Methods, Implementation, and Applications; John Wiley & Sons, Inc.: Hoboken, NJ, USA, 2012. [Google Scholar]
- Rishbeth, J. Armillaria in an ancient broadleaved woodland. For. Pathol. 1991, 21, 239–249. [Google Scholar] [CrossRef]
- Hanrahan, J.P.; Eisen, E.J.; Legates, J.E. Effects of population size and selection intensity on short-term response to selection for postweaning gain in mice. Genetics 1973, 73, 513–530. [Google Scholar] [PubMed]
- Hiscox, J.; Savoury, M.; Müller, C.T.; Lindahl, B.D.; Rogers, H.J.; Boddy, L. Priority effects during fungal community establishment in beech wood. ISME J. 2015, 9, 2246–2260. [Google Scholar] [CrossRef] [PubMed]
- Lande, R.; Shannon, S. The role of genetic variation in adaptation and population persistence in a changing environment. Evolution 1994, 50, 434–437. [Google Scholar] [CrossRef] [PubMed]
- Barrett, R.D.; Schluter, D. Adaptation from standing genetic variation. Trends Ecol. Evolut. 2008, 23, 38–44. [Google Scholar] [CrossRef] [PubMed]
- Prentis, P.J.; Wilson, J.R.; Dormontt, E.E.; Richardson, D.M.; Lowe, A.J. Adaptive evolution in invasive species. Trends Plant Sci. 2008, 13, 288–294. [Google Scholar] [CrossRef] [PubMed]
- Otto, S.P.; Lenormand, T. Resolving the paradox of sex and recombination. Nat. Rev. Genet. 2002, 3, 252–261. [Google Scholar] [CrossRef] [PubMed]
- Austerlitz, F.; Garnier-Géré, P.H. Modelling the impact of colonisation on genetic diversity and differentiation of forest trees: Interaction of life cycle, pollen flow and seed long-distance dispersal. Heredity 2003, 90, 282–290. [Google Scholar] [CrossRef] [PubMed]
- Pukkala, T.; Möykkynen, T.; Thor, M.; Rönnberg, J.; Stenlid, J. Modeling infection and spread of Heterobasidion annosum in even-aged Fennoscandian conifer stands. Can. J. For. Res. 2005, 35, 74–84. [Google Scholar] [CrossRef]
- Noël, E.; Jarne, P.; Glémin, S.; MacKenzie, A.; Segard, A.; Sarda, V.; David, P. Experimental evidence for the negative effects of selffertilization on the adaptive potential of populations. Curr. Biol. 2017, 27, 237–242. [Google Scholar] [CrossRef] [PubMed]
Figure 1.
Simulated evolutionary cycle. Each green square represents an evolutionary step. Red squares indicate different evolutionary states of the fungus in our simulations. The dashed square represents the fungal population, i.e., a set of fungal individuals at the parasitic or saprotrophic stage. Mutation and survival in dead material as saprotrophs occur randomly according to the rates specified.
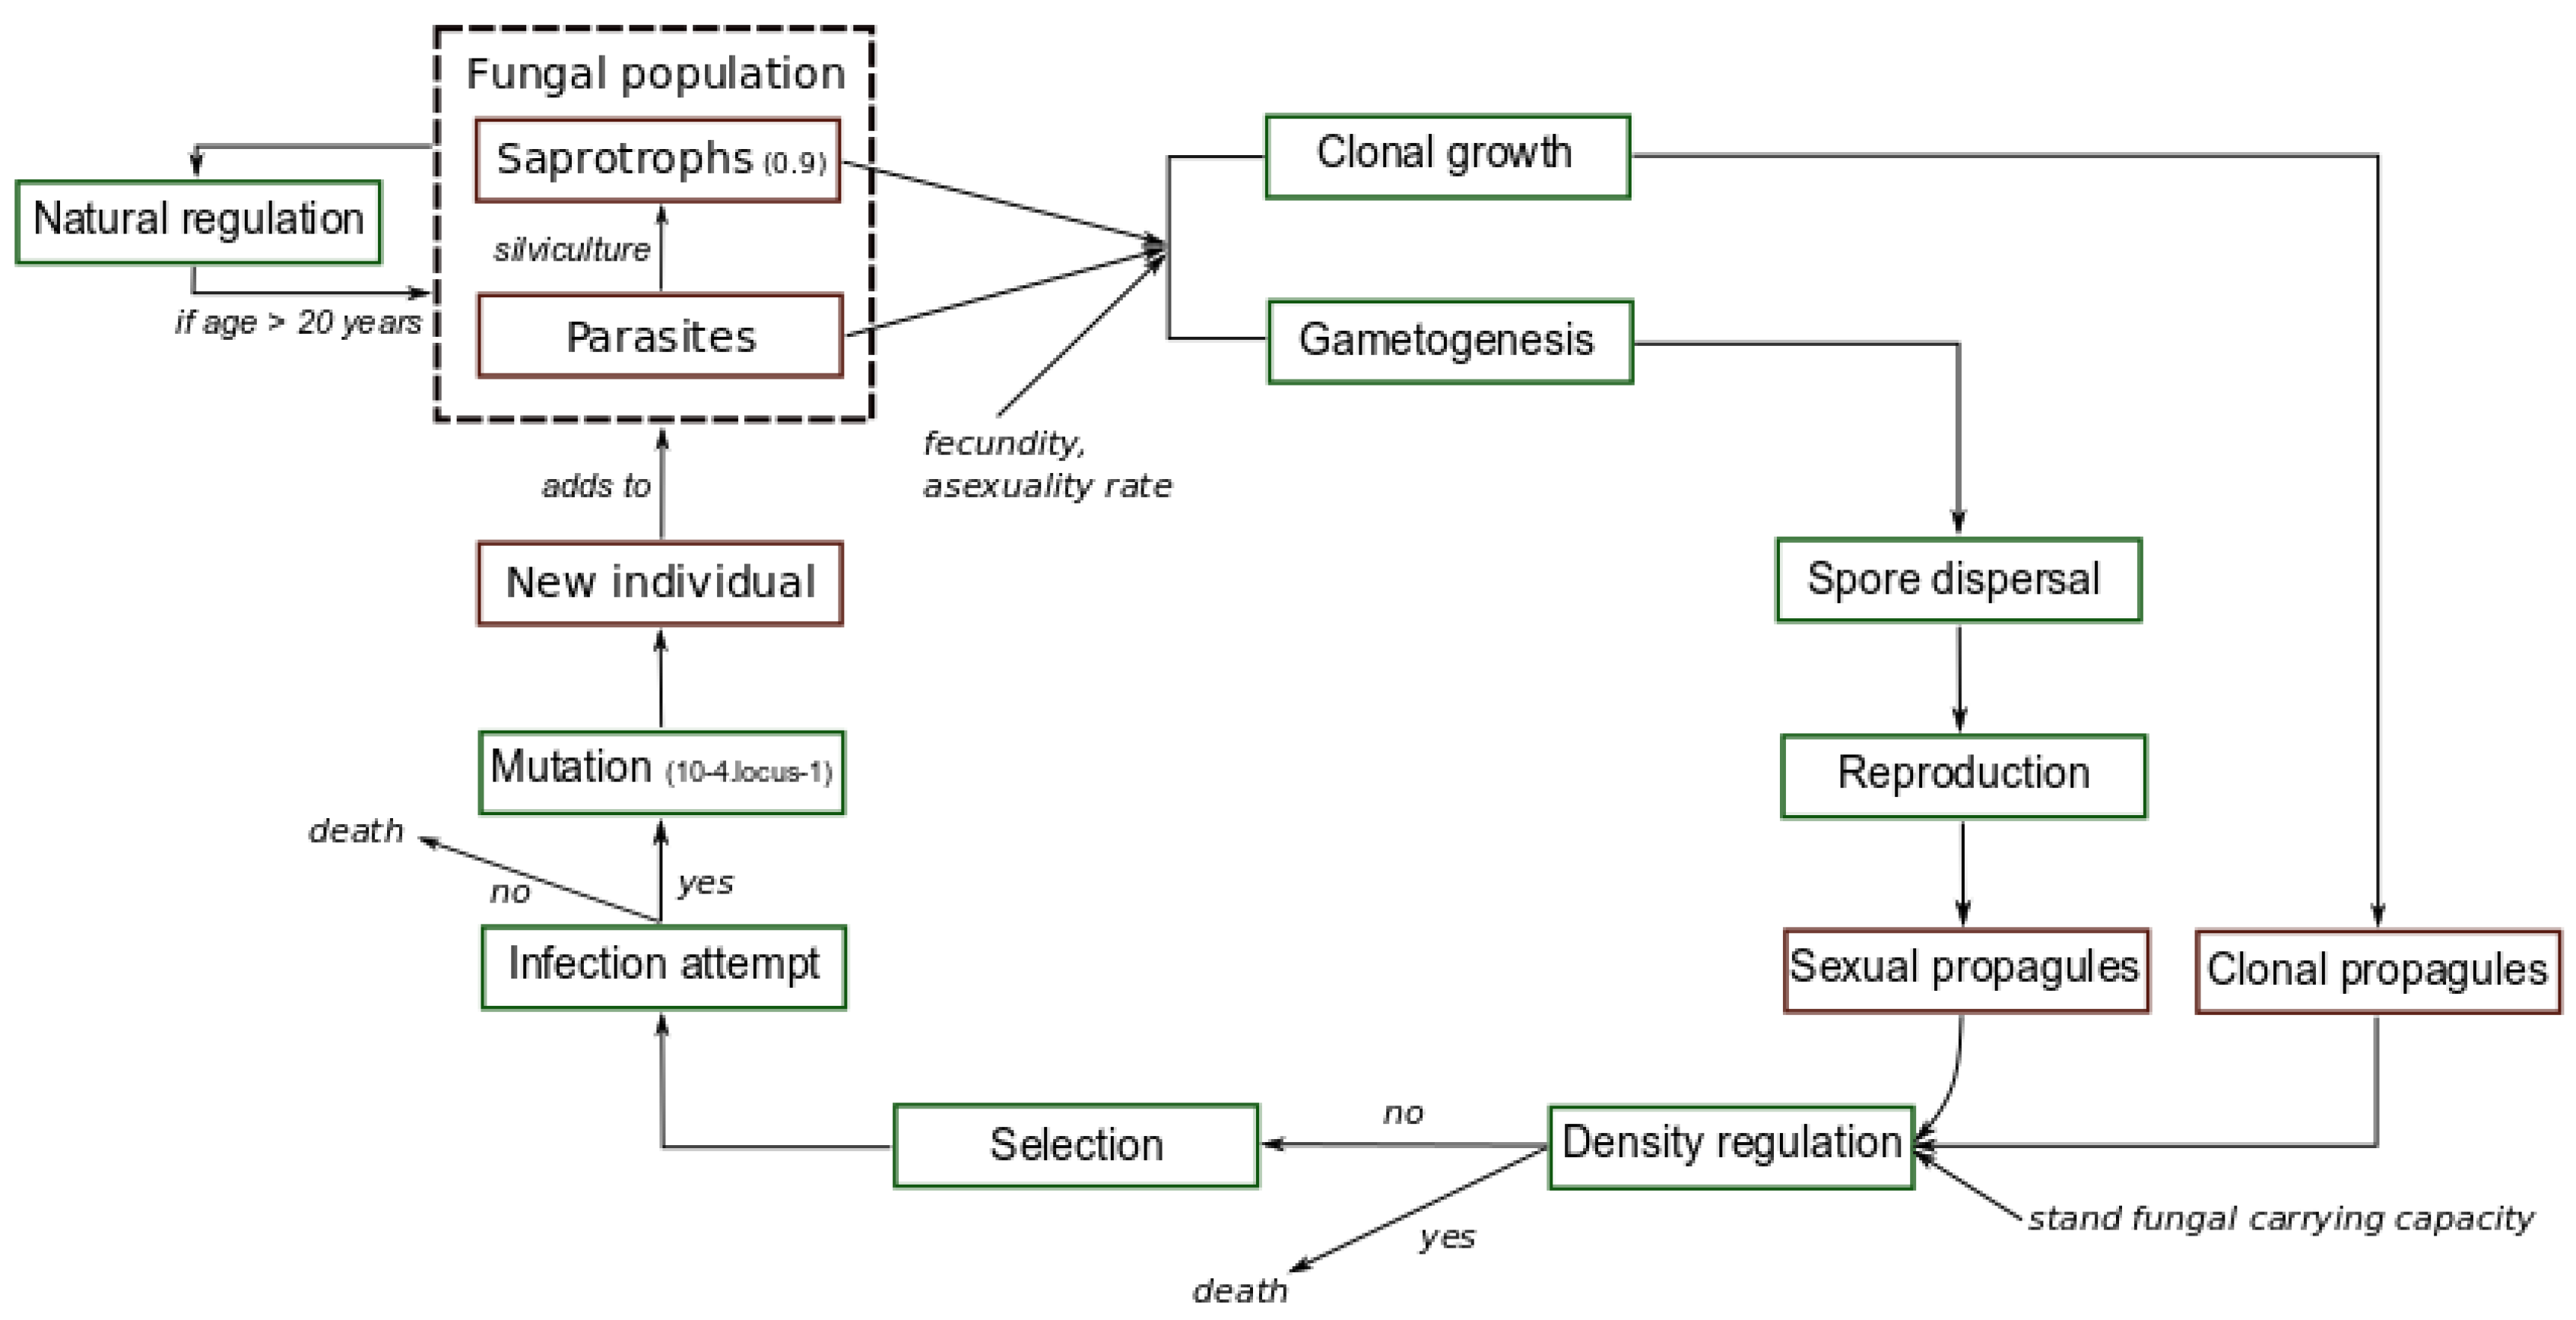
Figure 2.
Spatial distribution of the mean virulence level over the forest landscape, at years 20, 30 and 40, for a rotation length of 15 years. Dark green corresponds to healthy stands. The other colors inform about the mean genetic value of the local fungal sub-population in each infected stand. (a) mostly clonal fungal pathogen profile fp1 (clonality rate ); (b) mostly sexual fungal pathogen profile fp2 (). In both cases, the starting genetic variance was 4.06 (default scenario). The mean fungal genetic values were computed in each stand from the 50 independent replicates simulated.

Figure 3.
Effect of the rotation length on the propagation of the pathogen. (a) high initial genetic variance of 4.06 in the starting fungal population (default scenario); (b) reduced initial genetic variance of 1.63 in the starting fungal population. Left column: mostly clonal fungal profile fp1 (clonality rate ). Right column: mostly sexual fungal profile fp2 (). Red, green and blue represent a rotation length of 15, 30 and 50 years, respectively. Each line is the mean of 50 independent replicates simulated. Each colored area represents the standard deviation of the 50 replicates.
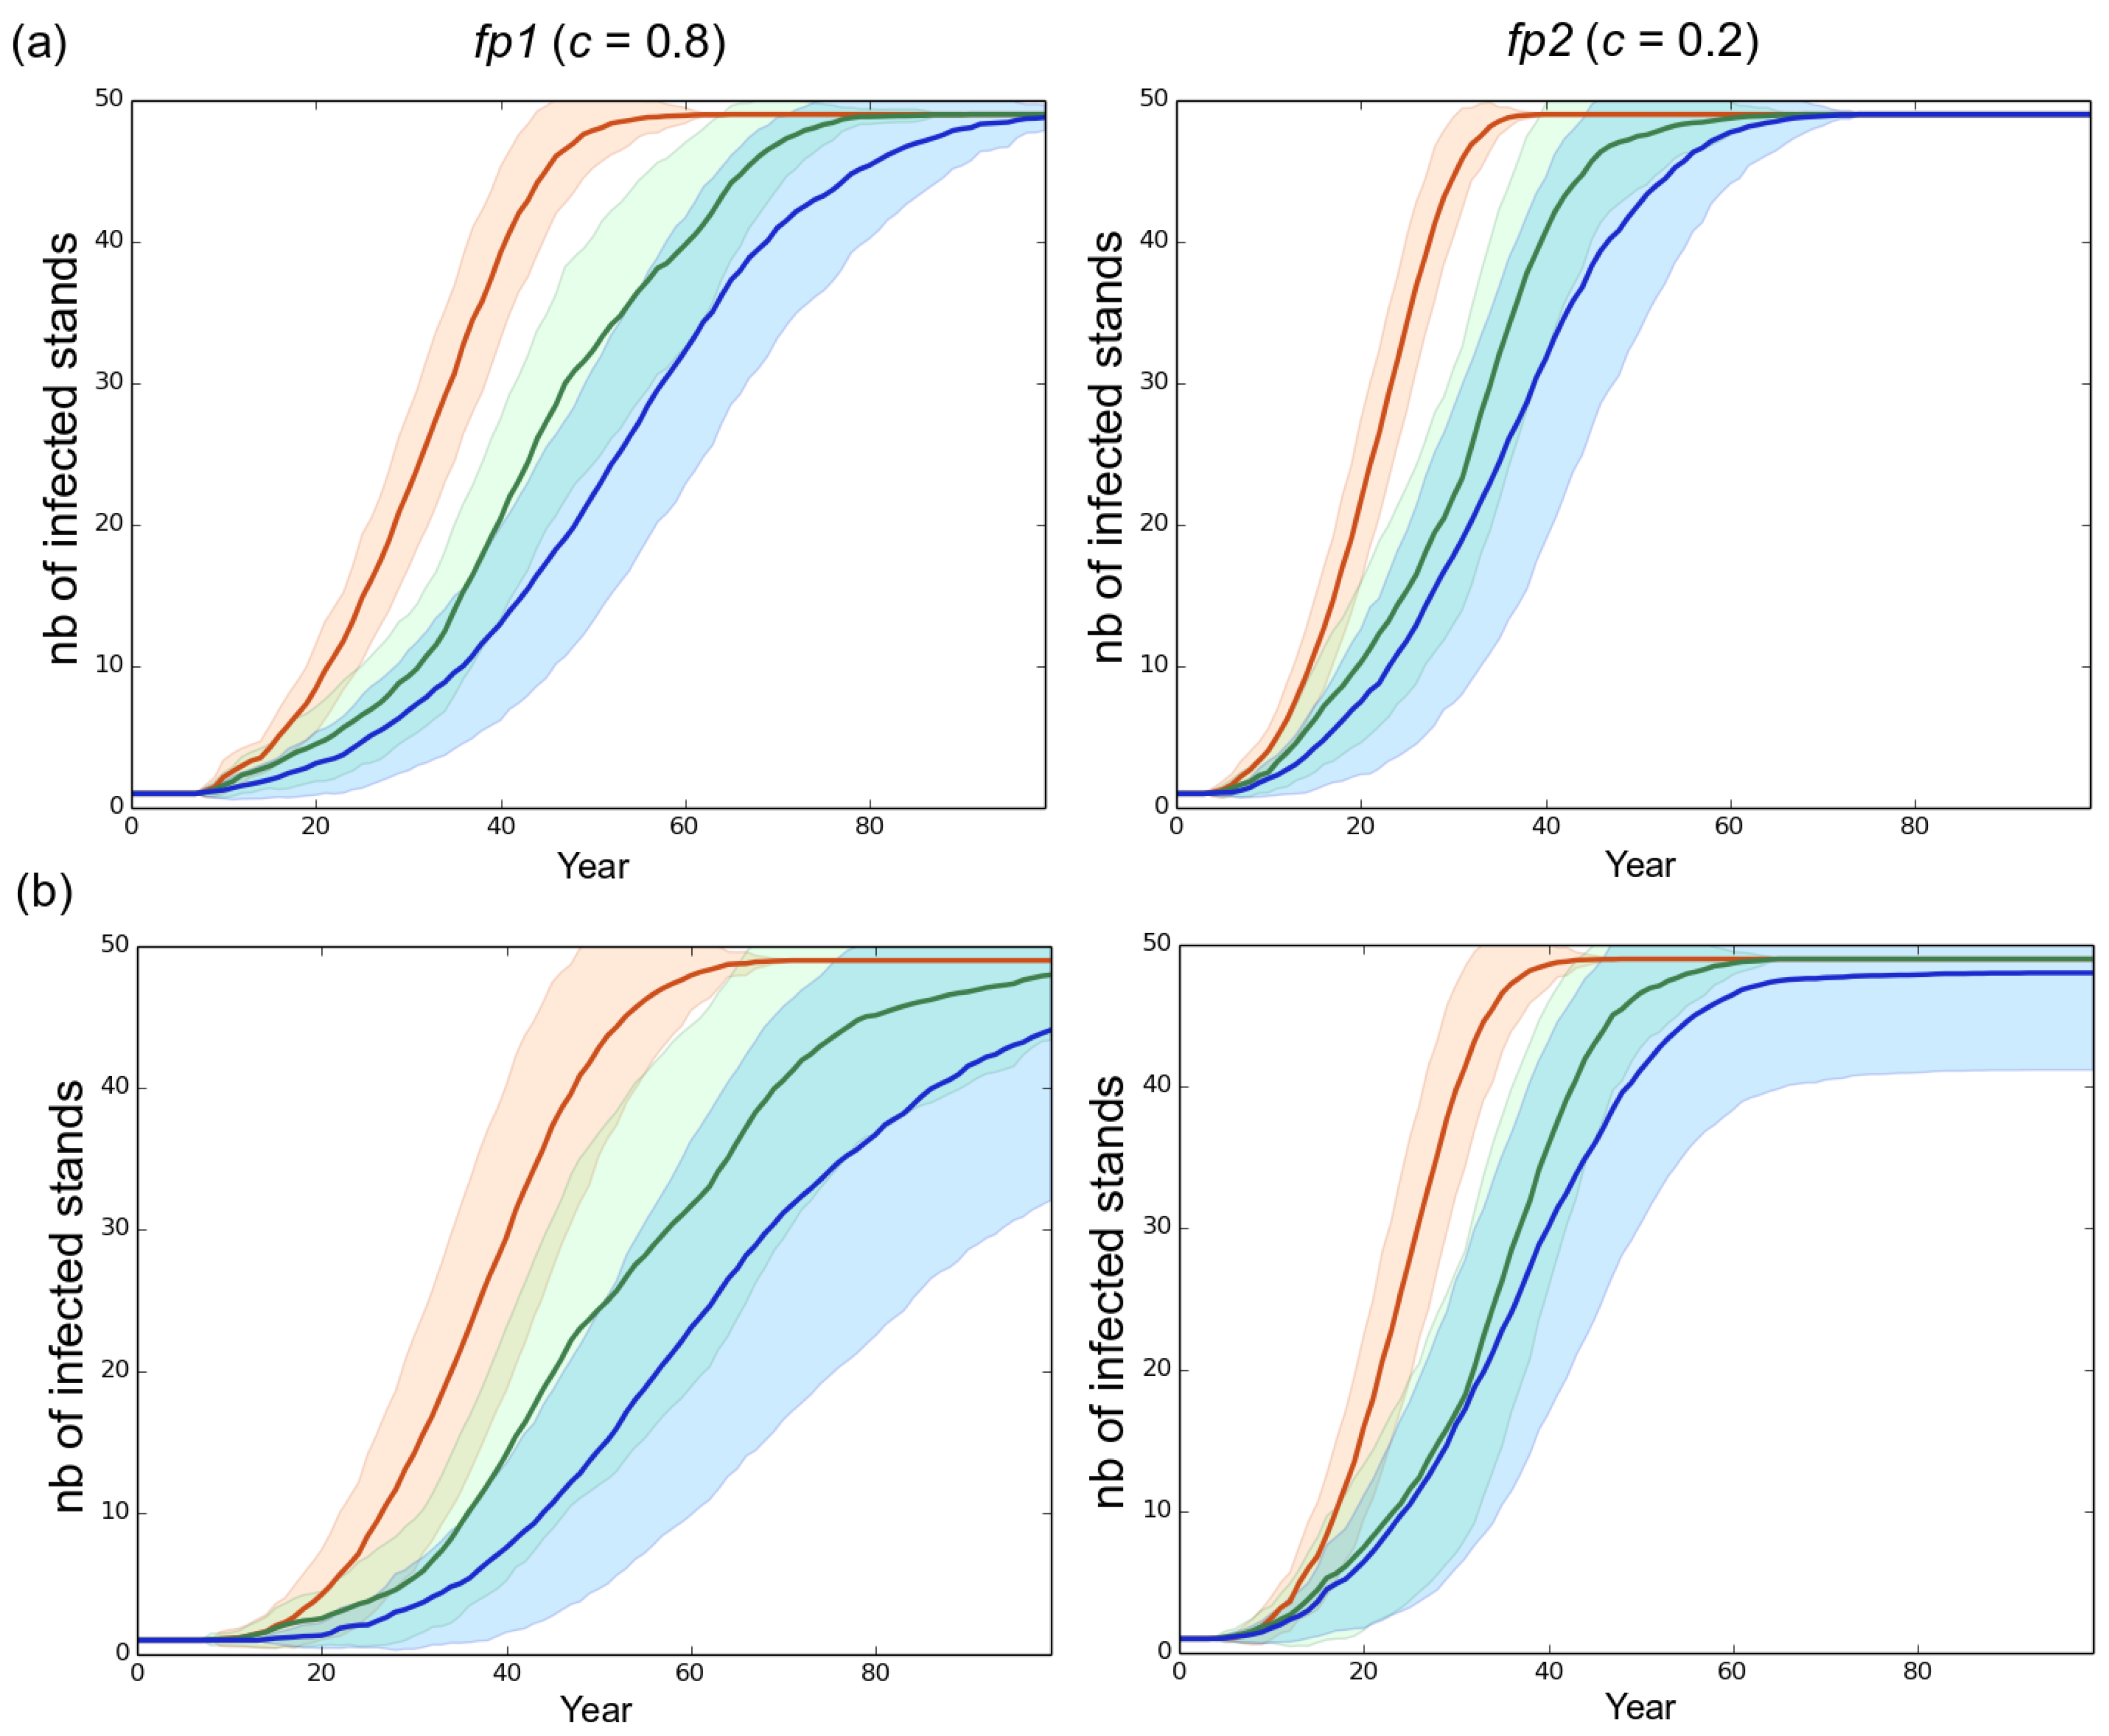
Figure 4.
Effect of the rotation length on virulence evolution. The genetic value is the sum of the allelic effects at the 10 loci involved in the variability of the trait. (a) high initial genetic variance of 4.06 in the starting fungal population (default scenario); (b) reduced initial genetic variance of 1.63 in the starting fungal population. Left column: mostly clonal fungal profile fp1 (clonality rate ). Right column: mostly sexual fungal profile fp2 (). Red, green and blue represent a rotation length of 15, 30 and 50 years, respectively. Each line is the mean of 50 independent replicates simulated. Each colored area corresponds to the standard deviation of the 50 replicates.

Figure 5.
Evolution of the genetic variance under different rotation lengths. The genetic variance was computed at the landscape scale. (a) high initial genetic variance of 4.06 in the starting fungal population (default scenario); (b) reduced initial genetic variance of 1.63 in the starting fungal population. Left column: mostly clonal fungal profile fp1 (clonality rate ). Right column: mostly sexual fungal profile fp2 (). Red, green and blue represent a rotation length of 15, 30 and 50 years, respectively. Each line is the mean of 50 independent replicates simulated. Each colored area corresponds to the standard deviation of the 50 replicates.


Figure 6.
Number of anticipated clear-cuttings operations. In our simulations, sanitary thinnings occurred at 15 and 32 years, i.e., at the juvenile–adult and adult–mature transitions, respectively. An anticipated clear-cutting operation was triggered (end of rotation) in a stand when the number of healthy trees remaining after thinning was lower than 150. (a) high initial genetic variance of 4.06 in the starting fungal population (default scenario); (b) reduced initial genetic variance of 1.63 in the starting fungal population. Left column: mostly clonal fungal profile fp1 (clonality rate ). Right column: mostly sexual fungal profile fp2 (). Green and blue represent a rotation length of 30 and 50 years respectively. Each line is the mean of 50 independent replicates simulated. Each colored area corresponds to the standard deviation of the 50 replicates simulated.


Table 1.
Variable parameters.
| Parameter | Value |
|---|---|
| Initial genetic variance | 1.63, 4.06 |
| Mean initial genetic value | 0.33, 0.77 |
| Asexuality rate c | 0.2, 0.8 |
| Rotation length in years | 15, 30, 50 |
Table 2.
Fixed parameters. J refers to juvenile, A to adult, M to mature.
| Parameter | Value |
|---|---|
| Number of stands | 49 |
| Tree age classes in years () | |
| Carrying capacities K of stands () | |
| Mean resistance levels R of stands | |
| Initial proportions in J, A and M stands | |
| Threshold before anticipated clear-cut | 150 |
| Size n of the initial fungal population | 10 |
| Optimal phenotype | 10 |
| Number of loci | 10 |
| Intensity of stabilizing selection | 20 |
| Mutation rate | |
| Mutational variance | |
| Recombination rate | 0.5 |
| Fecundity f | 5 |
| Ploidy p | 2 |
| Proportion of spores dispersed among stands | 5% |
© 2017 by the authors. Licensee MDPI, Basel, Switzerland. This article is an open access article distributed under the terms and conditions of the Creative Commons Attribution (CC BY) license (http://creativecommons.org/licenses/by/4.0/).
Share and Cite
MDPI and ACS Style
Soularue, J.-P.; Robin, C.; Desprez-Loustau, M.-L.; Dutech, C. Short Rotations in Forest Plantations Accelerate Virulence Evolution in Root-Rot Pathogenic Fungi. Forests 2017, 8, 205. https://doi.org/10.3390/f8060205
AMA Style
Soularue J-P, Robin C, Desprez-Loustau M-L, Dutech C. Short Rotations in Forest Plantations Accelerate Virulence Evolution in Root-Rot Pathogenic Fungi. Forests. 2017; 8(6):205. https://doi.org/10.3390/f8060205
Chicago/Turabian StyleSoularue, Jean-Paul, Cécile Robin, Marie-Laure Desprez-Loustau, and Cyril Dutech. 2017. "Short Rotations in Forest Plantations Accelerate Virulence Evolution in Root-Rot Pathogenic Fungi" Forests 8, no. 6: 205. https://doi.org/10.3390/f8060205
Note that from the first issue of 2016, this journal uses article numbers instead of page numbers. See further details here.