
Vitality Assessment of Visually Healthy Trees in Estonia


Institute of Forestry and Rural Engineering, Estonian University of Life Sciences, Kreutzwaldi 5, Tartu 51014, Estonia
*
Author to whom correspondence should be addressed.
Forests 2017, 8(7), 223; https://doi.org/10.3390/f8070223
Submission received: 4 April 2017
/
Revised: 16 June 2017
/
Accepted: 23 June 2017
/
Published: 26 June 2017
Abstract
:Root rots are considered the most important forest diseases in Estonia, causing serious concern in forest management. The majority of trees infected by forest pathogens lack easily-detectable visual symptoms, making it difficult to detect decay in a tree. We assessed the general health condition of visually healthy trees in intensively managed Norway spruce (Picea abies L. Karst.) and Scots pine (Pinus sylvestris L.) stands with resistography in order to identify trees infected by root rot. We found that 8.0% of Norway spruces and 1.6% of Scots pines had well-developed internal decay on the root collar regardless of having no external symptoms of root rot. Visually healthy trees growing on permanent forest land experienced more decay than trees growing on former agricultural land. The radial proportion of decay of damaged trees was 61% in Norway spruces and 35% in Scots pines. The results suggest that resistography can be used as a reliable method for tree vitality assessment.
1. Introduction
Modelling of forest stand dynamics depends on growth and mortality predictions of single trees. Tree vitality is often assessed visually in the course of forest inventories as an important indicator of forest condition [1]. Visual signs, including extraordinary leaf or needle loss of a tree and noticeable fruit bodies of fungi, may indicate problems with tree vitality, but often the symptoms of stem or root rot are difficult or impossible to detect visually [2,3]. Tree vitality is usually under-examined in forest inventories, as the use of more precise methods is labour-intensive and may be destructive to the examined trees. Suitable instruments for decay detection in standing trees are, for example, increment borers, acoustic tomographs, and micro-drills. Most likely, errors in assessment of tree vitality result in bias in predicting forest stand dynamics by assessing a higher probability of tree survival and higher growth rates of unhealthy trees than warranted.
The root rots caused by the pathogens Heterobasidion spp. and Armillaria spp. are considered to be the most important forest diseases in Europe (including Estonia), causing serious concern in forest management. According to State Register of the Forest Resource [4], visual estimation of decay on living standing trees shows that at least 16.8% of spruce stands and 0.3% of pine stands are affected by root rots in Estonia. Sims et al. [5] found that 17% of Scots pine and 12% of Norway spruce mortality in managed forests is directly caused by diseases, including root rots. For some wind-thrown trees, where wind-throw affected 10% of Scots pine and 26% of Norway spruce, the mortality may also indirectly be caused by root rot [6,7]. Root rot spreads in a stand by air- or soilborne propagules, creating clumps of infected trees. Neighbouring trees can be affected by soil movement via mycelia [8,9] and rhizomorphs [10], but the mycelium of Heterobasidion is not able to spread freely in the soil. The disease may inhibit nutrient and water flow by damaging or killing the roots, which ultimately leads to tree mortality and decreases in forest ecosystem health, resilience, and productivity [3,11,12,13]. The incidence of Heterobasidion root disease is higher in stands on former agricultural lands [14,15,16,17] and in stands growing in mineral soils with good water drainage and higher soil pH [18]. Managed forests are damaged by Heterobasidion root disease more often than unmanaged forests, as stumps created during thinning and harvesting operations provide a favourable entry point for infection with airborne fungal spores [14]. Armillaria root rot damage is more severe in stands with reduced soil fertility, a lower pH, and drier moisture regime [15].
The aims of this paper are (1) to study how often visually healthy trees in managed stands are infected by root diseases which cause internal decay; (2) to quantify how much the diseases influence tree growth; and (3) to assess how the incidence of a root rot in a tree depends on the former land use and on the main tree species in a stand.
2. Materials and Methods
This study was carried out in intensively managed forest stands in Southern Estonia on permanent sample plots belonging to the Estonian Network of Forest Research Plots (ENFRP). The ENFRP was started in 1995 to collect long-term empirical data from Estonian forests [19]. A large amount of different tree- and stand-level measurements have been collected, including the species, diameter at breast height, height of trees measured, evidence of damage (mechanical, wind, moose, deer, cold, resin flows, etc.), and are re-measured every five years. All studied sample plots were in high-productivity stands. Ten sample plots were in Norway spruce stands growing in Oxalis site type, and ten sample plots in Scots pine stands in Rhodococcum site type. Site type classification follows Lõhmus [20]. Using historical background maps (1894–1922), the sample plots were selected on historical forestland and on former agricultural land on an equal basis.
This study uses data of trees from 20 sample plots. The age of the studied stands was 29–95 years. On each sample plot, at least ten randomly selected visually healthy trees were studied. For decay detection, all sampled trees were drilled once at the root collar, mostly throughout the tree (up to 450 mm depth). Drillings were carried out with the non-destructive micro-drill RESISTOGRAPH® 4450-P/S which, by measuring the power consumption, allows the detection of tree density changes caused by decay [21]. In case decay occurred in a tree, up to four visually healthy neighbouring coniferous trees growing at a distance of up to five meters from the sample tree were also drilled to describe clumping of decayed trees. Altogether, 238 (113 Norway spruce and 125 Scots pine) sample trees and 34 (29 Norway spruce and 5 Scots pine) neighbouring trees were tested. The exact pathogen species causing the decay was not identified in this study. Most likely, decay was caused by Heterobasidion spp. and/or Armillaria spp., since these pathogens are the most common root rot-causing fungi in Estonia [22].
The resistograph profiles of drilled trees were analysed using the Rinntech e.K. Decom™ Scientific program to determine decayed trees (Figure 1). In order to detect the exact areas of decay as accurately as possible, a specific algorithm was written in Microsoft® Visual FoxPro®. For every point of the drilling profile, the algorithm compares the mean value of the drilling measure five mm before and after the point. Then, it searches the maximum difference between the mean values before and after the point at two cm width ranges and establishes the area where the mean values differ from each other the most. This method identifies the decayed area more precisely than visual evaluation of the drilling profile.
To evaluate the clumping of decayed neighbouring trees, the decay mingling index—which is based on the deadwood mingling index [23] and the species mingling index [24]—was used. We calculated the decay mingling index of a reference tree with decay (Equation 1) to assess the proportion of the n nearest neighbours j of a reference tree i:
where = 1, if the neighbouring tree also had decay
0, if the neighbouring tree was healthy
With three neighbours, for example, NMi holds four values: 0, 0.33, 0.67, and 1. The larger the mean index, the more neighbouring trees are decayed and the higher is the clumping of decayed trees.
The link between decay at root collar and former land use and main tree species was tested using the general linear model with glmer function in R environment [25]. The occurrence of decay in a tree was considered as the function characteristic which was given binary values of 0 and 1.
To examine how decay affects tree radial growth, the growth of healthy and decayed trees was assessed. The diameters of ten trees from each species with well-developed decay were chosen from the data of the last four inventories. Drilled trees without decay and diameters similar to the diameters of trees with well-developed decay were chosen for comparison. As the number of decayed trees of Scots pine was insufficient, we included additional data from Oxalis site type for Scots pine (eight trees). To assess the statistical significance, a one-tailed t-test was used, where p-value ≤0.05 was considered as statistically significant.
For all drilled trees, the relative diameters of root collars were calculated to define if internally decayed trees, on average, were larger than the drilled trees. A tree was larger than the average drilled tree if its relative diameter value exceeded 1.0. All arithmetic means are presented with ± standard deviations in this study.
3. Results
Data analysis showed well-developed decay (see Figure 1 as an example) in 8.0 ± 2.9% of visually healthy Norway spruces and in 1.6 ± 1.4% of visually healthy Scots pines. Decay was found in Norway spruce in 50–66-year-old stands and in Scots pines in 94–95-year-old stands (Table 1). The percentage of drilled trees with detected decay varied from 6.2% to 33.3% on plots where trees were damaged with root rot. According to visual evaluation, these forest stands had up to 25.2% of dead trees and 1.9–12.9% of damaged trees. On plots where no root rot was found in drilled trees, forest stands had 1.5–24.2% of dead trees and up to 20.5% of damaged trees. The overall condition of pine stands was better, as the average amount of dead trees (5.3 ± 5.2%) and damaged trees (1.1 ± 1.5%) was lower than in spruce stands (10.4 ± 9.5% and 11.6 ± 5.0%).
Norway spruces were significantly more often decayed than Scots pines (p = 0.035). The relative diameter of the root collar of decayed trees was 1.08 ± 0.32 in Norway spruces and 1.16 ± 0.27 in Scots pines, showing that in both species the diameter of decayed trees was somewhat larger than the average diameter of all drilled trees.
Scots pines growing on historical forestland had 1.7 ± 1.6% decayed trees, and on former agricultural land there were 1.5 ± 1.7% decayed trees. Norway spruces growing on historical forestland had 13.1 ± 5.9% decayed trees and 1.9 ± 1.7% decayed trees in stands on former agricultural land. Norway spruce trees growing on historical forestland were significantly more often decayed than spruce growing on former agricultural land (p = 0.026).
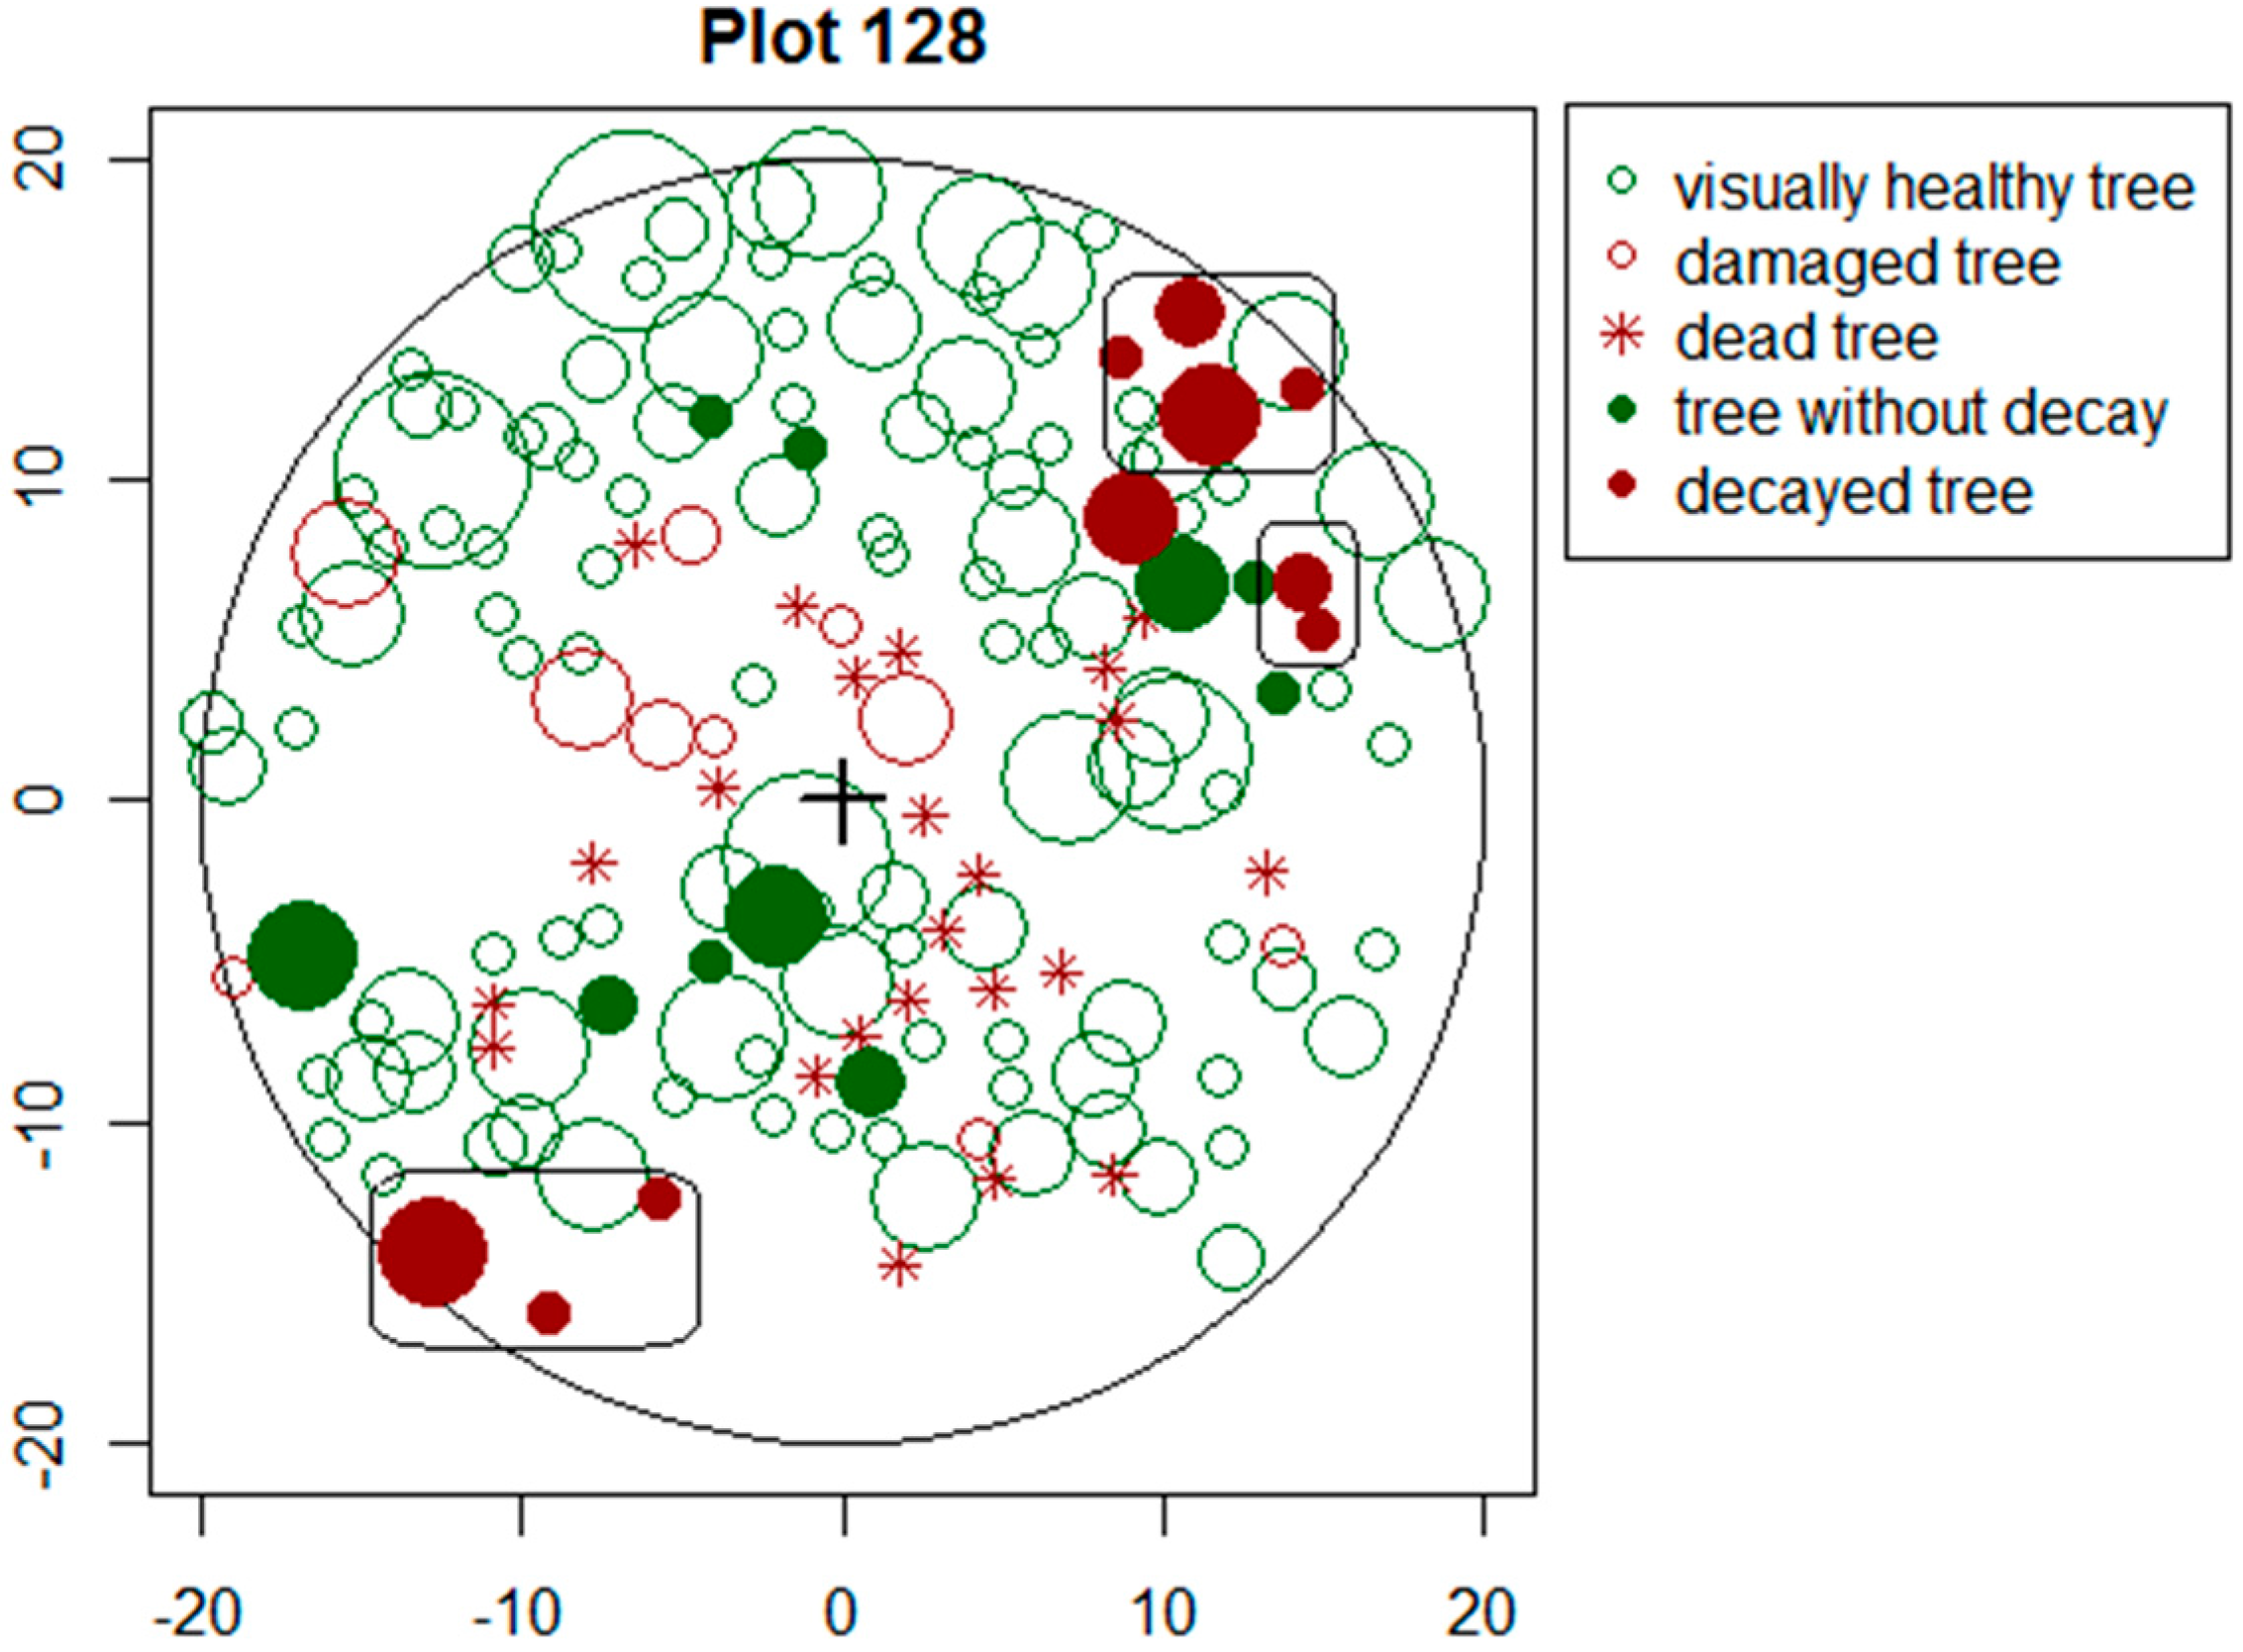
The assessment of clumping of decayed trees showed that in 60% of the cases at least one of the sampled neighbouring trees also had well-developed decay. The average decay mingling index of trees was 0.36, indicating a substantial spread of root rot in visually healthy trees. Norway spruce had more clumping (NMi = 0.42) of decayed trees than Scots pine (NMi = 0.13).
The extent of decay in Norway spruce was higher than in Scots pine; the radial proportion of decay was 61.1 ± 16.1% and 35.5 ± 26.1%, respectively. Norway spruce was mostly damaged by central decay, and Scots pine by peripheral decay. The growth of visually healthy trees with root rot was 21% smaller for Norway spruce and 13% smaller for Scots pine compared to the trees without decay. Although the extent of decay in visually healthy trees was relatively large, especially in Norway spruce, and could have influenced tree growth, we did not find statistically significant differences between the diameter growth of trees with root rot and healthy trees (Norway spruce, p = 0.22; Scots pine, p = 0.09).
4. Discussion
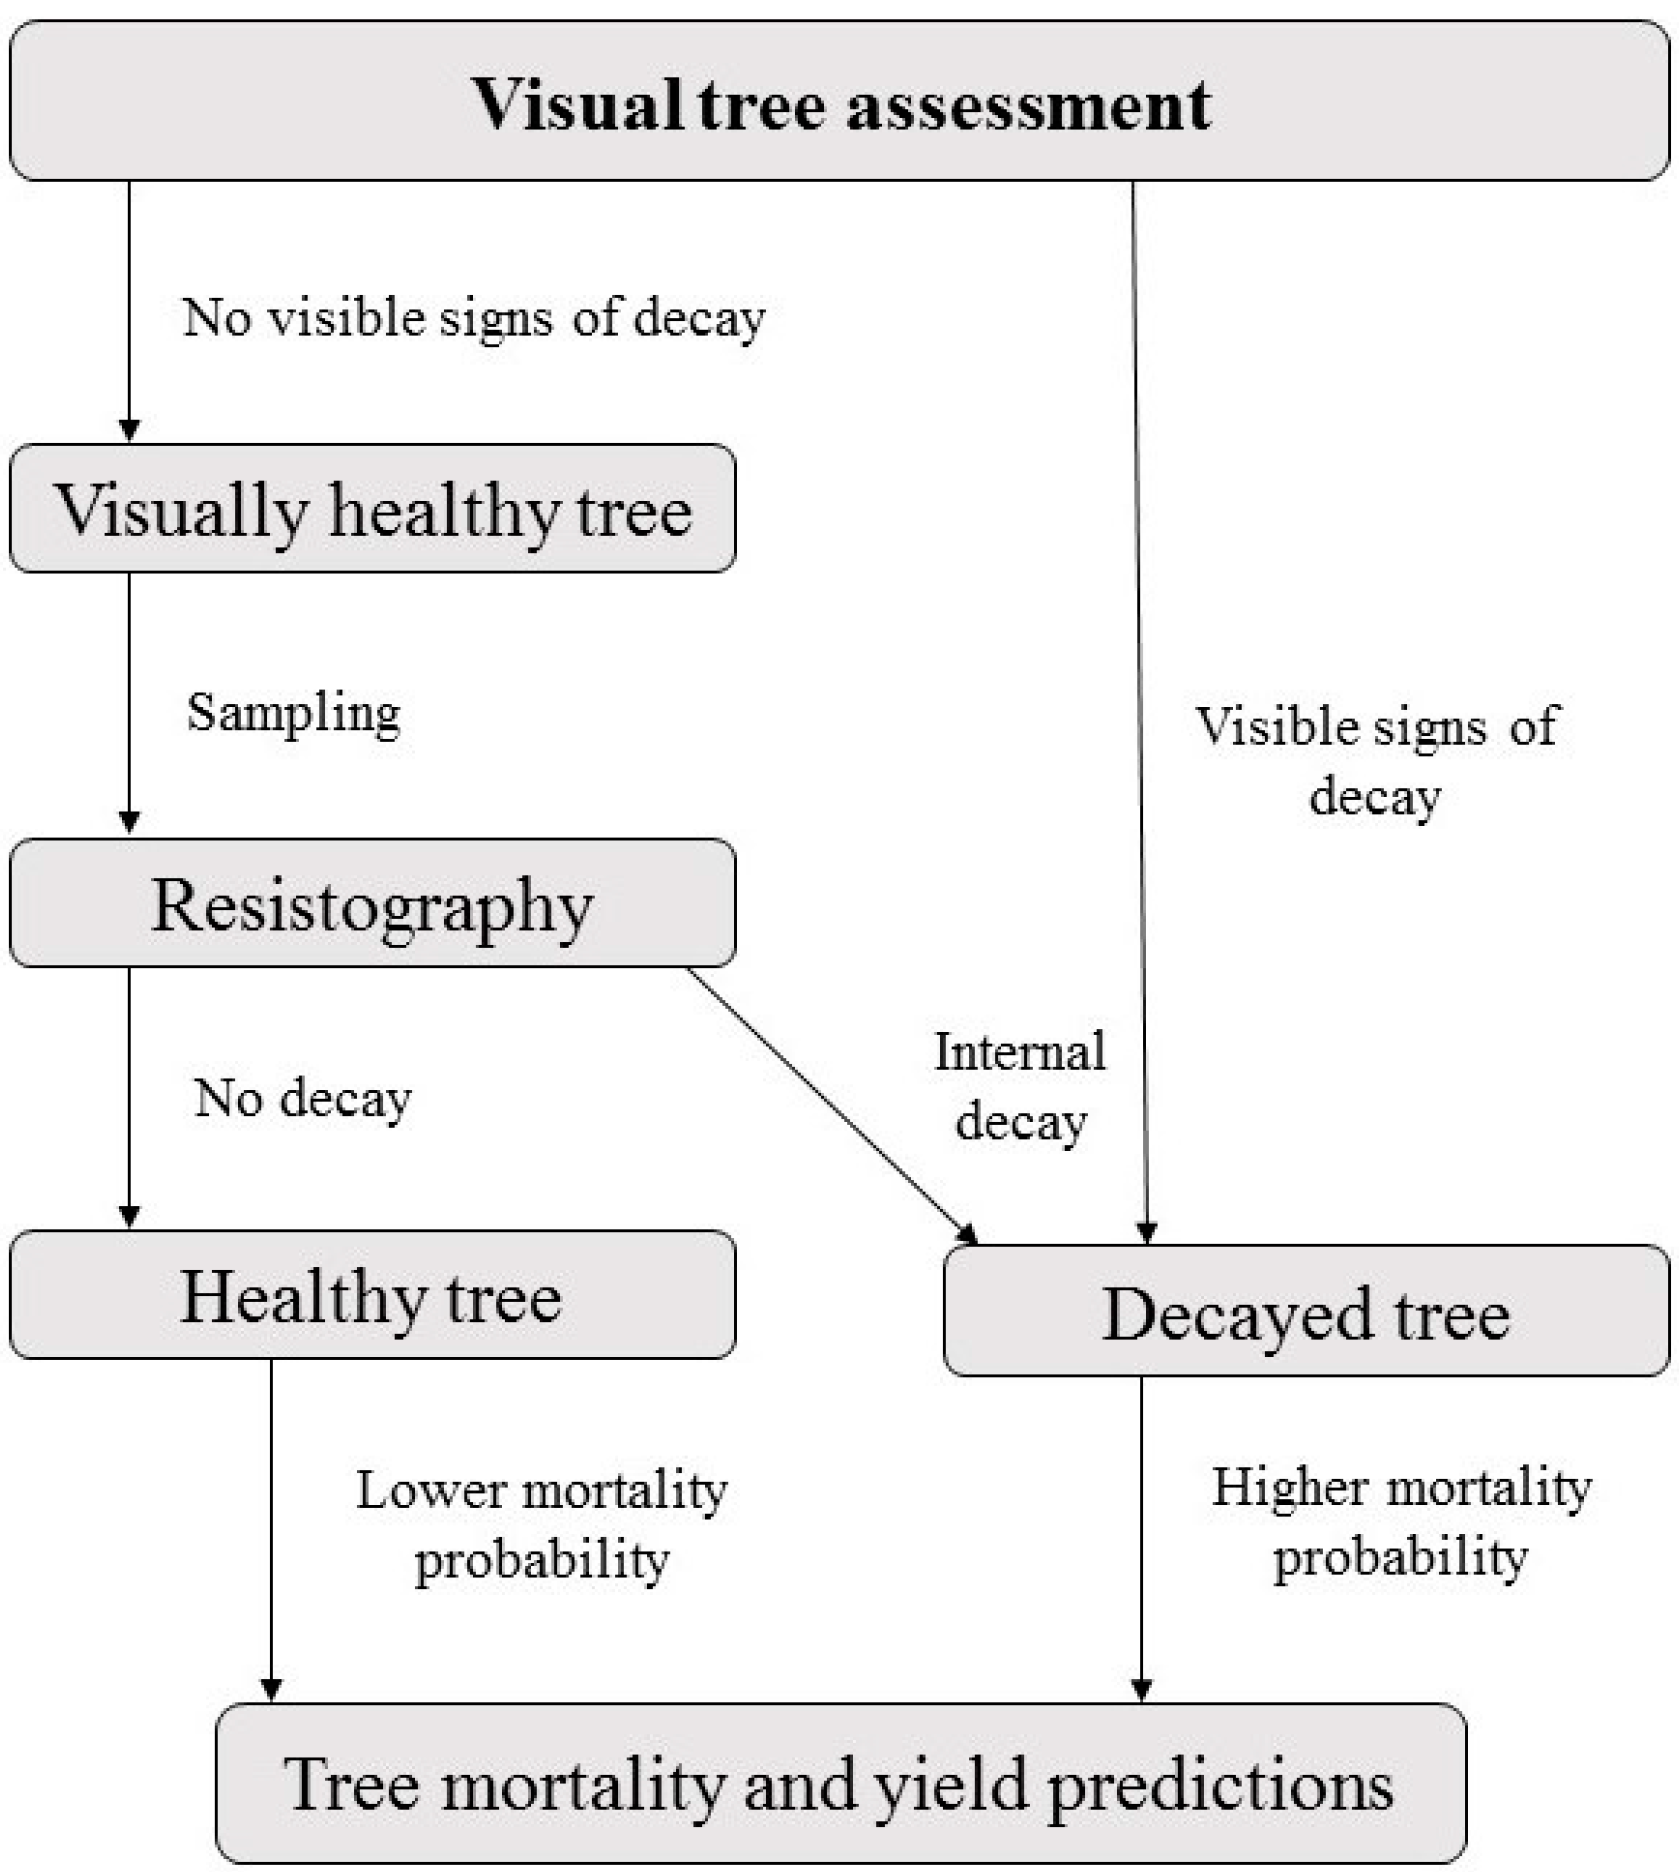
The tree vitality assessment with resistography showed that a considerable proportion of visually healthy conifers can be infected with root diseases in Estonia. Externally healthy Norway spruce trees were decayed more frequently and heavily compared to Scots pines. The overall visual condition of spruce stands was also poorer than pine stands. Some signs, such as the proportion of dead or damaged trees, can indeed indicate disease in a stand, especially when basidiocarps of pathogenic fungi appear. In such a case, it can be assumed that some visually healthy trees are internally decayed. However, symptoms do not confirm the existence of decay in trees. In cases where the visual condition of a stand is good and no signs directly indicate disease in the stand, our results suggest that tree vitality assessment requires the internal assessment of visually healthy trees with micro-drills. Forest models are used for the assessment of timber product yields [26], but with visual assessment of disease only, the proportion of decayed trees can be underestimated and probably leads to miscalculation of tree mortality and ultimately inaccurate yield predictions (Figure 2).
Although some studies have stated that decayed trees tend to grow more slowly than healthy trees [12,27], we could not discover any significant reductions in the diameter growth of decayed trees, similarly to Oliva et al. [7]. There could be many possible reasons. We can speculate that at a certain stage of a disease or age of a tree, root disease does not influence tree growth. Another reason could be that, even if drillings at the root collar did not indicate that trees were decayed, the root system of trees may have been infected and the growth of “healthy” trees reduced (i.e., a false negative result). Wang et al. [28] showed that growth loss will significantly increase, even when only a small percentage of roots are infected by root pathogens. The study by Laarmann et al. [23] found that the probability of trees dying due to diseases in Estonia is higher in trees with a larger relative diameter at breast height. Our study showed that in both species the diameter of damaged trees was relatively larger than the average diameter of all drilled trees.
If a notable proportion of decayed trees are clumped (Figure 3), it is very likely that the stand is infected with root diseases which have spread to neighbouring trees via root contacts. Our study showed decayed trees to be considerably clumped, as in 60% of the cases at least one neighbouring trees had internal decay. In Norway spruce stands, clumping was more severe, indicating that infections through root contacts in Norway spruce stands may be more likely or trees for some reasons more susceptible to pathogens.
Many studies from Europe [15,16,17] show that stands that are established on post-agricultural lands are highly susceptible to Heterobasidion root rot because the microbes in soils in arable land are not as diverse as in forest soils and the spread of pathogens is less well prevented. In our case, it appeared that the stands located on former agricultural land were much less damaged by diseases than the stands on historical forestland. This result draws attention to the fact that not only can forests growing on former arable lands be heavily threatened by root diseases, but also those on historical forestlands. Many stands located in historical forestland could have been infected by root rots in previous forest generations.
A notable portion of trees that have been visually assessed as healthy are actually internally damaged by root rot; therefore, visual assessment cannot be considered as a reliable method for tree vitality assessment. Rapid vitality assessment of trees with more advanced methods like resistography is the feasible way to allocate the proportion of decayed trees among visually healthy ones. The method itself may be more suitable for assessing the health condition of Norway spruce rather than Scots pine stands. In the case of spruce, decay spreads in the heartwood and may develop into butt rot without any visual symptoms. In Scots pine, the situation is different, as the decay is often limited to the roots [22] and thereby cannot be seen on the resistograph drilling profiles. If the decay has progressed to the stem of the tree, however, visual symptoms will appear in the crown. In addition, with the resistography method, two important disadvantages may appear: (1) as the radial proportion of decay was high, there remains the possibility that small-sized, incipient decay cannot be detected by microdrills; (2) decay in a tree may remain undetected due to the location of the drilling hole, as the drill may miss the rot column. The same problem occurs with increment borers [29]. Applying resistography in large-scale inventories is not easy, as the system may be a little heavy to carry and its use is somewhat time-consuming. Nevertheless, the resistograph is definitely a useful device for assessing tree internal conditions. However, a simple mobile device based on the same method as resistography could be invented in the near future.
5. Conclusions
Despite the lack of visual symptoms of internal damage, visually healthy trees in managed Norway spruce and Scots pine stands had well-developed decay on the root collar. Using resistography, we found that 8.0 ± 2.9% of Norway spruce and 1.6 ± 1.4% of Scots pine trees had decay. Norway spruces were significantly more often decayed than Scots pines. The radial proportion of decay was 61.1 ± 16.1% in Norway spruces and 35.5 ± 26.1% in Scots pines, and the decay was more present in trees with a larger diameter. A resistograph is useful for allocating the proportion of decayed trees among visually healthy ones, necessary for more accurate growth modelling. Simpler devices which are easy to carry around in forests would allow this approach to become operationally feasible.
Acknowledgments
We thank numerous fieldworkers and technical persons for their input in data collection. We thank John Stanturf for his help in preparing the manuscript. Data collection in the ENFRP was supported by the Estonian Environmental Investment Centre.
Author Contributions
Eneli Allikmäe, Diana Laarmann and Henn Korjus designed the study; Eneli Allikmäe did fieldwork; Eneli Allikmäe, Diana Laarmann and Henn Korjus analysed the data and wrote the paper.
Conflicts of Interest
The authors declare no conflict of interest. The founding sponsors had no role in the design of the study; in the collection, analyses, or interpretation of data; in the writing of the manuscript, and in the decision to publish the results.
References
- Innes, J.L. Forest Health: Its Assessment and Status; CAB International: Wallingford, UK, 1993. [Google Scholar]
- Vollbrecht, G.; Agestam, E. Identifying butt rotted Norway spruce trees from external signs. For. Landsc. Res. 1995, 1, 241–254. [Google Scholar]
- Laflamme, G. Root diseases in forest ecosystems. Can. J. Plant Pathol. 2010, 32, 68–76. [Google Scholar] [CrossRef]
- Sims, A.; Mändma, R.; Laarmann, D.; Korjus, H. Assessment of tree mortality on the Estonian Network of Forest Research Plots. For. Stud. 2014, 60, 57–68. [Google Scholar]
- State Register of the Forest Resource. Estonia: Database Query about Forest Damages by Main Tree Species and Damaging Agent in Estonia. 2015. Available online: http://register.metsad.ee/avalik/ (accessed on 9 June 2017).
- Shaw, D.C.; Franklin, J.F.; Bible, K.; Klopatek, J.; Freeman, E.; Greene, S.; Parker, G.G. Ecological setting of the Wind River old-growth forest. Ecosystems 2004, 7, 427–439. [Google Scholar] [CrossRef]
- Oliva, J.; Samils, N.; Johansson, U.; Bendz-Hellgren, M.; Stenlid, J. Urea treatment reduced Heterobasidion annosum s.l. root rot in Picea abies after 15 years. For. Ecol. Manag. 2008, 255, 2876–2882. [Google Scholar] [CrossRef]
- Stenlid, J.; Redfern, D.B. Spread within the tree and stand. In Heterobasidion Annosum: Biology, Ecology, Impact and Control; Woodward, S., Stenlid, J., Karjalainen, R., Hüttermann, A., Eds.; CAB International: Wallingford, UK, 1998. [Google Scholar]
- Garbelotto, M.; Gonthier, P. Biology, epidemiology, and control of Heterobasidion species worldwide. Annu. Rev. Phytopathol. 2013, 51, 39–59. [Google Scholar] [CrossRef] [PubMed]
- Warren, G.R.; Baines, P.S. Armillaria root disease: A hidden enemy exposed by dendrochronology. In Proceedings of the Forest Pest Management Forum, Gatineau, QC, Canada, 2–4 December 2008; pp. 161–185. [Google Scholar]
- Shaw, C.G.; Toes, E.H.A. Growth reduction of Dothistroma needle blight and Armillaria root rot on diameter growth of Pinus radiata. Phytopathology 1977, 67, 1319–1323. [Google Scholar] [CrossRef]
- Bendz, M.; Stenlid, J. Long-term reduction in the diameter growth of butt rot affected Norway spruce, Picea abies. For. Ecol. Manag. 1994, 74, 239–243. [Google Scholar]
- Omdal, D.W.; Shaw, C.G.; Jacobi, W.R. Symptom expression in conifers infected with Armillaria ostoyae and Heterobasidion annosum. Can. J. For. Res. 2004, 34, 1210–1219. [Google Scholar] [CrossRef]
- Risbeth, J. Observations on the biology of Fomes annosus, with particular reference to East Anglian pine plantations. I. The outbreaks of disease and ecological status of the fungus. Ann. Bot. 1950, 14, 365–383. [Google Scholar] [CrossRef]
- Hanso, M.; Hanso, S. Spread of Heterobasidion annosum in forests of Estonia. For. Stud. 1999, 31, 162–172, (In Estonian with an English Summary). [Google Scholar]
- Rönnberg, J.; Petrylaitė, E.; Nilsson, G.; Pratt, J. Two studies to assess the risk to Pinus sylvestris from Heterobasidion spp. in southern Sweden. Scand. J. For. Res. 2006, 21, 405–413. [Google Scholar] [CrossRef]
- Sierota, Z. Heterobasidion root rot in forests on former agricultural lands in Poland: Scale of threat and prevention. Acad. J. 2013, 8, 2298–2305. [Google Scholar]
- Korhonen, K.; Stenlid, J. Biology of Heterobasidion annosum. In Heterobasidion annosum: Biology, Ecology, Impact and Control; Woodward, S., Stenlid, J., Karjalainen, R., Hüttermann, A., Eds.; CAB International: Wallingford, UK, 1998. [Google Scholar]
- Kiviste, A.; Hordo, M.; Kangur, A.; Kardakov, A.; Laarmann, D.; Lilleleht, A.; Metslaid, S.; Sims, A.; Korjus, H. Monitoring and modeling of forest ecosystems: The Estonian Network of Forest Research Plots. For. Stud. 2015, 62, 26–38. [Google Scholar]
- Lõhmus, E. Eesti Metsakasvukohatüübid; Tartu Loodusfoto: Tartu, Estonia, 2004. [Google Scholar]
- Rinn, F. Resistographic visualization of tree-ring density variations. In Tree-rings, Environment and Humanity, Proceedings of the International Conference, Tucson, AZ, USA, 17–21 May 1994; Dean, J.S., Meko, D.M., Swetnam, T.W., Eds.; University of Arizona: Tucson, AZ, USA, 1996; pp. 871–878. [Google Scholar]
- Hanso, M.; Hanso, S. On the root rot fungi in the forests of Estonia. For. Stud. 1999, 31, 141–161. [Google Scholar]
- Laarmann, D.; Korjus, H.; Sims, A.; Stanturf, J.A.; Kiviste, A.; Köster, K. Analysis of forest naturalness and tree mortality patterns in Estonia. For. Ecol. Manag. 2009, 258, 187–195. [Google Scholar] [CrossRef]
- Gadow, K.V. Zur Bestandesbeschreibung in der Forsteinrichtung. Forst. Hols 1993, 48, 602–606. [Google Scholar]
- R Core Team. R: A Language and Environment for Statistical Computing; R Foundation for Statistical Computing: Vienna, Austria, 2017; Available online: http://www.R-project.org/ (accessed on 2 April 2017).
- Eastaugh, C.S.; Kangur, A.; Korjus, H.; Kiviste, A.; Zlatanov, T.; Velichkov, I.; Srdjevic, B.; Srdjevic, Z.; Hasenauer, H. Scaling issues and constraints in modelling of forest ecosystems: A review with special focus on user needs. Balt. For. 2013, 19, 316–330. [Google Scholar]
- Bendz-Hellgren, M.; Stenlid, J. Decreased volume growth of Picea. abies in response to Heterobasidion annosum infection. Can. J. For. Res. 1997, 27, 1519–1524. [Google Scholar] [CrossRef]
- Wang, L.; Zhang, J.; Drobyshev, I.; Cleary, M.; Rönnberg, J. Incidence and impact of root infection by Heterobasidion spp., and the justification for preventative silvicultural measures on Scots pine trees: A case study in southern Sweden. For. Ecol. Manag. 2014, 315, 153–159. [Google Scholar] [CrossRef]
- Thor, M.; Ståhl, G.; Stenlid, J. Modelling root rot incidence in Sweden using tree, site and stand variables. Scand. J. For. Res. 2005, 20, 165–176. [Google Scholar] [CrossRef]
Figure 1.
A resistography drilling profile of a tree with well-developed decay.
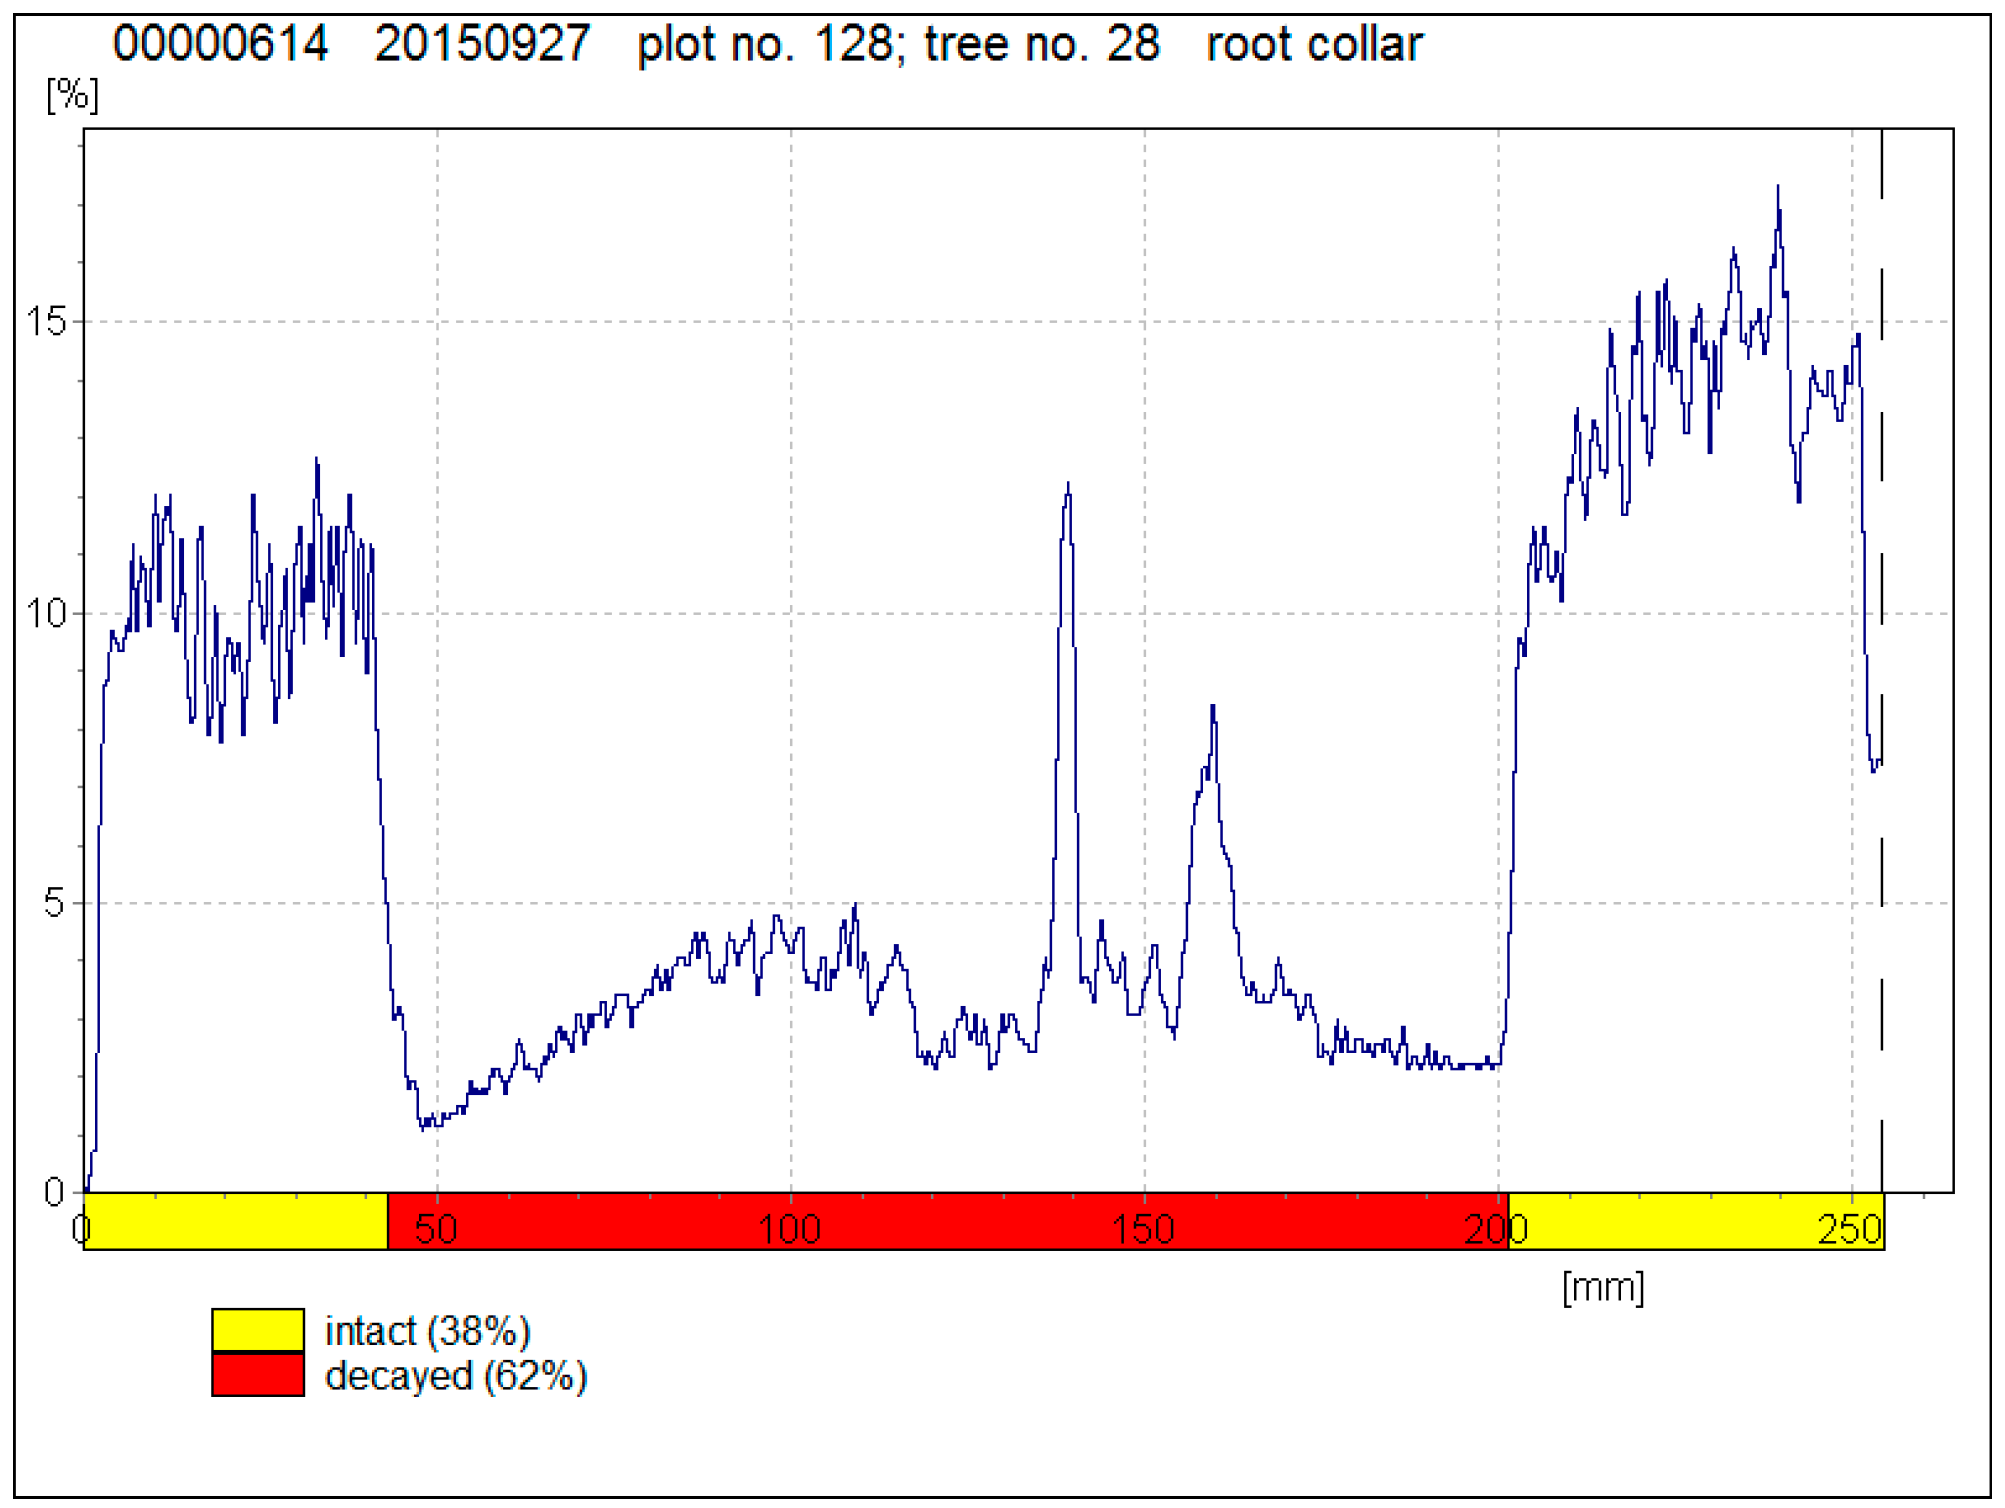
Figure 2.
When assessing tree vitality only visually, tree mortality and yield predictions may be strongly under- or overestimated.
Figure 2.
When assessing tree vitality only visually, tree mortality and yield predictions may be strongly under- or overestimated.

Figure 3.
Clumping of decayed trees on sample plot No. 128 (x-and y-axis show distance (m) from centre).
Figure 3.
Clumping of decayed trees on sample plot No. 128 (x-and y-axis show distance (m) from centre).

Table 1.
General characteristics of plots with root rot damage in visually healthy trees.
| Plot No. | Dominant Tree Species | Stand Age (Year) | Stand Height (m) | Stand Diameter at Breast Height (cm) | Proportion of Trees with Root Rot (%) | Proportion of Dead Trees in the Stand (%) | Proportion of Visually Detected Damaged Trees in the Stand (%) |
|---|---|---|---|---|---|---|---|
| 133 | Norway spruce | 66 | 24.9 | 25.1 | 33.3 | 9.8 | 12.9 |
| 128 | Norway spruce | 50 | 22.5 | 19.9 | 30.0 | 10.7 | 5.4 |
| 135 | Norway spruce | 55 | 23.9 | 24.1 | 10.0 | 9.2 | 12.8 |
| 414 | Norway spruce | 56 | 25.9 | 22.3 | 10.0 | 25.2 | 5.9 |
| 347 | Scots pine | 95 | 30.7 | 31.0 | 8.3 | 1.6 | 4.1 |
| 351 | Scots pine | 94 | 32.0 | 30.5 | 6.2 | 0.0 | 1.9 |
© 2017 by the authors. Licensee MDPI, Basel, Switzerland. This article is an open access article distributed under the terms and conditions of the Creative Commons Attribution (CC BY) license (http://creativecommons.org/licenses/by/4.0/).
Share and Cite
MDPI and ACS Style
Allikmäe, E.; Laarmann, D.; Korjus, H. Vitality Assessment of Visually Healthy Trees in Estonia. Forests 2017, 8, 223. https://doi.org/10.3390/f8070223
AMA Style
Allikmäe E, Laarmann D, Korjus H. Vitality Assessment of Visually Healthy Trees in Estonia. Forests. 2017; 8(7):223. https://doi.org/10.3390/f8070223
Chicago/Turabian StyleAllikmäe, Eneli, Diana Laarmann, and Henn Korjus. 2017. "Vitality Assessment of Visually Healthy Trees in Estonia" Forests 8, no. 7: 223. https://doi.org/10.3390/f8070223
Note that from the first issue of 2016, this journal uses article numbers instead of page numbers. See further details here.