
Measurement of Within-Season Tree Height Growth in a Mixed Forest Stand Using UAV Imagery


1
Department of Geographical Sciences, University of Maryland, College Park, MD 20740, USA
2
University of Applied Forest Sciences Rottenburg, Schadenweilerhof, 72108 Rottenburg am Neckar, Germany
3
Institute of Botany, Forest Ecology and Remote Sensing Group, University of Hohenheim, Garbenstr. 30, 70599 Stuttgart, Germany
*
Author to whom correspondence should be addressed.
Forests 2017, 8(7), 231; https://doi.org/10.3390/f8070231
Submission received: 13 April 2017
/
Revised: 8 June 2017
/
Accepted: 24 June 2017
/
Published: 29 June 2017
Abstract
:Tree height growth measurements at monthly and annual time scales are important for calibrating and validating forest growth models, forest management and studies of forest ecology and biophysical processes. Previous studies measured the terminal growth of individual trees or forest stands at annual or decadal time scales. Short-term, within-season measurements, however, are largely unavailable due to technical and practical limitations. Here, we describe a novel approach for measuring within-season tree height growth using a time series of co-registered digital surface models obtained with a low-cost unmanned aerial vehicle in combination with ground control plates and Structure from Motion data processing. The test site was a 2-hectare temperate mixed forest stand of varying age and successional stage in central Europe. Our results show median growth rates between 27 May and 19 August of 68 cm for Norway spruce, 93 cm for Scots pine, 106 cm for Silver birch and 26 cm for European beech. The results agree well with published field observations for these species. This study demonstrates the capability of inexpensive, increasingly user-friendly and versatile UAV systems for measuring tree height growth at short time scales, which was not previously possible, opening up new avenues for investigation and practical applications in forestry and research.
1. Introduction
Tree height growth is a key parameter for many ecological and biophysical processes and is important for forest management, site assessments, planning forestry interventions, assessing and predicting wood volume and biomass and for carbon sequestration model calibration and validation [1,2,3]. Tree growth is affected by climate change through shifts in the onset of the active growth period of trees, changes in ambient temperature and the temperature sum [4]. The authors of [5,6] studied the possible effects of climate change on the daily and monthly height growth of trees using closed growth chambers, mathematical models and field data of relatively small trees which can be measured using poles. Efficient methods for measuring tree height growth of larger numbers of taller trees or of entire forest stands under real-world conditions and at short temporal intervals that could be used for model calibration and validation are lacking and corresponding data are rarely available. Tree growth in response to variable environmental conditions is also studied using growth rings in the xylem, which result from distinctly different growth rates between the summer and winter seasons. In the tropics, many trees do not form annual growth rings, preventing their use for analyzing intra-seasonal tree growth. These kinds of data for tropical forests are instead collected using periodic field measurements of breast height diameter and tree height or remote sensing techniques at multiple year intervals [7].
Measurements of tree height growth at high temporal and spatial resolution are rare because ground-based measurements are time consuming, particularly at the forest stand or larger level and over shorter time intervals. Traditional remote sensing methods of measuring tree height growth are based on the manual interpretation of aerial photographs using photogrammetry and typically use data acquired at time steps of several years or even decades. Annual growth rates are calculated as averages over these time spans [8,9]. Measurements of growth rates within the same growing season are rarely described in the literature and focus on individual trees. For example, [10] used a terrestrial laser scanner to measure the monthly growth rate of 58 individual Nordic maple (Acer platanoides). Other studies have measured tree growth within forest plots annually using measuring poles and laser altimeters [11] or calculated average annual growth from ground-based forest inventories several years apart [12]. In general, field measurements of tree height with triangulation methods using laser range finders and clinometers are labor intensive and may contain errors of 1 to 5 m or more, largely due to the limited visibility of tree tops in forests [13,14,15]. This makes them inadequate for measuring within-season tree height growth at the sub-meter scale. The authors of [16] used a Total Station survey to measure the height of individual trees with centimeter accuracy but did not measure tree height growth. Total Station surveys instrumentation is costly and time-intensive to set up and operate. Only few trees can be measured within a reasonable time span using this methodology.
Frequent annual and within-season UAV-based measurements for tree height growth provide an economic and useful alternative to collect these kinds of data compared to traditional methods. The authors of [10] determined the minimum time interval at which single-scan airborne, static terrestrial and mobile laser scanning techniques can detect changes in tree height and found that the shortest achievable time interval was one month using terrestrial laser scanning. Here, we investigate the use of UAV-derived measurements to achieve similar short time intervals for measuring tree height growth. The authors of [3] argue that accurate multi-temporal remote sensing methods for measuring tree height growth have the potential to form an excellent basis for recalibrating tree growth models and improving forecasts for future harvests.
The most common traditional remote sensing method for measuring tree height is light detection and ranging (LiDAR) which uses laser scanners mounted on manned aircraft, or since recently also mounted on unmanned aerial vehicles (UAVs). Multi-temporal three-dimensional data collected using LiDAR instruments on manned aircraft have been used to measure height growth [17,18,19,20,21] or through a combination of aerial photographs and LiDAR [9] but only at multi-year time scales. LiDAR has been the most commonly used semi-automated technology for tree height assessments of larger forest areas but both the LiDAR instrument and the flight vehicle (manned aircraft or UAVs with large payload capacities) are comparatively expensive and require highly specialized personnel for data acquisition and processing [22,23,24]. LiDAR sensors on board of low-cost UAV platforms are still expensive but are becoming operational [25,26]. However, data processing is complex and tree heights tend to be underestimated due to a large probability of missing tree tops even at high point-sampling densities. Furthermore UAV-mounted LiDAR sensors are heavy and require large UAV platforms with limited flight time [27]. A number of studies measured tree height growth over larger forest stands using radar and optical remote sensing technologies but only at time steps of multiple years to derive average annual rates [28]. Intra-seasonal tree growth measurements require measurements with high temporal resolution, i.e., every 1–2 months, which is difficult and costly to obtain using imagery from satellites or manned aircraft.
Advances of UAV technology in recent years made it possible to investigate environmental processes and changes at spatial and temporal scales that would be difficult or impossible to accomplish using traditional remote sensing platforms [29]. These capabilities in combination with their low cost of data acquisition, increasingly user-friendly operation, operational flexibility and instant data delivery are likely to facilitate increased use of the technology for research and commercial applications in forests [30]. UAVs are equipped with Global Positioning System (GPS) receivers, inertial measuring techniques and other sensors, allowing autonomous navigation along flight paths and for data collection, providing systematic, rapid and efficient mapping of areas of interest [31]. The acquired imagery has very high spatial resolution in the centimeter range and large overlaps, which allows calculating digital surface models (DSMs) using Structure from Motion (SfM) photogrammetric methods of 3D reconstruction.
The reconstructed surfaces produce comparable results to traditional photogrammetric methods at a 80% reduction of time effort [32]. The authors of [24] found comparable accuracies between tree height measurements using UAV-SfM technology or airborne LiDAR and demonstrated that the technology can be used to estimate single-tree height in forest inventories. The authors of [27] quantified tree height using a low-cost consumer-grade camera with the standard color channels red–green–blue (RGB) on a multi-rotor UAV and achieved canopy height estimates comparable to measurements obtained from LiDAR of vegetation canopies (i.e., errors ranging between 0.09 m and 1.2 m depending on canopy type and phenological phase). Their work was performed using fully automatic image processing without ground control points. The authors of [33] measured tree heights, but not tree growth, in individual tree and tree row agricultural-tree plantations using DSMs derived from UAV imagery obtained with a consumer-grade RGB camera and achieved errors in the range of 17–18 cm compared to on-ground measurements. The authors of [34] measured tree heights in olive orchards, in an open canopy and a hedge-row setting. Height estimates for olive trees planted in hedgerows had an RMSE of 10% and trees planted in a discontinuous pattern an RMSE of 19%. This level of error, when compared to field measurements, is considered a low and acceptable error range for monitoring changes in tree traits, such as height, taking into account the magnitude of potential errors inherent in manual measurements. The authors of [35] measured tree height of 22 trees in a Scots pine plantation using UAV-SfM and ground control points and achieved a mean accuracy of 5 cm. The authors of [36] estimated dominant stand height of a 200 ha boreal forest area using RGB imagery collected with a fixed-wing UAV and SfM. The authors achieved R2 = 0.97, RMSE = 0.7 m and relative RMSE = 3.5% compared to field measurements of selected trees obtained through triangulation with a Vertex hypsometer. They concluded that height and other forest structural parameters could be determined using UAS-SfM data with an accuracy comparable to that obtained using other commonly used remote sensing data such as LiDAR. The authors did not attempt to measure tree height growth. The authors of [36] combined UAV-SfM photogrammetry and a LiDAR-derived digital elevation model (DEM) of the forest floor to produce a hybrid photo/LiDAR canopy height model. The authors achieved photogrammetric canopy height models of good quality for deciduous stands and emphasized the potential of UAV technology to collect dense multi-temporal canopy height series to frequently refresh the LiDAR canopy height model.
The objective of this work is to test the capability of these widely available and accessible systems for assessing tree height growth and demonstrate their potential use for research, and forest management. The main research question of this study is of technical nature and focused on whether commercial-of-the-shelf (COTS) UAV systems can be used for sufficiently accurate measurements to determine intra-seasonal tree height growth. We hypothesize that it is feasible to obtain meaningful results which agree well with the literature and ground-based measurements.
2. Materials and Methods
2.1. Study Area
This study was conducted in the Rammert Growth District of the Rottenburg Municipal Forest in the Tübingen Forest District in south-west Germany. The study site is located at 530 m above sea level on sandstone substratum. The climate is temperate oceanic with annual precipitation between 700 mm and 950 mm and mean annual temperature of 9.2 °C. Precipitation during the 2016 main growing season months May, June and July was 316 mm, which was 10.4% above the mean of the preceding 20 years [37]. The area in which tree height measurements were carried out is 140 × 140 m (2 ha). It lies at the center of the area covered by the UAV flights, which includes a 30 m wide buffer zone around the central area, totaling 200 × 200 m (4 ha) (Figure 1). The soils are mesotrophic, the dominant soil types are secondary podzol on loamy sand and luvisol on loam. The major tree species before 1999 were Norway spruce, interspersed with English oak. The north-eastern and south-eastern sections of the study area suffered severe wind-throw during Hurricane Lothar on 26 December 1999. The majority of young forest tree species originate from natural regeneration of European beech, Silver birch, Norway spruce, Scots pine, Silver fir and other deciduous species, interspersed with few planted English oak (Quercus robur) trees from before the storm event.
2.2. Image Acquisition
The airborne campaigns were conducted in spring, summer and early winter 2016 using a low-cost, consumer-grade UAV with RGB camera mounted on a 3-axis gimbal. The UAV system was a DJITM Phantom 3 Pro with a take-off weight of 1.3 kg, equipped with a GPS/GLONASS (Global Navigation Satellite System, European Space Agency, Paris, France) and barometric altimeter for horizontal and vertical positioning. The integrated RGB camera has a 12.4 MP 1/2.3˝ CMOS sensor, with 20 mm lens and field-of-view (FOV) of 94°.
We carried out four aerial flight campaigns on 27 May, 8 July, 19 August and 22 November. The flights took place between 10:30 and 13:00. All missions were flown at 100 m height above the launch site. This is the maximum allowed flight altitude under existing civil aviation regulations. It is also the flight height which [38] found to be optimal within a range of 20 to 80 m above the forest canopy for measuring canopy height and other forest structural parameters. However, the actual ground-sampling distance of the resulting aerial photos also depends on the sensor size and focal length. The launch site was located near the center of the study area at the intersection of two forest roads. The comparatively large open area in combination with the flight height of approximately 80 m above the tree canopy ensured line-of-sight visibility of the aircraft from the launch site throughout each mission.
The flight campaign in May was carried out using two overlaying, perpendicular flights, creating a double-grid pattern (also see camera positions in Figure 1) with 80% side overlap of the photographs. The flight campaigns in July and November consisted of two perpendicular flights with 85% side overlap and the flight campaign in August consisted of one single flight with 88% side overlap. We used different degrees of overlap to test their validity for producing useful results, although this was not the primary focus of this study. Overall, there was no easily discernible difference in the quality of the DSMs and orthomosaics. The flight mission settings were as follows. Angle of camera: 90° (vertical); front overlap: 90%; side overlap: 80, 85 or 88%; white balance: sunny or cloudy depending on weather conditions. All photographs were recorded at the maximum possible resolution of 3000 × 4000 pixels in JPEG format. The total flight time for each individual flight was less than 10 min. All flights were conducted under light-wind or no-wind conditions.
Before each campaign, seven ground control plates of white plastic sheets, size 30 × 30 cm, were placed at fixed locations, evenly distributed across the flight area (Figure 1). The latitude and longitude of each plate was recorded in the field using a Garmin GLO™ GPS + GLONASS receiver. We increased the accuracy of the location measurement through waypoint averaging. The spatial accuracy for all ground control plates stated by the Android app GPS-Averaging (version 3.0.0, developed by D. Vavra) after averaging over 50 measurements was 1.0 meters or better. The overall accuracy of the averaged measurements was not validated because the main purpose was not to achieve extremely precise georeferencing of the DSMs and orthomosaics, but rather the precise co-registration of the time series of DSMs and orthomosaics. The precision was still high enough to allow the extraction of accurate elevation values at the location of each ground control plate from the LiDAR-derived DEM of Baden-Württemberg, which has a spatial resolution of 1 m and vertical accuracy of 0.5 m [39]. We used the LiDAR-derived DEM instead of the vertical (altitude) coordinates measured by the GPS device, because elevation measurements using non-differential GPS devices are significantly less accurate than LiDAR measurements, particularly in forests [40,41].
The elevation above sea height of the aerial camera positions recorded by the on-board GPS and written by the UAV into the EXIF geo-tags of each aerial photograph varied over a range of 67.01 m between the flights, despite identical settings for a flight altitude of 100 m above the launch site. The UAV measures and controls flight altitude using the more precise internal barometric altimeter, rather than the less accurate GPS altitude measurements. We therefore corrected the EXIF GPSAltitude geo-tags of all photos, setting them to a value of 633.9 m above sea level to ensure the compatibility of the DSMs calculated from the photographs across all flights. The corrected altitude corresponds to the set flight altitude of 100 m above the launch site, which was located at 533.9 m above sea level as derived from the LiDAR DEM. This step significantly increased the quality of the resulting tree height growth measurements.
2.3. Image Processing
The methodology for calculating DSMs takes advantage of differences in the parallax (viewing effect whereby the position of an object appears different depending on the viewer’s position) of three-dimensional features in the landscape resulting from different view angles of the aerial camera. The quality and accuracy of the DSMs is related to the quality and number of photographs recording the ground features from different perspectives. For this reason, the study area was restricted to the central 140 × 140 m area of the larger 250 × 250 m area covered by the flight plan grid. The size of the central area was determined based on the number of aerial photographs covering eight selected sample points near the edge of rectangular areas of increasing size around the central point of the study area. The sample points were selected along eight straight lines radiating out from the center point to the north, northeast, east, southeast, south, southwest, west and northwest in a star-like fashion at distances of 7.5 m to 97.5 m, increasing in 5.0 m increments. The analysis showed that within the 250 × 250 m area the average number of photographs decreased rapidly beyond a distance of 70 m from the center. Consequently, we restricted the study area to the central 140 × 140 m around the center in order to ensure consistent and comparable aerial coverage and quality of the calculated DSMs.
Pre-processing was performed in the proprietary software package Agisoft PhotoScan Professional Edition Version 1.3.2 build 4205 (64 bit) for Mac OS X (Agisoft, Petersburg, Russia), which several studies have proven effective for the production of 3D point clouds and orthomosaics for analyzing structural properties of forest areas and tree plantations. We processed the data using the standard workflow consisting of blurry photographs removal, marking ground control points, and calculating the dense point cloud, DSM and orthomosaic [33,35,42,43]. The specific processing parameters are provided in Table 1.
The resulting pixel resolution of the orthomosaics was nearly identical for the three leaf-on acquisitions from 27 May, 8 July and 19 August with 4.05 cm, 4.03 cm and 4.06 cm respectively. The achieved spatial resolution of approximately 4 cm is close to the ideal resolution of 5 cm recommended by [27], who tested a range of resolutions between 5 cm to 50 cm for achieving the best possible tree height measurements from UAV imagery. The spatial resolution of the digital surface models for 27 May, 8 July and 19 August was 8.05 cm, 8.02 cm and 8.05 cm.
2.4. Tree Species Identification
The dominant tree species in the study area were Norway spruce (Picea abies), Silver fir (Abies alba), Scots pine (Pinus sylvestris), Silver birch (Betula pendula) and European beech (Fagus sylvatica). Thirty-four individual Silver birch and 65 European beech trees were identified in the field. The location of each identified tree crown was marked on the georeferenced orthomosaic from 27 May using the MapIt GIS application on an Android tablet connected to a Garmin GLOTM GPS unit. Additional tree crowns for Silver birch and the coniferous species were identified using visual interpretation of the time series of orthomosaics. Birches were identified based on their bright yellow fall colors visible in the 22 November orthomosaic. The coniferous tree species were clearly distinguishable from the deciduous tree species in the same, leaf-off orthomosaic from 22 November. However, spruces and firs were not easily distinguishable from each other and occurred in mixed stands throughout the study area. Consequently, the two species were combined into a single, mixed spruce/fir class. Spruce/firs were differentiated from pines based on their pyramidal crown shape as opposed to the more round, open and segregated crowns of pines as well as their different texture and hue. We digitized the center of each identified tree crown as a polygon covering approximately two-thirds of the total crown area. Overall, the crowns of a total of 97 spruce/firs, 52 pines, 45 birches and 33 beeches were digitized, roughly in the same proportion of their estimated occurrence in the study area. The average number of DSM pixels per digitized tree crown polygon was 839.
2.5. Tree Height Growth
The growth in tree height was determined in two steps. In the first step, we calculated the average between the 95 and the 90 percentile of the DSM pixel values within each tree crown polygon and for each of the three leaf-on orthomosaics on 27 May, 8 July and 19 August. This approach is derived from two similar approaches used by [24,36]. The authors of [36] measured the height of 86 trees on a UAV-SfM-derived DSM and on a LiDAR-derived canopy height model and achieved the highest correlation between the two when using the 97 percentile with R2 = 0.92. The authors of [24] tested percentiles from P75 to P99 of the UAS-SfM point cloud for different tree crowns and found that P90 showed the highest correlation between ground-measured tree heights and UAS-SfM estimated tree heights.
In the second step, we calculated the height growth during the main part of the growing season between 27 May and 19 August for each tree by calculating the difference of the averaged percentiles between the two dates. We furthermore calculated the relative tree height growth during the first and second half of the 12-week time period by subtracting tree height on 27 May from 8 July and tree height on 8 July from 19 August respectively.
In order to allow comparison of the height growth rate with tree height as an approximate indicator of tree age, we calculated the height of each tree by subtracting the elevation above sea level of the forest floor from the elevation of the tree crown, as calculated above. The elevation of the forest floor below each tree crown was extracted from the LiDAR-derived digital eleven model of Baden-Württemberg [39] by using the elevation at the location of the centroid point of each tree crown polygon.
For further analysis, we removed outliers in both the tree height growth and the tree height datasets using Tukey fences, which corresponds to all data points falling above (below) the third (first) quartile plus (minus) 1.5 times the interquartile range, equivalent to the upper (lower) whisker in a boxplot graph [44,45,46]. Using this approach, we removed three of 97 spruces/firs, nine of 52 pines, zero of 45 birches and three of 33 beeches.
2.6. Field Measurements
We carried out a limited number of field measurements for validating the tree height growth measurements from UAV imagery. Due to technical and resource constraints, this was only feasible for a small number of firs and spruces after the end of the 2016 growing season and before the start of the 2017 growing season. The annual growth of the terminal shoot of spruces and firs can be determined by measuring the distance between the top of the shoot and the first whirl (last year’s growth) and between the first and the second whirl (growth of the preceding year). The same is not true for deciduous trees with more complex, open crowns and less distinctive shoot growth characteristics. In this study, we selected 29 of the 97 trees in the spruce/fir class. The selection of the trees was purposefully based on unobstructed visibility of the tree trunk at 1.3 m height and of the tree top. The selection was not random and does not necessarily fulfill the criteria of representativeness for the trees measured using UAV data. However, the ground-measured trees make up nearly one-third of the UAV-measured trees and were measured with high accuracy due to the selection criteria of unobstructed visibility. Therefore, the data were considered to be a meaningful comparison for the UAV measurements as an indication of the validity of the result for at least one of the tree species.
The field measurements were carried out on 30 March 2017, after the end of the 2016 growing season and before the start of the 2017 growing season. The horizontal distance between the observer and the tree trunk was measured using a Nikon® orestry PRO Laser Rangefinder. The height of the shoot top and of the first and second whirls was measured with a Criterion™ RD 1000 Electronic Dendrometer mounted on a tripod, using the horizontal distance as input parameter.
3. Results
The UAV-based measurements of tree heights of four different tree species in the 4-hectare study area over a 12-week period from 27 May to 19 August 2016 showed different rates of tree height growth for each species. In Figure 2, we show boxplots of the tree height growth measurements for each unit of tree species as derived from the UAV-SfM DSMs. The total number of trees after removing outliers was spruces/firs: n = 94; pines: n = 43; birches: n = 45; beeches: n = 30. Boxplots graphically illustrate the smallest and largest observations, first quartile, median, third quartile and outliers. Birches and pines show the strongest growth, spruce/firs less growth and beeches by far the lowest growth rate of the four groups.
Figure 3 shows the terminal tree growth for the first and second 6-week time period from 27 May to 8 July and from 8 July to 18 August as a percentage of the total growth over the entire time period. All four species showed their strongest growth in the early growing season and little or no growth in the late growing season.
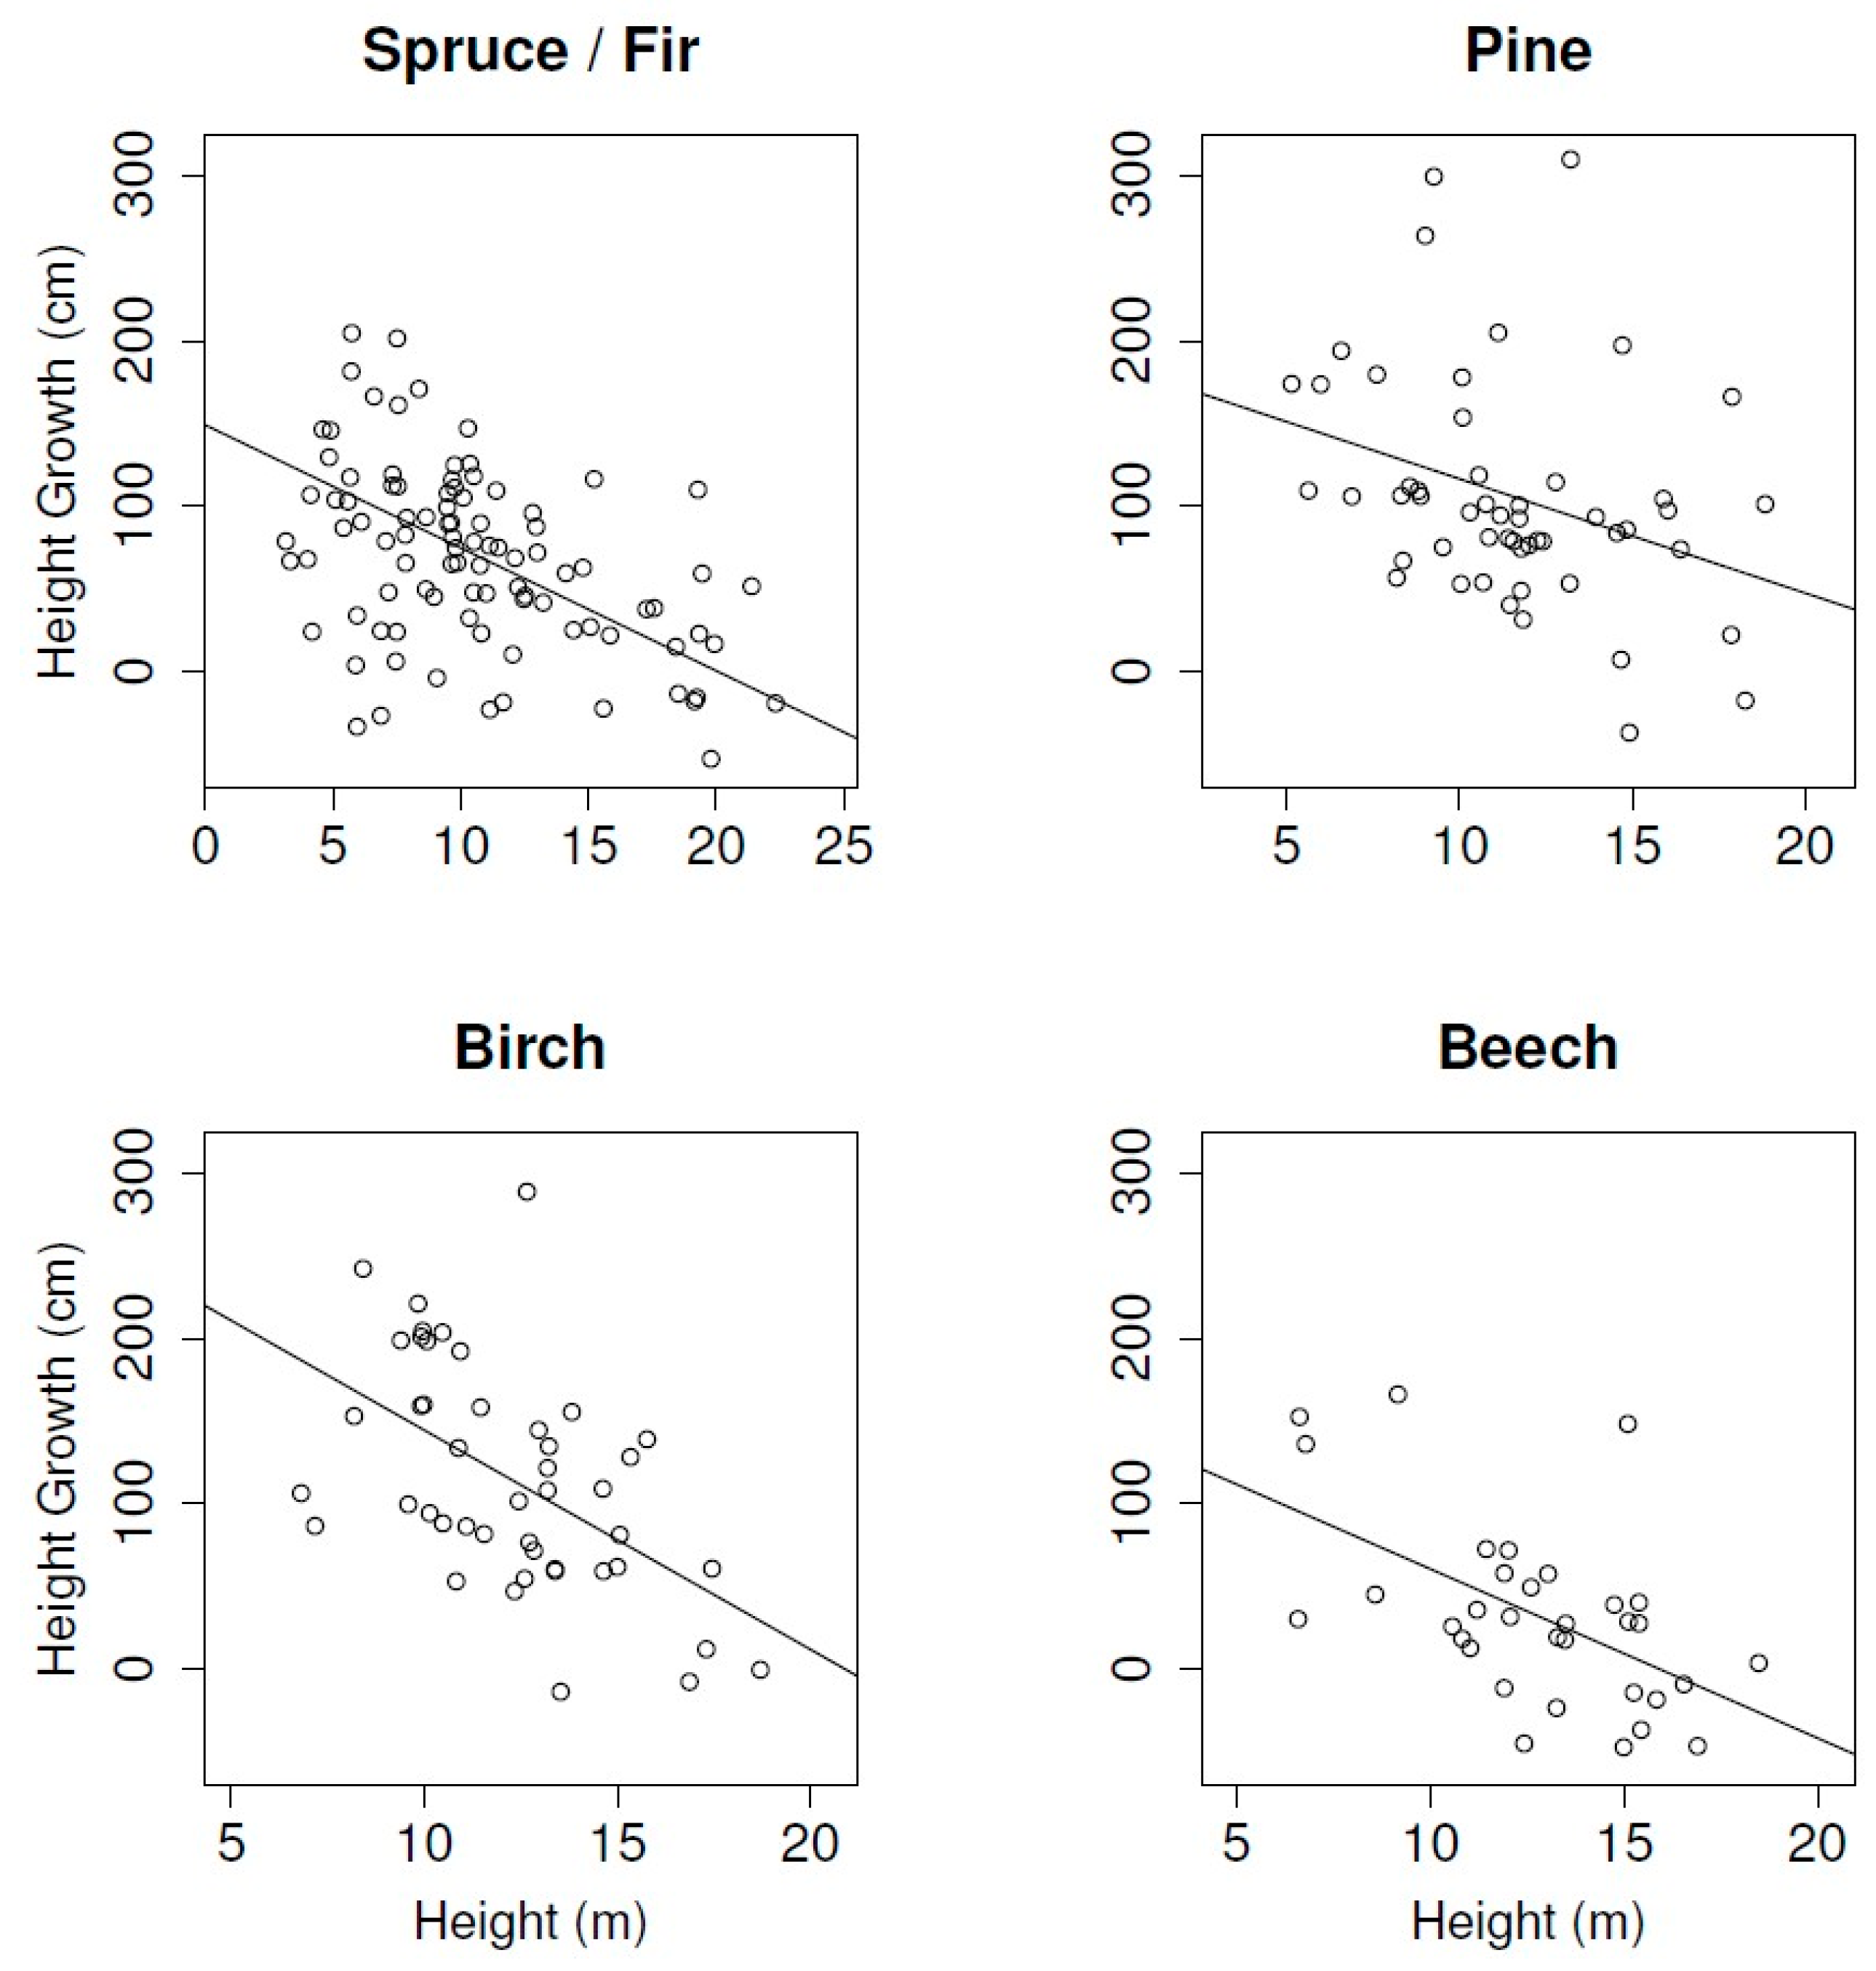
The relationships between tree height and tree height growth are shown in Figure 4. Beeches and birches show the strongest relationship, followed by spruces/firs and pines. This indicates that smaller trees grow significantly faster than taller trees. All correlations are significant at the p = 0.001 level, except pines with p = 0.016.
The field measurements of terminal growth in the 2016 growing season for spruces/firs, corresponding to the distance between the top of the terminal shoot and the first whirl, had a median of 90 cm ± 18 cm standard deviation. The median distance between the first and second whirl, corresponding to the terminal growth in the preceding (2015) growing season, was 90 cm ± 17 cm. The results indicated terminal growth for the 2016 growing season 31% above the median growth measured over the 12-week time period from 27 May to 19 August using UAS-SfM technology.
4. Discussion
In this study, we investigated the question whether COTS UAV systems can be used to measure intra-seasonal tree height growth with sufficient accuracy to provide meaningful results. A number of previous studies measured tree height growth over larger areas up to several square kilometers and at annual or decadal time steps, for example [8,9,18,28]. Few studies have investigated within-season tree height growth at time steps of 6–8 weeks or less (for example [10,35]) and to the best of our knowledge no studies have investigated within-season relative tree height growth at these time steps at the hectare scale. There are three main reasons for the lack of scientific investigation at these scales. Firstly, ground-based measurements using traditional triangulation methods are challenged by the visibility of the tree crowns in closed forest stands and can have inaccuracies in height measurement of 1–3 m or more [15], precluding reliable measurements of within-season tree height growth at decimeter or centimeter resolution. Secondly, ground-based measurements are very labor-intensive, even more so when covering large numbers of trees over several hectares of forest. Thirdly, the two established remote-sensing methods for measuring tree height, which are (1) traditional photogrammetry performed by a human interpreter using stereoscopic analysis of overlapping aerial photographs and (2) the use of LiDAR technology, are both time-consuming, require highly trained personnel and expertise and are too costly for frequent coverage of small areas of 1–10 hectares due to the need of manned aircraft missions and specialized instrumentation, equipment and sophisticated data processing.
In this study, we investigated the use of low-cost, off-the-shelf UAV technology for the measurement of tree height growth in a temperate forest site in central Europe. Our results show their feasibility in combination with fixed ground control points for achieving meaningful and adequate measurements of tree height growth over areas of approximately 1 to 10 ha.
Assessing the absolute accuracy of the UAV-based results for each tree species requires alternative and independent measurements. It was not feasible however to collect comparative ground-based tree height growth measurements for a large number of trees over the entire study area. In addition to the reasons above, UAS aerial data might detect leaves or branches of the top-most canopy which are not easily identifiable or visible from the ground. This reduces the accuracy and usefulness of ground-based tree height measurements [47,48].
In our study area, we carried out field measurements of the terminal growth of a subset of the same spruce and fir trees measured with the UAV. Even though the subset was not necessarily representative of the entire group of trees measured using UAV data because they were not selected randomly but purposefully in the field based on tree top visibility, it does represent a fairly large sample (31%) and a direct comparison seems meaningful. The field data indicate an average tree height growth for spruces and firs of 98 cm. The UAV-measured median tree height growth was 68 cm, or 69% of the field-measured growth. It can be expected that the total seasonal growth is higher because the first UAV measurement was taken on 27 May, but tree height growth already starts at the beginning of April, as the following authors have confirmed. The authors of [49] studied the radial growth of spruces and firs in a valley at the foot of the black forest near Freiburg, Germany during the years 1959–1962 and found that approximately 40% of the annual radial growth of spruces and 48% of the radial growth of firs occurred before the end of May. The authors of [50] observed that approximately 22% of the annual terminal growth of a three-year old Douglas fir (Pseudotsuga menziesii) in 1966 was completed by the end of May. In this study, based on the assumption that approximately one-third of the seasonal terminal growth of spruces and firs occurred before the end of May, the seasonal growth after May 27 based on the field measurements would amount to 66% of 98 cm or 65 cm, which compares well with the 68 cm measured using the UAV data.
The validity of the results is further indicated by the data on three grounds. Firstly, the measured growth rates of the tree species are within the expected range described in the literature and also agree well relatively to each other. Large parts of the study site suffered severe wind-throw by Hurricane Lothar on 26 December 1999. As a result, a large number of trees are less than 17 years old, in particular in the south-eastern and north-eastern sections of the study area which is dominated by Silver birch, an early successional species, characterized by rapid growth under good light conditions. Height growth rates of 80–100 cm are possible and common during early growth phases of this species [51] with the peak height growth rates occurring at ages of up to 15 years [52] and under similar site conditions as observed in our study area [53]. Scots pine is likewise a pioneer tree species and high growth rates in the observed range of 80 cm or more are possible under good growing conditions on sandy soils with moderate water supply, especially for young trees [54].
The majority of the mixed spruces and firs in the study area has survived Hurricane Lothar and has an average age of 50–60 years. They should exhibit a declining height increment as at such age on good sites the peak of terminal growth has passed. Consequently, their growth rate is lower and the observed average value of 65 cm agrees well with the literature [55,56]. The same authors show that terminal growth of young European beeches is very low, culminating on medium sites at an age of 30 to 40 years. In the present study, we observed similar low growth rates of on average 26 cm, by far the lowest of the four investigated species.
We are aware that height growth models supporting the validity of our findings are based on long-term observations, averaging a widely varying set of climatic conditions over the years. Our observations reflect the specific meteorological conditions of a single year, therefore such point-observations may differ to some extent compared to mean values taken from growth and yield models.
Secondly, the validity of the results is indicated by the fact that the comparative analysis of growth rates during the first half and the second half of the observed time period shows that all tree species exhibit their strongest growth during the early growing season and show lower growth rates during the later growing season. This is a common observation for trees in temperate forests [57].
Thirdly, the relations between tree height, as an indicator of tree age, and tree height growth show that smaller (younger) trees grow significantly faster than taller (older) trees. The study area contains a range of tree age classes due to the fact that the study area was subject to severe wind throw from Hurricane Lothar in 1999 except the north-western part, which was much less affected and contains taller and older trees. The natural establishment of new trees in the wind throw areas occurred over a period of several years, adding to the spread of both age and tree height classes. Younger trees are more vital and relative growth rates during their life span are typically higher for younger trees and flatten out in later years until reaching their natural height limit. After that, further growth mainly occurs in crown and stem width [58].
Although the average growth rates measured in this study are meaningful and realistic, the spread of the individual measurements around the median is still relatively large. This reduces the usefulness of applying this methodology to individual trees. A contributing factor could be moving tree tops during high winds. In some cases, this can cause the SfM methodology to fail because, due to the constantly changing canopy surface, the algorithm cannot find enough passpoints for aligning the overlapping aerial photographs. It is possible that even light winds reduce the quality of the DSMs, particularly for broad-leave tree species. This effect can make UAV-based measurements under windy conditions difficult or even impossible. In this study, all flight were conducted under no-wind or light-wind conditions.
Another contributing reason for the observed uncertainty is likely the relative inaccuracy of the camera position measurements acquired by the internal GPS of the UAV. The camera distortion calibration can be improved by increasing the accuracy of the location measurements of the ground control points through geodetic or differential GPS measurements as well as, to a lesser degree, deploying more ground control points. For example, [16] found that 3D point clouds derived from UAV imagery collected at low flying heights between 30 m and 50 m above ground level in combination with a large number of ground control points (total of 90) over an area of 1.25 ha and geo-referenced using a differential GPS system can be accurate up to 25–40 mm. A key finding of their study was that, using this approach, terrain change can be detected and monitored at the sub-decimeter scale. This solution would not be practical or feasible in forests due to the lack of canopy openings for placing ground control points. Another alternative are precise three-dimensional measurements of the UAV camera positions using on-board differential GPS systems, such as real-time kinematic (RTK) or post-processing kinematic (PPK) solutions. Both systems use GPS corrections relative to a GPS base station, applying the correction either during the flight at the time of image capture (RTK) or after the flight (PPK). These solutions provide sub-decimeter accuracy and are already in use for surveying applications. The same high-precision technology has the potential to be used in forestry as well and allow the measuring of tree height growth even for individual trees as opposed to an average over many trees as performed in this study. However, differential GPS systems are still several times as costly as the low-cost system tested here and for many forestry applications, such as the calibration of tree growth models, measurements by tree species at the hectare scale are sufficient.
5. Conclusions
In this study, we demonstrated that inexpensive, consumer-grade UAV systems can capture three-dimensional information of the forest canopy at high spatial resolution and short time intervals. This information can be used for measuring tree height growth on demand with reasonable cost and effort and at a level which was previously not feasible using existing forms of space and airborne remote sensing platforms. Our results show that intra-annual tree height growth can be estimated for groups of trees within a forest stand with reasonable effort, limited training of the data collector and data analyst and at low cost. Height growth measurements of individual trees show higher variability than when averaged over several trees. However, we expect that with the use of newly available high-precision differential GPS solutions, in particular precise positioning of the UAV at the centimeter level using RTK and PPK technologies, the use of ground control plates for co-registering time series can be eliminated and the measurement of height growth of individual trees will show reduced variability and higher accuracy.
A key challenge for validating the height growth measurements of this study was the difficulty of obtaining sufficiently accurate tree height growth reference data. Future research should therefore include methods to frequently and precisely measure tree height growth using ground-based methods, including differential GPS systems and traditional surveying equipment. These data can be used for validating the vertical absolute accuracy of measurements with high-precision differential GPS (RTK/PPK) UAV systems.
The results of this study open up a wide range of new applications in research and forest management. Considering the technical advances (e.g., in battery capacity) and new technological development of vertical take-off and landing (VTOL) UAVs with fixed-wing characteristics which can be used in forest landscapes without the need for large openings, provides a way to use this technology for much larger areas. At the same time, the reduction in cost of very high precision differential RTK/PPK GPS systems for UAVs increases the feasibility of using these systems for forestry applications, eliminating the need for ground control points and making high-accuracy measurements possible even for individual trees and with comparatively little effort. The technological advancements presented here allow improved measurements of forest parameters to derive, e.g., short-term changes in biomass and estimate carbon sequestration of different forest types. The new technology can also be used for experimental plots in tree plantations to investigate the effects of growing different tree species or varieties under varying environmental conditions and different treatments. The potential to use the technology is particularly high in the tropics where tree growth is higher than that of the temperate tree species investigated in this study.
Acknowledgments
This study was supported by the University of Applied Forest Sciences Rottenburg, who provided funding for covering the costs to publish in open access. We acknowledge forest warden Lorenz Truffner who gave us his kind permission to carry out the study in the Rottenburg Municipal Forest and provided us with information and advice.
Author Contributions
J.D. conceived and designed the study, carried out the flight campaigns and data analysis and wrote the manuscript. J.N. contributed to the study design and provided technical support and expertise for data processing and analysis. S.H. helped selecting the study site, interpreting the results and wrote part of the manuscript. R.Z. led the on-ground measurements of tree height growth, and supported data analysis and interpretation. C.T. participated in the field work, interpretation of the results and reviewed the manuscript.
Conflicts of Interest
The authors declare no conflict of interest.
References
- Almeida, A.C.; Landsberg, J.J.; Sands, P.J. Parameterisation of 3-PG model for fast-growing Eucalyptus grandis plantations. For. Ecol. Manag. 2004, 193, 179–195. [Google Scholar] [CrossRef]
- Phillips, P.; de Azevedo, C.; Degen, B.; Thompson, I.; Silva, J.; van Gardingen, P. An individual-based spatially explicit simulation model for strategic forest management planning in the eastern Amazon. Ecol. Model. 2004, 173, 335–354. [Google Scholar] [CrossRef]
- Vepakomma, U. Methods and Tools for Reliable Estimation of Allowable Annual Cut (AAC) Calculations. Ph.D. Thesis, Université du Québec á Montréal, Montréal, QC, Canada, 2005. [Google Scholar]
- Koski, V.; Sievanen, R. Timing of growth cessation in relation to the variations in the growing season. In Crop Physiology of Forest Trees; Tigerstedt, P.M.A., Puttonen, P., Koski, V., Eds.; Helsinki University Press: Helsinki, Finland, 1985. [Google Scholar]
- Kilpeläinen, A.; Peltola, H.; Rouvinen, I.; Kellomäki, S. Dynamics of daily height growth in Scots pine trees at elevated temperature and CO2. Trees 2006, 20, 16–27. [Google Scholar] [CrossRef]
- Oleksyn, J.; Tjoelker, M.G.; Reich, P.B. Adaptation to changing environment in Scots pine populations across a latitudinal gradient. Silva Fenn. 1998, 32, 691. [Google Scholar] [CrossRef]
- Clark, D.A.; Clark, D.B. Climate-induced annual variation in canopy tree growth in a Costa Rican tropical rain forest. J. Ecol. 1994, 82, 865–872. [Google Scholar] [CrossRef]
- Itaya, A.; Miura, M.; Yamamoto, S.I. Canopy height changes of an old-growth evergreen broad-leaved forest analyzed with digital elevation models. For. Ecol. Manag. 2004, 194, 403–411. [Google Scholar] [CrossRef]
- Véga, C.; St-Onge, B. Height growth reconstruction of a boreal forest canopy over a period of 58 years using a combination of photogrammetric and LiDAR models. Remote Sens. Environ. 2008, 112, 1784–1794. [Google Scholar] [CrossRef]
- Lin, Y.; Hyyppä, J.; Kukko, A.; Jaakkola, A.; Kaartinen, H. Tree height growth measurement with single-scan airborne, static terrestrial and mobile laser scanning. Sensors 2012, 12, 12798–12813. [Google Scholar] [CrossRef] [PubMed]
- Clark, D.A.; Clark, D.B. Getting to the canopy: Tree height growth in a neotropical rain forest. Ecology 2001, 82, 1460–1472. [Google Scholar] [CrossRef]
- Herault, B.; Ouallet, J.; Blanc, L.; Wagner, F.; Baraloto, C. Growth responses of neotropical trees to logging gaps: Growth responses to tropical forest logging. J. Appl. Ecol. 2010, 47, 821–831. [Google Scholar] [CrossRef]
- Bragg, D.C. An improved tree height measurement technique tested on mature southern pines. South. J. Appl. For. 2008, 32, 38–43. [Google Scholar]
- Goetz, S.; Dubayah, R. Advances in remote sensing technology and implications for measuring and monitoring forest carbon stocks and change. Carbon Manag. 2011, 2, 231–244. [Google Scholar] [CrossRef]
- Larjavaara, M.; Muller-Landau, H.C. Measuring tree height: A quantitative comparison of two common field methods in a moist tropical forest. Methods Ecol. Evol. 2013, 4, 793–801. [Google Scholar] [CrossRef]
- Harwin, S.; Lucieer, A. Assessing the accuracy of georeferenced point clouds produced via multi-view stereopsis from unmanned aerial vehicle (UAV) imagery. Remote Sens. 2012, 4, 1573–1599. [Google Scholar] [CrossRef]
- St-Onge, B.; Vepakomma, U. Assessing forest gap dynamics and growth using multi-temporal laser-scanner data. Power 2004, 140, 173–178. [Google Scholar]
- Yu, X.; Hyyppä, J.; Kaartinen, H.; Maltamo, M. Automatic detection of harvested trees and determination of forest growth using airborne laser scanning. Remote Sens. Environ. 2004, 90, 451–462. [Google Scholar] [CrossRef]
- Yu, X.; Hyyppä, J.; Kukko, A.; Maltamo, M.; Kaartinen, H. Change detection techniques for canopy height growth measurements using airborne laser scanner data. Photogramm. Eng. Remote Sens. 2006, 72, 1339–1348. [Google Scholar] [CrossRef]
- Yu, X.; Hyyppä, J.; Kaartinen, H.; Maltamo, M.; Hyyppä, H. Obtaining plotwise mean height and volume growth in boreal forests using multi-temporal laser surveys and various change detection techniques. Int. J. Remote Sens. 2008, 29, 1367–1386. [Google Scholar] [CrossRef]
- Hopkinson, C.; Chasmer, L.; Hall, R. The uncertainty in conifer plantation growth prediction from multi-temporal LiDAR datasets. Remote Sens. Environ. 2008, 112, 1168–1180. [Google Scholar] [CrossRef]
- Kaartinen, H.; Hyyppä, J.; Yu, X.; Vastaranta, M.; Hyyppä, H.; Kukko, A.; Holopainen, M.; Heipke, C.; Hirschmugl, M.; Morsdorf, F.; et al. An international comparison of individual tree detection and extraction using airborne laser scanning. Remote Sens. 2012, 4, 950–974. [Google Scholar] [CrossRef]
- Nasset, E.; Gobakken, T. Estimating forest growth using canopy metrics derived from airborne laser scanner data. Remote Sens. Environ. 2005, 96, 453–465. [Google Scholar] [CrossRef]
- Hernández-Clemente, R.; Navarro-Cerrillo, R.; Ramírez, F.; Hornero, A.; Zarco-Tejada, P. A novel methodology to estimate single-tree biophysical parameters from 3D digital imagery compared to aerial laser scanner data. Remote Sens. 2014, 6, 11627–11648. [Google Scholar] [CrossRef]
- Klemas, V.V. Coastal and environmental remote sensing from unmanned aerial vehicles: An overview. J. Coast. Res. 2015, 31, 1260–1267. [Google Scholar] [CrossRef]
- Pádua, L.; Vanko, J.; Hruška, J.; Adão, T.; Sousa, J.J.; Peres, E.; Morais, R. UAS, sensors, and data processing in agroforestry: A review towards practical applications. Int. J. Remote Sens. 2017, 38, 2349–2391. [Google Scholar] [CrossRef]
- Zarco-Tejada, P.; Diaz-Varela, R.; Angileri, V.; Loudjani, P. Tree height quantification using very high resolution imagery acquired from an unmanned aerial vehicle (UAV) and automatic 3D photo-reconstruction methods. Eur. J. Agron. 2014, 55, 89–99. [Google Scholar] [CrossRef]
- Tian, J.; Schneider, T.; Straub, C.; Kugler, F.; Reinartz, P. Exploring digital surface models from nine different sensors for forest monitoring and change detection. Remote Sens. 2017, 9, 287. [Google Scholar] [CrossRef]
- Whitehead, K.; Hugenholtz, C.H. Remote sensing of the environment with small unmanned aircraft systems (UASs), part 1: A review of progress and challenges. J. Unmanned Veh. Syst. 2014, 2, 69–85. [Google Scholar] [CrossRef]
- Paneque-Gálvez, J.; McCall, M.; Napoletano, B.; Wich, S.; Koh, L. Small drones for community-based forest monitoring: An assessment of their feasibility and potential in tropical areas. Forests 2014, 5, 1481–1507. [Google Scholar] [CrossRef]
- Colomina, I.; Molina, P. Unmanned aerial systems for photogrammetry and remote sensing: A review. ISPRS J. Photogramm. Remote Sens. 2014, 92, 79–97. [Google Scholar] [CrossRef]
- James, M.; Robson, S. Straightforward reconstruction of 3D surfaces and topography with a camera: Accuracy and geoscience application. J. Geophys. Res. Earth Surf. 2012, 117. [Google Scholar] [CrossRef]
- Torres-Sánchez, J.; López-Granados, F.; Serrano, N.; Arquero, O.; Peña, J.M. High-throughput 3-D monitoring of agricultural-tree plantations with unmanned aerial vehicle (UAV) technology. PLoS ONE 2015, 10, e0130479. [Google Scholar] [CrossRef] [PubMed]
- Díaz-Varela, R.; de la Rosa, R.; León, L.; Zarco-Tejada, P. High-resolution airborne UAV imagery to assess olive tree crown parameters using 3D photo reconstruction: Application in breeding trials. Remote Sens. 2015, 7, 4213–4232. [Google Scholar] [CrossRef]
- Karpina, M.; Jarza˛bek-Rychard, M.; Tymków, P.; Borkowski, A. UAV- based automatic tree growth measurement for biomass estimation. ISPRS Int. Arch. Photogramm. Remote Sens. Spat. Inf. Sci. 2016, XLI-B8, 685–688. [Google Scholar] [CrossRef]
- Lisein, J.; Pierrot-Deseilligny, M.; Bonnet, S.; Lejeune, P. A photogrammetric workflow for the creation of a forest canopy height model from small unmanned aerial system imagery. Forests 2013, 4, 922–944. [Google Scholar] [CrossRef]
- Centers for Disease Control and Prevention. Monthly Climate Grids Germany. Available online: ftp://ftp-cdc.dwd.de/pub/CDC (accessed on 13 April 2017).
- Dandois, J.; Olano, M.; Ellis, E. Optimal altitude, overlap, and weather conditions for computer vision UAV estimates of forest structure. Remote Sens. 2015, 7, 13895–13920. [Google Scholar] [CrossRef]
- Gültlinger, M.; Schleyer, A.; Spohrer, M. Flächendeckendes, hochgenaues DGM von Baden-Württemberg. Mitteilungen des Vereins für Vermessungswesen 2001, 48, 63–77. [Google Scholar]
- Yoshimura, T.; Hasegawa, H. Comparing the precision and accuracy of GPS positioning in forested areas. J. For. Res. 2003, 8, 147–152. [Google Scholar] [CrossRef]
- Zandbergen, P.A.; Barbeau, S.J. Positional accuracy of assisted GPS data from high-sensitivity GPS-enabled mobile phones. J. Navig. 2011, 64, 381–399. [Google Scholar] [CrossRef]
- Dandois, J.P.; Ellis, E.C. High spatial resolution three-dimensional mapping of vegetation spectral dynamics using computer vision. Remote Sens. Environ. 2013, 136, 259–276. [Google Scholar] [CrossRef]
- Puliti, S.; Olerka, H.; Gobakken, T.; Næsset, E. Inventory of small forest areas using an unmanned aerial system. Remote Sens. 2015, 7, 9632–9654. [Google Scholar] [CrossRef]
- Tukey, J.W. Exploratory data analysis. Available online: https://pdfs.semanticscholar.org/2f40/fd06bc9fd00a27437e14ed171e96e4fd9326.pdf (accessed on 13 April 2017).
- Seigel, A. Statistics and Data Analysis: An Introduction; John Wiley & Sons, Inc.: New York, NY, USA, 1988. [Google Scholar]
- Laurikkala, J.; Juhola, M.; Kentala, E.; Lavrac, N.; Miksch, S.; Kavsek, B. Informal Identification of Outliers in Medical Data. Fifth International Workshop on Intelligent Data Analysis in Medicine and Pharmacology, Berlin, Germany, August 2000. [Google Scholar]
- Andersen, H.E.; Reutebuch, S.E.; McGaughey, R.J. A rigorous assessment of tree height measurements obtained using airborne LiDAR and conventional field methods. Can. J. Remote Sens. 2006, 32, 355–366. [Google Scholar] [CrossRef]
- Moorthy, I.; Miller, J.R.; Berni, J.A.J.; Zarco-Tejada, P.; Hu, B.; Chen, J. Field characterization of olive (Olea europaea L.) tree crown architecture using terrestrial laser scanning data. Agric. For. Meteorol. 2011, 151, 204–214. [Google Scholar] [CrossRef]
- Henhappl, G. Über die Stärkeänderungen der peripheren Stammzone von Waldbäumen im Jahresablauf. Ph.D. Thesis, University of Freiburg, Freiburg, Germany, 1965. [Google Scholar]
- Mitscherlich, G. Wald, Wachstum und Umwelt I: Form und Wachstum von Baum und Bestand, 2nd ed.; Sauerländer’s Verlag: Frankfurt am Main, Germany, 1978. [Google Scholar]
- Hynynen, J.; Niemisto, P.; Vihera-Aarnio, A.; Brunner, A.; Hein, S.; Velling, P. Silviculture of birch (Betula pendula Roth and Betula pubescens Ehrh.) in northern Europe. Forestry 2010, 83, 103–119. [Google Scholar] [CrossRef]
- Lockow, K.W. Die neue Sandbirken-Ertragstafel–Aufbau und Bestandesbehandlung. Beiträge für Forstwirtschaft und Landschaftsökologie 1997, 31, 75–84. [Google Scholar]
- Hein, S.; Winterhalter, D.; Wilhelm, G.; Kohnle, U. Wertholzproduktion mit der Sandbirke (Betula pendula Roth): Waldbauliche Möglichkeiten und Grenzen. Allg. Forst-und Jagdzeitg. 2009, 180, 206–219. [Google Scholar]
- Thren, M. Kiefernproduktionsprogramme: Erstellt auf der Basis von Ertragskundlichen Versuchsflächen und Einzelbäumen. Master’s Thesis, Universität Freiburg, Breisgau, Germany, 1987. [Google Scholar]
- Baden-Württemberg, L. Hilfstabellen für die Forsteinrichtung; Ministerium für Ländlichen Raum, Ernährung Landwirtschaft und Forsten Baden-Württemberg: Stuttgart, Germany, 1993. [Google Scholar]
- Bösch, B. Neue Bonitierungs- und Zuwachshilfen. In Wissenstransfer in Praxis und Gesellschaft: FVA-Forschungstage 5.—6. Juli 2001; Forstliche Versuchs- und Forschungsanst: Baden-Württemberg, Germany, 2002; pp. 266–276. [Google Scholar]
- Assmann, E. The Principles of Forest Yield Study: Studies in the Organic Production, Structure, Increment and Yield of Forest Stands; Elsevier: Amsterdam, the Netherland, 2013. [Google Scholar]
- Pretzsch, H. Forest dynamics, growth, and yield. In Forest Dynamics, Growth and Yield; Springer: Berlin, Germany, 2009; pp. 1–39. [Google Scholar]
Figure 1.
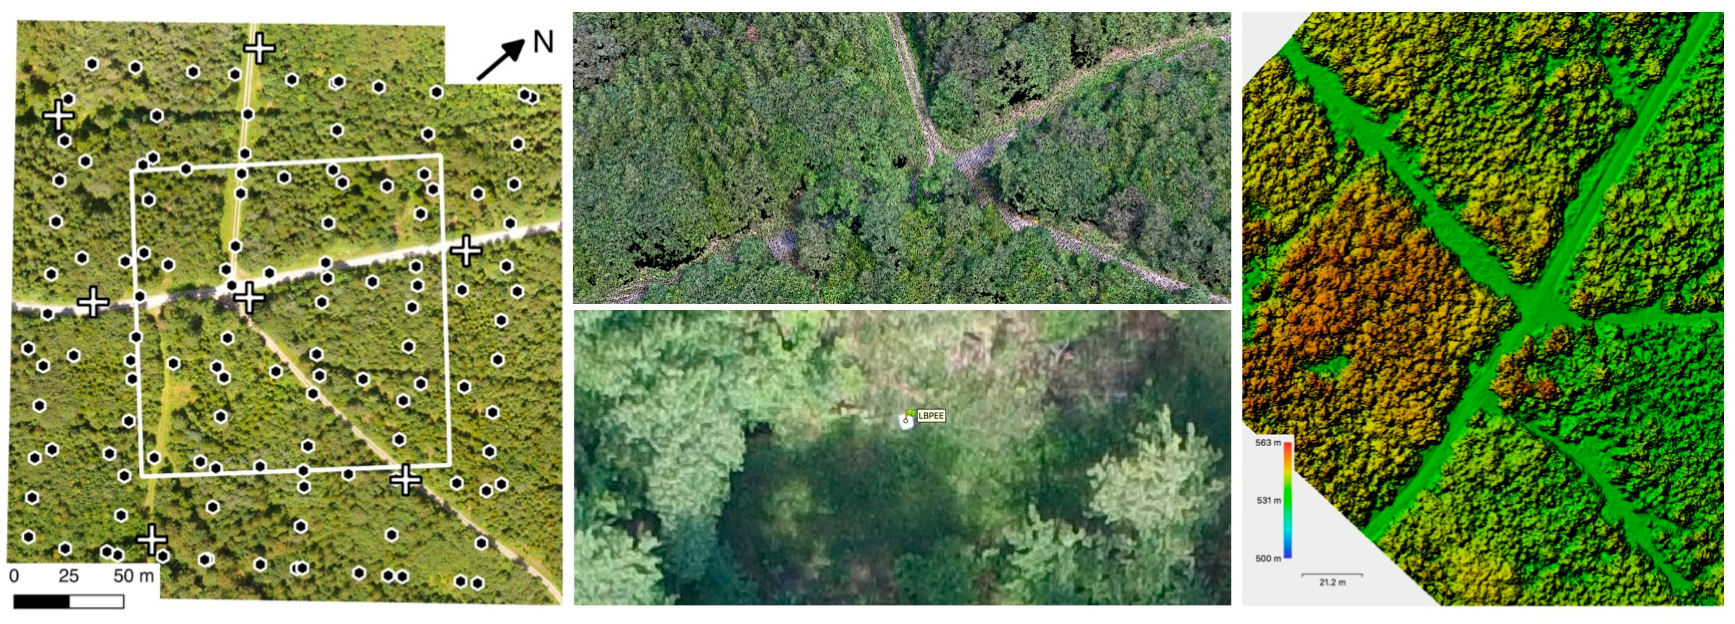
Orthomosaic from 27 May 2017 of the study area in Hungerbrunnen, Rottenburg Municipal Forest, centered at latitude/longitude 48.44923°/8.96557°. Overlaid are camera positions of the flight mission on 8 July 2017 (black dots), the positions of the ground control plates (white crosses) and the center square of the study area used for tree height growth measurements (white square). Upper middle: 3D dense point cloud of the center of the study area. Lower middle: UAV aerial photograph of the north-western ground control plate. Right: subset of the digital surface model of the data acquisition on 27 May.
Figure 1.
Orthomosaic from 27 May 2017 of the study area in Hungerbrunnen, Rottenburg Municipal Forest, centered at latitude/longitude 48.44923°/8.96557°. Overlaid are camera positions of the flight mission on 8 July 2017 (black dots), the positions of the ground control plates (white crosses) and the center square of the study area used for tree height growth measurements (white square). Upper middle: 3D dense point cloud of the center of the study area. Lower middle: UAV aerial photograph of the north-western ground control plate. Right: subset of the digital surface model of the data acquisition on 27 May.

Figure 2.
Boxplots of tree height growth during the time period 27 May to 19 August 2016.
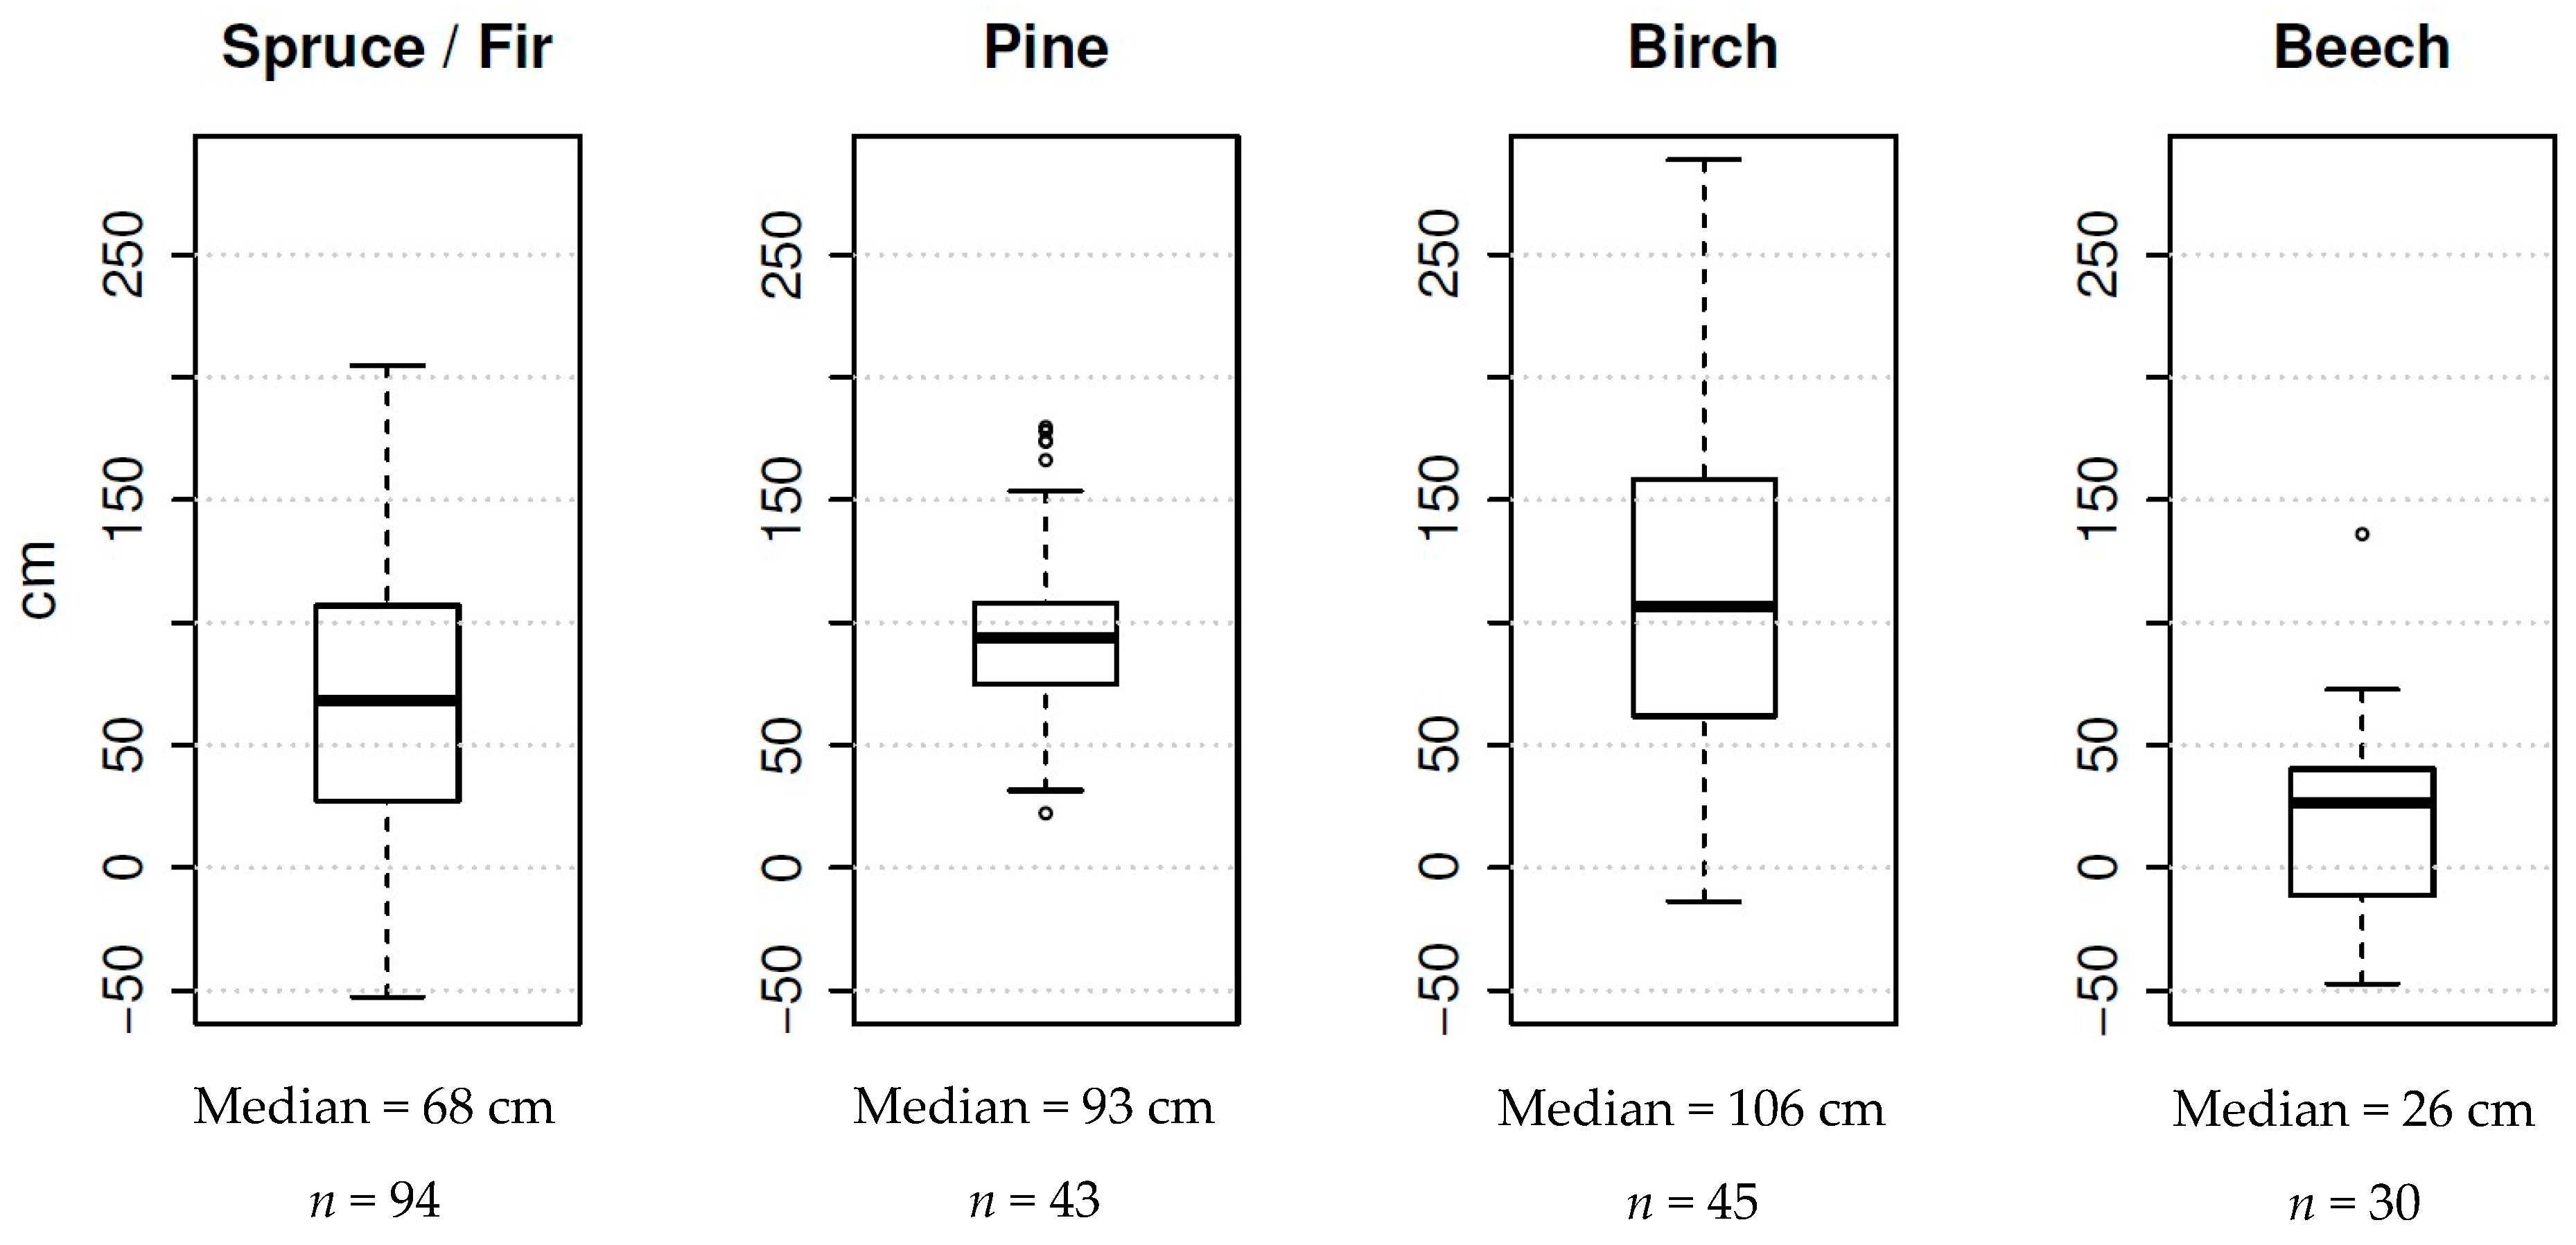
Figure 3.
Relative terminal tree growth in percent of the total growth (y-axis) during the first six weeks (I = early phase) and the second six weeks (II = late phase) of the main growing season.
Figure 3.
Relative terminal tree growth in percent of the total growth (y-axis) during the first six weeks (I = early phase) and the second six weeks (II = late phase) of the main growing season.
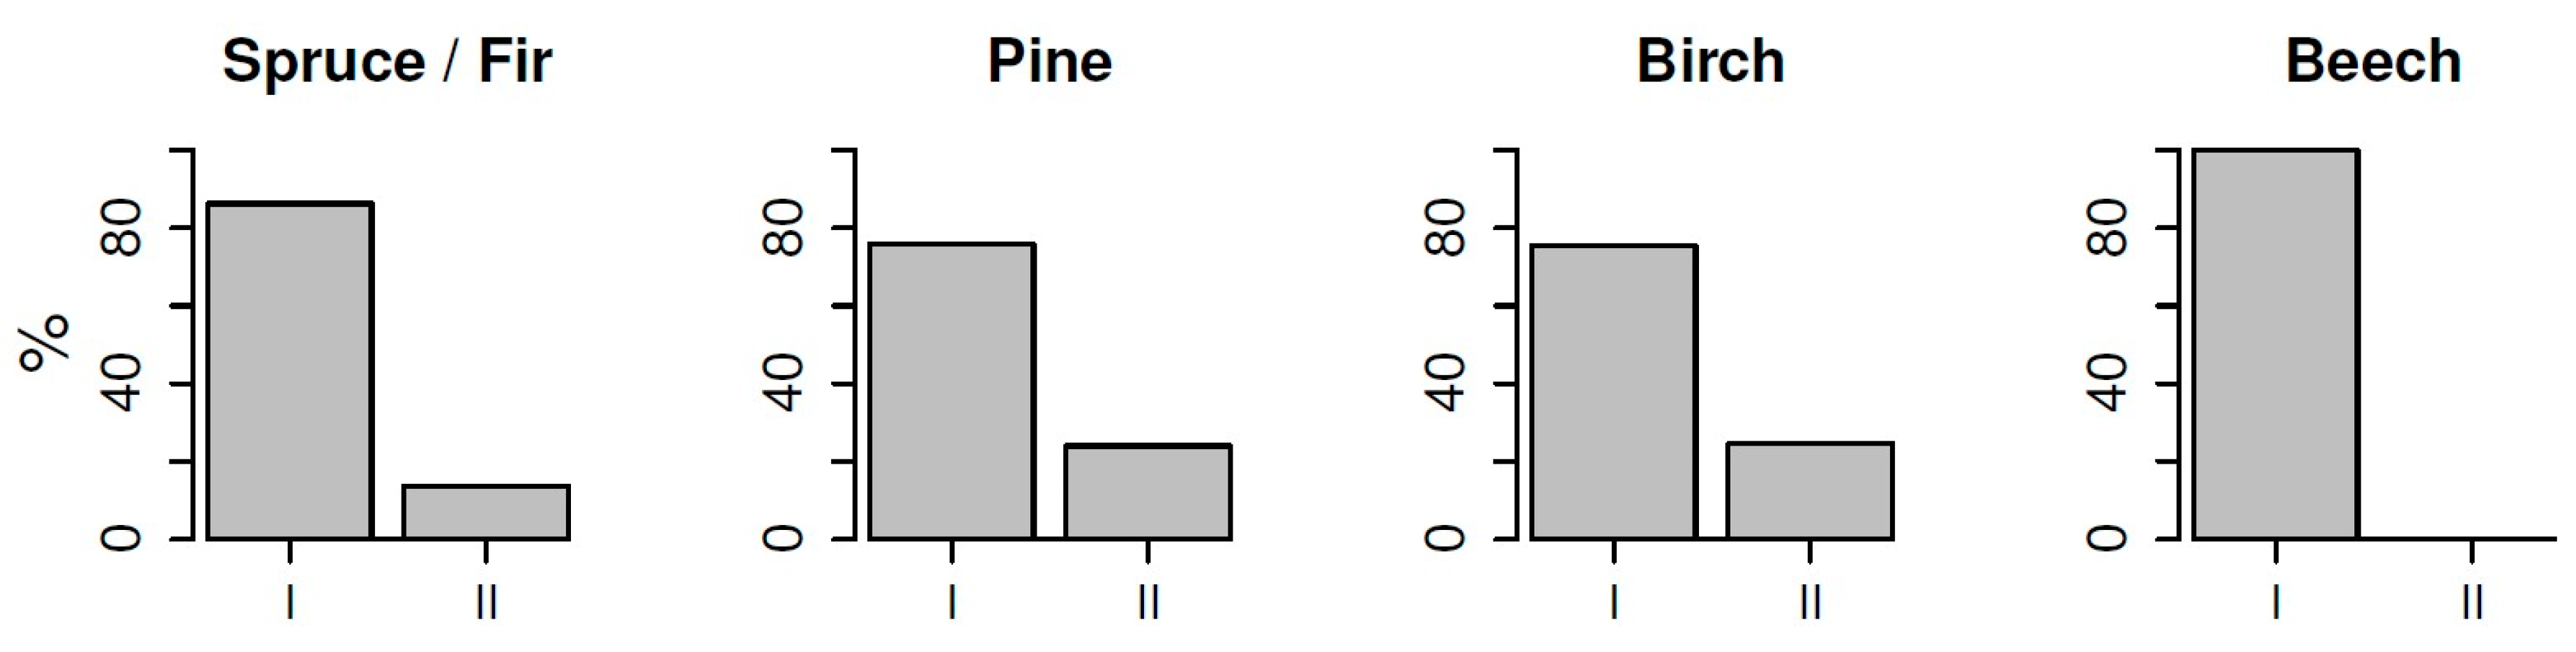
Figure 4.
Scatterplot of tree height versus tree height growth. Spruces/firs: R2 = 0.1932, p < 0.0001; Pines: R2 = 0.0920, p = 0.0164; Birches: R2 = 0.2664, p = 0.0002; Beeches: R2 = 0.2785, p = 0.0009.
Figure 4.
Scatterplot of tree height versus tree height growth. Spruces/firs: R2 = 0.1932, p < 0.0001; Pines: R2 = 0.0920, p = 0.0164; Birches: R2 = 0.2664, p = 0.0002; Beeches: R2 = 0.2785, p = 0.0009.

Table 1.
User settings for each processing step in the Agisoft Photoscan Professional software package.
Table 1.
User settings for each processing step in the Agisoft Photoscan Professional software package.
| Process | Parameter | Setting |
|---|---|---|
| (1) Align photos | Accuracy | High |
| Pair selection | Disabled | |
| Key point limit | 40,000 | |
| Tie point limit | 10,000 | |
| Adaptive camera model fitting | No | |
| (2) Optimize alignment | f; cx, cy; b1; b2; k1; k2; k3; k4; p1; p2; p3; p4 | Optimize |
| (3) Build dense cloud | Quality | High |
| Depth filtering | Mild | |
| (4) Build DEM | Source data | Dense cloud |
| Interpolation | Enabled | |
| Projection | WGS84/UTM zone 32N | |
| (5) Build orthomosaic | Surface | DEM |
| Blending mode | Mosaic | |
| Color correction | Yes | |
| Projection | WGS8 /UTM zone 32N |
The optimization in Step (2) was carried out with ground control points and camera positions and default accuracy parameter values.
© 2017 by the authors. Licensee MDPI, Basel, Switzerland. This article is an open access article distributed under the terms and conditions of the Creative Commons Attribution (CC BY) license (http://creativecommons.org/licenses/by/4.0/).
Share and Cite
MDPI and ACS Style
Dempewolf, J.; Nagol, J.; Hein, S.; Thiel, C.; Zimmermann, R. Measurement of Within-Season Tree Height Growth in a Mixed Forest Stand Using UAV Imagery. Forests 2017, 8, 231. https://doi.org/10.3390/f8070231
AMA Style
Dempewolf J, Nagol J, Hein S, Thiel C, Zimmermann R. Measurement of Within-Season Tree Height Growth in a Mixed Forest Stand Using UAV Imagery. Forests. 2017; 8(7):231. https://doi.org/10.3390/f8070231
Chicago/Turabian StyleDempewolf, Jan, Jyoteshwar Nagol, Sebastian Hein, Carsten Thiel, and Reiner Zimmermann. 2017. "Measurement of Within-Season Tree Height Growth in a Mixed Forest Stand Using UAV Imagery" Forests 8, no. 7: 231. https://doi.org/10.3390/f8070231
Note that from the first issue of 2016, this journal uses article numbers instead of page numbers. See further details here.