Article

Contrasting Impacts of Climate and Competition on Large Sugar Pine Growth and Defense in a Fire-Excluded Forest of the Central Sierra Nevada

1
Department of Forestry and Wildland Resources, Humboldt State University, 1 Harpst Street, Arcata, CA 95521, USA
2
Current address: Save the Redwoods League, 111 Sutter Street 11th Floor, San Francisco, CA 94104, USA
3
United States Department of Agriculture, Forest Service, Pacific Southwest Research Station, 3644 Avtech Parkway, Redding, CA 96002, USA
4
Department of Geography, Humboldt State University, 1 Harpst Street, Arcata, CA 95521, USA
*
Author to whom correspondence should be addressed.
Forests 2017, 8(7), 244; https://doi.org/10.3390/f8070244
Submission received: 2 June 2017 / Revised: 29 June 2017 / Accepted: 3 July 2017 / Published: 8 July 2017

Abstract

:
Many forest ecosystems with a large pine component in the western United States have experienced environmental stress associated with climate change and increased competition with forest densification in the absence of fire. Information on how changes in climate and competition affect carbon allocation to tree growth and defense is needed to anticipate changes to tree vigor and, ultimately, stand structure. This study retrospectively examined the influence of annual climate and competition measures on the growth and defense of 113 large sugar pines (Pinus lambertiana) in a mixed-conifer forest of the central Sierra Nevada of California. We found that growth in large sugar pine was positively associated with higher January temperatures and lower intraspecific competition. Resin duct size was negatively associated with climatic water deficit and total competition, while resin duct area contrastingly showed a positive relationship with total competition. From 1979 to 2012, the rates of growth increased, while resin duct size decreased. Our results suggest that tree vigor measures can respond differently to climate and competition factors that may lead to separate growth and defense trends over time. Stress associated with warmer temperatures and higher competition may distinctly influence individual tree and stand-level vigor with potential implications for future forest dynamics.

1. Introduction

The old-growth forests of the western U.S. that historically experienced low- to moderate-severity fire are undergoing changes in climate and competition that may affect carbon allocation to growth and defense in trees. The persistent legacy of fire exclusion practices has substantially increased the stand density in many of these forests [1,2,3], which can cause greater competition for water and other resources [4]. These conditions are potentially exacerbated by a warming climate [5] that can further limit water resources and increase tree stress [6]. The combination of these changes in climate and competition can substantially affect tree vigor by impacting tree growth and resin defenses [7,8] and contribute to observed increases in background tree mortality rates [9,10], large-scale tree die-off events [11], and the decline of large diameter trees [12,13].
Large trees provide many valuable ecological functions and ecosystem services but are generally rare across most landscapes as a result of past logging practices [14,15]. While large trees typically have a competitive advantage, these trees can still be vulnerable to environmental stress and higher mortality [12,13,15]. Additionally, large trees could be threatened by bark beetle activity, which has increased in a warmer drier climate coupled with denser forests [16,17]. Understanding the effects of how climate and competition changes growth and defense allocation can provide important information about large tree vigor responses to environmental stress with potential implications on forest dynamics.
There are multiple theoretical frameworks for communicating the trade-off between allocating carbon to growth or defense in trees with varying resource availability [18]. The growth-differentiation balance hypothesis states that trees experiencing stressors that limit growth but not photosynthesis will allocate more carbon to secondary compounds (e.g., oleoresin) and structures (e.g., resin ducts) [19,20]. The resource availability hypothesis expands on the growth-differentiation balance hypothesis by stating that slower growing trees will allocate more to constitutive (i.e., continually produced) defenses when the cost of replacing tissues is high, while faster growing trees will allocate more to inducible (i.e., produced in reaction to stress) defenses [21]. These hypotheses posit that reduced resource availability from elevated temperatures and increased competition may reduce growth and potentially shift carbon allocation patterns to defense. Alternatively, warmer and earlier growing seasons could promote conditions that activate photosynthesis earlier, allowing for greater carbon prioritization to growth.
Tree growth and resin duct defenses provide a functional assessment of tree vigor that can be retrospectively assessed using dendrochronology methods. Measures of radial growth reflect the ability of a tree to acquire resources and allocate carbon to growth. Numerous studies have linked reduced radial growth and changes in growth patterns to increased mortality in many tree species [22,23,24,
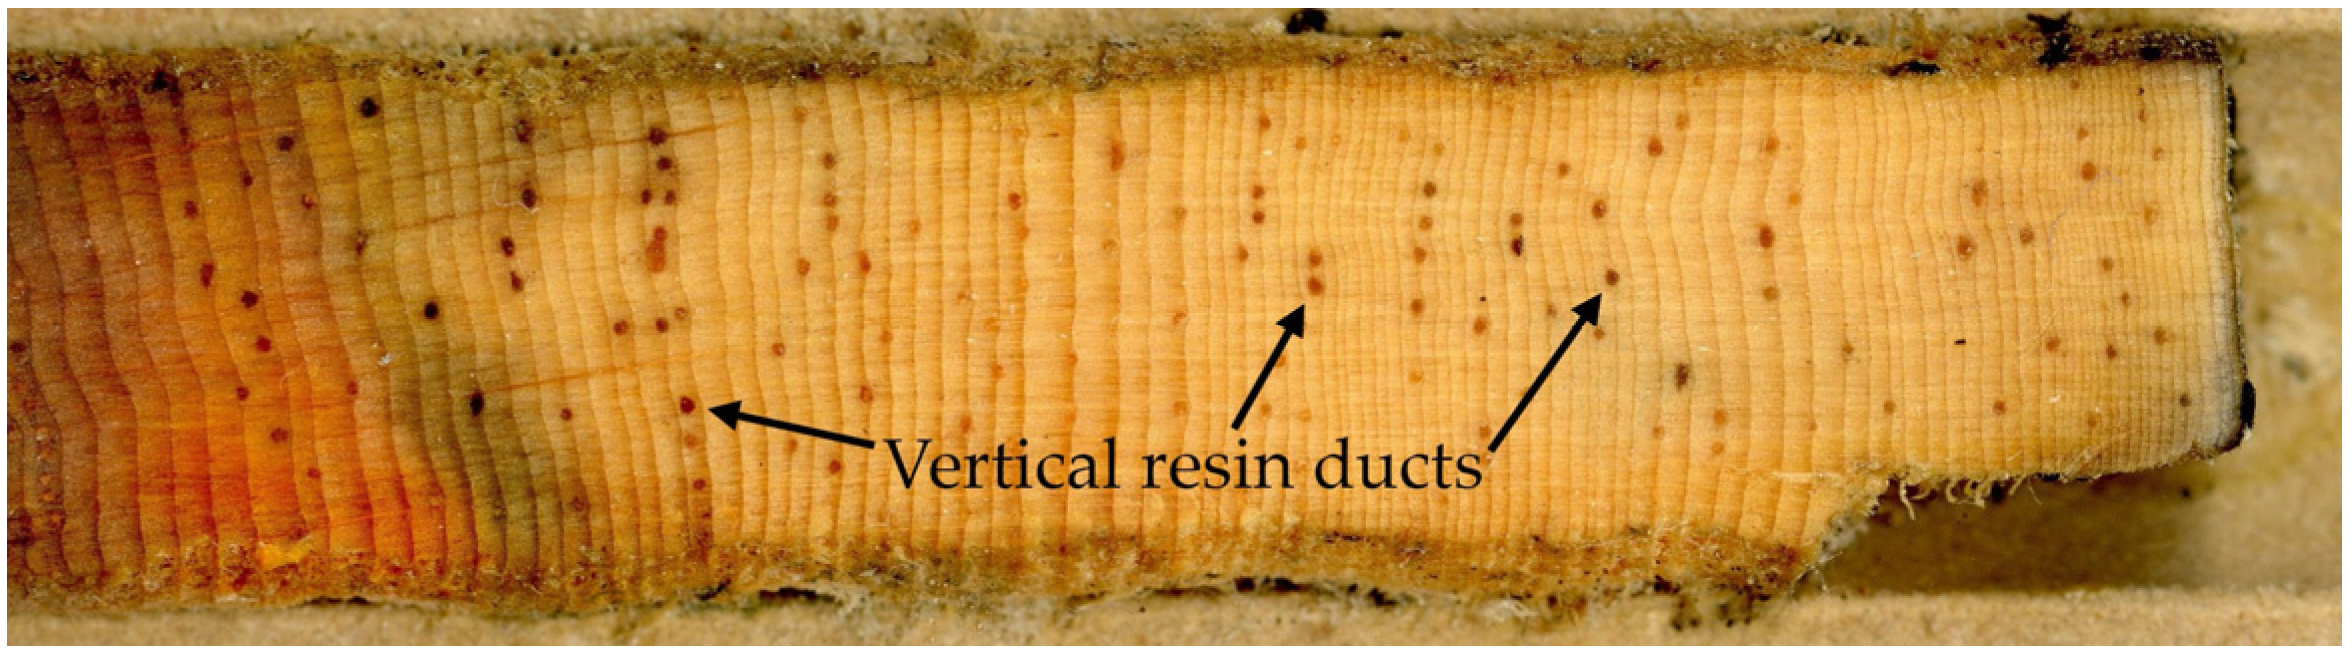
25]. Resin ducts are the network of conduits that produce and deliver oleoresins that chemically impair, isolate, and expel insects and pathogens [26]. Greater allocation to resin ducts has been positively correlated with increased resin flow [27] and decreased probability of tree mortality [8,28,29,30].
Changes in climate and competition can have different effects on carbon allocation to tree growth and defense. Studies have demonstrated that tree growth in lower elevation forests is often negatively correlated with increasing temperatures, while growth in higher elevation forests is often positively correlated with increasing temperatures [31,32]. Greater competition has been shown to limit growth for many species [33,34,35], but these relationships can vary depending on tree species [36]. The role of climate and competition on resin duct defenses has generally been less well studied, though some have found more allocation to resin ducts with higher precipitation and temperature [30,37,38,39].
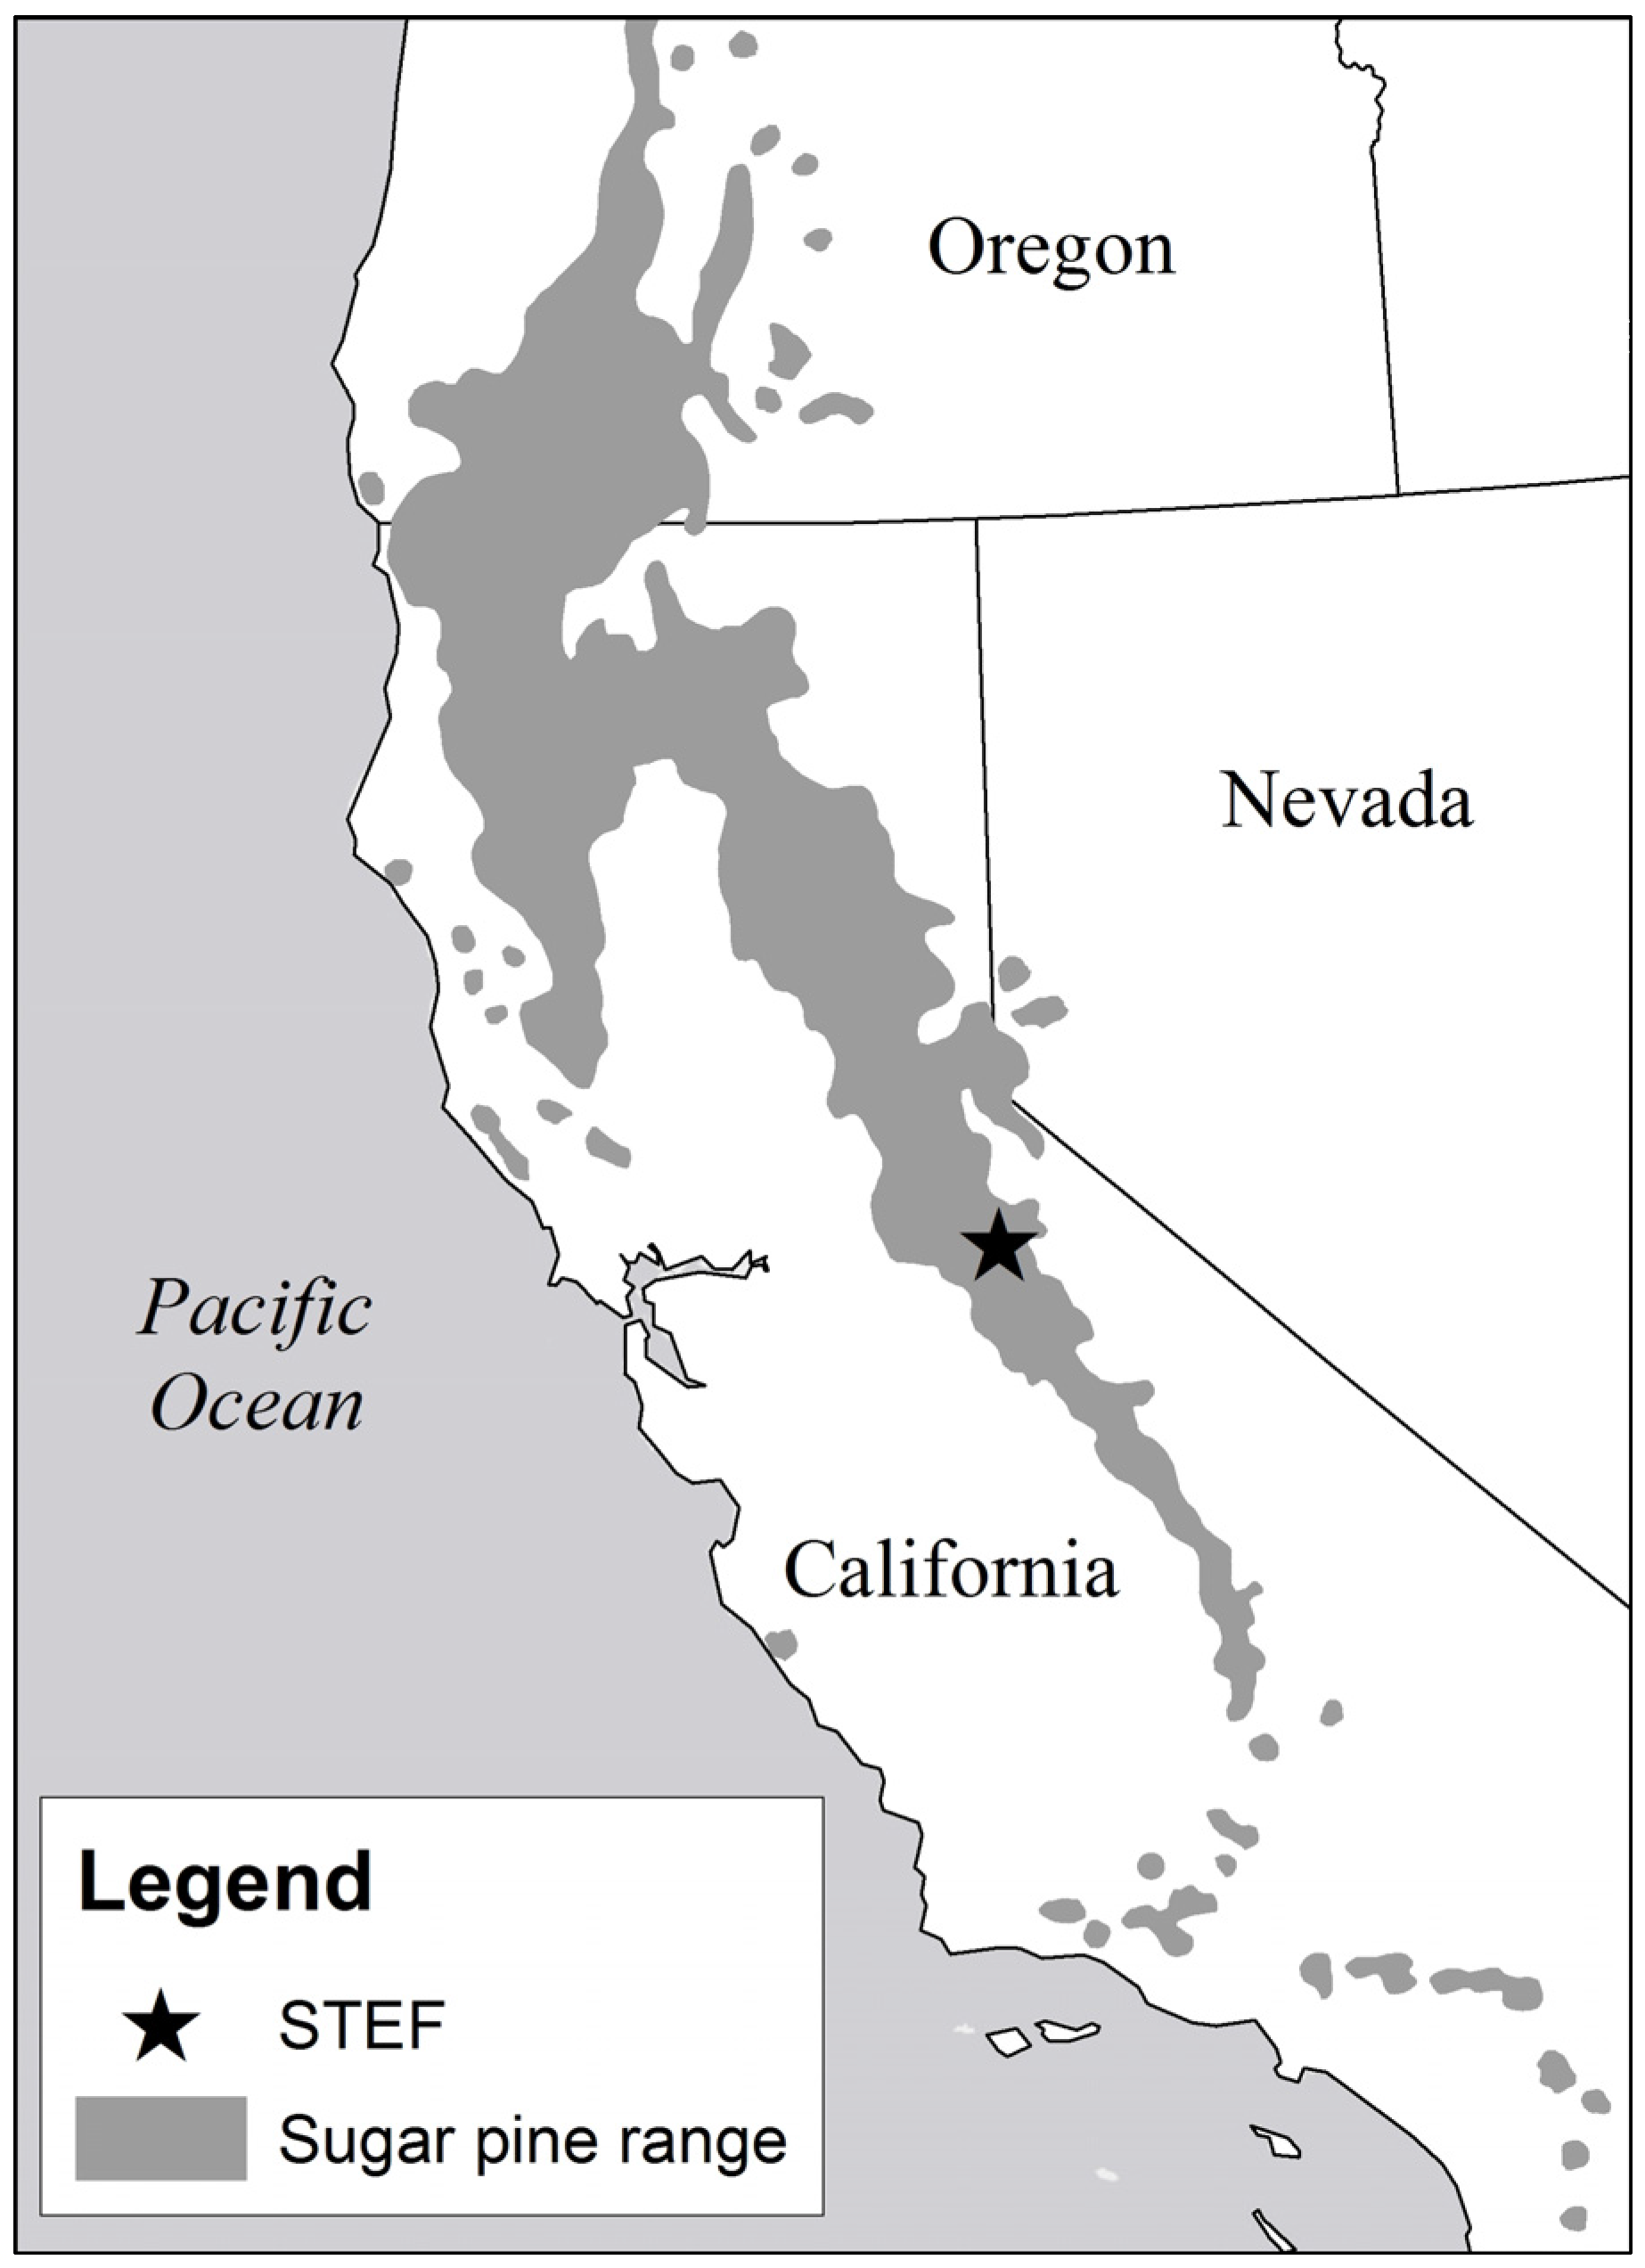
This study examined growth and defense relationships with climate and competition in large sugar pine (Pinus lambertiana) in an old-growth, mixed-conifer forest of the central Sierra Nevada. Much of California has experienced increasing temperatures over the last few decades, punctuated by an extended and severe drought [40]. Additionally, a century of fire exclusion has allowed shade tolerant species such as white fir (Abies concolor) and incense cedar (Calocedrus decurrens) to establish, resulting in denser stands with greater competition than historical conditions [3,9,41]. Cumulatively, these conditions have likely contributed to the observed decline in sugar pine populations [42] and threaten the persistence of large individuals. Here, we took a retrospective approach using common dendrochronological methods to analyze the influence of climate and competition on sugar pine growth and defense at an annual resolution. The primary objectives of this study were to: (1) develop growth and defense models that explore the relative importance of climate and competition and (2) examine the trends in growth and defense over the past 50 years. The results of this study highlight the potential drivers of carbon allocation to growth and defense, improving our understanding of how the combined stressors of a warming climate and increased competition affect large sugar pine vigor.

2. Materials and Methods

2.1. Study Area

This study was conducted within the Stanislaus-Tuolumne Experimental Forest (STEF; 38°10′22″ N, 120°00′00″ W; Figure 1) on the western slope of the Sierra Nevada near Pinecrest, California, with the study unit ranging between 1793 m and 1967 m in elevation. The old-growth, mixed-conifer forest community was primarily comprised of white fir, sugar pine, incense cedar, ponderosa pine (P. ponderosa), Jeffrey pine (P. jeffreyi), and black oak (Quercus kelloggii). The climate was characterized as Mediterranean, with warm, dry summers and cold, wet winters. During the time period examined by our study, air temperature ranged from −25 to 35 °C with an annual average of 8.6 °C, and annual precipitation ranged from 364 mm to 2202 mm (annual average of 1146 mm; [43]), which fell as either rain or snow during the winter months. During exceptional winters, snow accumulations up to 3 m deep can result in a shortened growing season from mid-May to the end of September. The soils were loam to gravelly loam of the Wintoner-Inville families complex, formed primarily from granite, contributing to high site productivity [3]. In Fall 2012, a thinning treatment was applied to approximately 80% of the study area, leaving 20% as untreated controls. The treatment retained larger diameter trees and removed mostly small diameter white firs and incense cedars that had established in the understory in the absence of fire. The historical fire regime of the STEF had a median return interval of six years, but the stand had not experienced a fire since 1889 [3].

2.2. Data Collection

Eighty mature live sugar pine with a diameter at breast height (DBH; approx. 1.37 m above the ground) greater than 50 cm were randomly selected within a section of the experimental forest that covered approximately 55 ha. An additional 33 live large sugar pine were included from a separate mortality study within the same study area that selected trees by pairing dead sugar pine with the nearest live sugar pine of the same or similar size [44]. The final data set for this study thus included a total of 113 live trees. For all sampled sugar pine, we recorded DBH (cm) and bark thickness (cm) and extracted one large diameter (12 mm) core to measure the annual growth and resin duct defense for each tree. The bark thickness (cm) was estimated by finding the cambium inside the hole from the extracted core, using the increment borer spoon to demark the length to the outside of the bark, and measuring the distance using digital calipers [45].
To measure the tree competition surrounding each focal sugar pine, a series of nested plots were established with the subject tree as the plot center. We included all competitor trees taller than breast height within 5 m of plot center, all trees with a DBH > 5 cm within 10 m, and large diameter trees with a DBH > 50 cm within 20 m. For each competitor tree, we recorded the species, DBH, basal diameter, status (live, dead, cut in 2012), distance, and azimuth to subject tree. For all standing dead trees we recorded the decay class, which was modified from a previous study [46] to only include categories for snags. Since some competitor trees were cut prior to the study within previously thinned units, we measured the basal diameter approximately 5 cm above the ground on any cut stumps and estimated DBH based on the basal diameter-to-DBH relationships established from uncut trees at the site (Appendix A). A total of 586 uncut competitor trees (10% of all measured competitor trees) were cored to the pith (tree center) at breast height using a small diameter (5 mm) increment borer for the purpose of retrospectively estimating the annual basal area increments of competitors at different time steps.

2.3. Growth and Defense Measures

All tree cores were mounted and progressively sanded with 80- to 600-grit sand paper, then scanned to create a high resolution (1200 dpi) image. Annual ring boundaries were assigned, and the total ring width (mm year−1) was measured from the scanned images using WinDendro [47]. All cores were visually crossdated and COFECHA [48] was used to assess potential errors in assigning years to annual rings. The series for all live subject sugar pines (n = 113) had an intercorrelation of 0.552 and a mean sensitivity (i.e., variability in ring width) of 0.177.
Sugar pine growth was calculated as the basal area increment (BAI, cm2 year−1):
BAI t   =   π   ( R 2   -   r 2 ) ,
where BAIt was the growth for year t, R was the outer radius, and r was the inner radius. This equation assumed that the annual ring width was constant and geometrically circular throughout the radial growth of a given year. The BAI was used as a standardization method to account for age- or size-related growth trends while still maintaining suppression or release events that may be due to changes in climate or competition [49,50]. Sugar pine defense was estimated through measurements of vertical resin ducts within each annual growth ring (Figure 2). The resin ducts were identified from high resolution images of each core and measured using the program ImageJ [51]. For each annual growth increment, we measured the mean resin duct area (size, mm2 year−1) and the sum of the resin duct areas (total area, mm2 year−1).

2.4. Climate and Competition

Climate data were acquired from the Parameter-Elevation Regression on Independent Slopes Model (PRISM) [43]. PRISM uses an algorithm based on a network of instrumental observations and digital elevation models to produce site-specific values of precipitation and temperature. Monthly total precipitation (mm) and monthly temperature (mean, maximum, and minimum; °C) were extracted from PRISM for our study site. To examine relative dryness, we estimated the annual climatic water deficit using the water balance model [52]. Climatic water deficit estimates water availability and has been shown to be a biologically important measure of water stress in the Sierra Nevada [32,53,54].
To estimate changes in competition over time, we retrospectively reconstructed competition by estimating the diameter inside bark (DIB, measured at breast height) for every individual competitor tree going back to 1964 (50 years before sampling). Since a portion of the study site was thinned in 2012 prior to our sampling, we measured the basal diameter for all uncut live trees and built site-specific regression models for each species to estimate the DBH for all cut competition trees (Appendix A). Site and species-specific bark equations were then constructed to estimate bark thickness and calculate the diameter inside bark for all competitor trees that were not cored (Appendix A). The last year of growth for standing dead competitor trees was estimated by constructing species-specific equations based on the relationship between the last year of growth in the cored samples and the associated decay class (Appendix B). We could not extract viable cores from most dead trees that had fallen. The absence of these dead and decayed trees may have resulted in a slight underestimation of competition during the earlier years of the time period analyzed. Once the diameter inside bark was estimated for all competitor trees, mean ring widths were then progressively subtracted to estimate the DIB for each year. The mean ring width for each year was measured by species and tree size using the 586 collected competition cores. Since growth rate can vary based on tree size, we tested for significant differences among mean annual growth for three to five size classes per species. The mean ring width only differed by size class for white fir; thus we used separate growth estimates for white firs in three DBH classes (less than 23 cm; 23–48 cm; greater than 48 cm).
Competition was calculated using the distance-dependent Hegyi index (Equation (2); [55]), which has been well correlated to tree growth in other studies [36,56] and was among the top performing competition indices in a comparative study [33]. The Hegyi index was calculated using the following equation:
C t   =   j = 1 n   DIB jt DIB it × ( D ij + 1 )
where Ct is competition during year t, DIBit was the subject tree diameter in year t, DIBjt was the competitor tree diameter in year t, Dij was the distance from the subject tree i to the competitor tree j, and n was the number of competitors. The estimations for competition were also subdivided to estimate interspecific competition (i.e., non-sugar pine competitors), intraspecific competition (i.e., sugar pine competitors), and total competition.

2.5. Statistical Analysis

The final dataset included annual measurements for growth, defense, climate, and competition between 1964 and 2012. We chose to analyze this time frame to capture sufficient annual climate variation, while limiting the underestimation of competition due to the unaccounted mortality of competition trees from earlier years. All statistical analyses were performed in the program R [57].
The climate variables used for model development were selected by examining the relationship of seasonal (e.g., winter, summer, wet, dry, and annual) and monthly climate variables (temperature, precipitation, climatic water deficit) with growth and defense measures using the statistical package Treeclim [58]. The package calculates bootstrapped estimates of the Pearson’s correlation coefficient (r) to detect high-resolution climatic signals in tree rings. Climate variables with significant relationships were then included in candidate growth and defense models.
We determined the response of large sugar pine growth and defense to changes in climate and competition using generalized linear mixed modeling (GLMM) with the lme4 package [59]. This statistical approach was appropriate given the non-normal distribution of the sugar pine growth and defense data and the nested structure of the annual measurements within each subject tree. Basal area increment was the response variable for all growth models. The response variables for defense models included resin duct size and total resin duct area. All growth and defense models included a log link function in the gamma distribution family to accommodate the non-normal and positively skewed distribution of the response data. Gamma regression has been successfully used in previous tree growth modeling studies in temperate forests [22,57] and longleaf pine resin duct defense models [38]. The previous year’s growth (previous BAI) was included as a covariate in the growth models to account for temporal autocorrelation, and current BAI was included in the resin duct models because of its high correlations with growth. We considered individual subject trees as a random effect in the model to account for variation in growth and defense among trees. The first models included predictor variables of climate only and competition only to determine separate relationships with growth and defense. We then tested models that combined climate, competition, and interactions between predictor variables. For full models with both climate and competition predictors, we analyzed 31 models for basal area increment, 28 models for resin duct size, and 31 models for resin duct total area.
Akaike’s information criterion (AIC) was used for model selection, with substantial differences in model fit indicated by a change in AIC values greater than two [60]. To avoid issues of multicollinearity, highly correlated predictor variables were not included in the same model and were verified based on a variance inflation factor (VIF) less than 10 [60]. For growth and defense, we report the top model and all models within two AIC of the top model. Additionally, to understand the relative importance of climate and competition in predicting growth and defense, we report the top climate only model, the top competition only model, and a null model based on random effects and covariates that excluded climate and competition. For each top model reported, we provide an estimate of the model accuracy and precision by calculating the root mean squared error (RMSE) and the coefficient of determination (R2) for the relationship between the predicted values and the actual values of growth and defense. The relative importance of climate and competition was assessed by calculating the standardized coefficients for each variable based on the fitted GLMM using the following equation:
β s 1 =   β 1 × s 1 s y
where βs1 is the standardized coefficient for variable 1, β1 is the unstandardized coefficient estimate for variable 1, s1 is the standard deviation for variable 1, and sy is the standard deviation for the response variable.
We examined the trends (i.e., changes over time) in mean annual growth and defense and the measures of climate between 1964 and 2012. Competition estimates had higher uncertainty further back in time and were excluded from this analysis. Annual averages of growth and defense were calculated from all 113 subject trees, and the trends were analyzed using piecewise regression in R with the segmented package to account for the possibility of multiple linear relationships [61]. Piecewise regression uses a maximum likelihood and bootstrapping approach to determine whether the relationship being examined contains breakpoints that significantly improve the linear model. Climate trends were analyzed using linear regression, and we only reported significant relationships for climate variables included in the top growth and defense models.

3. Results

3.1. Growth Models

Models of large sugar pine growth that included annual measures of climate and competition performed better than models based on climate or competition alone (Table 1). The top model for growth included the January temperature of the current year, the total wet season precipitation (previous October–current April), the interaction of the January temperature and the wet season precipitation, interspecific competition, and intraspecific competition (Table 2). Growth was most strongly associated with intraspecific competition (β = −0.0062) and the January temperature (β = 0.0049). Trees with more intraspecific competition grew slower, while warmer January temperatures resulted in faster growth. However, the inclusion of the wet season precipitation and January temperature interaction term (β = −0.0025) indicated that the relationship between the January temperature and growth was weakened during years with higher wet season precipitation (Figure 3A).

3.2. Defense Models

The best performing models for large sugar pine defense consistently included measures of both climate and competition (Table 3). Models with measures of climate only or competition only had substantially higher AIC values (>2) when compared to full models that incorporated both variable categories. Climate measures relating to water availability (e.g., climatic water deficit) had a better association with resin duct defenses than did measures of temperature. In addition, defense was more strongly associated with total competition as opposed to subdividing competition into interspecific and intraspecific competition.
The top model for resin duct size included climatic water deficit, total wet season precipitation (previous October–current April), and total competition (R2 = 0.66, RMSE = 0.0223; Table 4). Based on the standardized coefficient estimates, resin duct size had the strongest association with total competition (β = −0.8634), followed by climatic water deficit (β = −0.3502). Both of these relationships were negative, wherein smaller resin duct size was associated with higher competition and higher climatic water deficit (Figure 4).
Resin duct total area was most strongly associated with climatic water deficit, precipitation, total competition, and the interaction of climatic water deficit with total competition (R2 = 0.54, RMSE = 0.2108; Table 4). Resin duct total area had the strongest relationship with total competition (β = 0.6109), where resin duct total area increased with total competition. The interaction between total competition and climatic water deficit was also a significant factor in the top model for resin duct total area. A higher climatic water deficit was associated with a weakening of the relationship between total competition and resin duct total area (Figure 5).

3.3. Temporal Trends

During the time period analyzed (1964–2012), there were significant trends in large sugar pine growth and defense (Figure 6). The growth trend was best estimated in two segments with a break point at 1979 (R2 = 0.37). BAI decreased from 1964 to 1978 by 0.71 cm2 year−1 (p = 0.0153) and increased from 1979 to 2012 by 0.44 cm2 year−1 (p < 0.0001). The lowest average BAI occurred in 1977 (23.71 cm2), and the highest average BAI occurred in 2012 (61.99 cm2). The resin duct size decreased over the full time period examined (R2 = 0.17, p = 0.0022). The resin duct total area did not show a significant trend, and the annual values remained relatively consistent throughout the time period analyzed. The measures of climate also showed significant changes during the study time period, including increases in the wet season temperature (R2 = 0.3810, p < 0.0001), January temperature (R2 = 0.2801, p < 0.0001), and climatic water deficit (R2 = 0.3048, p = 0.0001).

4. Discussion

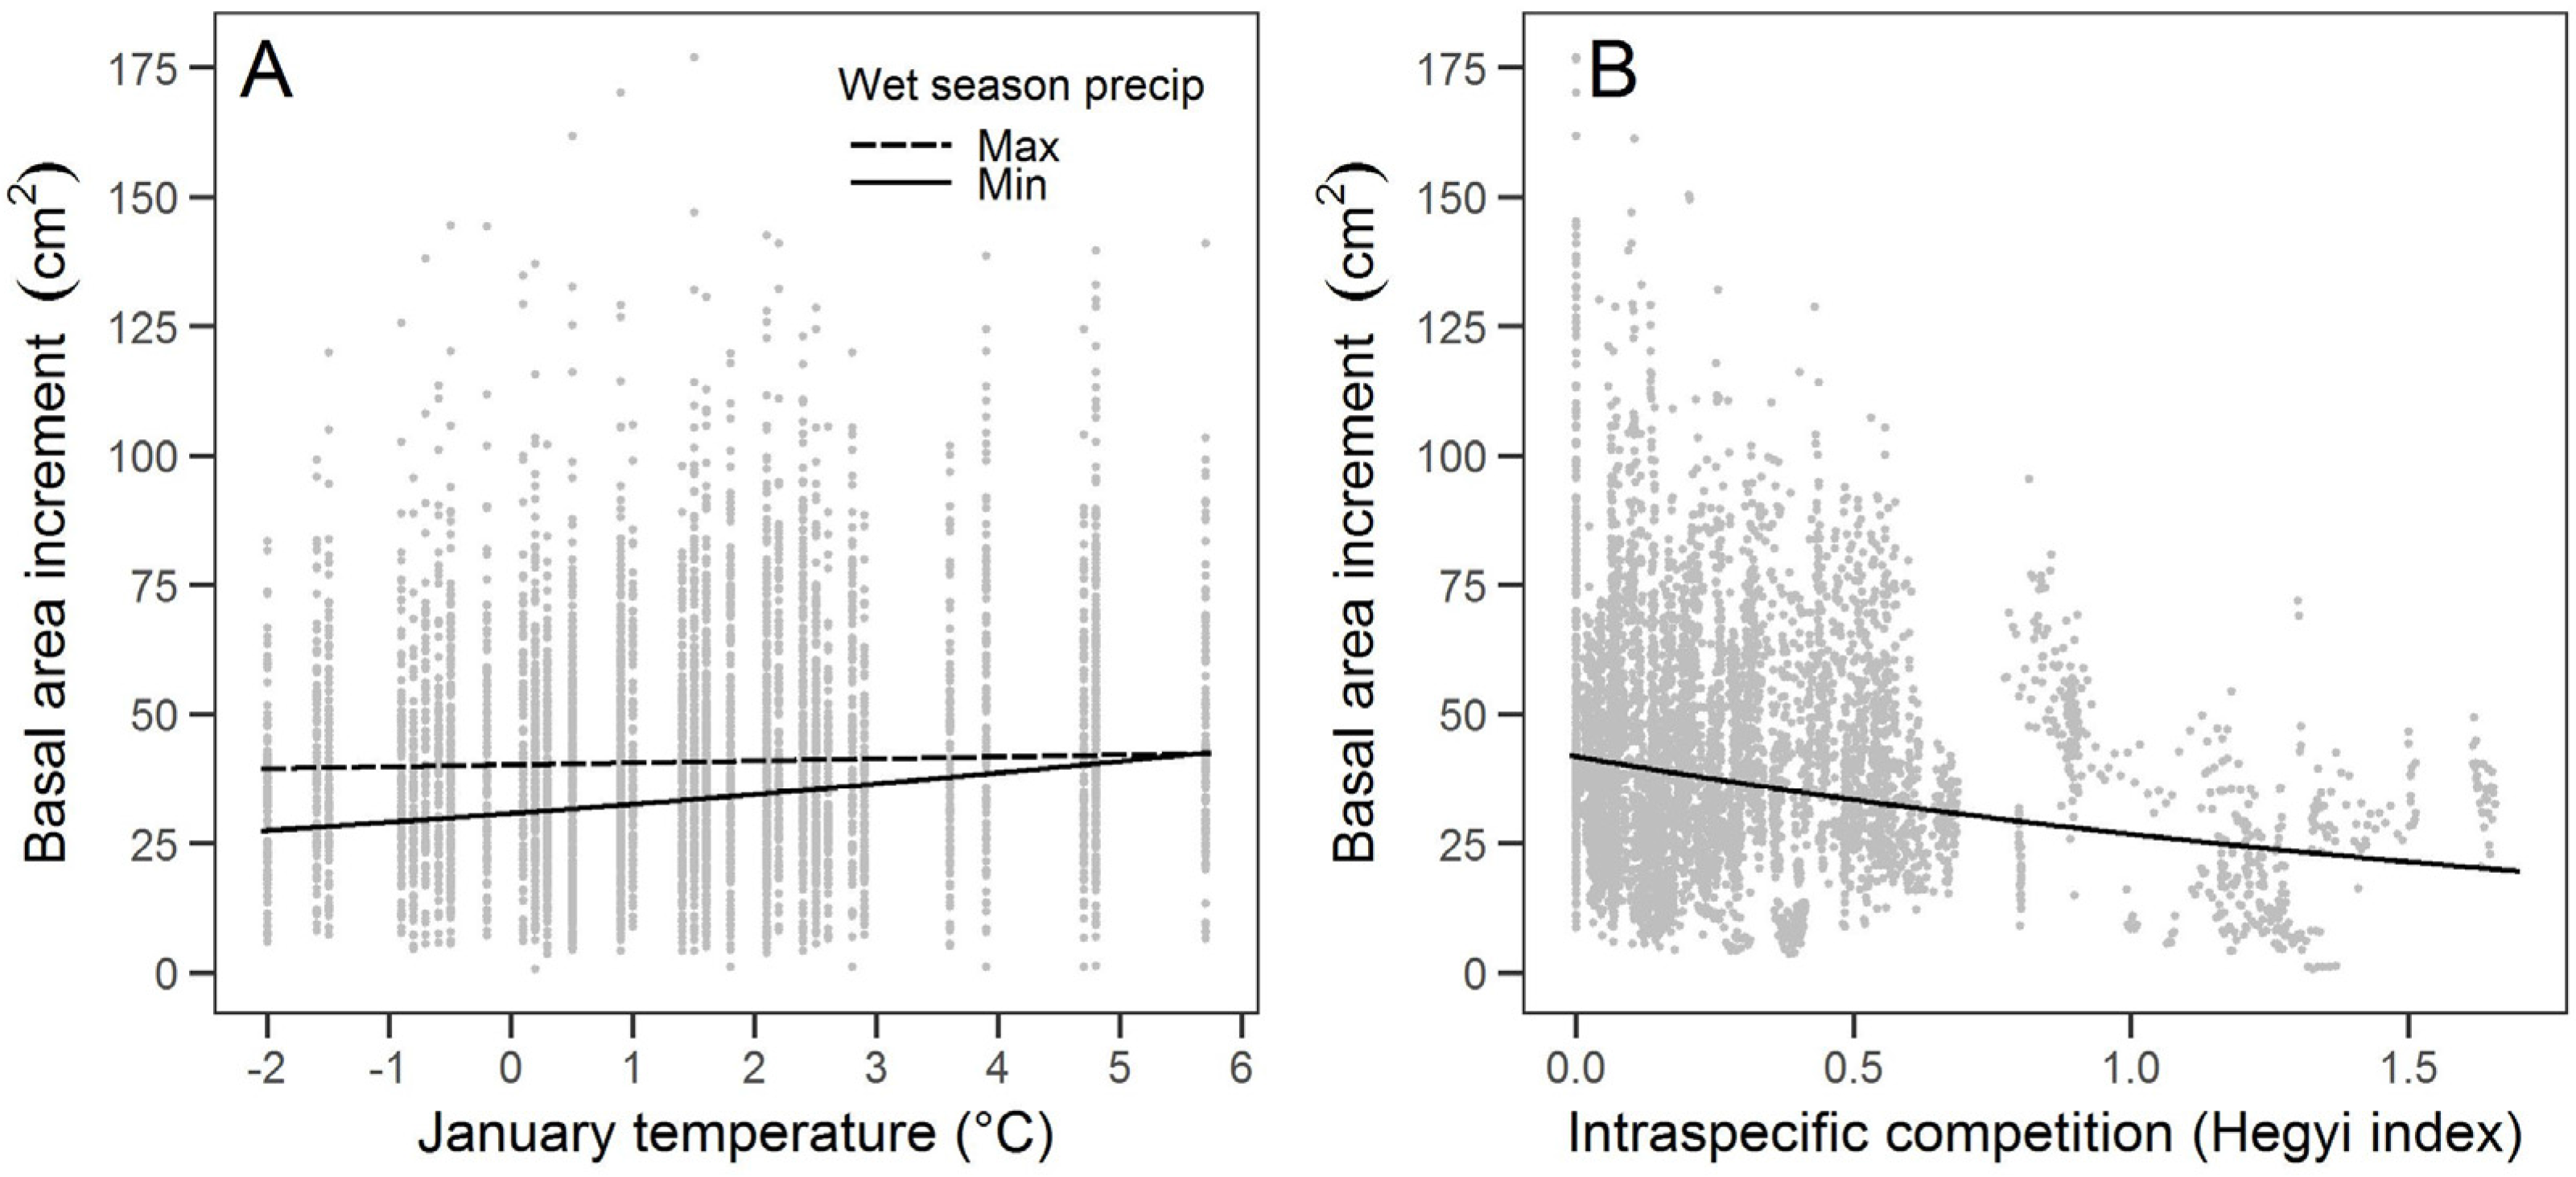
The sugar pine growth and defense (resin duct size and total area) models were improved when both climate and competition variables were included, but the measures of climate and competition and the direction of these relationships differed. Climate and competition relationships with growth have been well established [34,35,36], but their influence on defense structures has received markedly less attention [37,38]. Our results suggest that annual carbon allocation to defense structures is not fixed and that both climate and competition influence resin duct characteristics even when incorporating changes in growth. Consistently, we found that growth and defense were more strongly associated with competition than climate variables. Growth and resin duct size had contrasting relationships with measures of competition, wherein growth was negatively related to intraspecific competition and the resin duct total area was positively related to total competition.
We also observed that the trends of growth and defense over the past 50 years differed, highlighting that these measures of vigor are responding differently to changes in climate. Increasing temperature and climatic water deficit likely have contrasting impacts on growth, and increasing competition could favor carbon allocation to defense but had differing impacts on resin duct characteristics (e.g., size and total area). Below, we place our findings in context with previous research and discuss future implications for sugar pines with potential insight into other species.

4.1. Growth Relationships with Climate and Competition

Sugar pine growth was associated with the climate variables of January temperature and wet season precipitation, though January temperature was more strongly associated with growth. The relationship between warmer January temperatures and higher growth suggests that sugar pines at our study site may be limited more by colder winter temperatures (i.e., limited by growing season) than by precipitation, at least for the years considered in this study. Growth that is limited by cold more than moisture has been found in high elevation conifers in California [62]. However, this result was surprising considering that the elevation of the study site was 1700 m. Previous studies have suggested that the transition from low elevation, water-limited forests to high elevation, energy-limited forests occurs between 2000 and 2600 m in the southern Sierra Nevada [31,32].
Large sugar pine growth in our study was associated with intraspecific competition more than with total or interspecific competition, which is consistent with previous findings for the growth of sugar pine and other conifers [36]. The influence of intraspecific competition may reflect that older sugar pine can be stronger competitors than younger shade-tolerant species such as white fir and incense cedar [36]. The large sugar pine at our study site commonly occurred in clusters and were taller than most surrounding trees, likely resulting in greater intraspecific competition for light. Interspecific competition may have been less important because of the higher abundance of smaller incense cedar and white fir that likely did not compete as directly with large diameter sugar pines for aboveground and belowground resources.

4.2. Defense Relationships with Climate and Competition

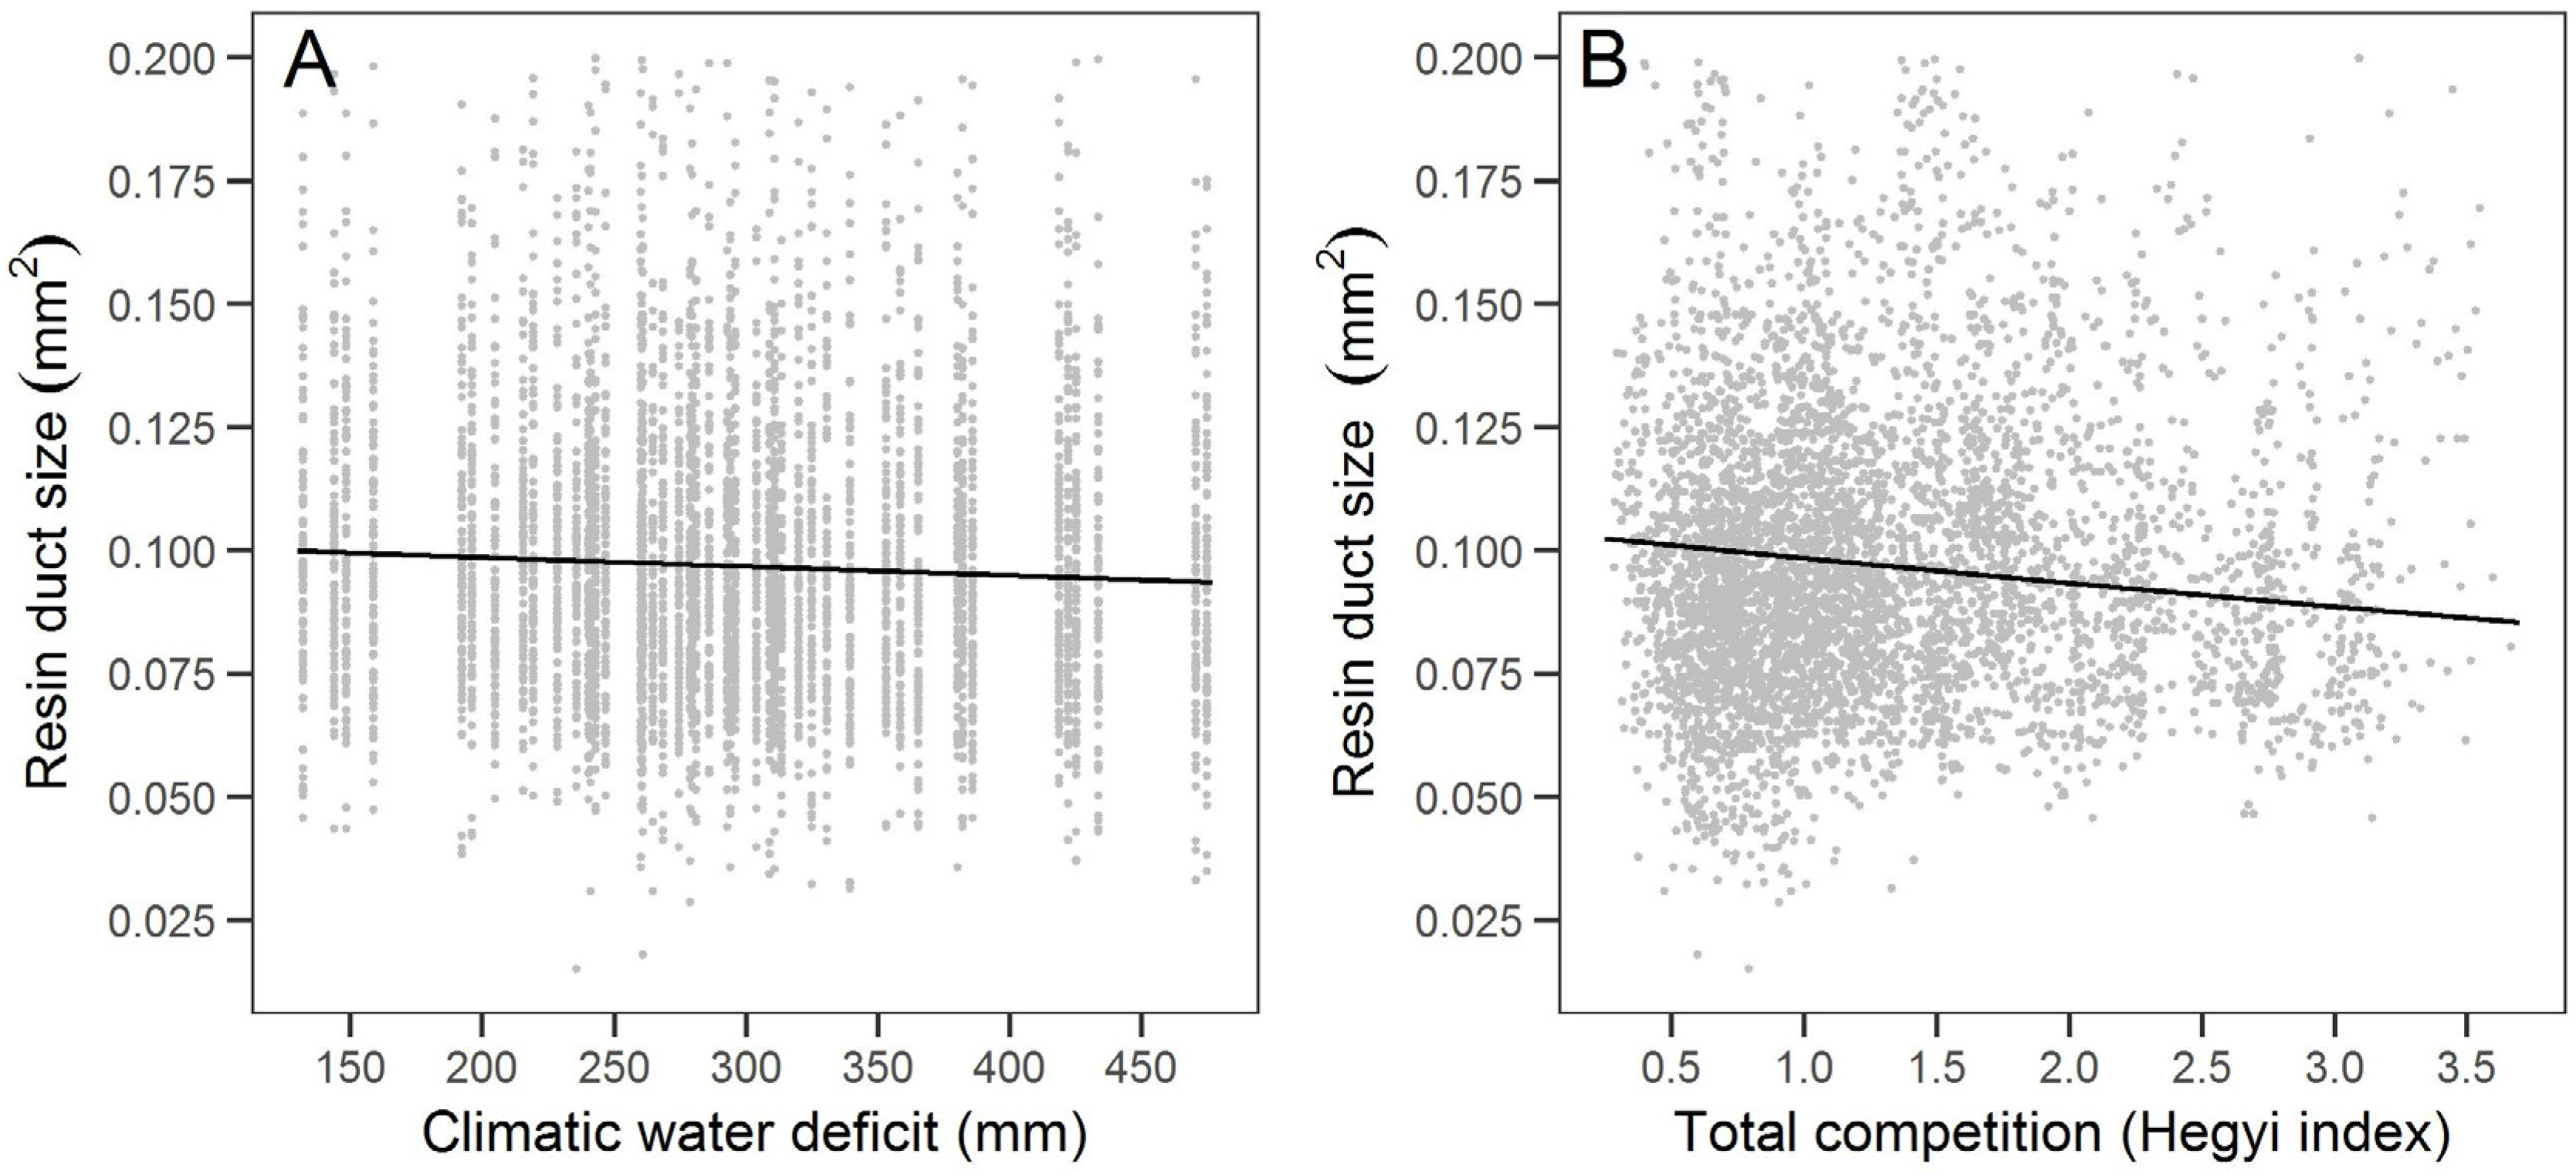
The variation in large sugar pine resin duct defense in our study was partially associated with climate factors. In particular, the relationship of defense measures with total wet season precipitation and climatic water deficit suggests that years with lower snowpack in the Sierra Nevada may limit large sugar pine carbon allocation to defense. Years with lower wet season temperatures and greater water stress may lead to less carbon allocation to resin ducts. Warmer temperatures have been associated with earlier spring snowmelt [63], and reduced snowpack development along with earlier snowmelt can contribute to lower soil moisture and drier conditions [64]. The relationship between climate and resin duct defense characteristics has been observed in both ponderosa pine and longleaf pine (P. palustris); however, the strength of the relationships and variables of importance were not consistent with our findings. One study in Montana found that ponderosa pine resin duct total area was greater when temperatures were warmer and precipitation was higher during the month of July [30], while another study examining longleaf pine in Florida found that resin duct total area was lower following a dry winter and did not show a significant relationship with temperature [38]. These differences indicate that the relationship between resin duct defense and climate likely varies depending on the species and the climatic regions examined. Recent research has observed substantial variation in defense characteristics in pines across sites of differing climate [65] and along elevational gradients [66], but more direct examination with climate across these scales is needed.
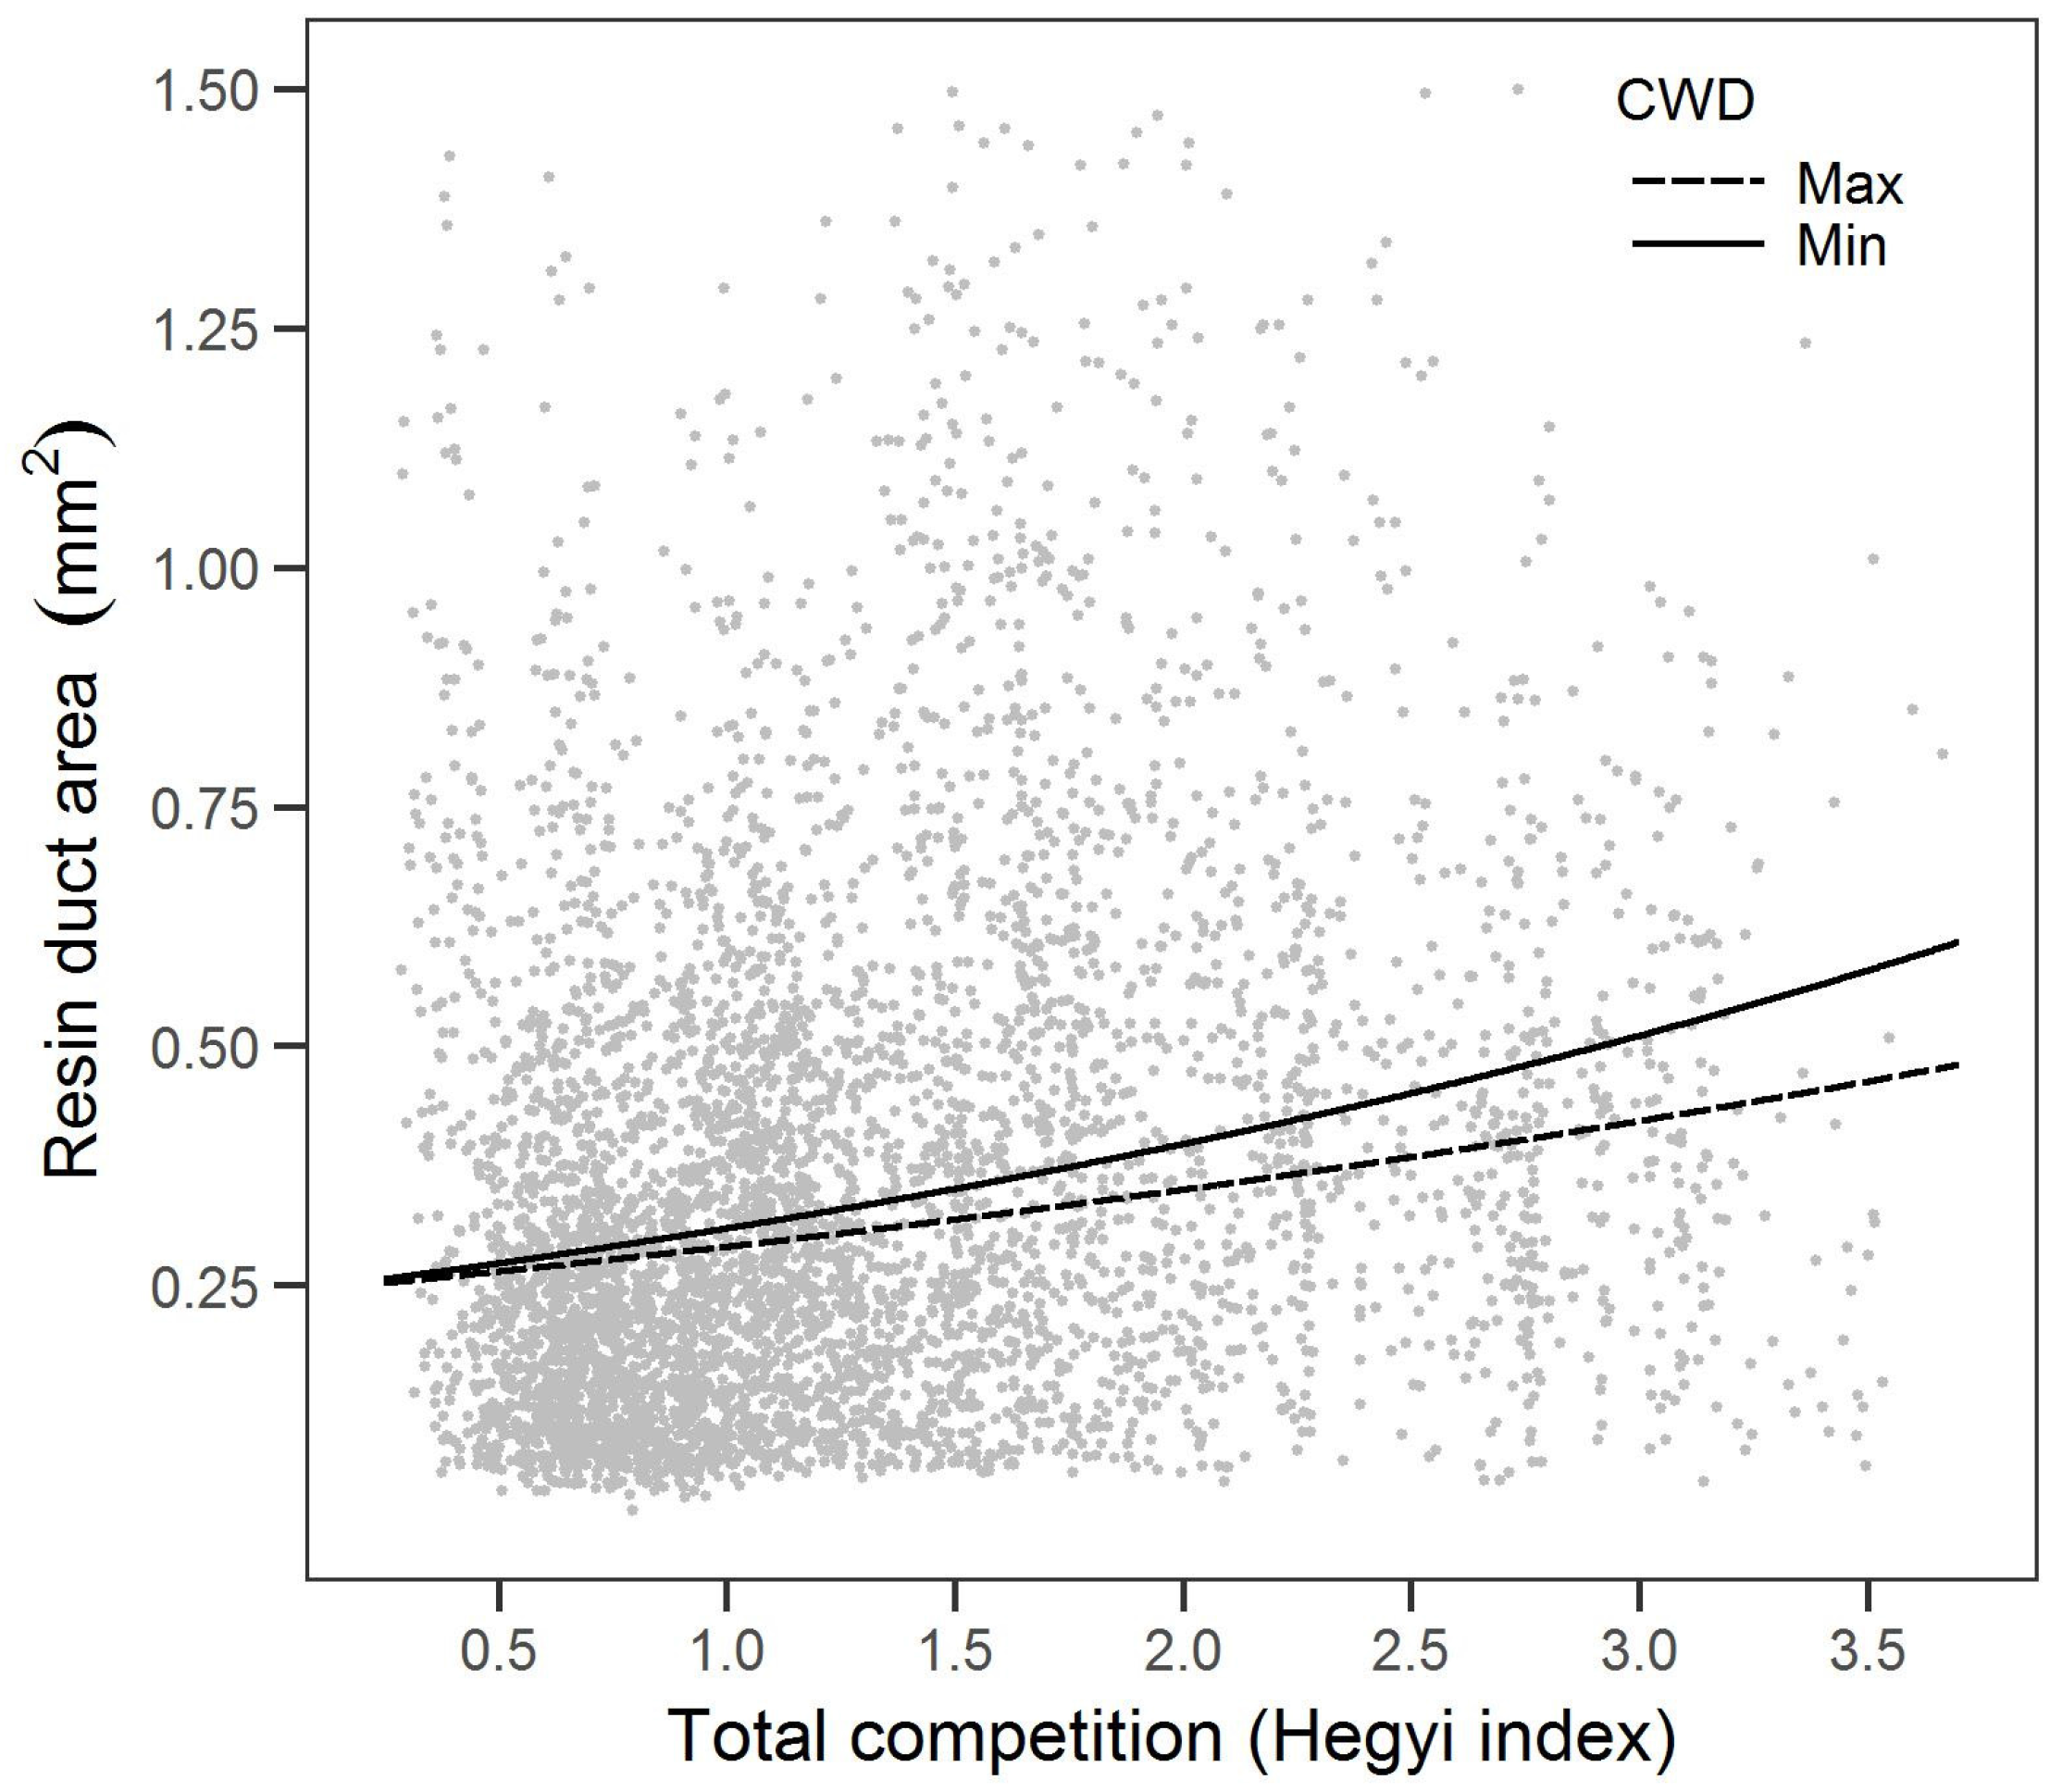
Notably, this is the first study we know of that examined the relationship between resin duct defense and competition. We found that higher total competition was associated with smaller resin ducts but resulted in greater total resin duct area. Increases in resin duct total area with competition are consistent with the growth-differentiation balance hypothesis [20]. Specifically, competition-induced reductions in growth potentially allowed more carbohydrates to be allocated to resin ducts. The growth-differentiation balance hypothesis predicts that when environmental factors (e.g., water or nutrients) limit growth more than photosynthesis, carbon is directed towards the secondary metabolism, including defense. However, we also observed a reduction in resin duct size with more competition, which is counter to expectations of the growth-differentiation balance hypothesis. Despite more carbon allocation to resin duct defenses, specific resin duct characteristics (e.g., size and total area) may respond differently when the secondary metabolism is prioritized, although more research is needed. Conversely, trees with higher competition may limit resources sufficiently to reduce carbon allocation to both growth and defense. These conflicting results highlight the difficulty of directly examining the growth-differentiation balance hypothesis [67]. We only examined xylem resin duct structures in our study, which represents a small subset of the defense characteristics of the whole tree (e.g., oleoresin, resin ducts in the branches and needles).
A more competitive environment that results in more resin duct total area suggests a potential induced response that may be similar to the induced response to disturbances (e.g., fire and pathogens) [30,68]. However, an increase in the total resin duct area and a decrease in resin duct size may confer different effects on tree defensibility through resin production and delivery. More resin duct area may result in a larger reservoir of resin available to pitch out invading pests [27], but small resin ducts may also result in reduced resin flow (i.e., rate of resin delivered). Following Poiseuille’s law, decreases in resin duct size should decrease resin flow by the fourth power [69]. This increase in resistance to resin flow may partially explain observations of decreased resin flow with greater competition [70] but requires more direct examination.

4.3. Recent Trends and Future Implications

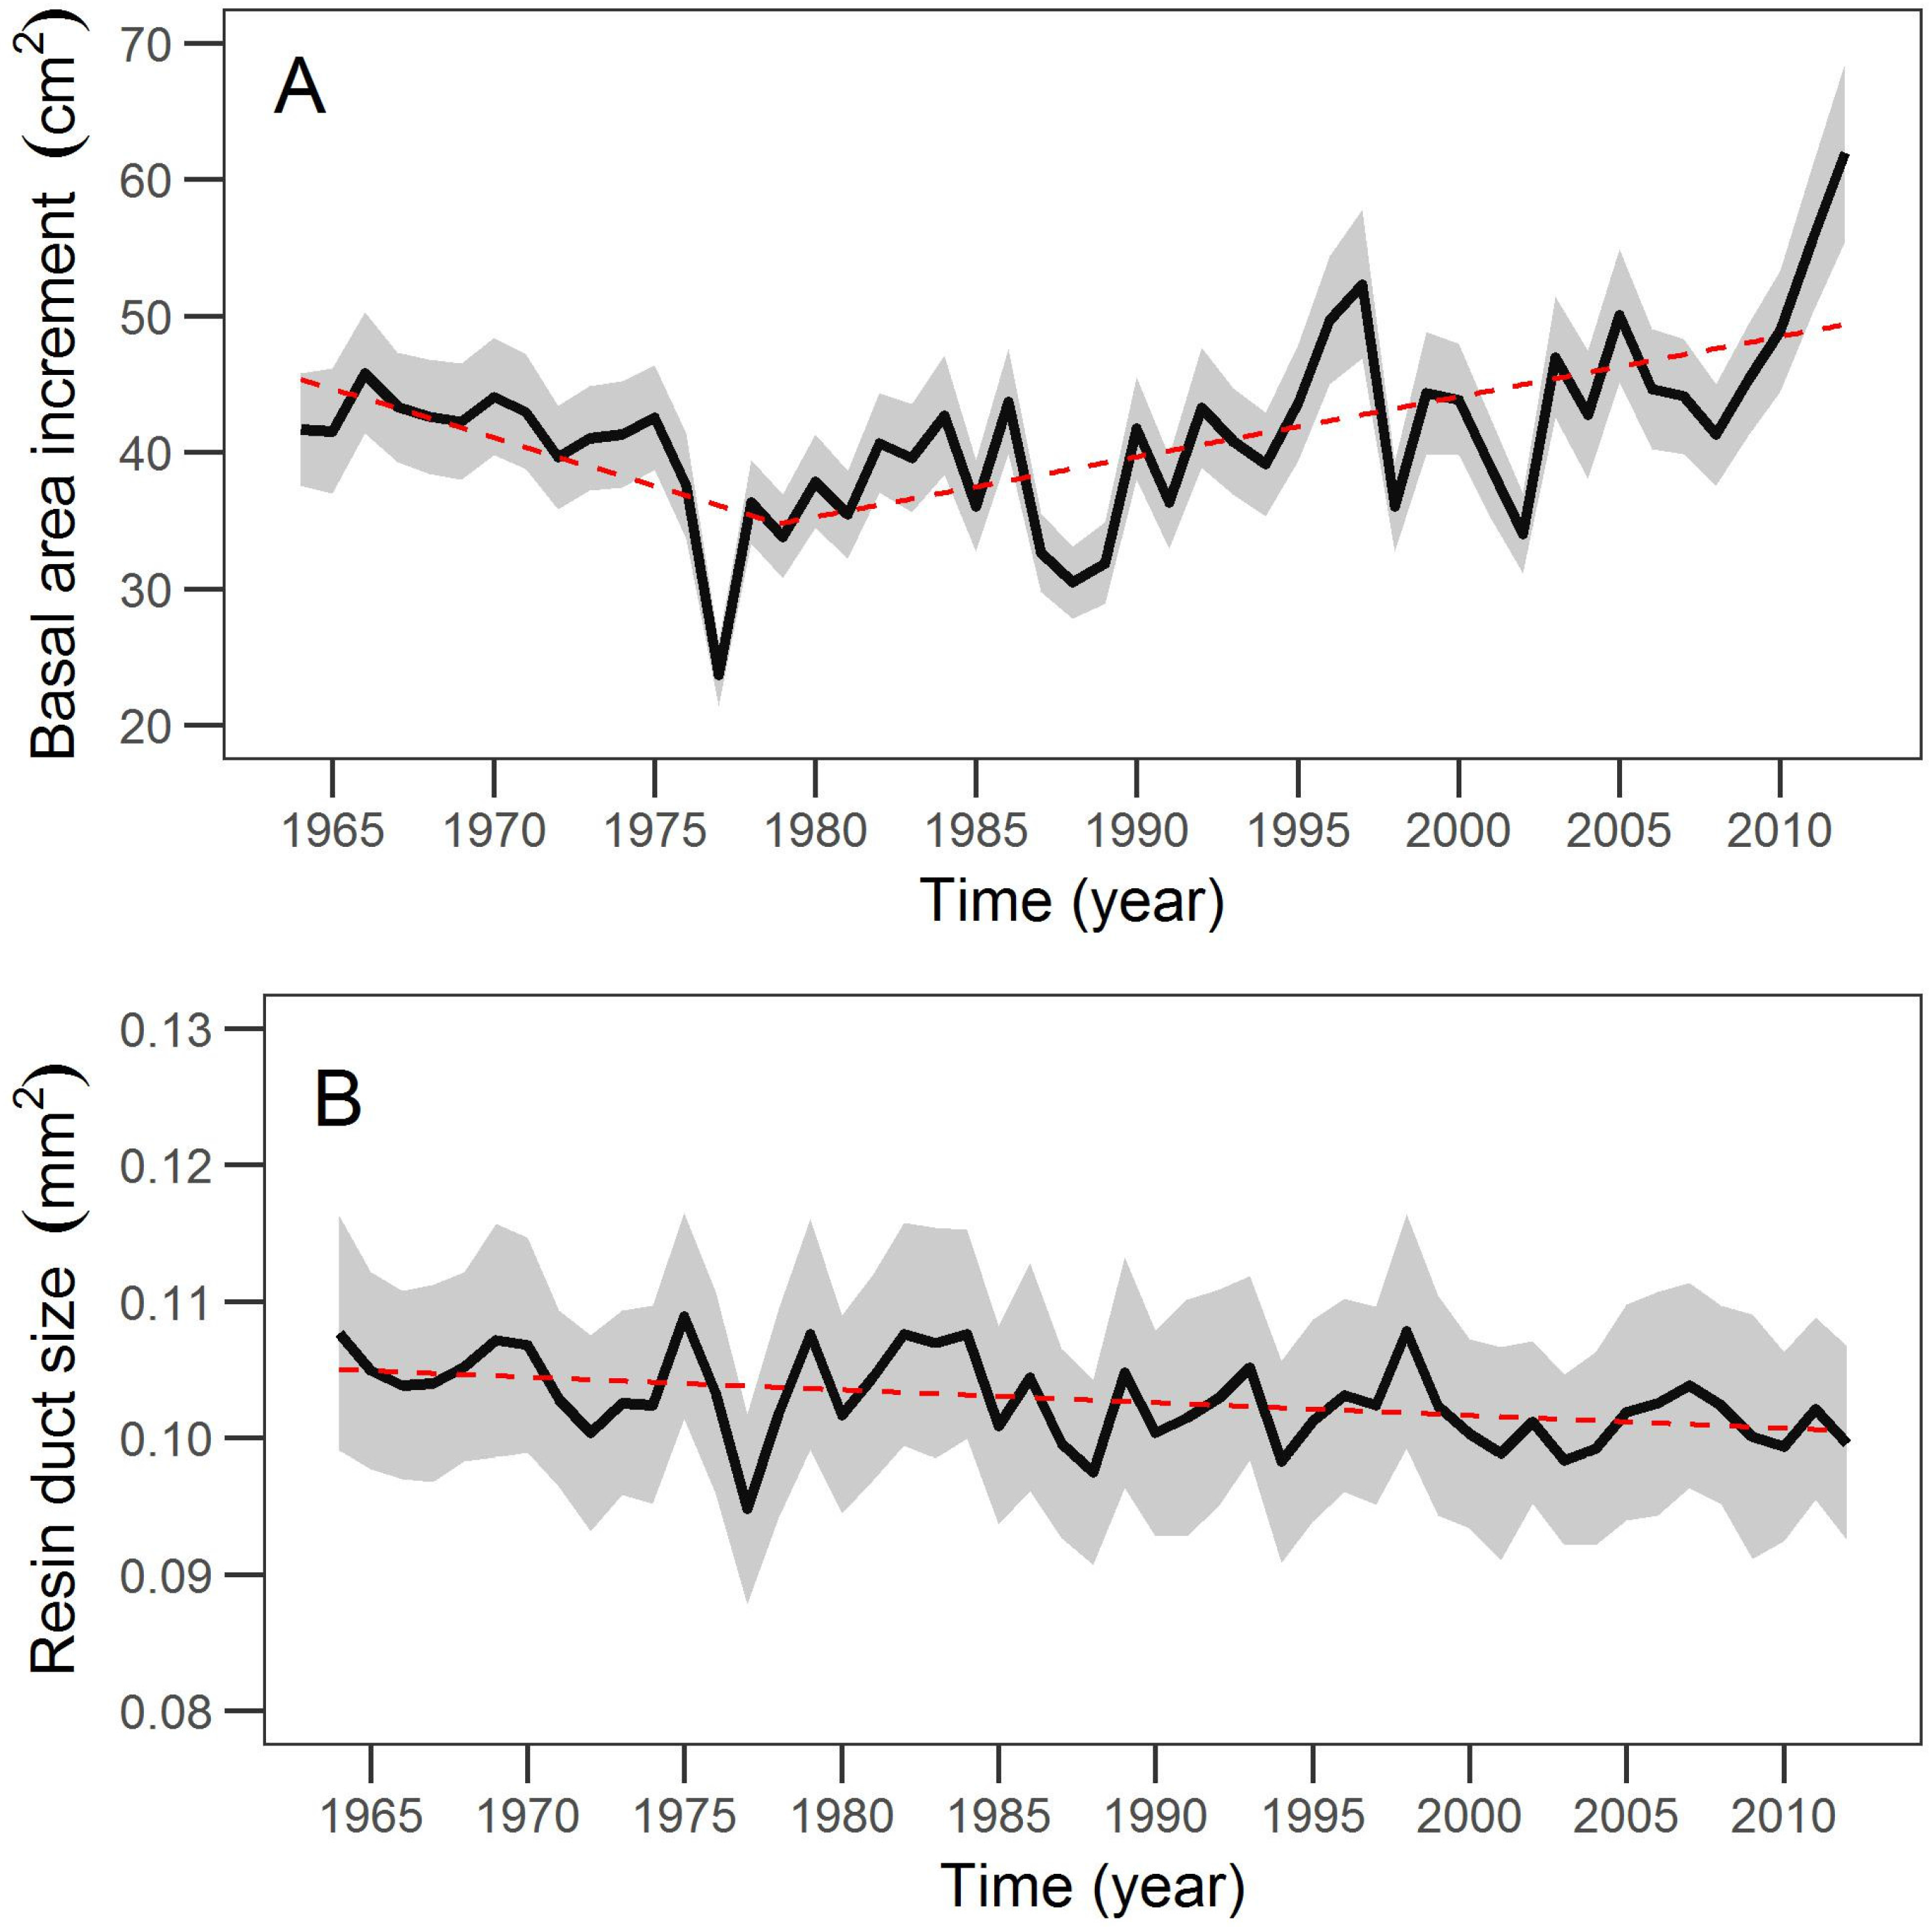
The differing long-term trends in the growth and defense of large sugar pines over the past 50 years were associated with concurrent increases in temperature and climate water deficit. Growth was clearly partitioned into two trends, a negative trend punctuated by a severe drought in 1977 and a positive trend since the late 1970s. This shift in growth pattern may partially reflect shifts in climate teleconnections such as the Pacific Decadal Oscillation (PDO), which had a phase shift from warm to cool during the late 1970’s [71]. However, the persistent increase in growth also coincided with rapid temperature increases in the Sierra Nevada during the same period [72]. The temporal pattern of resin duct size differed from growth and consisted of a more subtle but persistent decrease over the time period examined. This trend suggests that resin duct size was likely more responsive to increased competition over time.
Climate projections indicate that increased temperature and climatic water deficit will likely continue [5] and, based on our findings, may result in increased growth and decreased resin duct size in large sugar pines. However, the positive relationship between growth and temperature may eventually reach a threshold at which rising temperatures will contribute to sufficient drought stress that begins to limit growth. Our data did not indicate that such a threshold between temperature and growth had been reached during the past 50 years. Temperature-growth relationship thresholds have not been established for sugar pines but have been observed in conifers at high latitudes and elevations [73,74].
Climate changes can also affect bark beetle outbreaks and the ability of large sugar pines to defend against attack. Warmer winter temperatures have been linked to higher bark beetle populations, leading to an increase in the occurrence of outbreaks [16,17]. Climatic water deficit is projected to increase by as much as 23% by 2050 due to climate change-induced warming [54], which may result in smaller resin ducts that may further reduce defense against bark beetle attack. This and other potential climate changes could have a compounding effect on bark beetle-related mortality for sugar pines by creating favorable conditions for bark beetle outbreaks and weakened resin duct defenses.
In forests where fire exclusion continues to persist, competition could have a contrasting influence on resin duct defense, wherein resin duct size decreases but resin duct total area increases through the production of a higher density of smaller resin ducts [8,27]. In other words, there could be more resin available with higher resin duct total area but reduced resin flow due to increased resistance in resin flow independent of direct impacts to resin production [27]. However, if higher tree densities persists due to continued fire exclusion, some large sugar pines may experience reduced competition due to increased mortality rates (e.g., density dependent mortality, bark beetle attacks, and drought) [42], leading to fewer resin ducts that cover less area but are larger in size.
The impacts of climate and competition on large sugar pine growth and defense have potential implications for tree mortality. Slow growth and other patterns often indicate a higher probability of mortality [23,24,25,75]. In some cases, resin duct variables are better predictors of mortality than growth [8,29]. Trees with smaller resin ducts and less total resin duct area have been associated with greater probability of mortality [28,30]. Conversely, our observations of decreased resin duct size over time may indicate greater mortality risk. Regardless, continued increases in climatic water deficit may cause growth and defense to reach a threshold that could contribute to increases in large sugar pine mortality.
This study highlights that large sugar pine growth and defense had contrasting relationships with climate and competition, suggesting that measures of tree vigor may have differing responses to future changes. Competitive stress related to fire exclusion could result in the allocation of more carbon to resin duct defenses but could decrease the size of resin ducts, reducing resin flow. While the effects of climate and competition on tree vigor are complex, our research provides a better understanding on the factors related to large sugar pine vigor with potential implications for forest health modeling and forest management treatments (e.g., thinning and burning).

Acknowledgments

This project was funded and supported by the USDA Forest Service Pacific Southwest Research Station (PSW). The fieldwork for this project was carried out in the Summer of 2014 with help from Nickolas Zeibig-Kichas and the PSW research field crew (Julia Fields, Mark Hilgers, Marissa Vossmer, and Martha Langill). Bob Carlson provided essential tools in the field. In the HSU Wildland Fire Lab, Amber Shearer assisted with data processing.

Author Contributions

J.K. and E.K. conceived and designed the study and provided the review for the analysis and written paper; A.S. designed the study, performed the data collection, analyzed the data, and wrote the paper; and R.S. provided the review for the study design, analysis, and written paper.

Conflicts of Interest

The authors declare no conflict of interest.

Appendix A

Table A1. Diameter at breast height (DBH) from basal diameter (BD) and bark thickness (BT) from DBH equations by species that were developed by using linear regression analysis of field-based measurements on a subset of trees at the Stanislaus-Tuolumne Experimental Forest study site.
Diameter at Breast Height (cm)Bark Thickness (cm)
SpeciesnEquationR²nEquationR²
White fir (Abies concolor)1622DBH = 0.8224 × (BD) ‒ 0.55280.99365BT = 0.067113 × (DBH) + 0.1020790.84
Incense cedar (Calocedrus decurrens)731DBH = 0.8306 × (BD) ‒ 1.98410.99221BT = 0.092977 × (DBH) + 0.0578220.85
Sugar pine (Pinus lambertiana)387DBH = 0.8779 × (BD) ‒ 2.94930.99189BT = 0.059215 × (DBH) + 0.6581140.78
Jeffrey pine (Pinus jeffreyi)41DBH = 0.8470 × (BD) ‒ 2.12380.9851BT = 0.070095 × (DBH) + 0.4045980.82
Ponperosa pine (Pinus ponderosa)30DBH = 0.8463 × (BD) ‒ 2.71090.9840BT = 0.061901 × (DBH) + 0.8335140.78

Appendix B

Table A2. Species equations to estimate the last year of growth in dead competitor trees from decay class and diameter at breast height (DBH) from dead trees sampled at the Stanislaus-Tuolumne Experimental Forest. All equations were constructed using linear regression.
Last Year of Growth (year)
SpeciesnEquationR²
White fir (Abies concolor)19Year = 2013.37395 − 3.01157 × (decay class) + 0.05148 × (DBH)0.67
Incense cedar (Calocedrus decurrens)20Year = 2016.96708 − 5.24412 × (decay class) + 0.09327 × (DBH)0.62
Sugar pine (Pinus lambertiana)13Year = 2012.73560 − 3.76571 × (decay class) + 0.02657 × (DBH)0.76

References

  1. Moore, M.M.; Huffman, D.W.; Fulé, P.Z.; Covington, W.W.; Crouse, J.E. Comparison of historical and contemporary forest structure and composition on permanent plots in southwestern ponderosa pine forests. For. Sci. 2004, 50, 162–176. [Google Scholar]
  2. Hagmann, R.K.; Franklin, J.F.; Johnson, K.N. Historical structure and composition of ponderosa pine and mixed-conifer forests in south-central Oregon. For. Ecol. Manag. 2013, 304, 492–504. [Google Scholar] [CrossRef]
  3. Knapp, E.E.; Skinner, C.N.; North, M.P.; Estes, B.L. Long-term overstory and understory change following logging and fire exclusion in a Sierra Nevada mixed-conifer forest. For. Ecol. Manag. 2013, 310, 903–914. [Google Scholar] [CrossRef]
  4. Pallardy, S.G. Physiology of Woody Plants, 3rd ed.; Elsevier: Amsterdam, The Netherlands; Boston, MA, USA, 2008; ISBN 978-0-12-088765-1. [Google Scholar]
  5. Melillo, J.M.; Richmond, T.; Yohe, G.W. Climate Change Impacts in the United States: The Third National Climate Assessment; U.S. Global Change Research Program: Washington, DC, USA, 2014; p. 148. [Google Scholar]
  6. Adams, H.D.; Guardiola-Claramonte, M.; Barron-Gafford, G.A.; Villegas, J.C.; Breshears, D.D.; Zou, C.B.; Troch, P.A.; Huxman, T.E. Temperature sensitivity of drought-induced tree mortality portends increased regional die-off under global-change-type drought. Proc. Natl. Acad. Sci. USA 2009, 106, 7063–7066. [Google Scholar] [CrossRef] [PubMed]
  7. Dobbertin, M. Tree growth as indicator of tree vitality and of tree reaction to environmental stress: A review. Eur. J. For. Res. 2005, 124, 319–333. [Google Scholar] [CrossRef]
  8. Kane, J.M.; Kolb, T.E. Importance of resin ducts in reducing ponderosa pine mortality from bark beetle attack. Oecologia 2010, 164, 601–609. [Google Scholar] [CrossRef] [PubMed]
  9. Smith, T.F.; Rizzo, D.M.; North, M. Patterns of mortality in an old-growth mixed-conifer forest of the southern Sierra Nevada, California. For. Sci. 2005, 51, 266–275. [Google Scholar]
  10. Van Mantgem, P.J.; Schwilk, D.W. Negligible influence of spatial autocorrelation in the assessment of fire effects in a mixed conifer forest. Fire Ecol. 2009, 5, 116–125. [Google Scholar] [CrossRef]
  11. Allen, C.D.; Macalady, A.K.; Chenchouni, H.; Bachelet, D.; McDowell, N.; Vennetier, M.; Kitzberger, T.; Rigling, A.; Breshears, D.D.; Hogg, E.H.; et al. A global overview of drought and heat-induced tree mortality reveals emerging climate change risks for forests. For. Ecol. Manag. 2010, 259, 660–684. [Google Scholar] [CrossRef]
  12. Lutz, J.A.; van Wagtendonk, J.W.; Franklin, J.F. Twentieth-century decline of large-diameter trees in Yosemite National Park, California, USA. For. Ecol. Manag. 2009, 257, 2296–2307. [Google Scholar] [CrossRef]
  13. Bennett, A.C.; McDowell, N.G.; Allen, C.D.; Anderson-Teixeira, K.J. Larger trees suffer most during drought in forests worldwide. Nat. Plants 2015, 1, 15139. [Google Scholar] [CrossRef] [PubMed]
  14. Kolb, T.E.; Agee, J.K.; Fulé, P.Z.; McDowell, N.G.; Pearson, K.; Sala, A.; Waring, R.H. Perpetuating old ponderosa pine. For. Ecol. Manag. 2007, 249, 141–157. [Google Scholar] [CrossRef]
  15. Lindenmayer, D.B.; Laurance, W.F.; Franklin, J.F. Global decline in large old trees. Science 2012, 338, 1305–1306. [Google Scholar] [CrossRef] [PubMed]
  16. Raffa, K.F.; Aukema, B.H.; Bentz, B.J.; Carroll, A.L.; Hicke, J.A.; Turner, M.G.; Romme, W.H. Cross-scale drivers of natural disturbances prone to anthropogenic amplification: The dynamics of bark beetle eruptions. Bioscience 2008, 58, 501–517. [Google Scholar] [CrossRef]
  17. Meddens, A.J.; Hicke, J.A.; Ferguson, C.A. Spatiotemporal patterns of observed bark beetle-caused tree mortality in British Columbia and the western United States. Ecol. Appl. 2012, 22, 1876–1891. [Google Scholar] [CrossRef] [PubMed]
  18. Stamp, N. Out of the quagmire of plant defense hypotheses. Q. Rev. Biol. 2003, 78, 23–55. [Google Scholar] [CrossRef] [PubMed]
  19. Lorio, P.L., Jr. Growth-differentiation balance: A basis for understanding southern pine beetle-tree interactions. For. Ecol. Manag. 1986, 14, 259–273. [Google Scholar] [CrossRef]
  20. Herms, D.A.; Mattson, W.J. The dilemma of plants: To grow or defend. Q. Rev. Biol. 1992, 67, 283–335. [Google Scholar] [CrossRef]
  21. Endara, M.-J.; Coley, P.D. The resource availability hypothesis revisited: A meta-analysis: Revisiting the resource availability hypothesis. Funct. Ecol. 2011, 25, 389–398. [Google Scholar] [CrossRef]
  22. Pedersen, B.S. The role of stress in the mortality of midwestern oaks as indicated by growth prior to death. Ecology 1998, 79, 79. [Google Scholar] [CrossRef]
  23. Bigler, C.; Bugmann, H. Growth-dependent tree mortality models based on tree rings. Can. J. For. Res. 2003, 33, 210–221. [Google Scholar] [CrossRef]
  24. Das, A.J.; Battles, J.J.; Stephenson, N.L.; van Mantgem, P.J. The relationship between tree growth patterns and likelihood of mortality: A study of two tree species in the Sierra Nevada. Can. J. For. Res. 2007, 37, 580–597. [Google Scholar] [CrossRef]
  25. Kane, J.M.; Kolb, T.E. Short- and long-term growth characteristics associated with tree mortality in southwestern mixed-conifer forests. Can. J. For. Res. 2014, 44, 1227–1235. [Google Scholar] [CrossRef]
  26. Franceschi, V.R.; Krokene, P.; Christiansen, E.; Krekling, T. Anatomical and chemical defenses of conifer bark against bark beetles and other pests: Tansley review. New Phytol. 2005, 167, 353–376. [Google Scholar] [CrossRef] [PubMed]
  27. Hood, S.; Sala, A. Ponderosa pine resin defenses and growth: Metrics matter. Tree Physiol. 2015, 35, 1223–1235. [Google Scholar] [CrossRef] [PubMed]
  28. Gaylord, M.L.; Kolb, T.E.; Pockman, W.T.; Plaut, J.A.; Yepez, E.A.; Macalady, A.K.; Pangle, R.E.; McDowell, N.G. Drought predisposes piñon-juniper woodlands to insect attacks and mortality. New Phytol. 2013, 198, 567–578. [Google Scholar] [CrossRef] [PubMed]
  29. Ferrenberg, S.; Kane, J.M.; Mitton, J.B. Resin duct characteristics associated with tree resistance to bark beetles across lodgepole and limber pines. Oecologia 2014, 174, 1283–1292. [Google Scholar] [CrossRef] [PubMed]
  30. Hood, S.; Sala, A.; Heyerdahl, E.K.; Boutin, M. Low-severity fire increases tree defense against bark beetle attacks. Ecology 2015, 96, 1846–1855. [Google Scholar] [CrossRef] [PubMed]
  31. Trujillo, E.; Molotch, N.P.; Goulden, M.L.; Kelly, A.E.; Bales, R.C. Elevation-dependent influence of snow accumulation on forest greening. Nat. Geosci. 2012, 5, 705–709. [Google Scholar] [CrossRef]
  32. Das, A.J.; Stephenson, N.L.; Flint, A.; Das, T.; van Mantgem, P.J. Climatic correlates of tree mortality in water- and energy-limited forests. PLoS ONE 2013, 8, e69917. [Google Scholar] [CrossRef] [PubMed]
  33. Contreras, M.A.; Affleck, D.; Chung, W. Evaluating tree competition indices as predictors of basal area increment in western Montana forests. For. Ecol. Manag. 2011, 262, 1939–1949. [Google Scholar] [CrossRef]
  34. Sánchez-Salguero, R.; Linares, J.C.; Camarero, J.J.; Madrigal-González, J.; Hevia, A.; Sánchez-Miranda, Á.; Ballesteros-Cánovas, J.A.; Alfaro-Sánchez, R.; García-Cervigón, A.I.; Bigler, C.; et al. Disentangling the effects of competition and climate on individual tree growth: A retrospective and dynamic approach in Scots pine. For. Ecol. Manag. 2015, 358, 12–25. [Google Scholar] [CrossRef]
  35. Zhang, J.; Huang, S.; He, F. Half-century evidence from western Canada shows forest dynamics are primarily driven by competition followed by climate. Proc. Natl. Acad. Sci. USA 2015, 112, 4009–4014. [Google Scholar] [CrossRef] [PubMed]
  36. Das, A. The effect of size and competition on tree growth rate in old-growth coniferous forests. Can. J. For. Res. 2012, 42, 1983–1995. [Google Scholar] [CrossRef]
  37. Wimmer, R.; Grabner, M. Effects of climate on vertical resin duct density and radial growth of Norway spruce [Picea abies (L.) Karst.]. Trees 1997, 11, 271–276. [Google Scholar] [CrossRef]
  38. Slack, A.W.; Zeibig-Kichas, N.E.; Kane, J.M.; Varner, J.M. Contingent resistance in longleaf pine (Pinus palustris) growth and defense 10 years following smoldering fires. For. Ecol. Manag. 2016, 364, 130–138. [Google Scholar] [CrossRef]
  39. Saracino, A.; Rita, A.; Rossi, S.; Andreu-Hayles, L.; Helle, G.; Todaro, L. Climatic signal from Pinus leucodermis axial resin ducts: A tree-ring time series approach. Eur. J. For. Res. 2016. [Google Scholar] [CrossRef]
  40. Griffin, D.; Anchukaitis, K.J. How unusual is the 2012–2014 California drought? Geophys. Res. Lett. 2014, 41, 9017–9023. [Google Scholar] [CrossRef]
  41. McIntyre, P.J.; Thorne, J.H.; Dolanc, C.R.; Flint, A.L.; Flint, L.E.; Kelly, M.; Ackerly, D.D. Twentieth-century shifts in forest structure in California: Denser forests, smaller trees, and increased dominance of oaks. Proc. Natl. Acad. Sci. USA 2015, 112, 1458–1463. [Google Scholar] [CrossRef] [PubMed]
  42. Van Mantgem, P.J.; Stephenson, N.L.; Keifer, M.; Keeley, J. Effects of an introduced pathogen and fire exclusion on the demography of sugar pine. Ecol. Appl. 2004, 14, 1590–1602. [Google Scholar] [CrossRef]
  43. PRISM Climate Group. Oregon State University. Available online: http://prism.oregonstate.edu.
  44. Slack, A.W. Large Sugar Pine (Pinus Lambertiana) Vigor and Mortality in a Fire Excluded Forests of the Central Sierra Nevada; Humboldt State Univeristy: Arcata, CA, USA, 2016. [Google Scholar]
  45. Sillett, S.C.; Van Pelt, R.; Carroll, A.L.; Kramer, R.D.; Ambrose, A.R.; Trask, D. How do tree structure and old age affect growth potential of California redwoods? Ecol. Monogr. 2015, 85, 181–212. [Google Scholar] [CrossRef]
  46. Imbeau, L.; Desrochers, A. Foraging Ecology and Use of Drumming Trees by Three-Toed Woodpeckers. J. Wildl. Manag. 2002, 66, 222. [Google Scholar] [CrossRef]
  47. Regent Instruments Inc. WinDendro; Regent Instruments Inc.: Quebec, QC, Canada, 2014. [Google Scholar]
  48. Grissino-Mayer, H.D. Evaluating crossdating accuracy: A manual and tutorial for the computer program COFECHA. Tree-Ring Res. 2001, 57, 205–221. [Google Scholar]
  49. Biondi, F.; Qeadan, F. A theory-driven approach to tree-ring standardization: Defining the biological trend from expected basal area increment. Tree-Ring Res. 2008, 64, 81–96. [Google Scholar] [CrossRef]
  50. Speer, J.H. Fundamentals of Tree-Ring Research; University of Arizona Press: Tucson, AZ, USA, 2010; ISBN 978-0-8165-2684-0. [Google Scholar]
  51. Rasband, W.S. ImageJ; U.S. National Institutes of Health: Bethesda, MD, USA, 2014. [Google Scholar]
  52. Dyer, J.M. Assessing topographic patterns in moisture use and stress using a water balance approach. Landsc. Ecol. 2009, 24, 391–403. [Google Scholar] [CrossRef]
  53. Stephenson, N. Actual evapotranspiration and deficit: Biologically meaningful correlates of vegetation distribution across spatial scales. J. Biogeogr. 1998, 25, 855–870. [Google Scholar] [CrossRef]
  54. Lutz, J.A.; van Wagtendonk, J.W.; Franklin, J.F. Climatic water deficit, tree species ranges, and climate change in Yosemite National Park. J. Biogeogr. 2010, 37, 936–950. [Google Scholar] [CrossRef]
  55. Hegyi, F. A simulation model for managing jack pine stands. In Growth Models for Tree and Stand Simulation; Fries, J., Ed.; Royal College of Forestry: Stockholm, Sweden, 1974; pp. 74–90. [Google Scholar]
  56. Biging, G.S.; Dobbertin, M. A comparison of distant-dependent competition measures for height and basal area growth of individual conifer trees. For. Sci. 1992, 41, 360–377. [Google Scholar]
  57. R Development Core Team. R: A Language and Environment for Statistical Computing; R Foundation for Statistical Computing: Vienna, Austria, 2017. [Google Scholar]
  58. Zang, C.; Biondi, F. Treeclim: An R package for the numerical calibration of proxy-climate relationships. Ecography 2015, 38, 431–436. [Google Scholar] [CrossRef]
  59. Bates, D.; Maechler, M.; Bolker, B.; Walker, S.; Christensen, R.H.B.; Singmann, H.; Grothendieck, G. Linear Mixed-Effects Models Using Eigen and S4; lme4:Linerar Mixed-Effects Models Using Eigen and S4; R Foundation for Statistical Computing: Vienna, Austria, 2014. [Google Scholar]
  60. Burnham, K.P.; Anderson, D.R. Model Selection and Inference: A Practical Information-Teoretic Approach; Springer: New York, NY, USA, 1998. [Google Scholar]
  61. Muggeo, V.M. Segmented: An R package to fit regression models with broken-line relationships. R News 2008, 8, 20–25. [Google Scholar]
  62. Bunn, A.G.; Graumlich, L.J.; Urban, D.L. Trends in twentieth-century tree growth at high elevations in the Sierra Nevada and White Mountains, USA. Holocene 2005, 15, 481–488. [Google Scholar] [CrossRef]
  63. Westerling, A.L.; Hidalgo, H.G.; Cayan, D.R.; Swetnam, T.W. Warming and earlier spring increase western U.S. forest wildfire activity. Science 2006, 313, 940–943. [Google Scholar] [CrossRef] [PubMed]
  64. Sheffield, J. A simulated soil moisture based drought analysis for the United States. J. Geophys. Res. 2004, 109. [Google Scholar] [CrossRef]
  65. Bentz, B.J.; Hood, S.A.; Hansen, E.M.; Vandygriff, J.C.; Mock, K.E. Defense traits in the long-lived Great Basin bristlecone pine and resistance to the native herbivore mountain pine beetle. New Phytol. 2016. [Google Scholar] [CrossRef] [PubMed]
  66. Ferrenberg, S.; Langenhan, J.M.; Loskot, S.A.; Rozal, L.M.; Mitton, J.B. Differential drivers of chemical defenses in three widespread pine species along a 1500-m elevational gradient: A test of the elevational gradient plant defense hypothesis. PeerJ Prepr. 2017, 5, e2733v1. [Google Scholar]
  67. Stamp, N. Can the growth–differentiation balance hypothesis be tested rigorously? Oikos 2004, 107, 439–448. [Google Scholar] [CrossRef]
  68. Bonello, P.; Gordon, T.R.; Storer, A.J. Systemic induced resistance in Monterey pine. For. Pathol. 2001, 31, 99–106. [Google Scholar] [CrossRef]
  69. Schopmeyer, C.S.; Mergen, F.; Evens, T.C. Applicability of Poiseuille’s law to exudation of oleoresin from wounds on slash pine. Plant. Physiol. 1954, 29, 82–87. [Google Scholar] [CrossRef] [PubMed]
  70. McDowell, N.G.; Adams, H.D.; Bailey, J.D.; Kolb, T.E. The role of stand density on growth efficiency, leaf area index, and resin flow in southwestern ponderosa pine forests. Can. J. For. Res. 2007, 37, 343–355. [Google Scholar] [CrossRef]
  71. Mantua, N.J.; Hare, S.R.; Zhang, Y.; Wallace, J.M.; Francis, R.C. A Pacific interdecadal climate oscillation with impacts on salmon production. Bull. Am. Meteorol. Soc. 1997, 78, 1069–1079. [Google Scholar] [CrossRef]
  72. Taylor, A.H.; Trouet, V.; Skinner, C.N.; Stephens, S. Socioecological transitions trigger fire regime shifts and modulate fire–climate interactions in the Sierra Nevada, USA, 1600–2015 CE. Proc. Natl. Acad. Sci. USA 2016, 113, 13684–13689. [Google Scholar] [CrossRef] [PubMed]
  73. D’Arrigo, R.D.; Kaufmann, R.K.; Davi, N.; Jacoby, G.C.; Laskowski, C.; Myneni, R.B.; Cherubini, P. Thresholds for warming-induced growth decline at elevational tree line in the Yukon Territory, Canada. Glob. Biogeochem. Cycles 2004, 18. [Google Scholar] [CrossRef]
  74. Wilmking, M.; Juday, G.P.; Barber, V.A.; Zald, H.S.J. Recent climate warming forces contrasting growth responses of white spruce at treeline in Alaska through temperature thresholds. Glob. Chang. Biol. 2004, 10, 1724–1736. [Google Scholar] [CrossRef]
  75. Cailleret, M.; Jansen, S.; Robert, E.M.R.; Desoto, L.; Aakala, T.; Antos, J.A.; Beikircher, B.; Bigler, C.; Bugmann, H.; Caccianiga, M.; et al. A synthesis of radial growth patterns preceding tree mortality. Glob. Chang. Biol. 2017, 23, 1675–1690. [Google Scholar] [CrossRef] [PubMed]
Figure 1. Map showing the location of the Stanislaus-Tuolumne Experimental Forest within the range of sugar pine.
Forests 08 00244 g001
Figure 2. A high-resolution photo of a sugar pine increment core with vertical resin ducts.
Forests 08 00244 g002
Figure 3. The relationship of basal area increment (BAI) with (A) the January temperature and (B) intraspecific competition for all subject sugar pines across all years. The interaction of temperature and precipitation is represented in panel A by showing the relationship between the January temperature and BAI when wet season precipitation was the highest (dashed) and the lowest (solid). Trend lines are based on the top model for BAI and are shown to visualize the relationship for single predictors by including the mean for all other predictors.
Forests 08 00244 g003
Figure 4. The relationships between resin duct size and the two strongest predictors: (A) climatic water deficit and (B) total competition for all subject sugar pines across all years. The trend line in each panel is based on the top model for resin duct size and visualizes the relationship for single predictors by including the mean for all other predictors. Resin duct size was smaller when climatic water deficit and total competition were higher.
Forests 08 00244 g004
Figure 5. The relationship between resin duct total area and total competition for all subject sugar pines across all years. The interaction of total competition and climatic water deficit (CWD) is represented by showing the relationship between resin duct total area and the total competition when CWD was the lowest (dashed) and the highest (solid). Trend lines are based on the top resin duct total area model to visualize the relationship for single predictors by including the mean for all other predictors.
Forests 08 00244 g005
Figure 6. Changes in (A) basal area increment and (B) resin duct size from 1964 to 2012. The basal area increment increased by 0.17 cm2 year−1 (p = 0.0076, R2 = 0.14) from 1978 to 2012, and the resin duct size decreased by 0.0001 mm2 year−1 (p = 0.0022, R2 = 0.17) during the full study time period. The dashed line represents the trend, and the shaded area is the 95% confidence interval.
Forests 08 00244 g006
Table 1. Generalized linear mixed model results for growth (basal area increment) in large sugar pines. There were no additional models within two Akaike’s information criterion (AIC) of the top model.
Growth ModelsKAICΔ AICAIC wtLLR2RMSE
Jan temp + Wet precip + Jan temp × Wet precip + Inter comp + Intra comp939,546.030.001.00−19,764.010.8110.05
Jan temp × Wet precip (climate only)739,632.8486.810.00−19,809.420.8010.24
Inter comp + Intra comp (competition only)640,111.22565.190.00−20,049.610.7810.90
Previous BAI + 1|Tree (null model)440,188.05642.020.00−20,090.020.7711.05
Note: The predictor variables include the January temperature of the current year (Jan temp), total wet season precipitation (Wet precip), the interaction of temperature and precipitation (Jan temp × Wet precip), interspecific competition (Inter comp), and intraspecific competition (Intra comp). All models include the null model of previous basal area increment (Previous BAI) as a covariate and a tree with a random intercept (1|Tree). K is the number of parameters, AIC is Akaike’s information criterion, Δ AIC is the difference from the top model, AIC wt is the weight of each model, LL is the log likelihood, R2 is based on the relationship between the predicted and actual values of BAI, and RMSE is the root mean squared error.
Table 2. Summary of the top generalized linear mixed model with the lowest AIC for sugar pine growth (basal area increment). The standardized coefficient provides an estimate for the relative importance of each variable, wherein values further from 0 are more associated with changes in BAI.
Fixed EffectsCoefficient EstimateStandard Errorp-ValueStandardized CoefficientVIF
Intercept3.171040.05400<0.00010-
Jan temp0.064900.00237<0.00010.00491.7526
Wet precip0.000160.00001<0.00010.00271.0334
Jan temp × Wet precip−0.000030.00001<0.0001−0.00251.7100
Inter comp−0.177920.02989<0.0001−0.00401.0865
Intra comp−0.445390.07492<0.0001−0.00621.0859
Previous BAI0.125320.00028<0.00010.01231.0875
Note: The predictor variables include the January temperature of the current year (Jan temp), total wet season precipitation (Wet precip), the interaction of temperature and precipitation (Jan temp ×Wet precip), interspecific competition (Inter comp), intraspecific competition (Intra comp), and previous basal area increment (Previous BAI) as a covariate. VIF is the variance inflation factor.
Table 3. Generalized linear mixed models for sugar pine defense (resin duct size and total area). The reported model results include the top models (Δ AIC < 2), the top climate only model, the top competition only model, and the null model (i.e., no climate or competition variables included).
Defense ModelsKAICΔ AICAIC wtLLR2RMSE
Resin duct size
Wet temp + Wet precip + CWD + Total comp8−24,252.960.000.2112,134.480.65740.0223
Wet precip + CWD + Total comp7−24,252.910.050.2112,133.460.65730.0224
Wet precip + CWD + Total comp + Wet precip × Total comp8−24,252.110.850.1412,134.050.65720.0224
Wet precip + CWD + Inter comp7−24,251.521.440.1012,132.760.65730.0224
Wet temp + Wet precip + CWD + Inter comp + Intra comp9−24,251.471.490.1012,134.740.65700.0224
Wet precip + CWD + Total comp + Total comp × Wet temp8−24,251.341.630.0912,133.670.65730.0224
Wet precip + CWD + Inter comp + Intra comp8−24,251.161.800.0912,133.580.65720.0224
Wet temp + CWD (climate only)6−24,250.042.920.0512,131.020.65690.0224
Total comp (competition only)5−24,208.9644.000.0012,109.480.65370.0225
BAI + (1|Tree) (null model)4−24,202.9350.030.0012,105.460.65350.0225
Resin duct total area
Wet temp + Apr precip + Total comp + CWD × Total comp8−3811.910.000.501913.950.54000.2104
Wet temp + Apr precip + CWD + Total comp8−3810.901.010.301913.450.53980.2105
Wet Temp + Apr precip + CWD +Total comp + Apr precip × Total comp9−3809.981.920.191913.990.53990.2105
Wet temp + Apr precip + CWD (climate only)7−3789.0722.840.001901.540.54230.2099
Total comp (competition only)5−3753.8158.100.001881.900.53070.2125
BAI + (1|Tree) (null model)4−3740.1871.730.001874.090.53300.2119
Note: The predictor variables include average wet season temperature (Wet temp), total wet season precipitation (Wet precip), total April precipitation (April precip), climatic water deficit (CWD), total competition (Total comp), interspecific competition (Inter comp), and intraspecific competition (Intra comp). K is the number of parameters, Δ AIC is the difference from the top model, AIC wt is the weight of each model, LL is the log likelihood, R2 is based on the relationship between the predicted and actual values of defense, and RMSE is the root mean squared error.
Table 4. The top generalized linear mixed model for (top) resin duct size and (bottom) area. The standardized coefficient provides an estimate for the relative importance of each variable, wherein values further from 0 are more associated with changes in BAI.
Fixed EffectsCoefficient EstimateStandard Errorp-ValueStandardized CoefficientVIF
Resin duct size
Intercept−2.271450.04628<0.00010-
Wet temp−0.004860.003380.1510−0.13871.5892
Wet precip0.000020.000010.06270.16991.3971
CWD−0.000160.000050.0003−0.35021.5948
Total comp−0.047540.023440.0426−0.86341.0822
BAI0.001010.00025<0.00010.66011.1421
Resin duct total area
Intercept−1.851280.07785<0.00010-
Wet temp−0.031980.008270.0001−0.11181.4014
Apr precip0.000330.000060.00030.08931.0648
Total comp0.274870.04720<0.00010.61091.2393
CWD × Total comp −0.000190.00061<0.0001−0.13931.5328
BAI0.011930.000070.01100.87501.0875
Note: the predictor variables include the average wet season temperature (Wet temp), total wet season precipitation (Wet precip), total April precipitation (April precip), climatic water deficit (CWD), total competition (Total comp), and current basal area increment (BAI) as a covariate. VIF is the variance inflation factor.

