
Fine Root Dynamics in Afromontane Forest and Adjacent Land Uses in the Northwest Ethiopian Highlands


Institute of Forest Ecology, University of Natural Resources and Life Sciences (BOKU), Peter-Jordan-Straße 82, 1190 Vienna, Austria
*
Author to whom correspondence should be addressed.
Forests 2017, 8(7), 249; https://doi.org/10.3390/f8070249
Submission received: 2 June 2017
/
Revised: 6 July 2017
/
Accepted: 11 July 2017
/
Published: 13 July 2017
(This article belongs to the Special Issue Forest Fine Roots in Changing Climate)
Abstract
:Fine roots are a major pathway of C input into soils. The aim of this study was to quantify fine root stocks, production and turnover in natural forest and land use systems converted from forests in Ethiopia. The study was conducted in a remnant Afromontane forest, eucalyptus plantation and grass and cropland in NW Ethiopia. Fine root dynamics were investigated using three different methods: sequential coring, in-growth cores and in-growth nets. Soil cores for sequential analyses were taken in quarterly intervals, while in-growth cores and nets were harvested corresponding to 1-, 2-, 3-, 4-, 5-, 8- and 12-month interval. Fine root stocks averaged 564, 425, 56 and 46 g·m−2 in the forest, eucalyptus, grazing land and cropland ecosystems, respectively. The values decreased exponentially with increasing soil depth. In forest and eucalyptus, fine root biomass and necromass were highest in the dry season. Estimates of fine root production differed according to the method used. Fine root production based on in-growth coring averaged 468, 293, 70 and 52 g m−2·year−1. In general, land use conversion from forest to open lands reduced fine root production by 85–91%. The turnover rate of fine roots was 1.5 for forest and 2.1 for eucalyptus plantation.
1. Introduction
Assessments of fine roots by simple excavation techniques were started as early as the 18th Century [1]. Since then, in forests, most ecological studies on fine roots, their biomass distribution and turnover have been carried out in temperate and boreal ecosystems [2,3,4,5], while information for tropical areas in general, and African ecosystems in particular, is scarce. Subsequently, worldwide and regional ecosystem estimates of fine root production, turnover and carbon fluxes remain uncertain [6]. Due to a limited understanding of below-ground processes, as well as the inherent difficulties in measuring fine root turnover compared to above-ground components of trees [4,7,8], parameterizing C input models is difficult for different land use ecosystems. Although several methods have been developed for measuring fine root production, mortality and eventually decomposition in situ [9], all have drawbacks and are often confounded by artifacts [10,11,12]. For example, the sequential coring method has been widely used [13,14], but may miss root turnover between sampling dates. This results in a zero estimate [15] because root mortality and production occur simultaneously [16]. The sequential coring method also relies on a calculated rather than a measured estimate of fine root production. Direct measurements of fine root production can be obtained using in-growth cores [10], in-growth nets [17] or minirhizotron [18]. One problem with the in-growth core method is that it greatly modifies the soil physical properties and can thus affect root growth [19] and either overestimate [20] or underestimate root production [12]. In-growth nets are often difficult to insert or remove in heavy, stony soils. See Rewald and Ephrath [18] for a review on the pros and cons of minirhizotron techniques; beside the high costs, the potential disturbance/theft of minirhizotron tubes in populated areas is a major drawback. Thus, to obtain more robust estimations of fine root production and turnover rates, a combination of sampling techniques and calculation methods should be employed [21].
Estimates of fine root production in pan-tropical forests range from 75–2193 g m−2·year−1 [12]. Importantly, estimated values of fine root biomass, production and turnover are also influenced by environmental and seasonal factors [22], which may be strong factors in highly seasonal environments such as the Ethiopian highlands. For example, fine root growth has been shown to rapidly increase following soil rewetting [23]. Moreover, soil characteristics may also influence fine root biomass and the rates of fine root turnover [24,25]. Fine root biomass was reported to be higher under low nutrient availability [4,26] or in acidified soils [25]. Other studies, however, reported no effect of these factors on fine root biomass [27] or even lower values of fine root biomass [22].
Forest conversion to other land use systems is a common phenomenon in the highlands of Ethiopia, mainly because of population growth and the need for new agricultural lands [28]. The conversion of natural forests often leads to land degradation [29] and to losses of soil C and N stocks [30]. Much of the original forest that still remains is confined to areas around churches and monasteries [31,32]. Natural forests including church forests and woodlands cover less than 9.5% of the Amhara region [33,34]. Investigation of these church forests provides an opportunity to determine the baseline for this landscape in terms of C storage and the C dynamics that contribute to this storage. Most previous investigations of church forests have focused on above-ground aspects, such as species richness [31], and little is known about the below-ground ecology here. To reverse the negative impacts of deforestation and to provide a wood supply, degraded lands have often been planted with eucalyptus. Eucalyptus globules (Labill.) plantations have been established in the central highlands of Ethiopia since 1895 [35] and are estimated to cover 172 km2 of the region [34]. Planting of eucalyptus increases soil C stocks after ca. 30 years [30], but not to the levels found in natural forests. Although the proportion of the tree biomass constituted by fine roots (diameter < 2 mm) is estimated at <5% [36], fine roots are major contributors to carbon input into the soil because of their rapid turnover [9,10,21,27]. Across terrestrial ecosystems, fine root biomass is estimated to account for 14–33% of annual net primary production [37,38,39] and can contribute up to two-fold higher organic carbon to the soil than leaf litter [40]. Due to the importance of fine root turnover in soil C storage [41,42], we investigated the fine root biomass and turnover on a remnant church forest, eucalyptus plantation, grazing land and cropland in the Ethiopian highland landscapes of the Amhara region. The objective of this study was to assess the fine root stock, production and turnover and to examine the impact of land use change on fine root dynamics. In the tropics, where temperature permits year-round growth, the timing of leaf production is probably a result of the availability of moisture during the rainy season [43]. Root production might also follow leaf phenology because fine root growth depends heavily on newly-fixed carbon from the canopy [44,45]. We therefore expected that fine root biomass and necromass would be greater during the rainy season, when trees were physiologically active to capture nutrients, than during the dry season.
2. Materials and Methods
2.1. Site Descriptions
The study was conducted at a natural remnant forest at Gelawdios and on adjacent land use systems (eucalyptus plantation, grazing land and cropland) situated in the Amhara National Regional State (11°38′25″ N 37°48′55″ E) in northwest Ethiopia. The altitude of the study area is 2500 m a.s.l. The monsoonal climate features a mean annual temperature of 19 °C and a mean annual precipitation of about 1200 mm, with the main rainy season between June and September [31]. The climate is classified as temperate with a dry winter and warm summer (Cwb) according to the Köppen–Geiger climate classification [46]. The soils of the study area are Cambisols [47] with weak horizon differentiation and rocks below a 50-cm depth.
The forest at Gelawdios has an area of about 100 ha [31] and is a remnant of natural pristine forest composed mostly of a mixture of indigenous tree species. The forest type is a dry Afromontane forest. This forest with old remnant trees has been protected because it is a church forest. The church was built around 1500 A.D. [31]. The dominant tree species are Chionanthus mildbraedii, Albizia schimperiana, Apodytes dimidiata, Calpurnia aurea, Croton macrostachyus, Ekebergia capensis, Maytenus arbutifolia and Schefflera abyssinica. The Eucalyptus globules plantation was established on previous grazing land around 1985 and was successively thinned. The cropland and grazing land were converted from natural forest within the last 50 years. The number of years that the land was continuously cultivated after conversion from forest was obtained from local records and knowledge. The cropland is ploughed 2–3-times per year to about a 30-cm depth using an ox-drawn plough. During the sampling year (2014), the farmland was planted with Eragrostis tef and partly with Triticum aestivum in June and July and was harvested in September and October, respectively. Grazing lands are common lands used to graze herds of cattle, sheep, goats and donkeys.
2.2. Root Sampling
In the natural forest and eucalyptus plantation, ten permanent circular plots with an area of 100 m2 each were established along a transect line with a minimum distance of 100 m between the plots. In the grazing land and cropland, plots were established along a transect line with about a 20-m distance between each plot. Three methods were used for root stock and production estimations: sequential coring, in-growth cores and in-growth net methods.
2.2.1. Sequential Coring
Standing fine roots (<2 mm diameter) were determined using sequential soil coring. The fine roots were later divided into live fine roots (biomass) and dead fine roots (necromass). Intact soil cores were extracted with a stainless steel corer (6.6 cm diameter) to a depth of 40 cm or until the bedrock was reached. In the eucalyptus plantation, grazing land and cropland, one core was taken per plot at each sampling date from each of the ten permanent plots. Due to the greater heterogeneity in the natural forest, two cores about 2 m apart were taken per plot. Soil samples were divided into 0–10-, 10–20-, 20–30- and 30–40-cm soil depths. For the two cores from the natural forest, the fine roots from each corresponding depth increment were combined to give a single sample. Soil cores were taken in March, June and September 2014 and in February 2015. The timing of sampling took into account seasonal variations in rainfall and temperature and the planting time of the crop field. The March and February sampling times are during the dry season; the June and September samplings times are during the rainy season.
2.2.2. In-Growth Core and Net Methods
Root production was estimated from the above sequential coring, as well as using in-growth cores [48] and in-growth nets [25]. In the natural forest and eucalyptus plantation, five in-growth cores per plot were established (50 cores per land use type in total) in late June 2014. One in-growth core was positioned at the center of the plot and the four others 2 m from the center in the N, E, W and S directions. Soil cores were extracted using a soil corer (6.6 cm internal diameter × 40 cm length) as described above, and the holes were lined with a 2-mm mesh size polyethylene net (Franz Eckert GmbH, D-79183 Waldkirch, Germany) and filled with the root-free soil taken from the cores. An effort was made to restore the original soil horizons and compact the soil back to approximately the original soil bulk density. In the grazing land and cropland plots, three soil cores per plot (30 in total for each land use type) were established as described above. One in-growth core was positioned at the center of the plot and two others 2 m away from the center. One in-growth core per plot was removed from natural forest and eucalyptus plantation in late July, August, September 2014 and February and June 2015, corresponding to 1, 2, 3, 8 and 12 months in-growth. In cropland and grazing land, one core per plot was retrieved in July, August and September 2014, corresponding to 1, 2 and 3 months. Each time an in-growth core was removed, a new in-growth core per plot (ten in total per land use) was established next to the previous position (distance approximately 20 cm) to estimate root production and mortality between each sampling date. In total, the sampling dates correspond to 1-, 2-, 3-, 4-, 5-, 8- and 12-month time intervals from the beginning of measurement. After removal, the in-growth cores were carefully divided into 0–10-, 10–20-, 20–30- and 30–40-cm depths. Soil from the cores was spread on a plastic sheet, and fine roots were handpicked from soil.
Similarly, in the natural forest and eucalyptus plantation, per plot, five in-growth nets of 10 cm in width and 20 cm in length with a mesh size of 1 mm (Franz Eckert GmbH, D-79183 Waldkirch, Germany) were inserted into the soil about 30 cm away from the in-growth cores; three nets per plot were inserted into the cropland and grazing land. As in an earlier trial, it proved difficult to insert and remove the nets in the stony soil. To insert the nets, a 10 cm-wide and 5 cm-thick soil column was excavated to a depth of 20 cm. The 10 cm-wide and 20 cm-long nylon nets were inserted in the holes on one face, and the holes were refilled with the root-free soil and compacted to approximately the original bulk density. In the natural forest and eucalyptus plantation, one net per plot was removed by cutting a soil column (10 cm wide, 20 cm deep) using a long knife in late July, August, September 2014, February 2015 and June 2015, corresponding to 1, 2, 3, 8 and 12 months in-growth. Similarly, in the cropland and grazing land, one net per plot was removed in July, August and September 2014, corresponding to 1, 2 and 3 months in-growth. For additional measurements between sampling dates, again, a new net was inserted each time, and an in-growth net was removed, yielding 1-, 2-, 3-, 4-, 5-, 8- and 12-month time intervals. After removal, the nets were divided into 0–10- and 10–20-cm soil depths, and then, roots penetrating into the nets were carefully removed by hand.
For both in-growth cores and in-growth nets, the root samples were placed in separate plastic bags and transported to Vienna (Austria) for further analysis. Samples were stored at 4 °C until processed. In Vienna, fine roots were placed on a 1-mm sieve, and soil was washed away under running tap water; then the roots were handpicked with forceps from the sieve. Fine roots were classified as tree roots and grass roots, as well as live and dead based on color, breakability, wrinkled bark (texture consistency) and other visual factors [9,25]. Roots were further split into two diameter classes using a digital caliper: very fine roots (<1 mm) and fine roots (1–2 mm). All root samples were oven dried to constant weight at 70 °C, weighed to the nearest 0.01 g and converted to g·m−2.
2.3. Soil Sampling
Soil sampling took place during March 2014 at the time of the first root sampling using a stainless steel corer (6.6 cm diameter) as described above. Soil cores were laid onto a Styrofoam tray and morphologically described using the terminology of the World Reference Base for soil resources [47]. After dividing the soil corers into 0–10-, 10–20-, 20–30- and 30–40-cm depths, fine roots were collected for root biomass analysis as stated above, and each root-free soil sample per depth was sieved in 2 mm mesh sieve and then homogenized. From the natural forest, two composite soil samples per plot per depth and from other land use systems one sample per plot per depth were taken at ten sampling points each and placed in plastic bags in Ethiopia. The samples were then transported to Vienna for laboratory analysis.
2.4. Estimation of Annual Fine Root Production, Mortality and Decomposition
Using the values of standing fine root biomass and necromass from sequential coring, two methods were used to estimate fine root production, the ‘maximum-minimum’ (Max-Min) and decision matrix calculation techniques according to Brunner et al. [15] and Yang et al. [22]. For in-growth cores and in-growth nets, fine root production (P) was estimated using a simple ‘balancing model’ proposed by Li et al. [49], Osawa and Aizawa [50] and Santantonio and Grace [8] with some modifications.
Using the Max-Min method on the sequential coring data, the annual fine root production (g·m−2·year−1) was calculated by subtracting the lowest biomass or necromass (Bmin, Nmin) from the highest biomass or necromass value (Bmax or Nmax). This method assumes a single annual pulse of fine root production [15,51].
P (g·m−2·year−1) = Bmax − Bmin
The decision matrix (DM) calculates the annual fine-root production by summing all calculated productions between each pair of consecutive sequential coring events throughout a full year. The production (Pj) between two sampling dates is calculated by adding the differences in biomass (∆B), necromass (∆N) and decomposition (D) [15,22,51].
where the superscript j refers to a definite interval t–t + 1.
The change in standing crop of live fine roots (∆Bj) at a given time (t) equals production (Pj) minus mortality (M):
where Bt and Bt + 1 represent fine root biomass at the start of the growing season and at time t + 1, respectively. All terms have the unit g·m−2.
dB/dt = dP/dt − dM/dt = ∆Bj = Bt + 1 − Bt
The change in standing crop of dead fine roots (∆Nj) equals mortality minus decomposition (D).
where Nt and Nt + 1 represent fine root necromass at the start of the growing season and at time t + 1, respectively.
dN/dt = dM/dt − dD/dt = ∆Nj = Nt + 1 − Nt
The condition under which the decision matrix was used as the basis for the calculations of P between sampling dates is shown in Table 1. In this study, all differences in biomass and necromass between two consecutive sampling dates were taken into account, assuming that the biomass and necromass pool are continuously changing [15]. Mortality is the decrease in fine root biomass between two consecutive sampling dates. When estimating annual root production, mortality was included with either necromass or partly with decomposition depending on the mass change of necromass due to this mortality. Decomposition was therefore calculated from a decrease in necromass or a decrease in fine root biomass that was not compensated by an increase in necromass (see Table 1 for details). To calculate the annual root production, production values obtained from all changes in both biomass and necromass between consecutive sampling dates are summed from the start of sampling until the same time point in the following year, regardless of whether the differences were statistically significant or not [12,14,51].
In the in-growth cores and net methods, the last sampling date at the end of the year is usually considered as direct root production [9,10]. However, in a one-year in-growth core and in in-growth net methods, biomass increases until it colonizes the whole space and reaches an equilibrium. Nevertheless, fine root growth, death and decomposition also occur simultaneously between the sampling dates. Therefore, root production and decomposition between sampling dates are missed. Moreover, production, mortality and decomposition may vary in the growing season due to seasonal moisture and temperature variations. To overcome this problem, the additional in-growth cores and in-growth nets were used to estimate root production and turnover between harvests. The underlying assumption here is that root production favored by soil disturbance during installation of in-growth cores and in-growth nets is compensated by the lag time of the growth of severed roots. Therefore, we used a mass balance model from time of insertion to any given time (t) in the growing season to estimate fine root production (P), mortality (M) and decomposition (D). The ‘mass balance model’ is the same as those of Santantonio and Grace [8], Osawa and Aizawa [50] and Li et al. [49], except we considered additional growth between harvests. The production of biomass (bj) between consecutive sampling dates was calculated as:
bj = bt − b0 = bt, since b0 = 0
Similarly, production of necromass (nj) between each harvest was calculated as:
nj = nt − n0 = nt, since n0 = 0
Since there are no fine roots in the in-growth cores and in-growth nets at the start of the installation, both b0 and n0 are zero. We compared the biomass (∆Bj) production in the in-growth cores and nets with a long incubation time to the production in the cores with a shorter incubation time (bt.). If the production from the long incubation time cores or nets was lower than the summed production from the short incubation times, then the lower values were assumed to be due to mortality. The difference between the two values was then added to root mortality. Then, the actual mortality for in-growth cores and in-growth nets was calculated as:
Mj = bj − ∆Bj where Bj = Bt+1 – Bt
This mortality was then included with either necromass or with decomposition depending on the mass change of necromass. If mortality is higher than the necromass change, then the difference is considered as decomposition. Decomposition from mortality (Dm) is then calculated as:
Dm = Mj − ∆Nj where Nj = Nt+1 − Nt
Similar to the estimation of root mortality using short and long incubation times of in-growth cores and nets, if necromass (∆Nj) accumulation in the in-growth cores and nets from the long incubation time cores or nets was lower than the summed necromass from the short incubation times, then the lower values were assumed to be due to decomposition. Decomposition was therefore calculated from a decrease of necromass or a decrease in fine root biomass that was not compensated for by an increase in necromass, with the following equation:
where the small case letters bj and nj denote root biomass and necromass production between consecutive sampling dates.
Dj = Dm + nj + Nt − Nt+1 = bj + Bt − Bt+1 + nj + Nt − Nt+1
To calculate the annual root production, all production values obtained from all changes in both biomass, necromass and decomposition between consecutive sampling dates were summed from the start of sampling until the same time point in the following year (same as Equation (2)).
2.5. Calculation of Fine Root Turnover
Root turnover rate (year−1) was calculated as the ratio between annual root production and average root biomass [51,53] or the highest (maximum) biomass value [6]. Mean residence time of roots is the reciprocal of turnover rate.
Annual carbon inputs from fine roots into soil were calculated using fine root production along with the C and N concentrations in the roots, assuming that there was no translocation during root senescence. Hence, the annual fluxes of C and N into soil (expressed in g m−2·year−1) were estimated according to Xia et al. [40] as:
where Ia is annual input of C or N into the soil (g·m−2·year−1); P is annual fine root production (g·m−2); C/N is the concentration of C or N in the fine roots (%).
Ia = P × C/N%
2.6. Fine Root Vertical Distribution
Vertical root distribution or cumulative root fraction (Y) from the surface to any depth (d) was calculated according to a model developed by Gale and Grigal [54]. An asymptotic nonlinear model of the following form was fitted to describe the vertical root distributions:
where Y is the cumulative root fraction from the surface to soil depth d in centimeters (midpoint) and β the estimated parameter used as a measure of the index of vertical root distribution. The parameter β can have values from 0–1, whereby higher values indicate a greater proportion of roots at deeper soil [37,55,56].
Y = 1 − βd
2.7. Carbon and Nitrogen Analysis
A very limited dry mass of fine roots and herbaceous roots was available. Accordingly, to determine the total C and N concentrations in root materials, the original ten samples were pooled by category to form nine samples each from the forest and eucalyptus and three samples each from grazing land and cropland. The nine samples from the forest ecosystem were further processed to form three categories: roots < 1 mm in diameter, roots from 1–2 mm in diameter and herbaceous roots. Each had three replicates. The roots were dried at 70 °C and ground to a fine powder (Fritsch Pulverisette 5, Idar-Oberstein, Germany). Sub-samples of about 160 mg were taken from each sample for C and N determinations using a CN elemental analyzer (Truspec CNS LECO, St. Joseph, MO, USA). In addition, the soil samples from each sampling point and depth were taken during root sampling and were dried at 105 °C until constant weight. Ten samples per land use system were analyzed for total C and N concentration using 200 mg samples on the same CN elemental analyzer as described above. Soil bulk density was taken from a previous study [30].
2.8. Statistical Analyses
Means and standard errors were calculated using the SPSS analytical software package (Version 21, IBM Corp., Armonk, NY, USA), and graphs were prepared using SigmaPlot (version 13, Systat software, Inc., San Jose, CA, USA). The significance level was set at α = 0.05. Throughout the paper, error bars to the mean are ± SE. The relationships between different variables were analyzed using one-way analysis of variance and the Scheffe comparison method, as well as simple regression analysis. Assumptions of normality and homogeneous variance were examined by Shapiro-Wilk’s and Levene’s test, respectively. When the assumptions of normality were not met, the data were log10 transformed to normalize the distribution.
3. Results
3.1. Fine Root Biomass, Necromass and Distribution with Depth
Fine root biomass and necromass to a 40-cm soil depth for all land use systems are shown in Table 2. Total weight of fine roots (biomass and necromass) in the soil layer of 0–40 cm was higher in natural forest (564 g·m−2) than in the eucalyptus stand (425 g·m−2). From the total root mass, living roots represented 83% in the natural forest and 79% in eucalyptus plantation, whereas the necromass (dead roots) accounted for 17% in the natural forest and 21% in the eucalyptus plantation (Table 2). The necromass, however, was not significantly different between the forest (98 ± 13 g·m−2) and eucalyptus stand (88 ± 10 g·m−2). Samples were not taken from grazing land and cropland during the dry season because the land was entirely bare. Root biomasses during the rainy season in these two fields were 56 and 46 g·m−2, respectively, and were very low compared to the tree ecosystems. Of this amount, living roots represent 96% in the grazing land and 98% in the cropland. Herbaceous roots contributed about 30% to the total root mass in the eucalyptus stand, whereas in the native forest, the understory herbaceous root contribution to fine root mass was negligible (1.4%). In the eucalyptus stand, the roots of the understory vegetation were mainly from grasses. The fine roots from grazing land and cropland were herbaceous. The biomass of smaller diameter roots (<1 mm) accounted for about 50% of the total root mass both in the natural forest and eucalyptus plantation; all roots in the grazing land and cropland were <1 mm in diameter (exception: 2.8% in the cropland were between 1 and 2 mm in diameter) (Table 2).
All land use systems had relatively shallow fine root systems with >40% of the total mass (live plus dead) situated in the upper 10 cm, decreasing to 9–11% at 30–40 cm for vegetated ecosystems. In the cropland, all roots were found in the upper 30-cm depth. For the pooled data of the forest ecosystem, the changes of the cumulative root fraction by soil depth were analyzed using the model of Gale and Grigal [54]. Fine root mass declined exponentially with depth for all land use systems, with β index values ranging from 0.789–0.923 (Figure 1). Herbaceous roots were the shallowest roots and were mostly concentrated in the upper 20-cm depth. When comparing diameter classes, fine roots (1–2 mm in diameter) were deeper than very fine roots (<1 mm in diameter; Figure 1), as the β-values were significantly different (p < 0.001). In addition, the vertical distribution of necromass was deeper (0.913) than the biomass (0.901; p < 0.05).
3.2. Seasonal Variation of Root Stocks
Fine root biomass and necromass were significantly affected by season (Figure 2). In both the native forest (Figure 2a) and eucalyptus stand (Figure 2b), fine root biomass and necromass had the highest values during the dry season (March and February). The biomass was 20% and 28% higher in the dry season than the wet season for the native forest and the eucalyptus, respectively. Similarly, the necromass was also 22% and 27% higher during the dry season than the wet season for the native forest and eucalyptus stand, respectively. The percentage of necromass to total mass was 17% in natural forest and 21% in the eucalyptus stand for both the wet and dry seasons.
3.3. Fine Root Production, Mortality and Turnover
The methods used for calculating annual fine root production from the sequential coring data were the decision matrix and minimum-maximum method (Table 3); the mass balance method was used for in-growth cores and in-growth net measurements (Table 4). Root production for all methodological approaches (sequential coring, in-growth cores and in-growth nets methods) clearly differed between land use types (Table 3 and Table 4; Figure 3). For example, based on in-growth core methods, the annual root mass produced in the forest ecosystem down to 40 cm was 468 g m−2·year−1, which is about 37%, 87% and 90% higher than in the eucalyptus stand, grazing land and cropland ecosystems, respectively (Figure 3). The highest annual root production was obtained by sequential coring in the forest ecosystem (723 ± 93 g m−2·year−1), of which more than 58% (416 ± 66 g·m−2) was from mass loss due to decomposition (Table 3). Similarly, the annual root mass production in the eucalyptus stand at the same depth was 694 ± 95 g m−2·year−1; necromass accounted for 14% of the total mass; and the mass loss due to decomposition was about 41% (282 ± 71 g·m−2; Table 3). Fine root production estimated based on the decision matrix was higher than the total standing mass by 22% and 39% in the natural forest and eucalyptus, respectively. However, the annual root production estimated by the in-growth core and in-growth net methods was ca. 43 and 62% lower than the standing root stock. The annual fine root production down to 40 cm was 60 g m−2·year−1 in grazing land and 52 g m−2·year−1 in cropland based on the in-growth core method with the mass balance calculation technique (Figure 3). This value was significantly lower than in the forest and eucalyptus. Note that root growth in grazing land and cropland was limited to the rainy season. When comparing the sampling methods, fine root production in the forest ecosystem to the 0–20-cm soil depth was highest (531 ± 76 g·m−2·year−1) with sequential coring, followed by the in-growth core method (329 ± 51 g·m−2·year−1) and the in-growth net method (218 ± 18 g·m−2·year−1) (Figure 4). Except for the forest ecosystem, the fine root production values obtained with the in-growth core and in-growth net methods did not differ significantly in any land use system (Table 4). Root production estimates using the in-growth cores and in-growth nets showed a consistent increase over the course of the year. In the forest ecosystem, fine root production increased from 63–360 g·m−2 from the first month to the 12th month after installation of in-growth cores. In the last four months, the average increment per month was 30 g·m−2. Similarly, fine root production as estimated with the in-growth net method increased from 42–191 g·m−2 with an average increment of 17 g·m−2 in each of the last four months. Calculation methods also affected the estimation of fine root production: the decision matrix always showed a higher estimation than the Max-Min method (Table 3).
The root turnover rate was estimated from the ratio of the fine root production to biomass, using either mean or maximum values as a denominator. Turnover rates differed between land use types, with rates between 0.67 year−1 (in natural forest) and 2.1 year−1 (in eucalyptus) (Table 3). Turnover rates also differed according to the calculation method. For example, the rate obtained by the decision matrix method was higher than that obtained using the maximum-minimum method (Table 3). We also compared the differences in turnover rate estimates based on mean and maximum biomass values as a denominator. From the decision matrix dataset, using mean biomass instead of maximum biomass resulted in up to 1.5-times higher rate estimates. The mean residence time of fine roots (calculated as the ratio of mean root biomass to annual root production, i.e., the reciprocal of turnover rate) was 0.7 for natural forest and 0.5 for eucalyptus. This means that the average life expectancy of the fine roots was approximately 175 days for eucalyptus and 232 days for natural forest.
3.4. Annual C and N Flux into the Soil
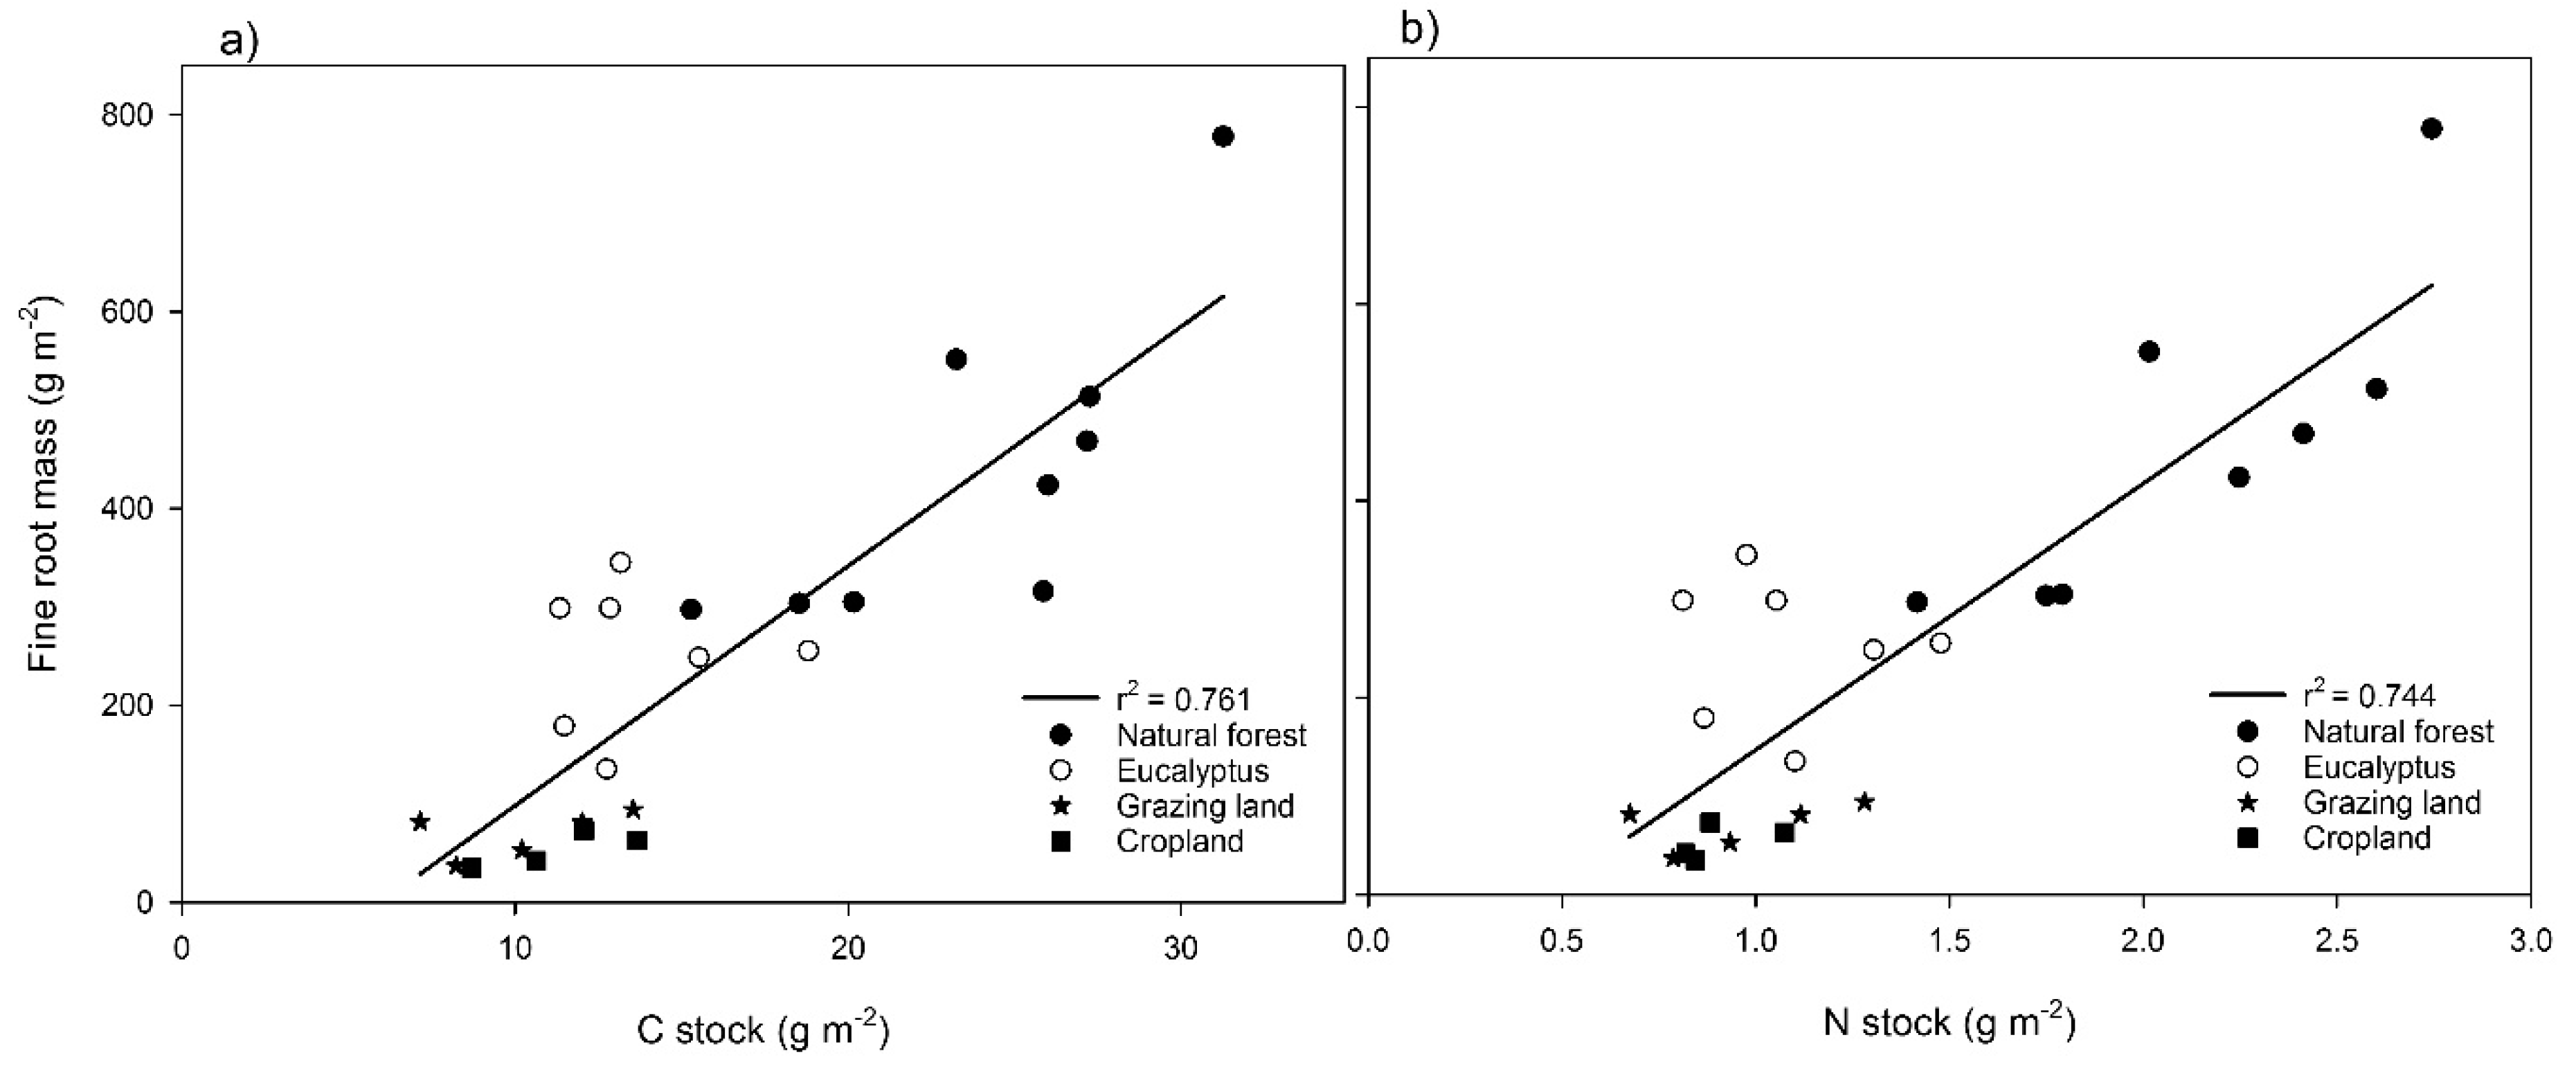
Total C and N fluxes into the soil were calculated from the annual root production and concentration of C or N in the fine roots (Table 5). The annual C and N inputs into the soil through fine roots in the top 40 cm as estimated from the in-growth core with the mass balance method were highest in the natural forest (226 g·C·m−2·year−1 and 7.5 g N·m−2·year−1). The annual C flux in other land use types was highest in eucalyptus followed by grazing land and cropland. The annual N flux followed the same trend as the C flux (Table 5). The amount of fine root mass (biomass plus necromass) estimated by in-growth cores was plotted against soil C and N stock as shown in Figure 5. Fine root mass showed the same pattern as total C and N stock (r2 = 0.76, Figure 5a, and 0.74, Figure 5b, respectively).
4. Discussion
4.1. Effect of Land Use Change on Fine Root Stocks and Production
Fine roots are major factors determining carbon flux into the soil due to their fast turnover; a robust estimate of this dynamic process and its response to land use change is rare especially for tropical ecosystems. The incorrect quantification of fine root dynamics may thus cause uncertainty on estimations of belowground carbon inputs for these ecosystems and global estimations. Thus, an increased understanding of fine root dynamics for different land use systems of tropical areas is urgently needed. Our study used three different techniques to assess fine root dynamics for four land use systems in northwestern Ethiopia. Our results showed that fine root biomass and necromass production and turnover rates varied largely between land use types and sampling methods. The results of this study thus provide an estimate of fine root stock, production and turnover for tropical forests and adjacent non-forest land use types and how this process affects the carbon deposition in the soil.
Changes in vegetation composition because of land use conversion from native forests to grazing land or cropland alter the overall quantity and quality of fine root stock and production. Hence, such conversions reduced the fine root stock by 89% in grazing land and 91% in cropland (Table 2). The amount of fine root mass in our forest site (564 g·m−2) is comparable to that of tropical evergreen or deciduous forests (570 g·m−2) and boreal forests (600 g·m−2), but lower than that of temperate deciduous forests (780 g·m−2) [37]. Similar to standing biomass, conversion of forest to grazing land or cropland reduced fine root production by 85% and 89%, respectively (Figure 3). In contrast, the reverse process of these degraded lands through afforestation with exotic species (eucalyptus) increased the fine root production by 76% using native forest as a baseline. No similar studies are available for comparison of fine root production across land use systems. The average production of fine roots in our study (723 g·m−2·year−1; Table 3) is comparable to estimates from the mid-subtropics of China (795 g·m−2·year−1) [22], but lower than estimates from temperate forest in Germany (689–1360 g·m−2·year−1) [12]. This comparison is based on a similar methodological approach and soil depth. Differences in fine root mass estimates among studies may reflect different sorting processes [27] or be linked to above-ground stand characteristics [57,58] or to soil characteristics [24,25]. For example, in relation to the sorting process, Ruess et al. [27] reported that a thorough estimate of fine root biomass yielded a five-times greater estimate than a previous estimate (1780 g·m−2 vs. 221 g·m−2) from the same site and using the same methodology.
Consistent with studies in moist tropical forests, fine root biomass and necromass decreased exponentially with increasing depth [55,56]. Our study found more than 70% of the fine roots in the upper 20-cm depth, which is deeper than other estimates in the tropics of 67–78% in the uppermost layer of 0–10 cm [56]. The vertical distribution of herbaceous roots, mainly from grazing and cropland, showed that ca. 99% of the total root mass is located in the upper 30 cm. This underlines the superficial root systems of grasses and crops. Schenk and Jackson [59] also suggested that, on average, at least half of root biomass is located in the upper 30 cm of soil for all systems globally. This reflects the fact that topsoil provides a favorable microclimate for root development [22]. When comparing across major biomes of the world according to Canadell et al. [60], the vertical distribution of roots in our study is more shallow (β = 0.790 to 0.927; Figure 1) than the average estimate for tropical evergreen or savannah forests (β = 0.972) and temperate conifer forests (β = 0.976). Note that higher values of β indicate a greater proportion of roots in deeper soil [37,56]. Our study, however, did not extend as deep as the maximum possible rooting depth, and the estimated β value can be highly affected by sampling depth. Canadell et al. [60] calculated the cumulative root fractions to a depth of 1–2 m, but our sampling depth was a maximum of 40 cm. This does not mean that roots are limited to this depth. More necromass at lower depth (β = 0.913) than live roots (β = 0.907) indicates that necromass in the lower soil profile persists much longer than surface necromass.
4.2. Seasonal Variation of Fine Root Mass
We expected that fine root biomass and necromass would be greater during summer (rainy season) when trees were physiologically active to capture nutrients. However, we found peak values during the dry season and higher decomposition during the rainy season in forest and eucalyptus ecosystems (Figure 1). Hence, our results do not support this hypothesis. This contrasts with many other observations reported from northern savannah, Australia [61], California, USA [62], and boreal forest [4], where the maximum values were found in the wet season. Our result may agree with temperate forest studies, where peaks in standing root mass were measured during winter time when trees are physiologically inactive [53,63] and when roots grew throughout the winter in the absence of leaves [64]. Steinaker and Wilson [44] conclude that forest leaf phenology is not a reliable index of overall vegetation phenology: they found a significant negative correlation between leaf and root production in a Populus tremuloides forest in North America. This is because fine root growth depends heavily on newly-fixed carbon from the canopy [45], and the availability of carbon for root growth peaks after the main period of aboveground growth [65]. In other tropical forests, maximum fine root biomass was also observed during the dry versus wet season in central Sulawesi, Indonesia [66], and in the eastern Amazon, Brazil [67]. Soil water status may also be a factor for changes in root growth strategy [67,68]. For example, fine roots biomass increased at low soil moisture availability in tropical [69] and temperate forests [70]. Joslin et al. [45] also measured maximum root length in midsummer when potential evapotranspiration was high and soil water was low. Contador et al. [62] reported that water deficit appeared to promote root production in deeper soil layers for mining soil water. Some species also respond to drought by increasing root:shoot ratios [71], and maximum root length occurred in midsummer when potential evapotranspiration was high and soil water was low. When water is limiting, plants should shift allocation of C towards roots, where photosynthates can be used to increase water uptake, resulting in greater root growth [72]. The other possible reason for low root mass during the wet season is that, in strongly seasonal climates, there is a strong flush of fine roots in the spring, but these roots live less than one month [73].
4.3. Limitations of Sampling Methods
Our data show that fine root production estimates using sequential coring yield higher estimates than in-growth core and net methods. For example, root production in the eucalyptus plantation as estimated by sequential coring was two-fold higher than estimates from in-growth core and net methods. This agrees with a comparative study between in-growth cores and ‘mesh’ (net) methods conducted in France [11] and Germany [25]. The latter authors, for example, reported from three years of data that fine root production is 69–89% lower for Picea abies and 67–85% lower for understory species in the ‘meshes’ compared to the in-growth cores. Another comparative study between sequential coring, in-growth cores and growth chambers in northwest Germany found that annual root production is higher in the sequential coring approach [12].
Nevertheless, all methods have limitations for root production estimation [27]. The underlying assumption is that each observed change of root mass during a sampling interval in sequential coring is due to either production or mortality. Therefore, estimations of root production, mortality and decomposition with sequential coring at steady states may result in a zero estimate [15]. From in-growth cores and in-growth nets, many of the ingrowing roots are from damaged roots, and a lag may occur before root production begins in the first month [21]. In contrast, soil disturbance during installation may favor root production. Moreover, using root-free soils in the in-growth core method may accelerate root production in a competition-free environment. Since root mortality and production occur simultaneously [16], we may miss root turnover between sampling dates. In our study, the time interval was 4–16 weeks. Accordingly, root growth and death between sampling dates could not be accurately estimated. For example, in a carbon flow experiment in a temperate forest soil, Gilbert et al. [74] found a δ13C isotopic enrichment by fine roots only in the rhizosphere soil at one month after labelling. To overcome the shortcomings of sampling intervals in calculating actual root production and decay between sampling dates [26], we placed additional in-growth cores and nets at every retrieval time. Our estimate of fine root production therefore increased from 268 g·m−2·year−1–329 g m−2·year−1 compared to the longer interval sampling dates, but the same calculation method. Still, root growth and death could have occurred within these sampling dates, and production could not be accurately estimated [19].
In our study, fine root production estimates through the in-growth core and in-growth net method showed a consistent increase over the course of the year. The root production estimate based on in-growth cores is 22% lower than the average standing root stock, suggesting that only a one-year study involving the in-growth core and in-growth net method is insufficient to reach an equilibrium stage.
Regarding turnover rates (death and decay), our results vary between 0.65 and 2.1 year−1 depending on the methodological approach and forest type. This finding provides evidence that most of the fine root system dies and grows back at least once per year [10]. The inconsistency of data related to soil depth, diameter class and methodological approaches in the literature complicates comparing our turnover estimates across studies. Nonetheless, our results are in the range of turnover rates of European forests (0.17–3.10 year−1) as compiled by Brunner et al. [15]. Turnover rate estimates using mean biomass instead of maximum biomass as a denominator yielded higher estimates (Table 3). This result is in agreement with estimates in a European forest, with a mean difference of about 30% [15]. The proportion of dead roots that have been replaced by new growth is calculated as root production over biomass at steady state on an annual basis [51]. Hence, we always underestimate root production because we miss the root growth and death between the sampling dates. We therefore suggest that using mean biomass, as a denominator, is more representative of average live roots than using maximum biomass to estimate root turnover rate.
4.4. Implications of Fine Root Turnover in Ecosystem Carbon Cycling
Our fine root stock and production estimates tended to show the same pattern of soil C and N stocks in the soil (r2 = 0.76; p < 0.001 for C and r2 = 0.74; p < 0.001 for N; Figure 5). This suggests that fine roots are the major contributors of C and N input in the soil. Similarly, Hansson et al. [16] reported that the fine root stock distribution followed the same pattern as the soil C and N distribution in the stands. Nonetheless, our annual C flux estimate based on fine roots in the forest to the 40-cm depth (224 g of C m−2·year−1; Table 5) was much smaller than estimates from tropical forests in Indonesia (233 g of C m−2·year−1 from the top 20 cm only) [75]. The annual C flux from fine roots in the eucalyptus stand, grazing land and cropland was about 37%, 85% and 89% lower, respectively, compared to native forest. This suggests that conversion of native forest to grazing land and cropland resulted in a ca. 85–89% C input reduction in the soil. A study in northwestern Ecuador showed that conversion of forest to cropland or pasture leads to a 36–49% loss of the original forest C from the top 15 cm over 50 years [76]. Forest disturbance also reduced the annual input of C into the soil via root channels. For example, Hertel et al. [75] reported that the amount of carbon annually transferred to the soil carbon pool through fine root mortality was highest in undisturbed forests and generally decreased with increasing forest use intensity. Root biomass and turnover may be more important determinants for the accumulation of soil organic carbon than aboveground litter input for different land use systems [77]. Xia et al. [40] showed that fine roots contained 2–3-fold higher recalcitrant carbon fractions than leaf litter. Previous C stock analysis [30] showed that land use change resulted in an up to 88% carbon reduction at the site level. The result of this analysis suggests that forest protection against deforestation alone sequesters about 90% more carbon compared to grazing land or croplands.
5. Conclusions
Conversions of land use from native forest to other land use types such as grazing land or cropland strongly reduce root production (about 85–89%). Root production and turnover were also strongly affected by seasonal variations, with peak values in the dry season. This indicates the accumulation of root mass under moisture-limiting conditions. With regard to vertical distribution, there was always a decreasing trend of root mass with soil depth. This spatial pattern was similar to that of the C and N stock in the mineral soil, indicating a significant contribution of roots to soil C and N pools.
Acknowledgments
This work was carried out within the project “Carbon storage and soil biodiversity in forest landscapes in Ethiopia: Knowledge base and participatory management (Carbo-part)” and was funded by the Austrian Ministry of Agriculture, Forestry, Environment and Water Management under Grant Agreement No BMLFUW-UW.1.3.2/0122-V/4/2013. We thank Nebiyat Kebede for her assistance during root washing in the lab. Comments by two anonymous reviewers significantly improved a previous version of the manuscript.
Author Contributions
Dessie Assefa performed the research, analyzed the data and wrote the original draft. Hans Sandèn contributed fieldwork and data analysis. Boris Rewald and Douglas Godbold provided ideas, edited and revised the manuscript.
Conflicts of Interest
The authors declare no conflict of interest.
References
- Böhm, W. Methods of Studying Root Systems; Billings, W.D., Golley, F., Lange, O.L., Olson, J.S., Eds.; Springer: New York, NY, USA, 1979. [Google Scholar]
- Leuschner, C.; Hertel, D. Fine Root Biomass of Temperate Forests in Relation to Soil Acidity and Fertility, Climate, Age and Species. In Progress in Botany; Springer: Berlin, Germany, 2003; pp. 405–438. [Google Scholar]
- Pinno, B.D.; Wilson, S.D.; Steinaker, D.F.; Van Rees, K.C.J.; Mcdonald, S.A. Fine root dynamics of trembling aspen in boreal forest and aspen parkland in central Canada. Ann. For. Sci. 2010, 67, 1–6. [Google Scholar] [CrossRef]
- Yuan, Z.Y.; Chen, H.Y.H. Fine root biomass, production, turnover rates, and nutrient contents in boreal forest ecosystems in relation to species, climate, fertility, and stand age: Literature review and meta-analyses. Crit. Rev. Plant Sci. 2010, 29, 204–221. [Google Scholar] [CrossRef]
- McCormack, M.L.; Adams, T.S.; Smithwick, E.A.H.; Eissenstat, D.M. Predicting fine root lifespan from plant functional traits in temperate trees. New Phytol. 2012, 195, 823–831. [Google Scholar] [CrossRef]
- Gill, R.A.; Jackson, R.B. Global patterns of root turnover for terrestrial ecosystems. New Phytol. 2000, 147, 13–31. [Google Scholar] [CrossRef]
- Johnson, M.G.; Tingey, D.T.; Phillips, D.L.; Storm, M.J. Advancing fine root research with minirhizotrons. Environ. Exp. Bot. 2001, 45, 263–289. [Google Scholar] [CrossRef]
- Santantonio, D.; Grace, J.C. Estimating fine-root production and turnover from biomass and decomposition data: A compartment–flow model. Can. J. For. Res. 1987, 17, 900–908. [Google Scholar] [CrossRef]
- Vogt, K.A.; Vogt, D.J.; Bloomfield, J. Analysis of some direct and indirect methods for estimating root biomass and production of forests at an ecosystem level. Plant Soil 1998, 200, 71–89. [Google Scholar] [CrossRef]
- Lukac, M. Fine Root Turnover. In Measuring Roots; Springer: Berlin, Germany, 2012; pp. 363–373. [Google Scholar]
- Andreasson, F.; Gonzalez, M.; Augusto, L.; Bakker, M.R. Comparison of ingrowth cores and ingrowth meshes in root studies: 3 years of data on Pinus pinaster and its understory. Trees 2016, 30, 555–570. [Google Scholar] [CrossRef]
- Hertel, D.; Leuschner, C. A comparison of four different fine root production estimates with ecosystem carbon balance data in a Fagus-Quercus mixed forest. Plant Soil 2002, 239, 237–251. [Google Scholar] [CrossRef]
- Sun, T.; Dong, L.; Mao, Z.; Li, Y. Fine root dynamics of trees and understorey vegetation in a chronosequence of Betula platyphylla stands. For. Ecol. Manag. 2015, 346, 1–9. [Google Scholar] [CrossRef]
- Yuan, Z.Y.; Chen, H.Y.H. Simplifying the decision matrix for estimating fine root production by the sequential soil coring approach. Acta Oecol. 2013, 48, 54–61. [Google Scholar] [CrossRef]
- Brunner, I.; Bakker, M.R.; Björk, R.G.; Hirano, Y.; Lukac, M.; Aranda, X.; Børja, I.; Eldhuset, T.D.; Helmisaari, H.S.; Jourdan, C.; et al. Fine-root turnover rates of European forests revisited: An analysis of data from sequential coring and ingrowth cores. Plant Soil 2012, 362, 357–372. [Google Scholar] [CrossRef]
- Hansson, K.; Helmisaari, H.-S.; Sah, S.P.; Lange, H. Fine root production and turnover of tree and understorey vegetation in Scots pine, silver birch and Norway spruce stands in SW Sweden. For. Ecol. Manag. 2013, 309, 58–65. [Google Scholar] [CrossRef]
- Lukac, M.; Godbold, D.L. Fine root biomass and turnover in southern taiga estimated by root inclusion nets. Plant Soil 2010, 331, 505–513. [Google Scholar] [CrossRef]
- Rewald, B.; Ephrath, J. Minirhizotron Techniques. In Plant Roots; Eshel, A., Beeckman, T., Eds.; CRC Press: New York, NY, USA, 2013; pp. 1–15. [Google Scholar]
- Makkonen, K.; Helmisaari, H.-S. Assessing fine-root biomass and production in a Scots pine stand–comparison of soil core and root ingrowth core methods. Plant Soil 1999, 210, 43–50. [Google Scholar] [CrossRef]
- Neill, C. Comparison of Soil Coring and Ingrowth Methods for Measuring Belowground Production. Ecology 1992, 73, 1918–1921. [Google Scholar] [CrossRef]
- Majdi, H.; Pregitzer, K.; Moren, A.-S.; Nylund, J.-E.; Ågren, G.I. Measuring fine root turnover in forest ecosystems. Plant Soil 2005, 276, 1–8. [Google Scholar] [CrossRef]
- Yang, Y.-S.; Chen, G.-S.; Lin, P.; Xie, J.-S.; Guo, J.-F. Fine root distribution, seasonal pattern and production in four plantations compared with a natural forest in subtropical China. Ann. For. Sci. 2004, 61, 617–627. [Google Scholar] [CrossRef]
- Comas, L.H.; Becker, S.R.; Cruz, V.M.V.; Byrne, P.F.; Dierig, D.A. Root traits contributing to plant productivity under drought. Front. Plant Sci. 2013, 4, 442. [Google Scholar] [CrossRef] [PubMed]
- Helmisaari, H.-S.; Hallbäcken, L. Fine-root biomass and necromass in limed and fertilized Norway spruce (Picea abies (L.) Karst.) stands. For. Ecol. Manag. 1999, 119, 99–110. [Google Scholar] [CrossRef]
- Godbold, D.L.; Fritz, H.-W.; Jentschke, G.; Meesenburg, H.; Rademacher, P. Root turnover and root necromass accumulation of Norway spruce (Picea abies) are affected by soil acidity. Tree Physiol. 2003, 23, 915–921. [Google Scholar] [CrossRef] [PubMed]
- Priess, J.; Then, C.; Fölster, H. Litter and fine-root production in three types of tropical premontane rain forest in SE Venezuela. Plant Ecol. 1999, 143, 171–187. [Google Scholar] [CrossRef]
- Ruess, R.W.; Hendrick, R.L.; Vogel, J.C.; Sveinbjornsson, B. The Role of Fine Roots in the Functioning of Alaskan Boreal Forests. In Alaska’s Changing Boreal Forest; Chapin, F.S., van Cleve, K., Viereck, L.A., Verbyla, D.L., Oswood, M.W., Eds.; Oxford University Press: New York, NY, USA, 2006; Volume 354. [Google Scholar]
- Nyssen, J.; Poesen, J.; Moeyersons, J.; Deckers, J.; Haile, M.; Lang, A. Human impact on the environment in the Ethiopian and Eritrean highlands—A state of the art. Earth-Sci. Rev. 2004, 64, 273–320. [Google Scholar] [CrossRef]
- Meshesha, D.T.; Tsunekawa, A.; Tsubo, M.; Ali, S.A.; Haregeweyn, N. Land-use change and its socio-environmental impact in Eastern Ethiopia’s highland. Reg. Environ. Chang. 2014, 14, 757–768. [Google Scholar] [CrossRef]
- Assefa, D.; Rewald, B.; Sandén, H.; Rosinger, C.; Abiyu, A.; Yitaferu, B.; Godbold, D.L. Deforestation and land use strongly effect soil organic carbon and nitrogen stock in Northwest Ethiopia. CATENA 2017, 153, 89–99. [Google Scholar] [CrossRef]
- Wassie, A.; Sterck, F.J.; Teketay, D.; Bongers, F. Tree regeneration in church forests of Ethiopia: Effects of microsites and management. Biotropica 2009, 41, 110–119. [Google Scholar] [CrossRef]
- Aerts, R.; Van Overtveld, K.; November, E.; Wassie, A.; Abiyu, A.; Demissew, S.; Daye, D.D.; Giday, K.; Haile, M.; TewoldeBerhan, S. Conservation of the Ethiopian church forests: Threats, opportunities and implications for their management. Sci. Total Environ. 2016, 551, 404–414. [Google Scholar] [CrossRef] [PubMed]
- Desta, L.; Kassie, M.; Beninc, S.; Penderd, J. Land Degradation in the Highlands of Amhara Region and Strategies for Sustainable Land Management. In Policies for Sustainable Land Management in the Highlands of Ethiopia; Jabbar, M.A., Pender, J., Ehui, S.K., Eds.; International Livestock Research Institute: Addis Ababa, Eethiopia, 2000; Volume 30. [Google Scholar]
- Bekele, M. Forest Plantations and Woodlots in Ethiopia, 1st ed.; Regional Soil Conservation Unit, Swedish International Development Authority: Nairobi, Kenya, 2011; Volume 1. [Google Scholar]
- Pohjonen, V.; Pukkala, T. Eucalyptus globulus in Ethiopian forestry. For. Ecol. Manag. 1990, 36, 19–31. [Google Scholar] [CrossRef]
- Vogt, K.A.; Vogt, D.J.; Palmiotto, P.A.; Boon, P.; O’Hara, J.; Asbjornsen, H. Review of root dynamics in forest ecosystems grouped by climate, climatic forest type and species. Plant Soil 1996, 187, 159–219. [Google Scholar] [CrossRef]
- Jackson, R.; Mooney, H.A.; Schulze, E.-D. A global budget for fine root biomass, surface area, and nutrient contents. Proc. Natl. Acad. Sci. USA 1997, 94, 7362–7366. [Google Scholar] [CrossRef] [PubMed]
- McCormack, M.L.; Dickie, I.A.; Eissenstat, D.M.; Fahey, T.J.; Fernandez, C.W.; Guo, D.; Helmisaari, H.H.-S.; Hobbie, E.A.; Iversen, C.M.; Jackson, R.B.; et al. Redefining fine roots improves understanding of below-ground contributions to terrestrial biosphere processes. New Phytol. 2015, 207, 505–518. [Google Scholar] [CrossRef] [PubMed]
- Malhi, Y.; Doughty, C.; Galbraith, D. The allocation of ecosystem net primary productivity in tropical forests. Philos. Trans. R. Soc. Lond. B 2011, 366, 3225–3245. [Google Scholar] [CrossRef] [PubMed]
- Xia, M.; Talhelm, A.F.; Pregitzer, K.S. Fine roots are the dominant source of recalcitrant plant litter in sugar maple-dominated northern hardwood forests. New Phytol. 2015, 208, 715–726. [Google Scholar] [CrossRef] [PubMed]
- Leppälammi-Kujansuu, J. Norway Spruce Fine Root Dynamics and Carbon Input into Soil in Relation to Environmental Factors. Ph.D. Thesis, University of Helsinki, Helsinki, Finland, 2014. [Google Scholar]
- King, J.; Pregitzer, K.; Zak, D.; Sober, J.; Isebrands, J.; Dickson, R.; Hendrey, G.; Karnosky, D. Fine-root biomass and fluxes of soil carbon in young stands of paper birch and trembling aspen as affected by elevated atmospheric CO2 and tropospheric O3. Oecologia 2001, 128, 237–250. [Google Scholar] [CrossRef] [PubMed]
- Mulkey, S.S.; Kitajima, K.; Wright, S.J. Plant physiological ecology of tropical forest canopies. Trends Ecol. Evol. 1996, 11, 408–412. [Google Scholar] [CrossRef]
- Steinaker, D.F.; Wilson, S.D. Phenology of fine roots and leaves in forest and grassland. J. Ecol. 2008, 96, 1222–1229. [Google Scholar] [CrossRef]
- Joslin, J.D.; Wolfe, M.H.; Hanson, P.J. Factors controlling the timing of root elongation intensity in a mature upland oak stand. Plant Soil 2001, 228, 201–212. [Google Scholar] [CrossRef]
- Peel, M.C.; Finlayson, B.L.; McMahon, T.A. Updated world map of the Köppen-Geiger climate classification. Hydrol. Earth Syst. Sci. Discuss. 2007, 4, 439–473. [Google Scholar] [CrossRef]
- WRB. World Reference Base for Soil Resources 2014; Food and Agriculture Organization of the United Nations: Rome, Italy, 2014. [Google Scholar]
- Leppälammi-Kujansuu, J.; Aro, L.; Salemaa, M.; Hansson, K.; Kleja, D.B.; Helmisaari, H.-S. Fine root longevity and carbon input into soil from below- and aboveground litter in climatically contrasting forests. For. Ecol. Manag. 2014, 326, 79–90. [Google Scholar] [CrossRef]
- Li, X.; Zhu, J.; Lange, H.; Han, S. A modified ingrowth core method for measuring fine root production, mortality and decomposition in forests. Tree Physiol. 2013, 33, 18–25. [Google Scholar] [CrossRef] [PubMed]
- Osawa, A.; Aizawa, R. A new approach to estimate fine root production, mortality, and decomposition using litter bag experiments and soil core techniques. Plant Soil 2012, 355, 167–181. [Google Scholar] [CrossRef]
- McClaugherty, C.A.; Aber, J.D.; Melillo, J.M. The role of fine roots in the organic matter and nitrogen budgets of two forested ecosystems. Ecology 1982, 63, 1481–1490. [Google Scholar] [CrossRef]
- Fairley, R.; Alexander, I. Methods of Calculating Fine Root Production in Forests. In Ecological Interactions in Soil; Fitter, A., Ed.; British Ecological Society: London, UK, 1985; pp. 37–42. [Google Scholar]
- Aerts, R.; Bakker, C.; De Caluwe, H. Root turnover as determinant of the cycling of C, N, and P in a dry heathland ecosystem. Biogeochemistry 1992, 15, 175–190. [Google Scholar] [CrossRef]
- Gale, M.R.; Grigal, D.F. Vertical root distributions of northern tree species in relation to successional status. Can. J. For. Res. 1987, 17, 829–834. [Google Scholar] [CrossRef]
- Valverde-Barrantes, O.J.; Raich, J.W.; Russell, A.E. Fine-root mass, growth and nitrogen content for six tropical tree species. Plant Soil 2007, 290, 357–370. [Google Scholar] [CrossRef]
- Kucbel, S.; Jaloviar, P.; Špišák, J. Quantity, vertical distribution and morphology of fine roots in Norway spruce stands with different stem density. Plant Root 2011, 5, 46–55. [Google Scholar] [CrossRef]
- Finér, L.; Helmisaari, H.-S.; Lõhmus, K.; Majdi, H.; Brunner, I.; Børja, I.; Eldhuset, T.; Godbold, D.; Grebenc, T.; Konôpka, B. Variation in fine root biomass of three European tree species: Beech (Fagus sylvatica L.), Norway spruce (Picea abies L. Karst.), and Scots pine (Pinus sylvestris L.). Plant Biosyst. 2007, 141, 394–405. [Google Scholar] [CrossRef]
- Brassard, B.W.; Chen, H.Y.H.; Cavard, X.; Laganière, J.; Reich, P.B.; Bergeron, Y.; Paré, D.; Yuan, Z.; Laganiere, J.; Reich, P.B.; et al. Tree species diversity increases fine root productivity through increased soil volume filling. J. Ecol. 2013, 101, 210–219. [Google Scholar] [CrossRef]
- Schenk, H.J.; Jackson, R.B. The Global Biogeography of Roots. Ecol. Monogr. 2002, 72, 311–328. [Google Scholar] [CrossRef]
- Canadell, J.; Jackson, R.B.; Ehleringer, J.B.; Mooney, H.A.; Sala, O.E.; Schulze, E.-D. Maximum rooting depth of vegetation types at the global scale. Oecologia 1996, 108, 583–595. [Google Scholar] [CrossRef] [PubMed]
- Chen, X.; Eamus, D.; Hutley, L.B. Seasonal patterns of fine-root productivity and turnover in a tropical savanna of northern Australia. J. Trop. Ecol. 2004, 20, 221–224. [Google Scholar] [CrossRef]
- Contador, M.L.; Comas, L.H.; Metcalf, S.G.; Stewart, W.L.; Porris Gomez, I.; Negron, C.; Lampinen, B.D. Root growth dynamics linked to above-ground growth in walnut (Juglans regia). Ann. Bot. 2015, 116, 49–60. [Google Scholar] [CrossRef] [PubMed]
- López, B.; Sabaté, S.; Gracia, C.A. Annual and seasonal changes in fine root biomass of a Quercus ilex L. forest. Plant Soil 2001, 230, 125–134. [Google Scholar] [CrossRef]
- Teskey, R.O.; Hinckley, T.M. Influence of temperature and water potential on root growth of white oak. Physiol. Plant. 1981, 52, 363–369. [Google Scholar] [CrossRef]
- Priestley, C.A.; Catlin, P.B.; Olsson, E.A. The Distribution of 14C-Labelled Assimilates in Young Apple Trees as Influenced by Doses of Supplementary Nitrogen. Ann. Bot. 1976, 40, 1163–1170. [Google Scholar] [CrossRef]
- Harteveld, M.; Hertel, D.; Wiens, M.; Leuschner, C. Spatial and temporal variability fo fine root abundance and growth in tropical moist forests and agroforestry systems (Sulawesi, Indonesia). ECOTROPICA 2007, 13, 111–120. [Google Scholar]
- Lima, T.T.S.; Miranda, I.S.; Vasconcelos, S.S. Effects of water and nutrient availability on fine root growth in eastern Amazonian forest regrowth, Brazil. New Phytol. 2010, 187, 622–630. [Google Scholar] [CrossRef] [PubMed]
- Kätterer, T.; Fabião, A.; Madeira, M.; Ribeiro, C.; Steen, E. Fine-root dynamics, soil moisture and soil carbon content in a Eucalyptus globulus plantation under different irrigation and fertilisation regimes. For. Ecol. Manag. 1995, 74, 1–12. [Google Scholar] [CrossRef]
- Yavitt, J.B.; Wright, S.J. Drought and Irrigation Effects on Fine Root Dynamics in a Tropical Moist Forest, Panama. Biotropica 2001, 33, 421–434. [Google Scholar] [CrossRef]
- Hertel, D.; Strecker, T.; Müller-Haubold, H.; Leuschner, C. Fine root biomass and dynamics in beech forests across a precipitation gradient—Is optimal resource partitioning theory applicable to water-limited mature trees? J. Ecol. 2013, 101, 1183–1200. [Google Scholar] [CrossRef]
- Joslin, J.D.; Wolfe, M.H.; Hanson, P.J. Effects of altered water regimes on forest root systems. New Phytol. 2000, 147, 117–129. [Google Scholar] [CrossRef]
- Metcalfe, D.B.; Meir, P.; Aragão, L.E.O.C.; da Costa, A.C.L.; Braga, A.P.; Gonçalves, P.H.L.; de Athaydes Silva Junior, J.; de Almeida, S.S.; Dawson, L.A.; Malhi, Y.; et al. The effects of water availability on root growth and morphology in an Amazon rainforest. Plant Soil 2008, 311, 189–199. [Google Scholar] [CrossRef]
- Eissenstat, D.M.; Yanai, R.D. The Ecology of Root Lifespan. Adv. Ecol. Res. 1997, 27, 1–60. [Google Scholar]
- Gilbert, K.J.; Fahey, T.J.; Maerz, J.C.; Sherman, R.E.; Bohlen, P.; Dombroskie, J.J.; Groffman, P.M.; Yavitt, J.B. Exploring carbon flow through the root channel in a temperate forest soil food web. Soil Biol. Biochem. 2014, 76, 45–52. [Google Scholar] [CrossRef]
- Hertel, D.; Harteveld, M.A.; Leuschner, C. Conversion of a tropical forest into agroforest alters the fine root-related carbon flux to the soil. Soil Biol. Biochem. 2008, 41, 481–490. [Google Scholar] [CrossRef]
- Rhoades, C.C.; Eckert, G.E.; Coleman, D.C. Soil carbon differences among forest, agriculture, and secondary vegetation in lower montane Ecuador. Ecol. Appl. 2000, 10, 497–505. [Google Scholar] [CrossRef]
- Guo, L.B.; Gifford, R.M. Soil carbon stocks and land use change: A meta analysis. Glob. Chang. Biol. 2002, 8, 345–360. [Google Scholar] [CrossRef]
Figure 1.
Cumulative root fraction distribution at Gelawdios natural forest as a function of root depth for different root categories (very fine roots vs. fine roots, biomass vs. necromass and herbaceous roots vs. roots from trees). The fit equation is Y = 1 − βd, where Y is the cumulative root fraction from the surface (proportion between zero and one) to soil depth (d in cm in the middle), and β is the fitted parameter of the asymptotic nonlinear model [54]. Larger β values imply deeper rooting profiles, e.g., a Y value of 0.75 at a 30-cm depth means that 75% of the root biomass is located above 30 cm or, conversely, 25% of the root biomass is located below the 30-cm soil depth.
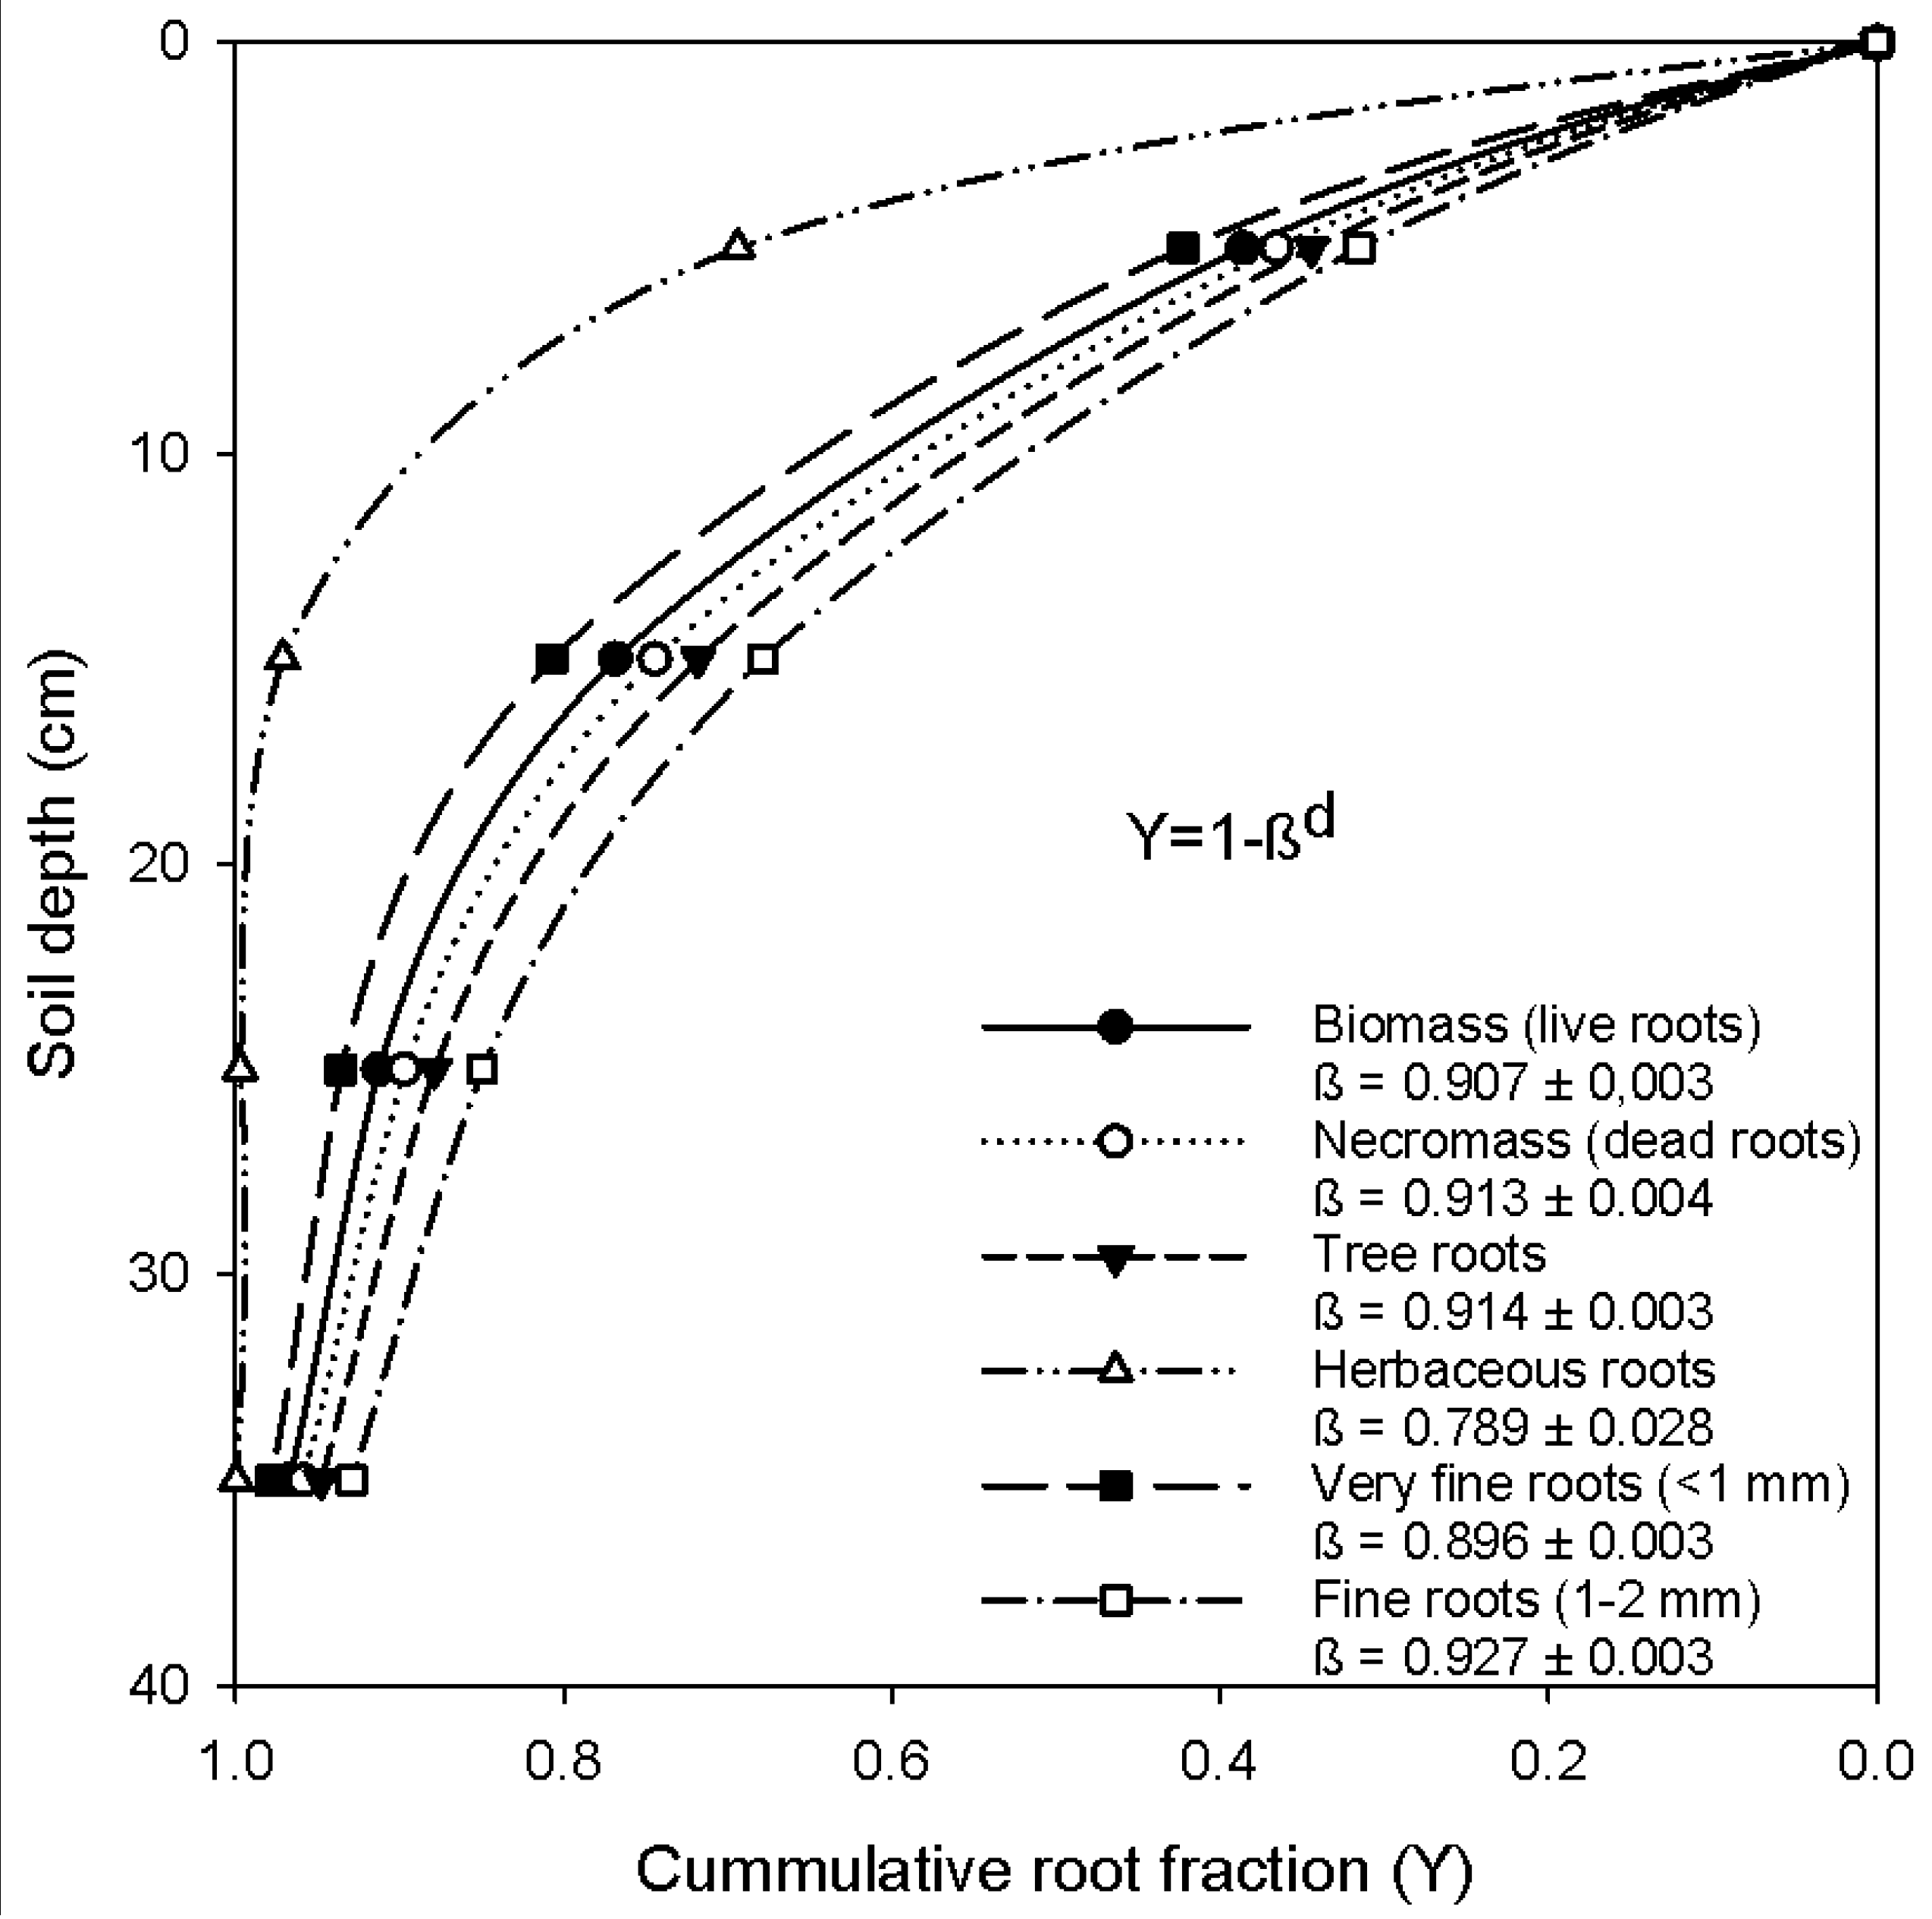
Figure 2.
Seasonal variation of fine root biomass and necromass (g·m−2) at Gelawdios (a) forest; (b) eucalyptus stand. Fine root estimates are based on the coring method. Bars with different small case letters are significantly different for filled bars (biomass), and different upper case letters indicate significant differences for unfilled bars (necromass). Error bars without same letters (small case letters for filled bars and capital case letters for unfilled bars) are significantly different (mean ± SE; p < 0.05; n = 10).
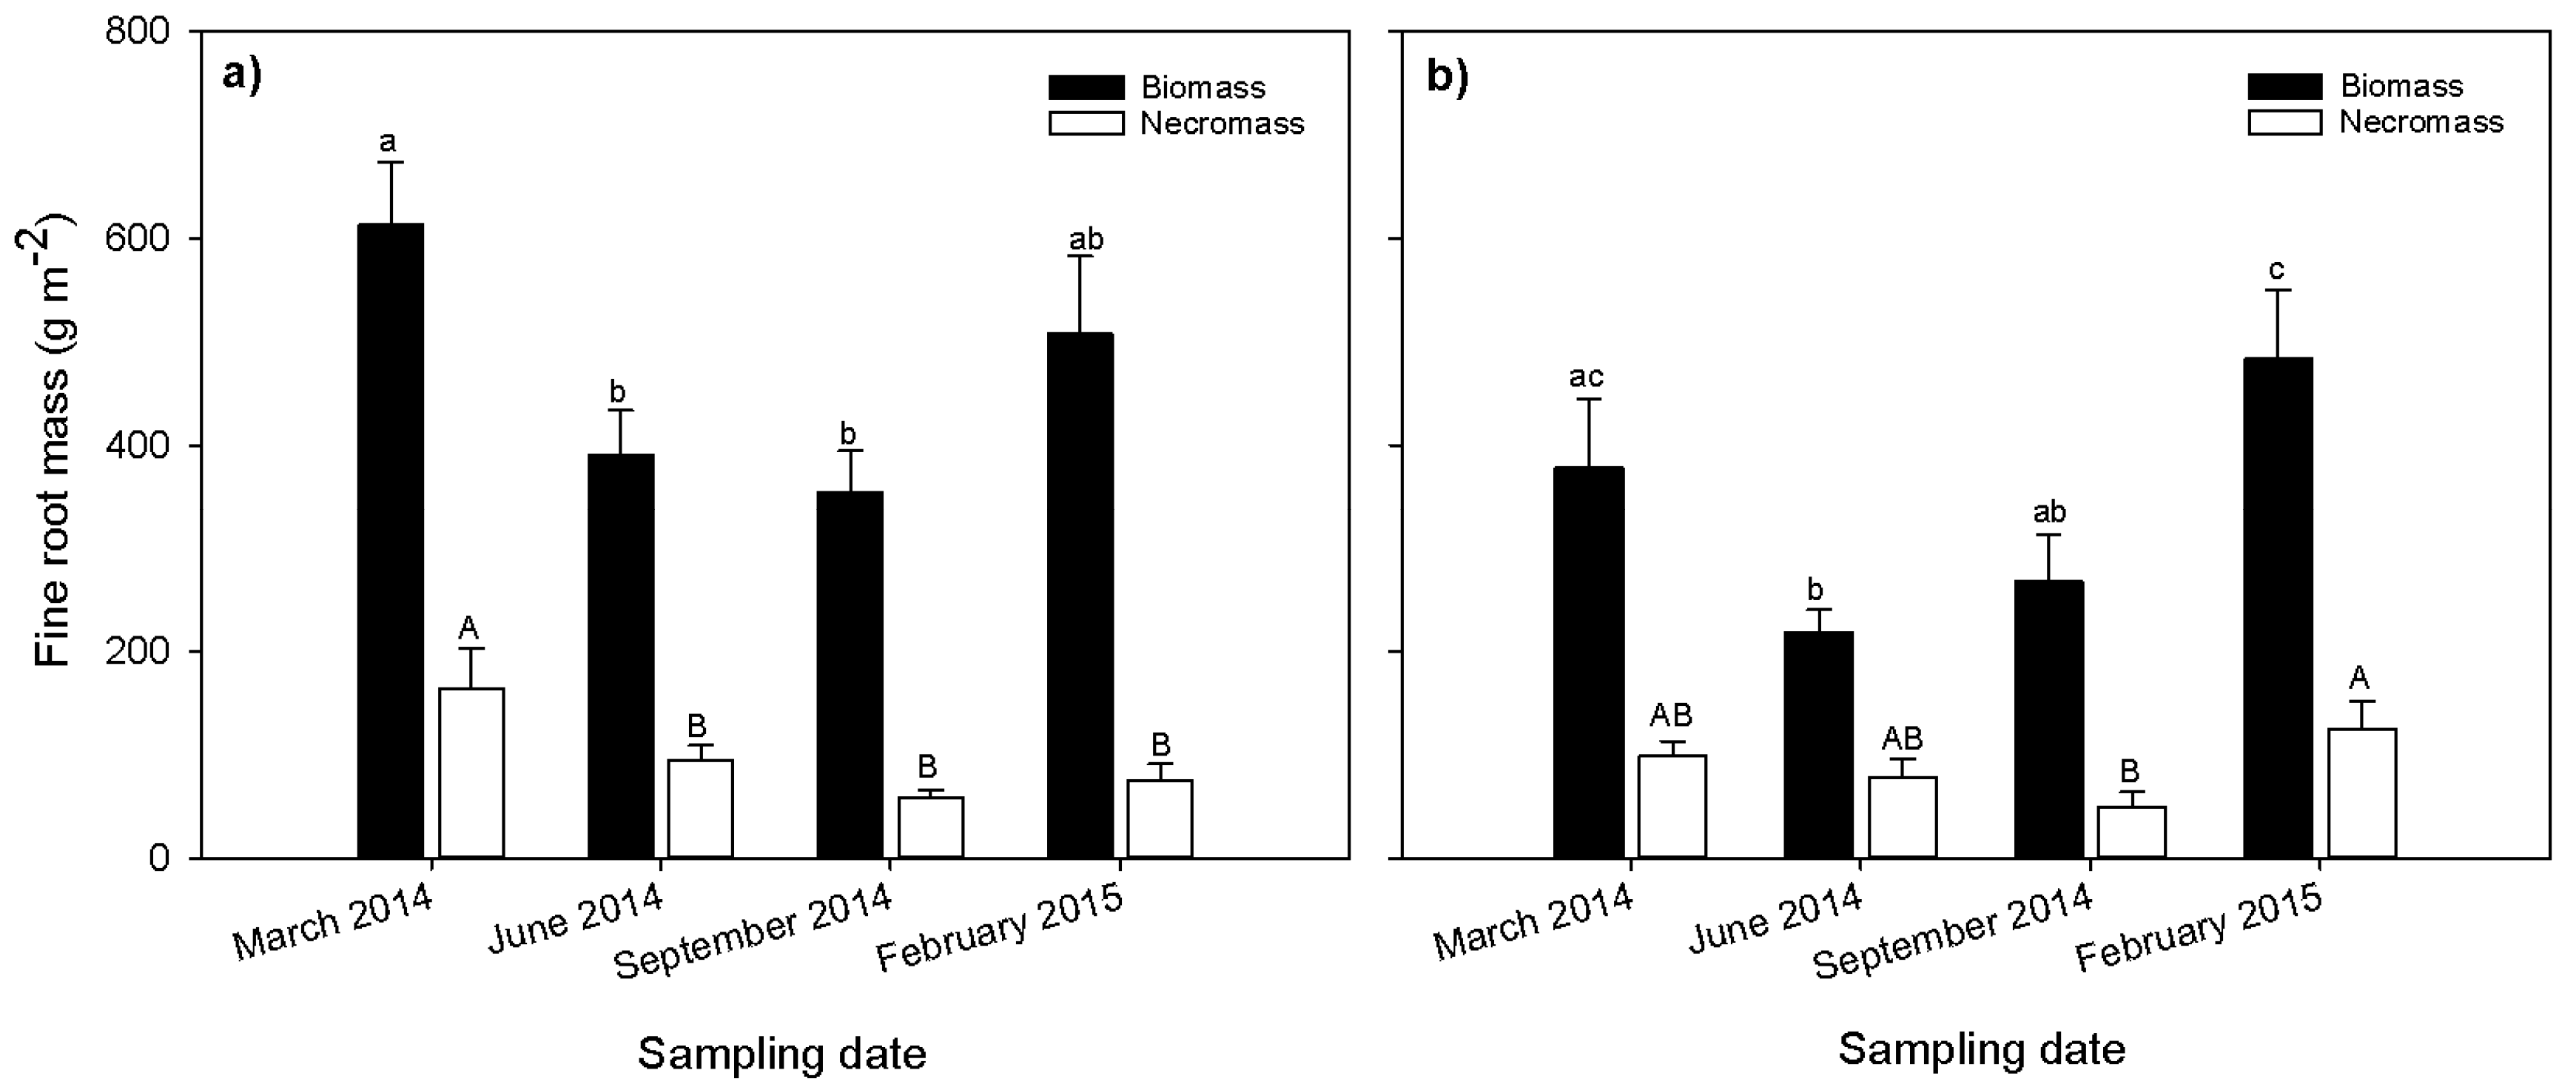
Figure 3.
Comparison of fine root production between land use types from in-growth core samples. Values for each stock were calculated based on the decision matrix method. Samples from grazing land and cropland were taken during the growing season only, assuming no new root production during the dry time and after crop harvest. Different small case letters indicate significant difference between land use types. Error bars represent the mean ± SE (p < 0.05; n = 10 for forest and eucalyptus, n = 5 for grazing and cropland).
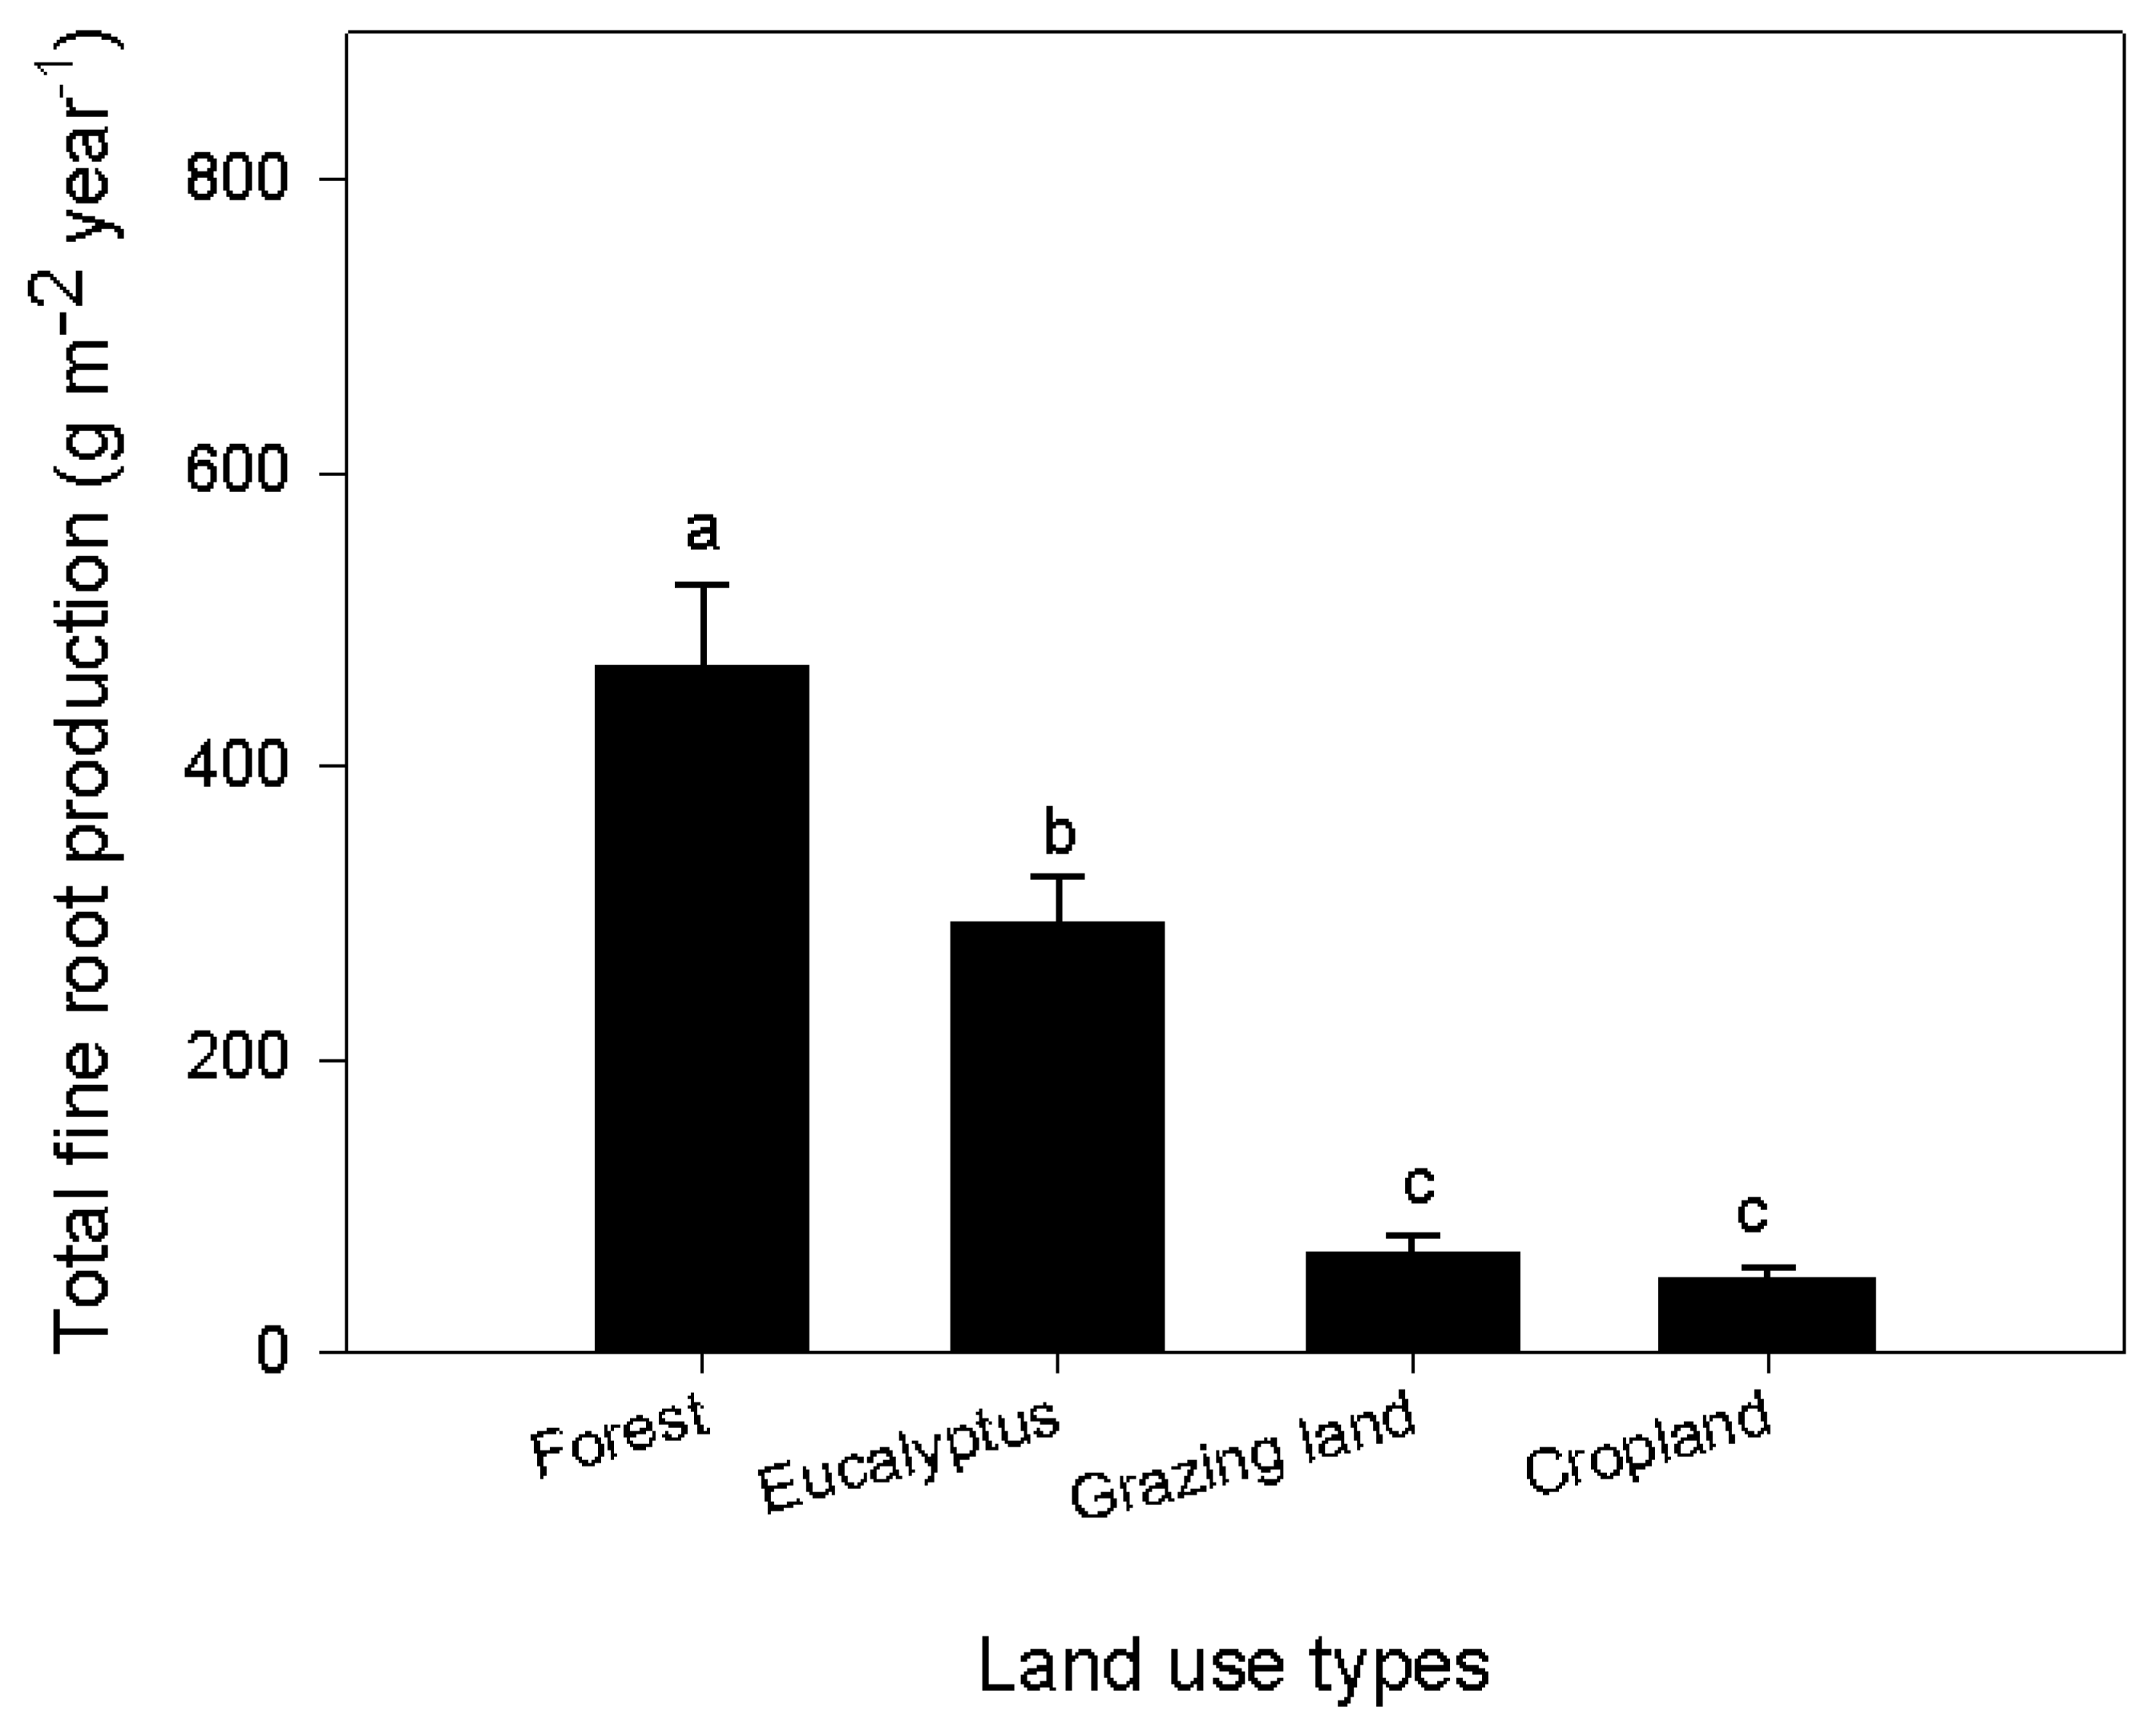
Figure 4.
Estimated fine root production (g·m−2·year−1) to a depth of 40 cm (filled bars) and 20 cm (unfilled bars) for the natural forest ecosystem with different sampling methods. In the unfilled bars, values for sequential coring and in-growth cores methods were calculated to a depth of 20 cm for uniformity with the in-growth net method because the latter was established to only the 20-cm depth. Small case letters indicate significant difference between sampling methods. Error bars represent the mean ± SE (p < 0.05; n = 10).
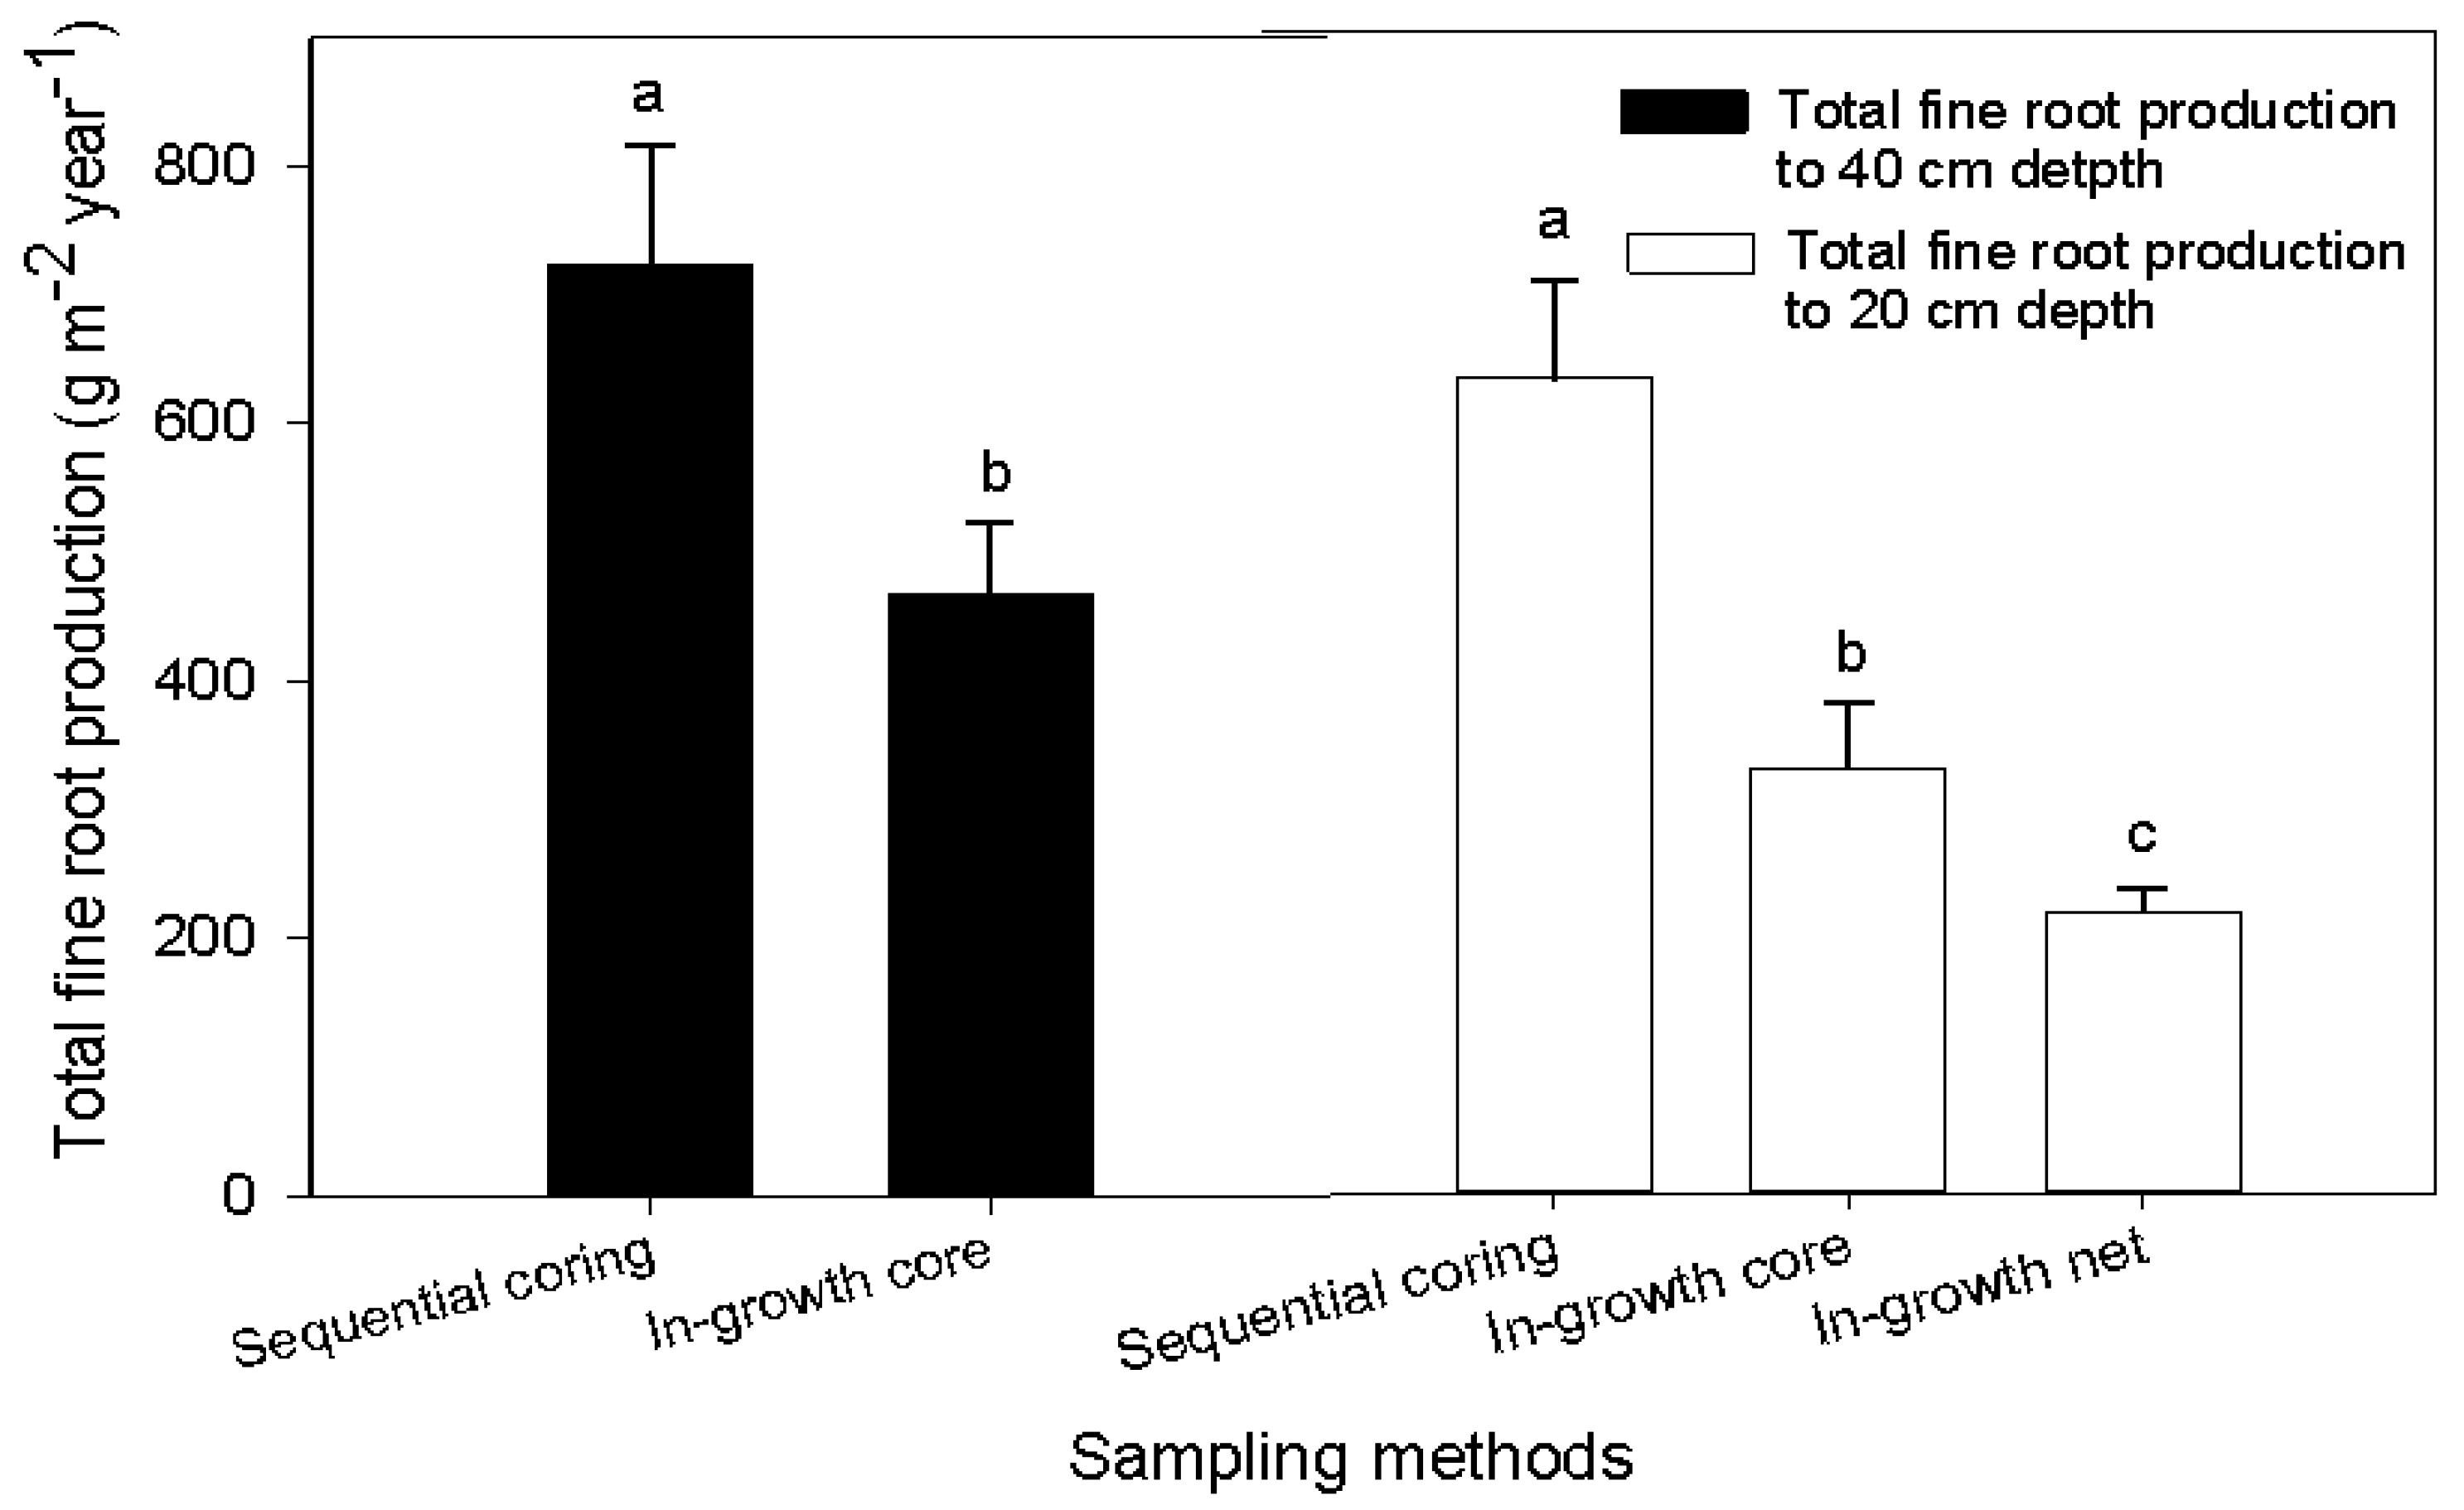
Figure 5.
Relationship between total root mass (biomass + necromass) with C stock (a) and N stock (b) for four land use systems at Gelawdios, Ethiopia. n = 10 (forest and eucalyptus) and 5 (cropland and grazing land).
Figure 5.
Relationship between total root mass (biomass + necromass) with C stock (a) and N stock (b) for four land use systems at Gelawdios, Ethiopia. n = 10 (forest and eucalyptus) and 5 (cropland and grazing land).

Table 1.
Decision matrix for estimating fine root production, mortality and decomposition after Fairley and Alexander [52]. The appropriate quadrant is selected according to the direction of change in biomass (B) and necromass (N) during the interval between two sampling times. Production (P), mortality (M) and decomposition (D) for the sampling interval are calculated using the equations in the chosen quadrant. Vertical bars indicate the absolute values. Annual estimates are calculated by summing the estimates from all sampling intervals within the year.
| Biomass | |||
|---|---|---|---|
| Increase | Decrease | ||
| Necromass | Increase | P = ΔB + ΔN | P = ΔB + ΔN or 0 |
| M = ΔN | M = ΔN or |−ΔB| | ||
| D = 0 | D = |−ΔB| − ΔN or 0 | ||
| Decrease | P = ΔB | P = 0 | |
| M = ΔB | M = |−ΔB| | ||
| D = |−ΔN| | D = |−ΔB| + |−ΔN| | ||
Table 2.
Vertical distribution of fine root mass (g·m−2) to a soil depth of 40 cm for native forest, eucalyptus stand, grazing land and cropland. Fine roots are categorized as tree vs. herbaceous roots, biomass (live roots) vs. necromass (dead roots) and very fine roots (<1 mm) vs. fine roots (1–2 mm) for both native forest and eucalyptus plantations. Values for forest and eucalyptus were determined based on sequential coring. Roots from cropland and grazing land are taken from the last in-growth core harvest, assuming peak rooting time at the end of the rainy season. Roots from these land use systems are entirely herbaceous and mostly <1 mm. Values are the mean ± SE; n = 10 (forest and eucalyptus); n = 5 (cropland and grazing land).
| Land Use | Depth | Total Root Mass | Live and Dead Roots | Diameter Class | Plant Type | |||
|---|---|---|---|---|---|---|---|---|
| Biomass | Necromass | Roots < 1 mm | Roots 1–2 mm | Tree Roots | Herbaceous Roots | |||
| Forest | Total | 564.2 ± 41.7 | 466.5 ± 31.6 | 97.7 ± 12.8 | 272.9 ± 18.2 | 291.4 ± 27.7 | 555.8 ± 42.2 | 8.4 ± 3.2 |
| 0–10 | 239.5 ± 18.5 | 195.5 ± 14.7 | 46.4 ± 6.9 | 137.5 ± 9.5 | 108.1 ± 12.1 | 232.1 ± 18.9 | 7.5 ± 2.9 | |
| 10–20 | 174.2 ± 15.2 | 153.3 ± 11.8 | 30.1 ± 4.5 | 81.4 ± 6.5 | 101.9 ± 10.5 | 177.9 ± 15.0 | 0.7 ± 0.4 | |
| 20–30 | 90.0 ± 11.3 | 74.0 ± 8.4 | 17.8 ± 3.9 | 37.2 ± 2.8 | 61.4 ± 10.4 | 89.8 ± 11.3 | 0.2 ± 0.2 | |
| 30–40 | 60.5 ± 8.4 | 55.6 ± 8.3 | 12.6 ± 2.2 | 27.1 ± 3.7 | 44.3 ± 6.8 | 65.4 ± 8.6 | na | |
| Eucalyptus | Total | 424.7 ± 36.9 | 336.8 ± 30.5 | 87.9 ± 10.2 | 211.8 ± 17.1 | 223.0 ± 22.8 | 302.6 ± 28.9 | 122.1 ± 15.1 |
| 0–10 | 231.4 ± 19.8 | 176.2 ± 16.5 | 55.2 ± 6.7 | 123.6 ± 12.1 | 107.8 ± 11.4 | 140.5 ± 11.8 | 90.9 ± 13.2 | |
| 10–20 | 93.6 ± 12.7 | 75.8 ± 11.0 | 20.9 ± 4.0 | 45.4 ± 4.5 | 60.3 ± 10.9 | 74.2 ± 12.1 | 19.4 ± 3.1 | |
| 20–30 | 58.1 ± 7.5 | 48.7 ± 7.0 | 12.5 ± 1.6 | 27.1 ± 2.9 | 41.3 ± 6.7 | 50.6 ± 7.7 | 8.7 ± 1.7 | |
| 30–40 | 41.6 ± 14.3 | 41.2 ± 15.5 | 9.7 ± 1.9 | 17.4 ± 2.8 | 47.2 ± 21.7 | 44.0 ± 16.2 | 3.1 ± 0.7 | |
| Grazing land | Total | 55.5 ± 13.3 | 53.2 ± 12.7 | 3.4 ± 1.6 | 55.5 ± 13.3 | na | na | 55.5 ± 13.3 |
| 0–10 | 31.9 ± 7.8 | 29.8 ± 7.1 | 2.1 ± 1.3 | 31.9 ± 7.8 | na | na | 31.9 ± 7.8 | |
| 10–20 | 13.3 ± 5.6 | 13.3 ± 5.6 | na | 13.3 ± 5.6 | na | na | 13.3 ± 5.6 | |
| 20–30 | 6.4 ± 1.7 | 5.9 ± 1.6 | 0.5 ± 0.0 | 6.4 ± 1.7 | na | na | 6.4 ± 1.7 | |
| 30–40 | 4.9 ± 2.1 | 4.1 ± 1.5 | 0.8 ± 1.3 | 4.9 ± 2.1 | na | na | 4.9 ± 2.1 | |
| Cropland | Total | 46.1 ± 4.4 | 45.3 ± 3.9 | 0.8 ± 0.6 | 44.8 ± 3.4 | 1.3 | na | 46.1 ± 4.4 |
| 0–10 | 31.2 ± 3.2 | 30.6 ± 6.3 | 0.7 ± 0.0 | 31.2 ± 3.2 | na | na | 31.2 ± 3.2 | |
| 10–20 | 13.2 ± 4.2 | 13.0 ± 4.2 | 0.2 ± 0.0 | 11.9 ± 3.1 | 1.3 | na | 13.2 ± 4.2 | |
| 20–30 | 1.7 ± 1.1 | 1.7 ± 1.1 | na | 1.7 ± 1.1 | na | na | 1.7 ± 1.1 | |
| 30–40 | na * | na | na | na | na | na | na | |
* na, not available.
Table 3.
Fine root biomass (mean, maximum), production (biomass (B), necromass (N), decomposition (D), total production (TP)) and turnover rate to a depth of 40 cm for natural forest and eucalyptus plantation as determined by sequential soil coring. The annual production rates are calculated from sequential coring data based on the decision matrix and maximum-minimum methods, and the turnover rates are calculated by dividing the annual production by the mean biomass (Bmean) or by maximum biomass (Bmax). Samples for sequential coring were collected in quarterly intervals. Values are the mean ± SE; n = 10.
| Land Use | Biomass | Decision Matrix | Max-Min | ||||||||||
|---|---|---|---|---|---|---|---|---|---|---|---|---|---|
| Mean (g·m−2) | Max. (g·m−2) | Production (g·m−2) | Turnover Rate | Production (g·m−2) | Turnover Rate | ||||||||
| B | N | D | TP | Bmean (year−1) | Bmax (year−1) | B | N | TP | Bmean (year−1) | Bmax (year−1) | |||
| Forest | 496.6 ± 41.0 | 684.4 ± 59.2 | 256.9 ± 43.8 | 50.1 ± 10.4 | 415.9 ± 66.2 | 722.9 ± 92.8 | 1.5 | 1.1 | 330.7 ± 40.5 | 128.7 ± 36.1 | 459.4 ± 63.8 | 0.93 | 0.67 |
| Eucalyptus | 336.8 ± 28.6 | 559.1 ± 70.1 | 313.3 ± 61.4 | 98.8 ± 28.2 | 282.2 ± 71.2 | 694.4 ± 94.8 | 2.1 | 1.2 | 376.6 ± 57.6 | 110.4 ± 26.4 | 486.9 ± 77.3 | 1.5 | 0.87 |
Table 4.
Root production estimates using in-growth cores and in-growth nets to the 20-cm depth. Sampling corresponded to 1-, 2-, 3-, 4-, 5-, 8- and 12-month interval times. Fine root biomass, necromass, decomposition and total production are calculated based on the mass balance method according to Santantonio and Grace [8], Osawa and Aizawa [50] and Li et al. [49]. Small case letters (a,b,c) indicate a significant difference between land use types, and upper case letters (A,B) indicate a significant difference between sampling methods of the same land use types (in-growth core vs in-growth nets). Values are the mean ± SE; n = 10 (forest and eucalyptus), n = 5 (grazing land and cropland).
| Sampling Method and Land Use Type | Root production (g·m−2) | |||
|---|---|---|---|---|
| Biomass | Necromass | Decomposed | Total Production | |
| In-growth core 20-cm depth | ||||
| Forest | 173.8 ± 13.6 aA | 34.2 ± 6.2 aA | 121.0 ± 27.8 aA | 329.0 ± 50.6 aA |
| Eucalyptus | 96.7 ± 14.0 bA | 38.8 ± 12.5 aA | 95.1 ± 21.1 aA | 230.6 ± 30.6 aA |
| Grazing land | 43.1 ± 11.4 cA | 2.1 ± 0.9 bA | 1.8 ± 0.6 bA | 47.8 ± 11.5 bA |
| Cropland | 43.6 ± 3.2 cA | 0.8 ± 0.6 bA | 2.5 ± 1.5 bA | 46.2 ± 4.2 bA |
| In-growth net method 20-cm depth | ||||
| Forest | 71.1 ± 12.2 aB | 25.9 ± 5.6 aA | 120.6 ± 19.7 aA | 217.7 ± 17.7 aB |
| Eucalyptus | 78.6 ± 20.2 aA | 17.7 ± 4.2 aB | 140.3 ± 22.1 aA | 226.9 ± 19.2 aA |
| Grazing land | 39.9 ± 22.0 bA | 2.6 ± 1.5 bA | 2.1 ± 1.1 bA | 44.6 ± 23.1 bA |
| Cropland | 54.7 ± 4.6 bA | 0.9 ± 0.6 bA | 0.2 ± 0.2 bB | 55.8 ± 4.6 bA |
Table 5.
Total C and N flux (g·m−2·year−1) to soils via fine roots in four land use systems at Gelawdios, Ethiopia. Element fluxes to the 40-cm depth were calculated according to Xia et al. (2015) from element concentrations in the roots multiplied by annual fine root production estimated from in-growth cores. Numbers in brackets are the number of samples. For elemental analysis in forests and eucalyptus, three root types were included (i.e., three each: roots < 1 mm, roots 1–2 mm and herbaceous roots), whereas samples from grassland and cropland were all herbaceous.
| Land Use Type | C% in Roots | N% in Roots | Element Flux (g·m−2·year−1) | |
|---|---|---|---|---|
| C | N | |||
| Forest | 48.4 ± 0.9 (n = 9) | 1.6 ± 0.3 (n = 9) | 226.4 | 7.5 |
| Eucalyptus | 45.4 ± 0.8 (n = 9) | 0.9 ± 0.1 (n = 9) | 132.9 | 2.6 |
| Grazing land | 46.3 ± 1.2 (n = 3) | 1.0 ± 0.0 (n = 3) | 32.2 | 0.7 |
| Cropland | 46.3 ± 1.2 (n = 3) | 1.0 ± 0.0 (n = 3) | 23.9 | 0.5 |
© 2017 by the authors. Licensee MDPI, Basel, Switzerland. This article is an open access article distributed under the terms and conditions of the Creative Commons Attribution (CC BY) license (http://creativecommons.org/licenses/by/4.0/).
Share and Cite
MDPI and ACS Style
Assefa, D.; Rewald, B.; Sandén, H.; Godbold, D.L. Fine Root Dynamics in Afromontane Forest and Adjacent Land Uses in the Northwest Ethiopian Highlands. Forests 2017, 8, 249. https://doi.org/10.3390/f8070249
AMA Style
Assefa D, Rewald B, Sandén H, Godbold DL. Fine Root Dynamics in Afromontane Forest and Adjacent Land Uses in the Northwest Ethiopian Highlands. Forests. 2017; 8(7):249. https://doi.org/10.3390/f8070249
Chicago/Turabian StyleAssefa, Dessie, Boris Rewald, Hans Sandén, and Douglas L. Godbold. 2017. "Fine Root Dynamics in Afromontane Forest and Adjacent Land Uses in the Northwest Ethiopian Highlands" Forests 8, no. 7: 249. https://doi.org/10.3390/f8070249
Note that from the first issue of 2016, this journal uses article numbers instead of page numbers. See further details here.