Article

Short-Term Effects of Reduced-Impact Logging on Copaifera spp. (Fabaceae) Regeneration in Eastern Amazon

1
US Forest Service (USDA), Rocky Mountain Research Station, RMRS, 1221 South Main Street, Moscow, ID 83843, USA
2
Department of Forest Sciences, Escola Superior de Agricultura “Luiz de Queiroz”, University of São Paulo, Av. Pádua Dias, 11 Cx. P. 09, Piracicaba CEP 13418-900, Brazil
3
Department of Natural Resources and Society, College of Natural Resources, University of Idaho (UI), 875 Perimeter Drive, Moscow, ID 83843, USA
4
Departamento de Matemática, Escola de Ciências e Tecnologia, Universidade de Évora, Romão Ramalho 59, Évora 7000-671, Portugal
5
Department of Forest Engineering, University of Santa Catarina State-Agroveterinárias Science Center. Av. Luiz de Camões, 2090, Conta Dinheiro, Lages CEP 88520-000, Brazil
*
Author to whom correspondence should be addressed.
Forests 2017, 8(7), 257; https://doi.org/10.3390/f8070257
Submission received: 21 June 2017 / Revised: 14 July 2017 / Accepted: 14 July 2017 / Published: 23 July 2017

Abstract

:
Timber management directly influences the population dynamics of tree species, like Copaifera spp. (copaíba), which provide oil-resin with ecological and economic importance. The aim of this study was to evaluate the structure and population dynamics of Copaifera in unmanaged and managed stands by reduced-impact logging (RIL) in eastern Amazon in Pará state, Brazil. Based on a stem map of the study area, 40 Copaifera trees were randomly selected, where an equal number of trees were selected in managed and unmanaged stands. A transect of 10 × 100 m was centered at each tree (50 m each side) to assess Copaifera regeneration. Transects were subdivided into ten plots, of which six were systematically chosen to assess the height, diameter and number of Copaifera seedlings and saplings. The field assessment occurred in 2011 and 2013. To estimate the amount of sunlight transmitted to the forest floor, we computed canopy cover from airborne LiDAR data. According to the results, the abundance of Copaifera seedlings/saplings was higher in managed than unmanaged stands. About 5% of Copaifera regeneration was found between 45–50 m from the Copaifera tree while ~73% of regeneration was concentrated within a 10 m radius of the Copaifera tree. We verified that the diameter distribution of Copaifera regeneration was not a negative exponential distribution, as is typical of most tree species in natural forest. Rather, the Copaifera regeneration had a spatially aggregated distribution. In this short-term analysis, the impact of timber management is not negatively affecting the population structure or dynamics of Copaifera regeneration.

1. Introduction

The Amazon rainforest covers nine countries in Latin America and more than half of its area is located in Brazil. This biodiverse forest covers about 49% of Brazil [1]. However, due to deforestation this percentage is decreasing every day. In 2012, it was recorded that 20% of the Brazilian Amazon forest area had been deforested [2], resulting in multiple negative consequences including an increase in carbon dioxide (CO2) emissions into the atmosphere, damages to soil and water resources, and loss of biodiversity [3,4]. Predatory forest exploitation for timber affects tropical forest structure and species dynamics, and although some plant species are protected by law, many Brazilian Amazon forest species are endangered due to this type of exploitation. Studies that evaluate the effects of predatory or sustainable forest management practices in tropical forest are essential to provide information applicable to forest restoration and management programs [5].
Among the species more heavily exploited in tropical forests due to their high economic value are the Copaifera spp., collectively known as copaíba and belonging to the Fabaceae family [6]. The wood of these species is of great value, as well as the oil resin extracted from the stem, due to its medicinal properties (anti-inflammatory and healing) [7]. Copaifera is classified as a late secondary to climax species [6] and have low density in the Amazon forest, around 0.01 to 2 trees per hectare [8,9], where about 90% of tropical species have low density and they are referred to as rare [10]. The natural regeneration density is related to light availability and there is an aggregation tendency to their distribution [11,12]. However, several biotic or abiotic factors may influence natural regeneration establishment; e.g., competition, herbivory, soil substrate quality, light and water availability, and trampling by animals or machines [13,14]. Reduced impact logging (RIL) is a planned and carefully controlled management of the forest for timber production purpose [15]. Even if it is not RIL’s main purpose to exploit Copaifera trees, this type of logging can alter the forest environment by forming clearings with greater light availability and lower soil compaction. It may also cause invasion by non-commercial tree species, grasses and lianas, therefore increasing competition with valuable species [16]. Consequently, low-density natural native species may disappear from managed areas due to lack of natural regeneration.
Although changes in forest structure do occur, compared to conventional logging, RIL management may be more profitable [15] due to reducing the environmental impact on forest stands and soils, and especially for minimizing damage to residual trees and soil compaction [17] while also reducing work accidents and costs [18]. Among the procedures integrating RIL, we can cite: mapping of harvestable trees, water courses, and topography; directional felling, skid trails, and log deck planning [18]. Canopy openings produced by RIL timber management in tropical forest (logging gaps, log decks and skid paths) may encourage seed germination and tree recruitment [19] of species like Copaifera spp. However, the effects of RIL on the regeneration of commercial tree species are still poorly known [20]. Some studies have shown that Copaifera regeneration in natural forest [11,12,14,21] is strongly affected by forest biodiversity and forest management intensity [22,23], which makes it important to understand the behavior of Copaifera natural regeneration in areas altered by management activities. Seedlings and saplings have an important role in perpetuating the species. In addition, economic and ecological productivity as well as the conservation of natural regeneration of commercial tree species can be achieved by having a better understanding of the effects of RIL [24].
The motivation for this study was to generate ecological information to help forest managers plan for plant recovery after management activities, particularly for rare species with economic value such as Copaifera that may be endangered as a result of deforestation or a changing climate. Therefore, this study aims to determine whether the growth, survival, recruitment, and density of Copaifera seedlings and saplings vary between stands, whether unmanaged (natural) or managed by RIL in tropical forest.

2. Material and Methods

2.1. Study Area

The study was conducted in a tropical forested area belonging to the Tropical Forest Institute (Instituto Floresta Tropical—IFT), located in Forest Management Centre “Roberto Bauch”, Cauaxi Farm, in the municipality of Paragominas, Pará State (between 3°35′ and 3°45′ S and 48°15′ and 48°25′ W Gr.) (Figure 1). The local relief is moderately steep, and soils are dominated by yellow latosol [25]. The forest climate is classified as humid tropical [26], with a local average rainfall of 2200 mm; the highest concentration is in the months from January to June. The climate is warm and humid, with an average annual temperature of 25 °C.

2.2. Selection and Measurement of Copaifera

The study area covers ~5000 hectares and is divided into smaller areas, locally called work units (WU), but heretofore referred to as stands, which range in size from 40 to 100 ha. Managed stands were located in the same forest type, climate, and edaphic conditions as unmanaged stands. The census was conducted in WU and all trees with diameter at breast height (DBH; 1.30 m) ≥35 cm were measured. The density of Copaifera trees in the study area is about 0.22 trees ha−1, and based on the stem maps (census) provided by the IFT field team, in three managed stands (harvested in 2007–2008) and two unmanaged stands, a total of 40 Copaifera trees were randomly selected (20 trees in each environment). The botanical identification of Copaifera trees was made first by IFT workers, who differentiated species as either white (Copaifera reticulata Ducke) or black (C. duckei Dwayer), and then by a botanical expert after the branches with flowers and fruit were collected in the first evaluation in 2011.
In November of 2011, regenerating Copaifera seedlings and saplings surrounding the 40 randomly selected Copaifera trees were tallied in 10 × 100 m transects centered at each tree. For consistency purposes, the transects were oriented North–South (Figure 1), but as the study area is located close to the Equator line, the chosen orientation is not impacting the Copaifera regeneration assessment. Transects were subdivided into 10 plots of 10 m × 10 m (Figure 1). In plots 1, 3, 5, 6, 8 and 10, seedlings and saplings of Copaifera were mapped and measured without size criteria (height and diameter). In each of the sample plots, we measured the total height (Ht) of regenerating Copaifera with a graduated ruler and the diameter at ground height (DGH) using a digital caliper with an accuracy of 0.01 mm. In August of 2013, the Copaifera regeneration was re-evaluated with respect to their growth or death, adopting the same criteria and observations as in the first evaluation in 2011. We defined the seedling as a plant in the emergency stage until the appearance of the first pair of leaves and drying of cotyledons; and the sapling as a plant with more than a pair of leaves and height ≤1.30 m.

2.3. Regeneration of Copaifera

2.3.1. Demographic Rates

Initially, 40 Copaifera trees were randomly chosen for the regeneration study; however, in the second evaluation in 2013, two trees, one in each treatment (managed and unmanaged) were found fallen in the forest, making these sites inaccessible to assess the Copaifera saplings or seedlings.
Copaifera regeneration (saplings and seedlings) observed within the 38 transects in 2011 and 2013 period were assessed with respect to the density per hectare, rates of mortality, recruitment, and growth and compared between managed and unmanaged stands.
Based on Sheil et al. [27], changes in population size were assumed by time interval in constant proportion to the initial population size, and the mean annual rates of mortality (M) Equation (1) and recruitment (R) Equation (2) were thus calculated:
M = { 1 [ ( N 0 m ) / N 0 ] 1 / t } 100
R = [ 1 ( 1 r / N t ) 1 / t ] 100
where t is the elapsed time between the inventories; N0 and Nt are, respectively, the initial and final counts of Copaifera regeneration; m and r are, respectively, the number of Copaifera regeneration dead and recruited. The periodic growth increments of diameter and height (mm/month; cm/month) of the Copaifera regeneration were calculated as the difference in measurements between the two periods, divided by the elapsed time (months) between the two measurements. Spearman’s correlation coefficient [28] was used to verify the relationship between the Ht and DGH variables of the regenerating individuals. To test the significance of a value obtained from ρ under the null hypothesis (the variables are not associated), the Student t test was performed (α = 0.05 critical value).
The Wilcoxon-Mann-Whitney test for two independent samples, at α = 0.05, was used to verify differences between average values of density, mortality, and recruitment rates of Copaifera regeneration in both stands (managed and unmanaged) [29].

2.3.2. Modeling of Mortality and Survival

Logistic regression analysis was performed to assess if regeneration mortality and survival changes as a function of diameter and height of the Copaifera regeneration, and distance from Copaifera trees in managed and unmanaged environments. The logistic model Equation (3) predicts the probability of occurrence ranging continuously between 0 and 1. This method assigns ‘1’ to the event of survival and a ‘0’ to mortality [30]. The logistic regression model is:
Y = 1 1 + e ( β 0 + β 1 x 1 + β p x p ) + ε
where Y is the dependent variable (1 or 0), x1 to xp are independent variables [diameter (mm), height (cm), and distance (m)], β 0 is the intercept, and β 1 to β p are parameters; 𝜀 is error. The model was developed using the maximum likelihood method [31]. The logarithm of the likelihood was used rather than the likelihood itself in model fitting because it is a monotonically increasing function of the likelihood and is easier to differentiate and maximize [32]. Standard tests and statistics were used for logistic regression, namely the likelihood ratio test and Wald’s test (α = 0.1b critical value). Validation of the models was done studying the performance of the functions. No specific validation data sets were set aside for later use.
All statistical analyzes were performed with R version 3.0.2 [33].

2.4. Forest Canopy Cover

Due to trees felling and movement of machinery during RIL operations, different forest environments are created. In this way, the managed and unmanaged stands are different because of light transmittance to the forest floor. The amount of sunlight transmitted through the forest canopy was indicated by measures of forest canopy cover [COV (%)] derived from airborne LiDAR (Light Detection and Ranging) data. LiDAR data were acquired in 2012, with the Optech ALTM 3100 sensor, as part of the Sustainable Landscapes Brazil joint project of the Brazilian Corporation of Agricultural Research Corporation and the United States Forest Service. The total area covered by the lidar survey was 1200 ha. The LiDAR data attributes and flight characteristics are detailed in Table 1. The LiDAR-derived COV has been widely used as one of the most important LiDAR-derived metrics for predicting forest structure attributes such as biomass, basal area, and volume (as example: [34,35,36].
In this study, we established 17 random transects of 935 m × 100 m both in managed and unmanaged areas to compute COV Equation (4). For each transect, COV was computed according to Equation (4), using the CloudMetrics and GridMetrics tools from FUSION/LDV version 3.42 [37], above a height threshold of 0.5 m and at 1 m height increments up to 30 m:
COV x = First   Returns > x Total   of   first   returns 100
where: COV x = canopy cover (%) above x height; x = break heights.

3. Results

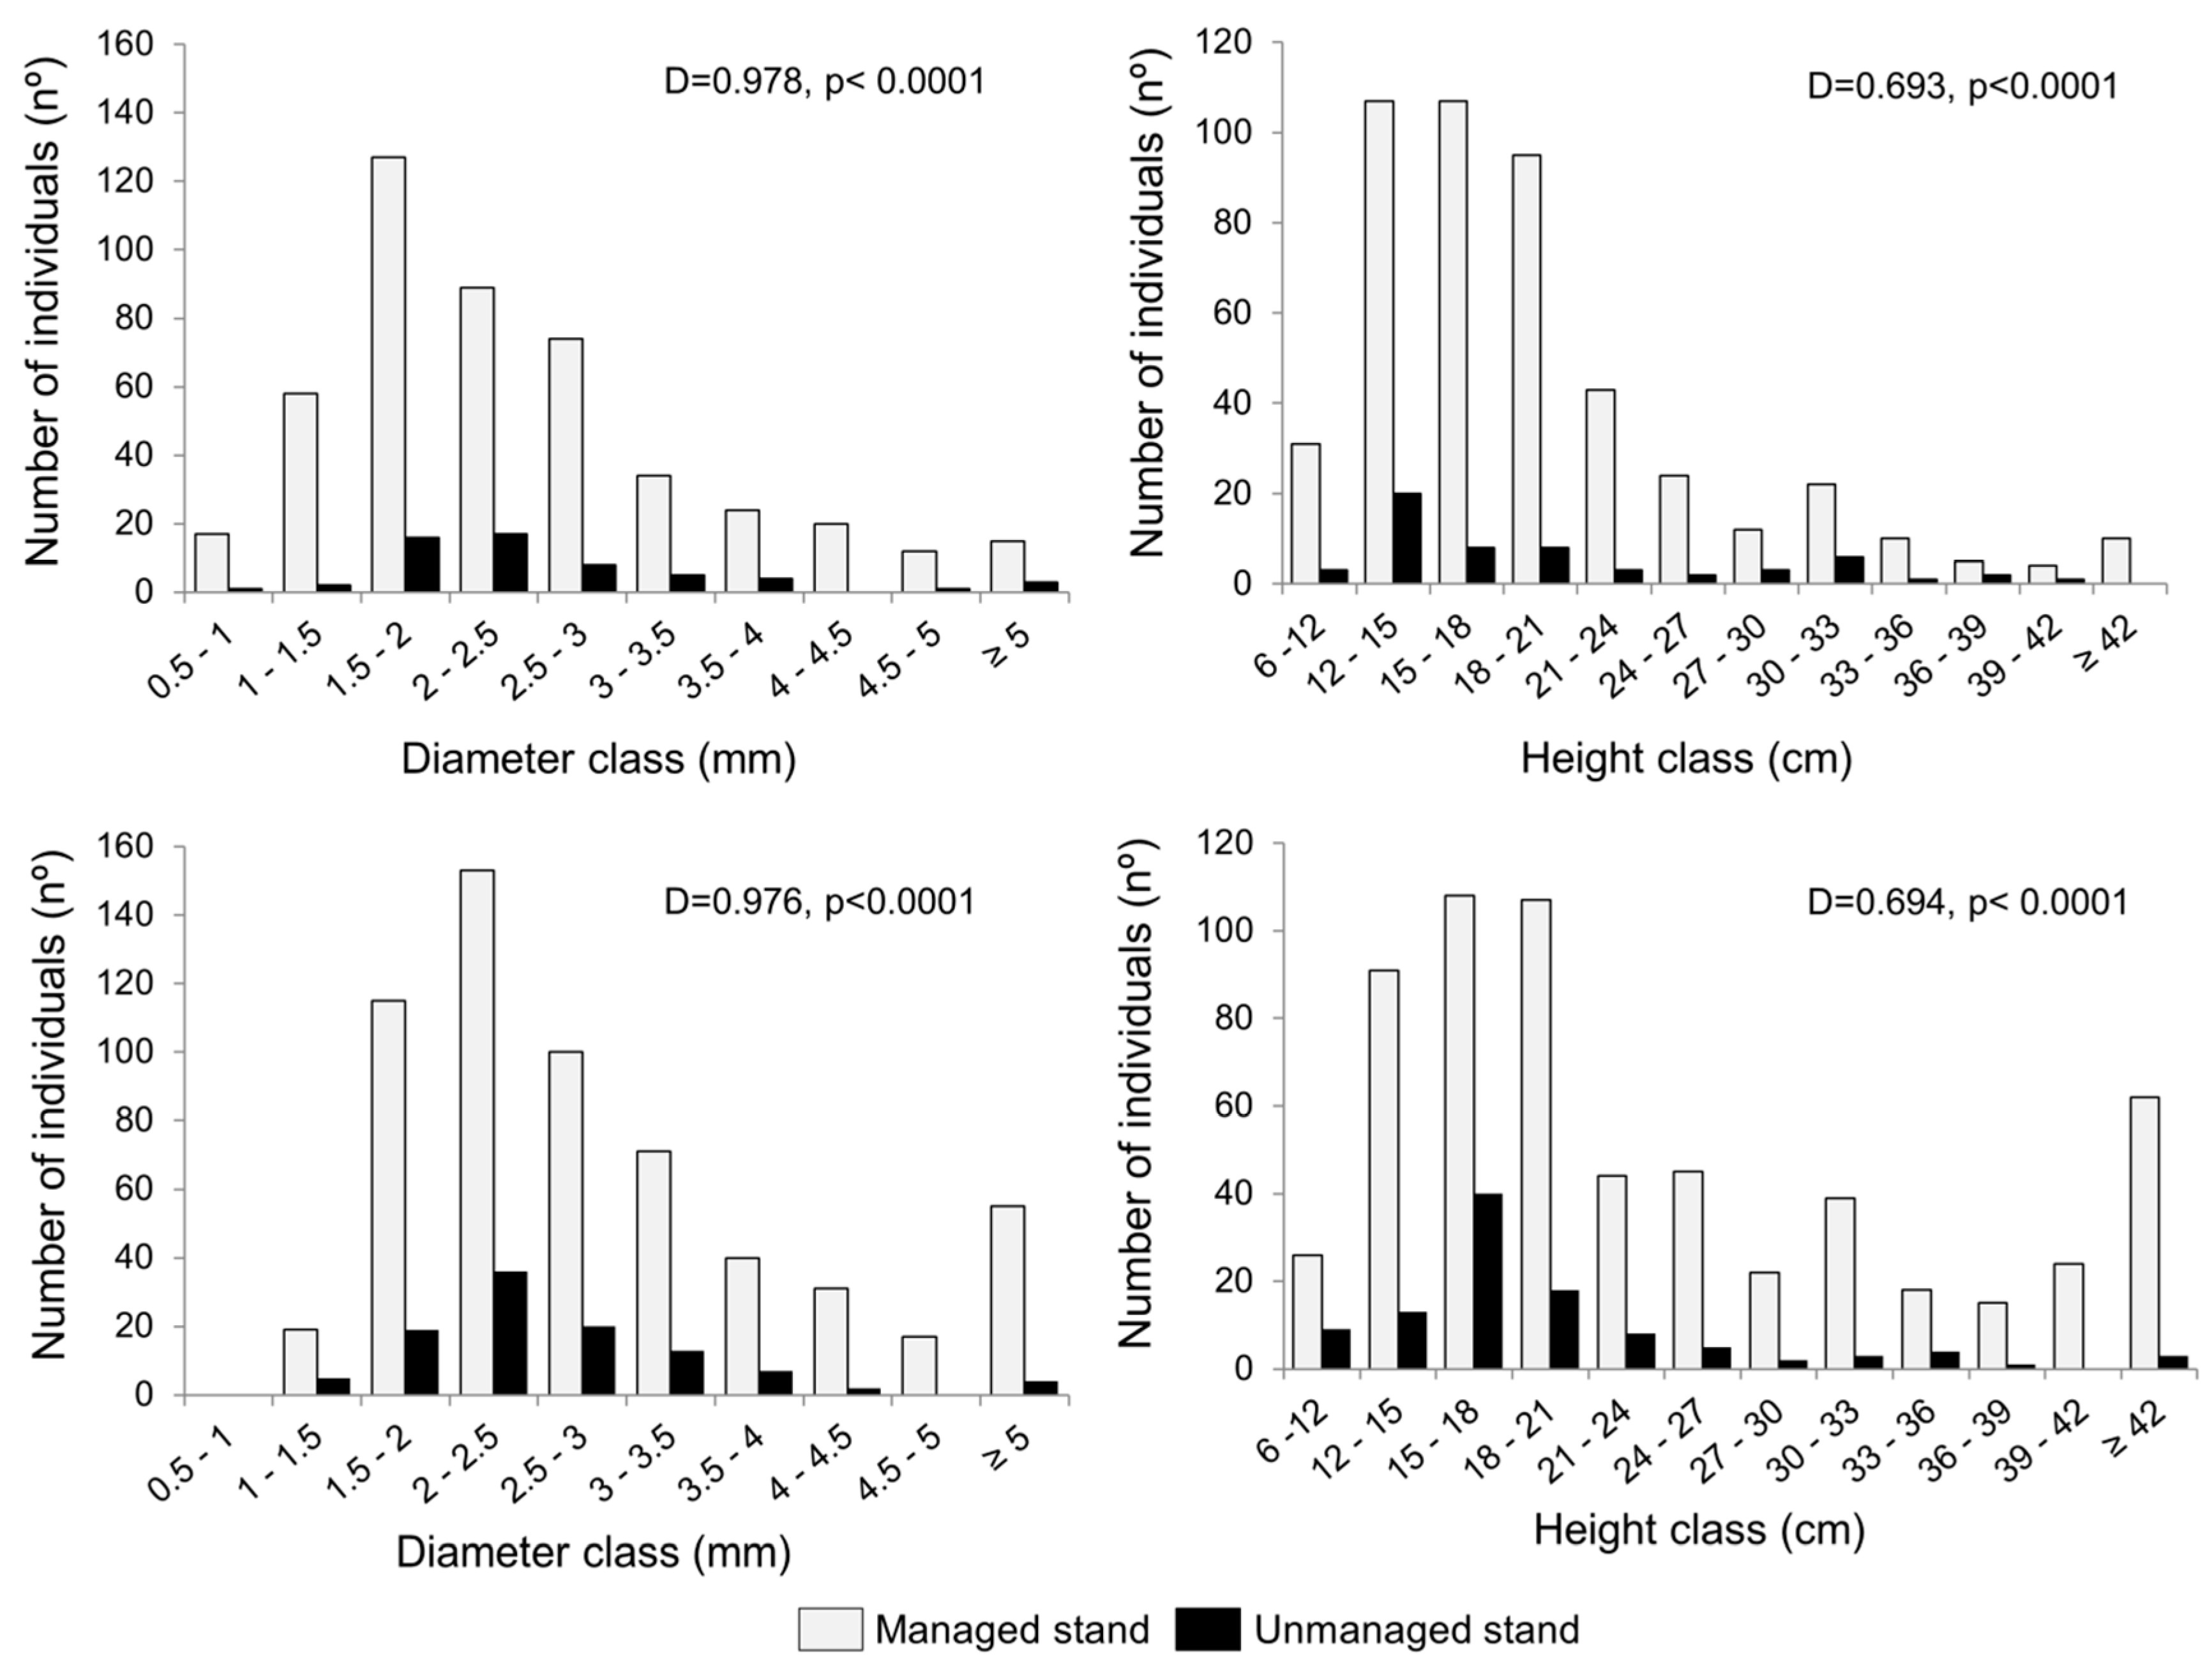
3.1. Copaifera Regeneration

The total numbers of Copaifera saplings and seedlings sampled in 2011 and 2013 were 533 and 707, respectively. The sampled environments (managed and unmanaged stands) differed in density (Table 2), with about 90% of the regeneration observed in the managed stands in both 2011 and 2013. Mortality and recruitment rates did not differ significantly between managed and unmanaged stands (Table 2), although the recruitment rate was lower in unmanaged than in managed stands.
The managed stands had higher values of average growth Ht and DGH monthly (Table 2). Distributions of Ht and DGH were positively skewed and significantly differed when compared across managed and unmanaged stands (Figure 2). Copaifera saplings greater than one meter in height were found only in managed stands (Table 3; Figure 2) at a distance >21 m from the Copaifera tree.
In the Spearman correlation (ρ) analysis, for both periods and stands, we observed positive and significant correlations that ranged from moderate (0.40 to 0.69) to strong (0.70 to 0.89) (Table 3). This indicates that the Ht increases in the same proportion as the increase in Copaifera regeneration diameter (DGH) (Figure 2).

3.2. Spatial Distribution and Modeling of Mortality and Survival

Copaifera regeneration increased in the managed stands compared to the unmanaged stands (Table 2) after two years. In general, for both evaluation times and the two treatments, ~5% of Copaifera regeneration was observed 45–50 m from the Copaifera tree and ~73% of regeneration was concentrated less than 10 m radius from the Copaifera tree.
The logistic model fitted to predict the probability of mortality/survival Equation (5) of Copaifera regeneration in managed stands was:
C o p S u r v = 1 1 + e ( 1.647 + 0.235 D G H + 0.039 H t + 0.019 D i s t )
where CopSurv is the probability of Copaifera regeneration to survive in the stand; DGH (mm) of regeneration; Ht is the total height (cm) of regeneration; and Dist is the distance (m) between the regeneration and the Copaifera tree.
All coefficients were significant at the α = 0.10 critical value as judged by the Wald statistic [30] (Table 4). Diameter contributes most to a higher probability of survival and this probability also increases with higher height and higher distance (Equation (5), Table 4). In the managed stands, the mortality rate was 82% up to 10 m away from the Copaifera tree, but only 5.7% was observed at a distance of 40–50 m away from the Copaifera tree. Also, in the unmanaged stands, this same pattern of Copaifera regeneration concentrated near the Copaifera tree was observed (Table 2). In the regeneration model for unmanaged stands, all the coefficients were non-significant at the 0.1 level as judged by the Wald statistic [30] (Table 4).

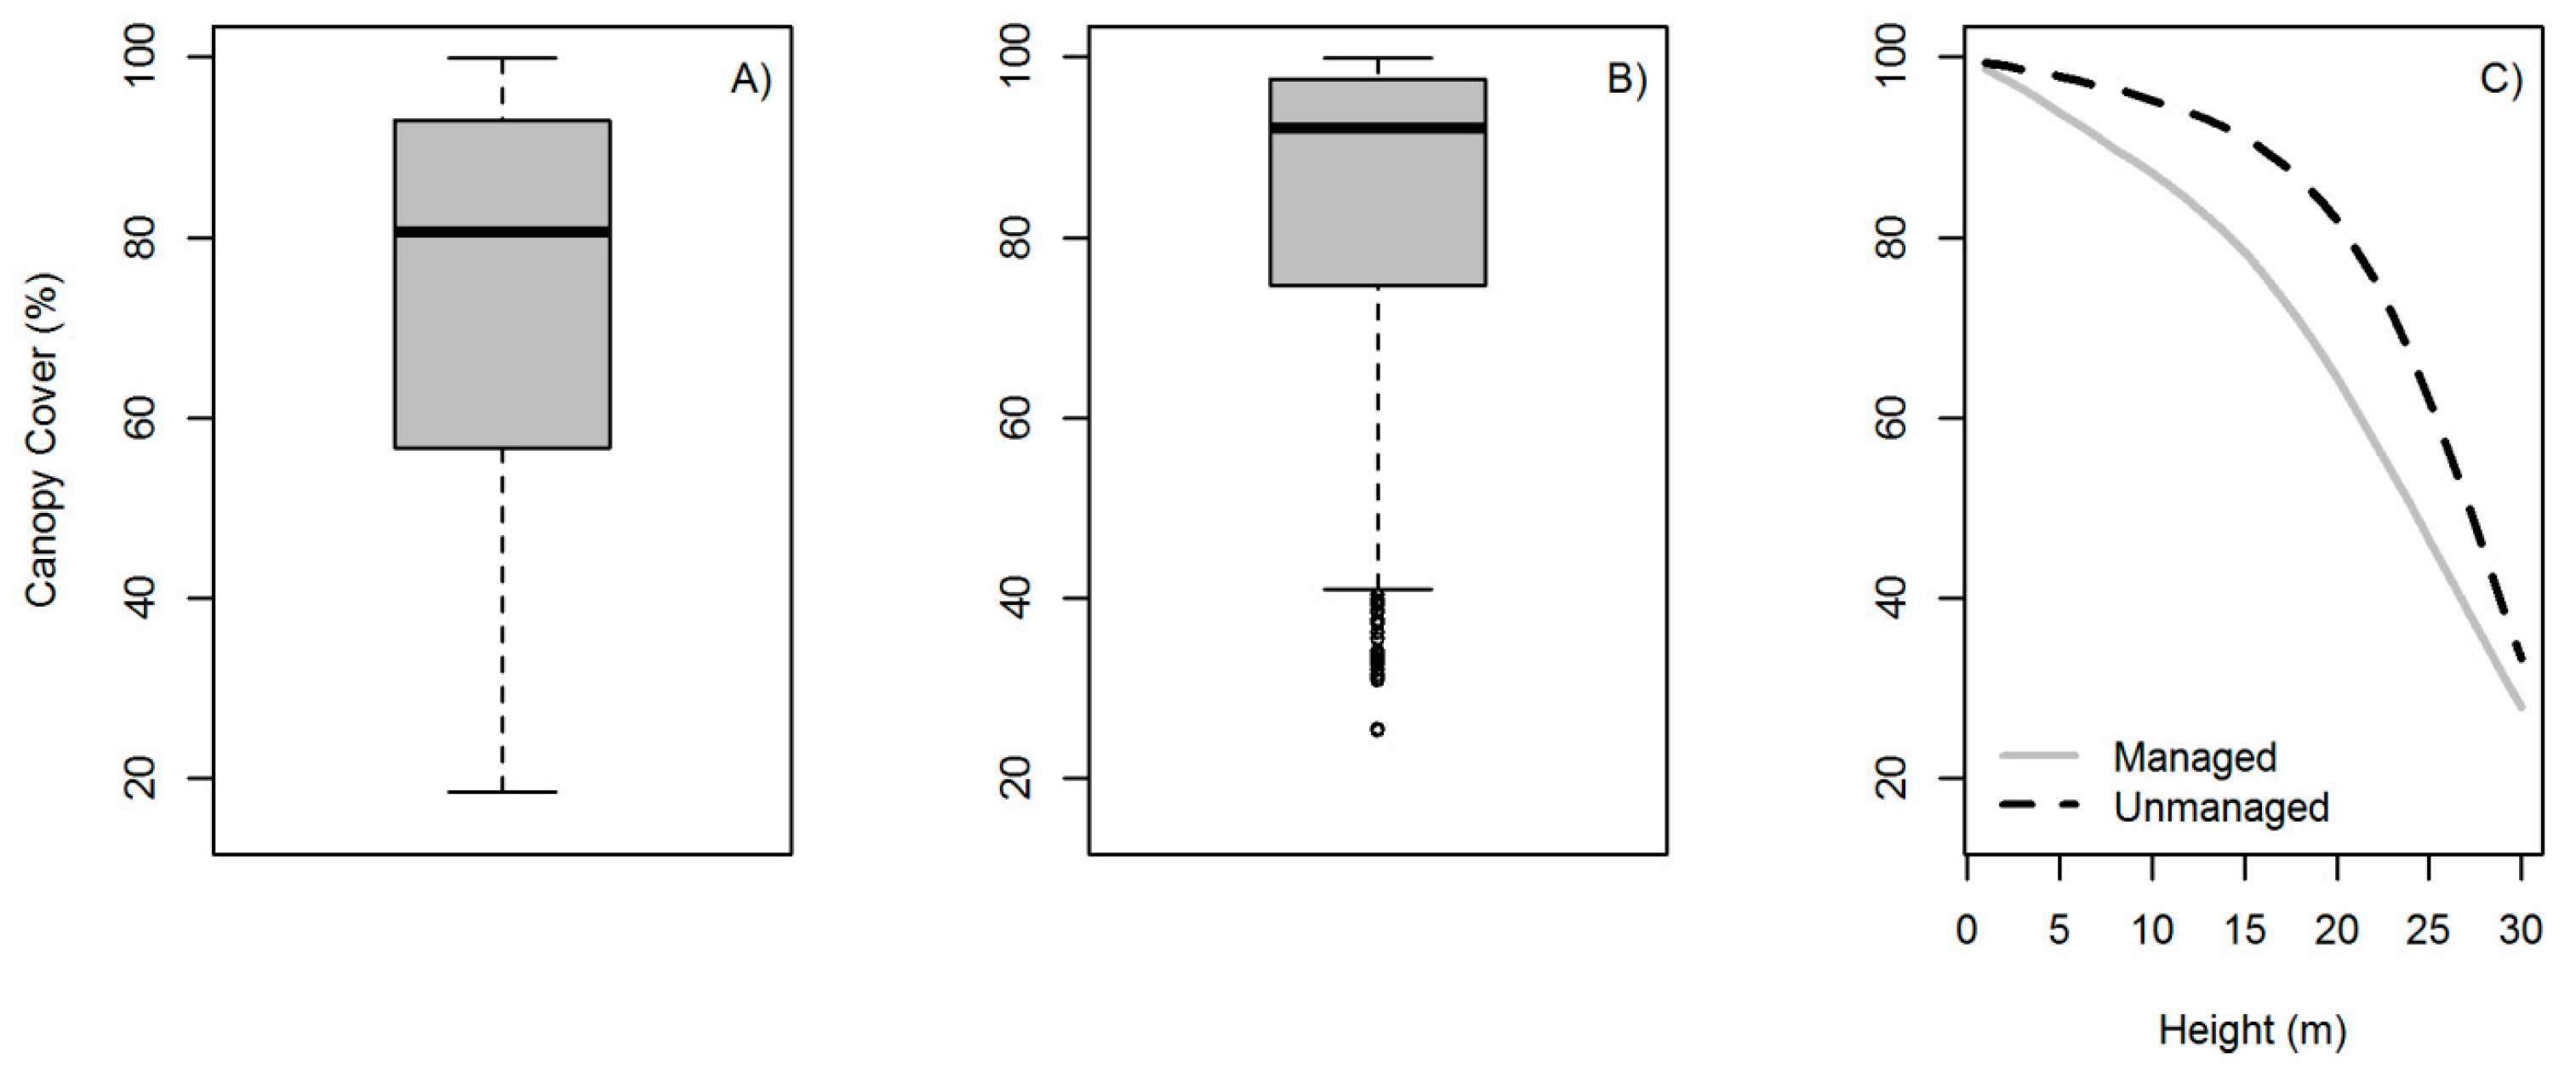
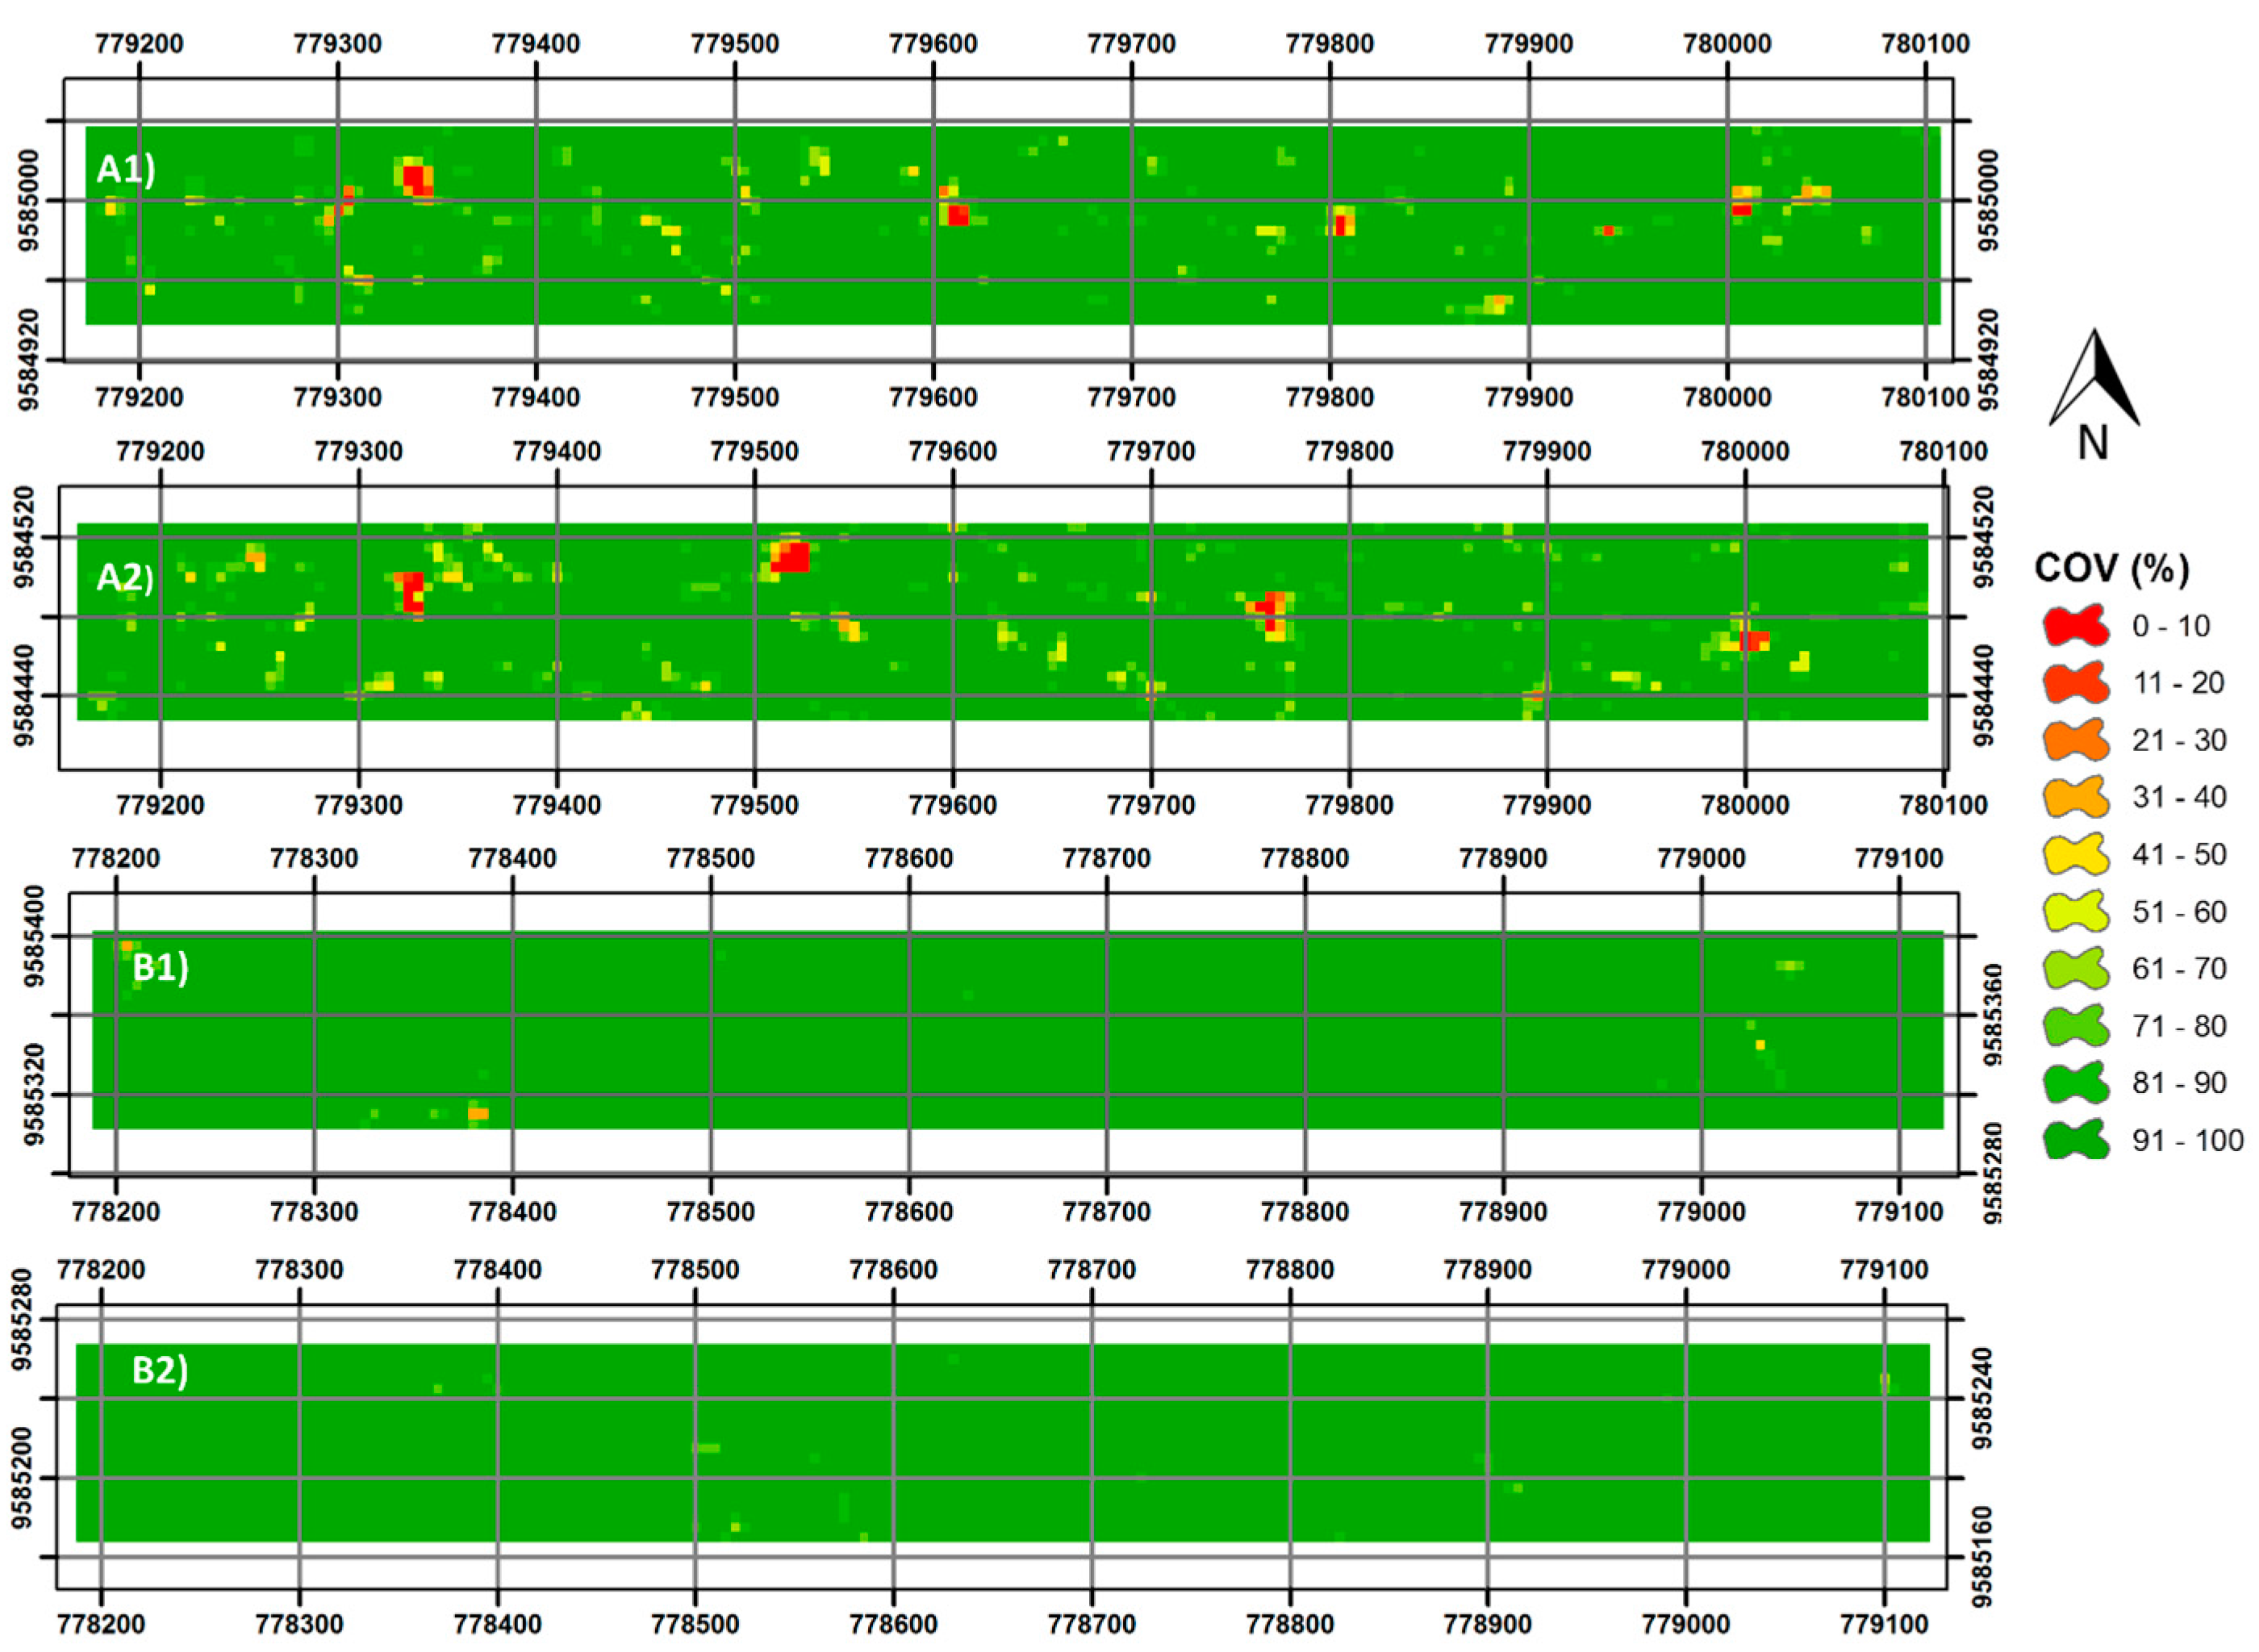
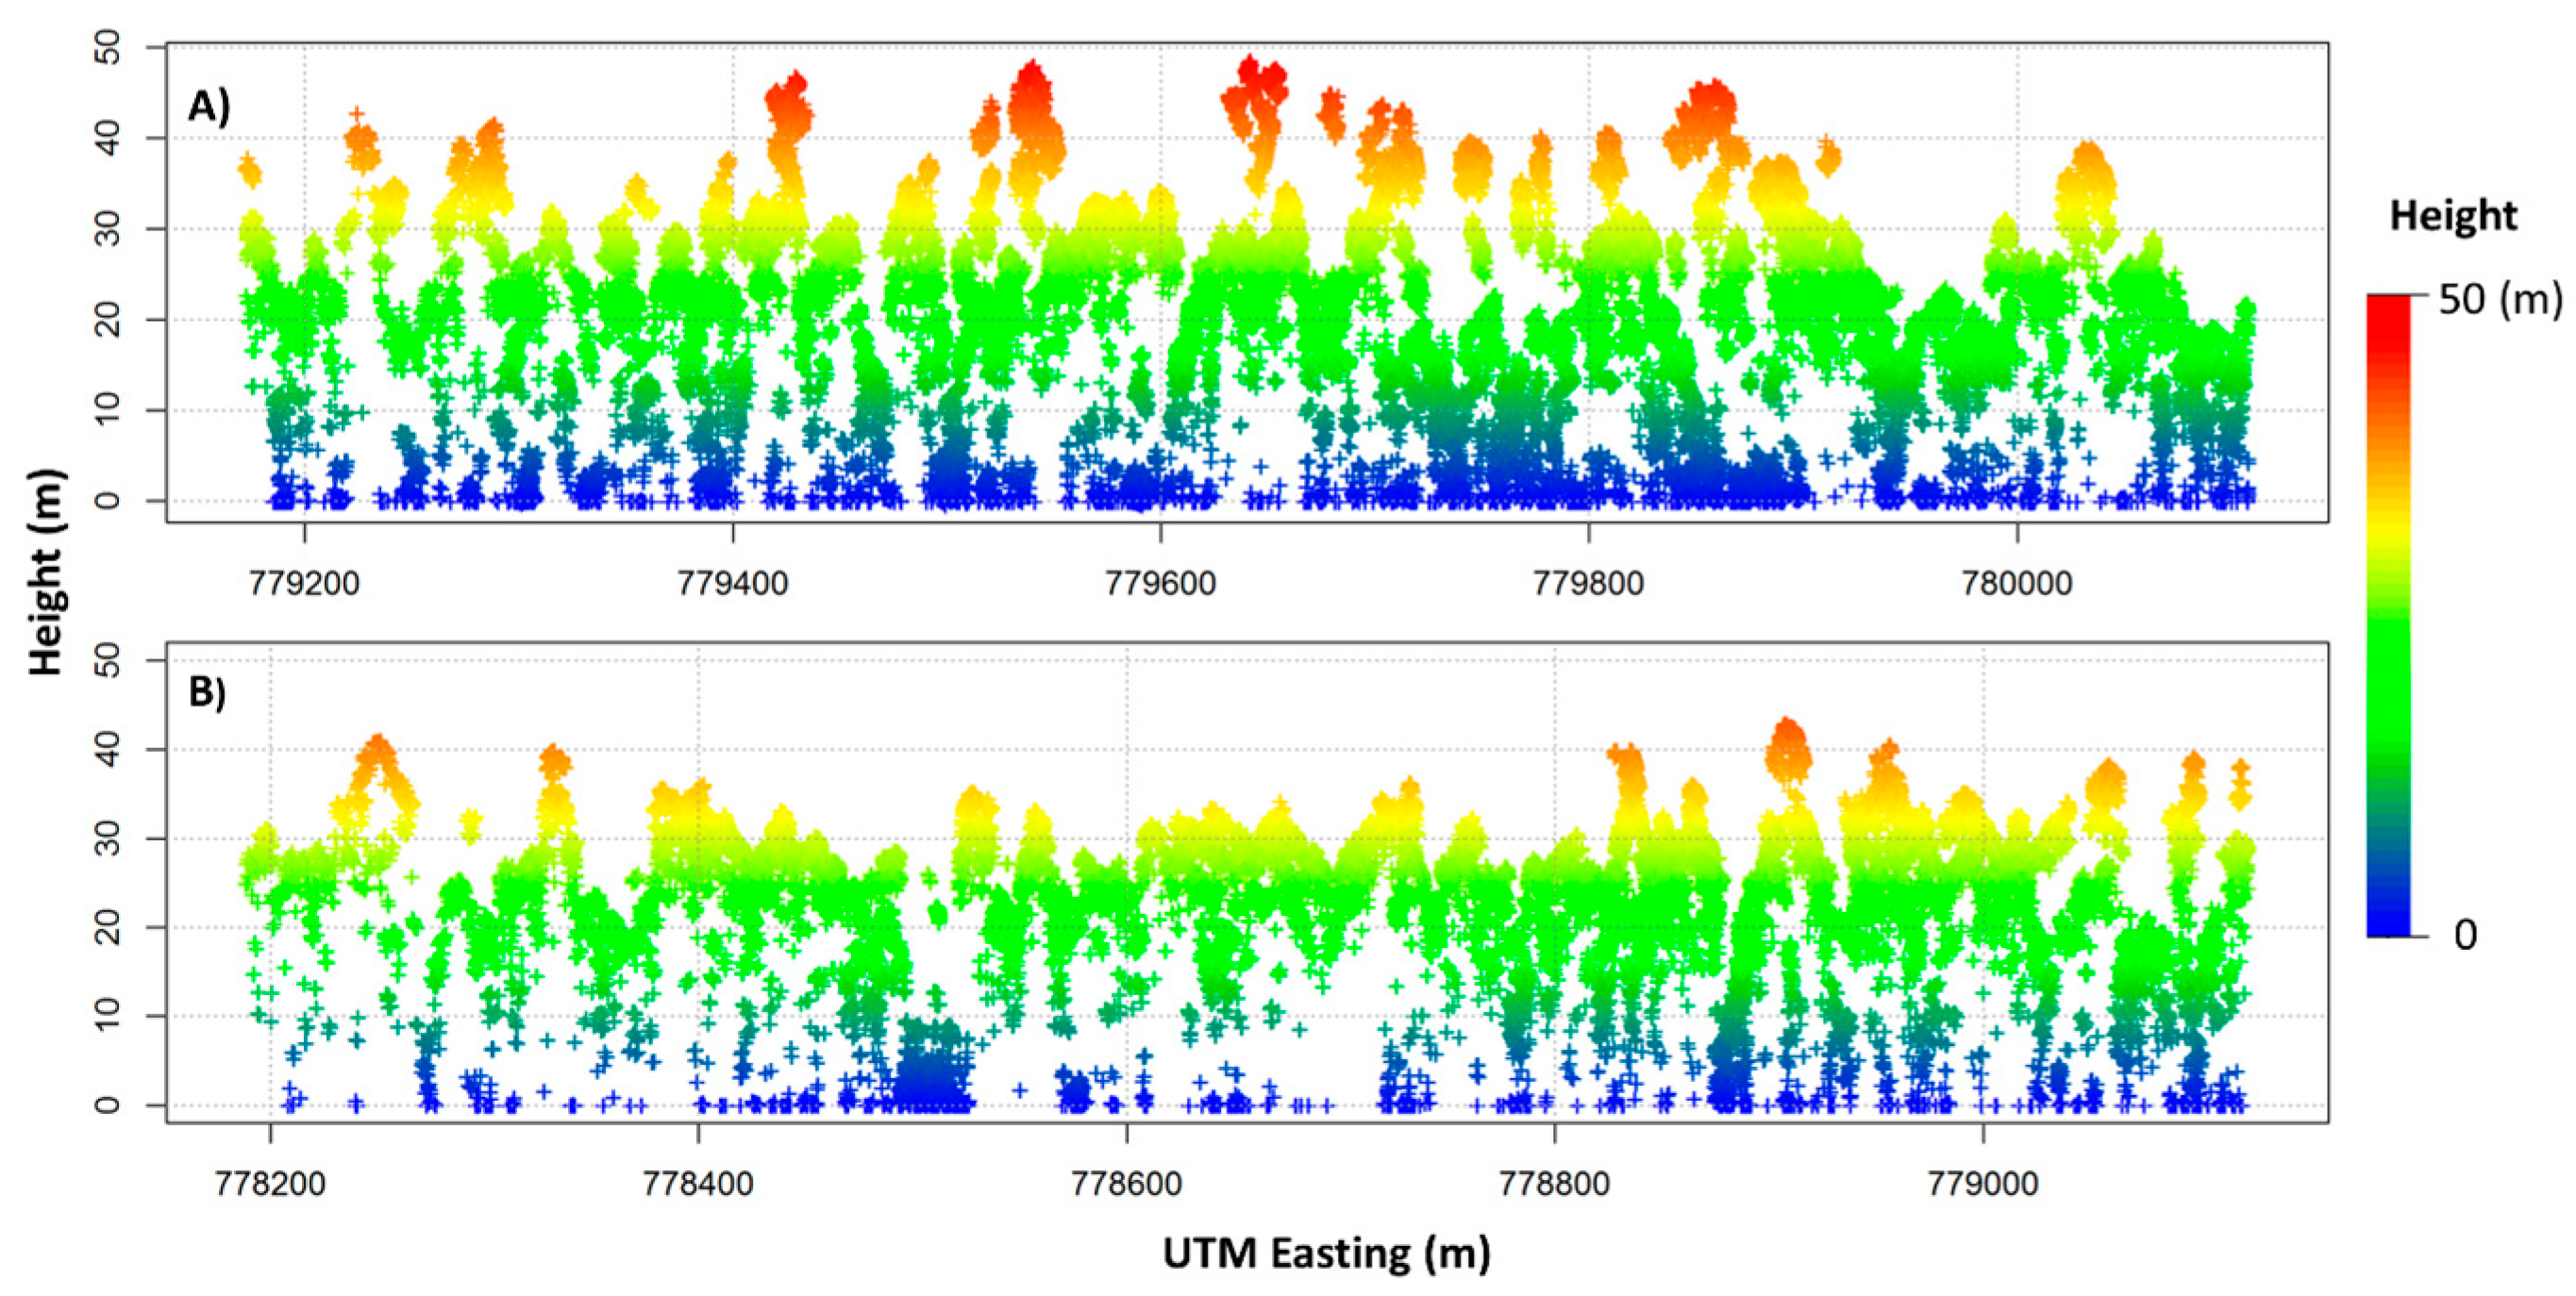
3.3. Forest Canopy Cover

The unmanaged stands showed higher COV values than the managed stands (Figure 3A,B). Average COV considering all selected height breaks were 83.31% and 73.86% for the unmanaged and managed stands, respectively. The COV was differentiated into height breaks at unmanaged and managed stands, with the largest difference found in heights ranging from 5 to 25 m (Figure 3C and Figure 4 and Figure 5).

4. Discussion

4.1. Effects of Reduced-Impact Logging on Population Dynamics of Copaifera

Diameter and height growth rates of Copaifera saplings and seedlings, based on two years of monitoring, were higher in managed than unmanaged stands (Table 2). Saplings with height above 1 m were found just in managed stands (Table 1). Likewise, the density of regenerating Copaifera was higher in managed stands in both 2011 and 2013. However, mortality and survival probability in Copaifera regeneration did not differ between managed and unmanaged stands. Therefore, gaps formed by timber management activities appear not to affect mortality or survival rates, but rather the population structure (diameter and height). Total height, DGH and distance from the mother's tree were significant in managed stands.
Diameter and height growth were highly variable and may be associated with genetic factors and environmental conditions (light, dry weather, and soil fertility) [38]. The growth rate and density of regeneration is likely related to mortality (predation and competition), wherein increased mortality may be attributed to other factors, such as increased competition for water and nutrients over time, or the occupation of the area by invasive or pioneer plants [39]. Additionally, variations in recruitment rate may be related to the quantity and viability of fruits and seeds produced by the mother tree [39]. An increasing Copaifera regeneration rate in the second assessment, as was also observed by [40] over the same two years survey interval, may be related to an additional factor: the seed germination process, which occurred when environment conditions (e.g., light and soil) were suitable. Flowering and fruiting may have been higher prior to the second evaluation than prior to the first assessment, resulting in increased density of recruits. However, we observed flowering and fruiting just during the first assessment. The time of flowering and fruiting of C. reticulata and C. duckei occurring in this area is unknown. These phenological processes could vary from annually, biannually or longer for Copaifera spp. [41,42], as observed in many tropical species [11]. It would take a longer period of observation to verify the timing of these phenological processes and the intensity of viable seed production.
Several factors interact and can contribute to variation in population dynamics. In our study area, the size and quantity of gaps is closely linked to the number and size of Copaifera recruits, which were larger in managed stands. Copaifera are heliophilic species that are not shade-tolerant but respond to higher light availability in small clearings for its development [40] and can survive for long periods in a suppressed state [43]. Higher diameter and height growth was also observed by Elias [43] for Copaifera multijuga in areas with more light (Figure 3 and Figure 4), although the author also observed a lower survival rate of C. multijuga in areas with greater light availability (i.e., grassland). In the study area, clearings in managed stands possibly were formed by skid trails and by the felling of other trees during commercial tree harvest operations (Figure 4). In Figure 5, we can observe a larger number of returns derived from LiDAR penetrating the canopy and reaching the ground of forest in the managed stands. Clearings allow greater sunlight penetration to stimulate regeneration. The minimum incident radiation (0.2 to 6.5%), which usually occurs in forests with denser canopy, can be enough to cause micro-climatic changes and influence tree recruitment and growth [44], regardless of the environmental group or genetic factors of the species concerned [45].

4.2. Effects of Reduced-Impact Logging on Diameter Distribution of Copaifera

Our findings indicate that there is considerable variation in diameter distributions of Copaifera regeneration depending on stand management and on time period (2011 and 2013). The shape of the diameter distribution of regeneration was not negative exponential (i.e., inverted J). Negative exponential diameter and height distributions for Copaifera regeneration were observed by Resende [12] and Rigamonti-Azevedo [46], unlike our results (Table 4). Resende et al. [12] observed a change in distributional shape over a three year observation period, wherein the number of regenerating Copaifera in smaller diameter classes decreased, but increased in the largest diameter class. However, we observed Copaifera regeneration presence in all diameter classes and an increasing number of recruits in the larger classes of managed stands, in contrast with unmanaged stands. Probably, the more open canopy in managed stands favored the germination, growth and development of the regeneration of Copaifera. Diameter distributions that are not negative exponential, as in both the managed and unmanaged stands, can be attributed to many self-regenerating populations [47] and shade tolerant species [39]. Longer term monitoring will be necessary to check if the number of recruits will decrease in smaller size classes and increase in larger size classes. If greater development of Copaifera in managed stands were observed over the longer term, forest management interventions to facilitate the entry of light near Copaifera trees could be an alternative to benefit Copaifera regeneration. Freitas and Oliveira [48] evaluated the cycle of C. langdorffii and verified that 16 reproductive events were needed to produce another tree, which in addition to unsustainable forestry and climatic changes, could lead to Copaifera population reductions in natural forests.

4.3. Effects of Reduced-Impact Logging on Spatial Distribution of Copaifera

The distance of saplings and seedlings from Copaifera trees was significant in relation to mortality and survival probability, which is related to the type of spatial distribution. The spatial distribution observed was aggregate, where the greater part of the regeneration is concentrated around the Copaifera. Aggregate spatial distribution observed in regenerating Copaifera has been also reported by Resende et al. [13] and Herrero-Jáuregui et al. [8]. The barochory dispersion, predominant for Copaifera [40], and the average rate of germination (80%) [41,49] favor the occupation of the space near Copaifera tree by saplings and seedlings. However, regeneration near the mother tree is most affected by herbivory, competition and predation [50,51], so these processes result in few individuals reaching adulthood. Higher rates of abundance, mortality and recruitment were observed near the Copaifera trees, decreasing with increasing distance, as proposed by the theory of Janzen [50]. The distance from the Copaifera tree as well as availability of resource and specific microclimatic conditions from gap formation also influence dispersion patterns [52]. In this study area, the taller Copaifera saplings were observed at distances of 20–50 m from the mother tree, where saplings could have benefited from low competitive influence and consequently had higher growth rates than at other distances, a response also seen for other tropical tree species in canopy gaps [53,54,55].

5. Conclusions

In this study, we demonstrated that RIL timber management appears to not negatively impact, at least in the short term, the regeneration dynamics of Copaifera spp., with recruitment and growth rates favored by the opening of the forest canopy to more light. Moreover, this was the first study to evaluate the impact of RIL on Copaifera regeneration dynamics in tropical forest. There is a need for longer-term studies to confirm the results reported in this study. Further study is also needed to assess the impact of timber and non-timber management (oil resin extraction) on phenological (flowering/fruiting) and reproductive processes, as well as population dynamics (germination, growth, mortality, and recruitment), as a way to support the management and conservation of forest environments and Copaifera species, in particular.

Acknowledgments

We thank the Tropical Forest Institute (Instituto Floresta Tropical—IFT) for fieldwork support, in particular: Iran Pires, Newton Dutra, Paulo Bittencourt, Zenilton Borba, Alfredo, Miúdo and Filho. LiDAR data were acquired by the Sustainable Landscapes Brazil Project supported in Brazil by EMBRAPA and the U.S. Forest Service, the U.S. Agency for International Development (US-AID) and the U.S. State Department. This study was funded by the Foundation Support Research for State of São Paulo (FAPESP), Process No 2010/16525-7. Manuela Oliveira was partially supported by the Fundação para a Ciência e a Tecnologia through the project UID/MAT/04674/2013 (CIMA) (Centro de Investigação em Matemática e Aplicações) and project UID/MAT/00297/2013 (Centro de Matemática e Aplicações). Also, she has received funding from the European Union’s H2020 research and innovation program under the Marie Sklodowska-Curie grant agreement N°. 691149.

Author Contributions

All the authors have made substantial contribution towards the successful completion of this manuscript. They all have been involved in designing the study, drafting the manuscript and engaging in critical discussion. C.K., E.V., C.A.S. and A.T.H., contributed with the methodological framework, data processing analysis and write up. M.O. and P.H. contributed to the interpretation, quality control and revisions of the manuscript. All authors read and approved the final manuscript.

Conflicts of Interest

The authors declare no conflict of interest.

References

  1. Zeppel, H. Indigenous Ecotourism: Sustainable Development and Management; Ecotourism Series No. 3; CABI: London, UK, 2006; 295p. [Google Scholar]
  2. Instituto Brasileiro de Geografia e Estatística (IBGE). Estudos e Pesquisas Informação Geográfica Número 9; Instituto Brasileiro de Geografia e Estatística: Rio de Janeiro, Brazil, 2012; 350p. Available online: http://geoftp.ibge.gov.br/documentos/recursos_naturais/indicadores_desenvolvimento_sustentavel/2012/ids2012.pdf (accessed on 18 February 2015).
  3. Laurance, W.F.; Ferreira, L.V.; Merona, J.M.R.; Laurance, S.G. Rain forest fragmentation and the dynamics of Amazonian tree communities. Ecology 1998, 79, 2032–2040. [Google Scholar] [CrossRef]
  4. Broadbent, E.N.; Asner, G.P.; Keller, M.; Knapp, D.E.; Oliveira, P.J.C.; Silva, J.N. Forest fragmentation and edge effects from deforestation and selective logging in the Brazilian Amazon. Biol. Conserv. 2008, 141, 1745–1757. [Google Scholar] [CrossRef]
  5. Lavinsky, A.O.; Sant’Ana, C.S.; Mielke, M.S.; Almeida, A.A.F.; Gomes, F.P.; França, S.; Silva, D.C. Effects of light availability and soil flooding on growth and photosynthetic characteristics of Genipa americana L. seedlings. New For. 2007, 34, 41–50. [Google Scholar] [CrossRef]
  6. Souza, V.C.; Lorenzi, H. Botânica Sistemática: Guia Ilustrado Para Identificação das Famílias Nativas e Exóticas no Brasil, Baseado em APG II, 2nd ed.; Instituto Plantarum: Nova Odessa, São Paul, 2008; 640p. [Google Scholar]
  7. Veiga Junior, V.F.; Pinto, A.C. The Copaifera L. genus. Quím. Nova 2002, 25, 273–286. [Google Scholar] [CrossRef]
  8. Herrero-Jáuregui, C.; Sist, P.; Casado, M.A. Population structure of two low-density neotropical tree species under different management systems. For. Ecol. Manag. 2012, 280, 31–39. [Google Scholar] [CrossRef]
  9. Newton, P.; Peres, C.A.; Desmoulière, S.J.M.; Watkinson, A.R. Cross-scale variation in the density and spatial distribution of an Amazonian non-timber forest resource. For. Ecol. Manag. 2012, 276, 41–51. [Google Scholar] [CrossRef]
  10. Hubbell, S.P.; Foster, R.B. Biology, chance and the history and structure of tropical rain Forest tree communities. In Community Ecology; Diamond, J.M., Case, T.J., Eds.; Harper and Row: New York, NY, USA, 1986; 329p. [Google Scholar]
  11. Leite, A.M.C.; Salomão, A.N. Estrutura populacional de copaíba (Copaifera langsdorffii Desf.) em mata ciliar do Distrito Federal. Acta Amazon. Bras. 1992, 6, 123–134. [Google Scholar] [CrossRef]
  12. Resende, J.C.F.; Klink, C.A.; Schiavini, I. Spatial heterogeneity and its influence on Copaifera langsdorffii Desf. (Caesalpiniaceae). Braz. Arch. Biol. Technol. 2003, 46, 405–414. [Google Scholar] [CrossRef]
  13. Gavin, D.G.; Peart, D.R. Spatial structure and regeneration of Tretamerista glabra in peat swamp rain forest in Indonesian Borneo. Plant Ecol. 1997, 131, 223–231. [Google Scholar] [CrossRef]
  14. Jakovac, A.; Bentos, T.V.; Mesquita, R.C.G.; Williamson, G.B. Age and light effects on seedling growth in two alternative secondary successions in central Amazonia. Plant Ecol. Divers. 2014, 7, 349–358. [Google Scholar] [CrossRef]
  15. Verissimo, A.; Barreto, P.; Mattos, M.; Tarifa, R.; Uhl, C. Logging impacts and prospects for sustainable forest management in an old Amazonian frontier: The case of Paragominas. For. Ecol. Manag. 1992, 55, 169–199. [Google Scholar] [CrossRef]
  16. Fredericksen, T.S.; Mostacedo, B. Regeneration of timber species following selection logging in a Bolivian tropical dry forest. For. Ecol. Manag. 2000, 131, 47–55. [Google Scholar] [CrossRef]
  17. Macpherson, A.J.; Schulze, M.D.; Carter, D.R.; Vidal, E. A model for comparing reduced impact logging with conventional logging for an Eastern Amazonian Forest. For. Ecol. Manag. 2010, 250, 2002–2011. [Google Scholar] [CrossRef]
  18. Holmes, T.P.; Blate, G.M.; Zweede, J.C.; Pereira, R., Jr.; Barreto, P.; Boltz, F.; Bauch, R. Financial and ecological indicators of reduced impact logging performance in the eastern Amazon. For. Ecol. Manag. 2002, 163, 93–110. [Google Scholar] [CrossRef]
  19. Wright, S.J. Plant diversity in tropical forests: A review of mechanisms of species coexistence. Oecologia 2002, 130, 1–14. [Google Scholar] [CrossRef] [PubMed]
  20. Schwartz, G.; Falkowski, V.; Peña-Claros, M. Natural regeneration of tree species in the Eastern Amazon: Short-term responses after reduced-impact logging. For. Ecol. Manag. 2017, 385, 97–103. [Google Scholar] [CrossRef]
  21. Alencar, J.C. Estudos silviculturais de uma população natural de Copaifera multijulga Hayne–Leguminosae, na Amazônia Central. 1—Germinação. Acta Amazon. 1981, 11, 3–11. [Google Scholar] [CrossRef]
  22. Hosokawa, R.T.; Moura, J.B.; Cunha, U.S. Introdução ao Manejo e Economia de Florestas; Universidade Federal do Paraná: Curitiba, Paraná, 1998; 162p. [Google Scholar]
  23. Oliveira, R.E.; Engel, V.L. A restauração ecológica em destaque: Um retrato dos últimos vinte e oito anos de publicações na área. Oecol. Aust. 2011, 15, 303–315. [Google Scholar] [CrossRef]
  24. Schwartz, G.; Peña-Claros, M.; Lopes, J.C.A.; Mohren, G.M.J.; Kanashiro, M. Mid-term effects of reduced-impact logging on the regeneration of seven tree commercial species in the Eastern Amazon. For. Ecol. Manag. 2012, 274, 116–125. [Google Scholar] [CrossRef]
  25. RADAMBRASIL. Projeto RADAMBRASIL: 1973–1983, Levantamento de Recursos Naturais. v. 1–23; Departamento Nacional de Produção Mineral, Ministério das Minas e Energia: Rio de Janeiro, Brazil, 1983; 367p. [Google Scholar]
  26. Instituto Brasileiro de Geografia e Estatística (IBGE). Manual Técnico da Vegetação Brasileira; Instituto Brasileiro de Geografia e Estatística: Rio de Janeiro, Brazil, 2012; 275p. [Google Scholar]
  27. Sheil, D.; May, R.M. Mortality and recruitment rate evaluations in heterogeneous tropical forests. J. Ecol. 1996, 84, 91–100. [Google Scholar] [CrossRef]
  28. Steel, R.G.D.; Torrie, J.H. Principles and Procedures of Statistics; McGraw Hill Book: New York, NY, USA, 1980; p. 633. [Google Scholar]
  29. Hollander, M.; Wolfe, D.A. Nonparametric Statistical Methods, 2nd ed.; John Wiley & Sons: New York, NY, USA, 1999; 787p. [Google Scholar]
  30. Hosmer, D.W.; Lemeshow, S. Applied Logistic Regres­sion, 2nd ed.; Wiley Series in Probability and Mathematical Statistics: New York, NY, USA, 2000; p. 307. [Google Scholar]
  31. Monserud, R.A.; Sterba, H. Modeling individual tree mor­tality for Austrian forest species. For. Ecol. Manag. 1999, 113, 109–123. [Google Scholar] [CrossRef]
  32. Mendenhall, W.; Scheaffer, R. Mathematical Statistics with Applications; Duxbury Press: Scituate, MA, USA, 1973. [Google Scholar]
  33. R Development Core Team. R: A Language and Environment for Statistical Computing; R Foundation for Statistical Computing: Vienna, Austria, 2016; Available online: http://www.R-project.org (accessed on 15 October 2016).
  34. Hudak, A.T.; Evans, J.S.; Smith, A.M.S. Review: LiDAR Utility for Natural Resource Managers. Remote Sens. 2009, 1, 934–951. [Google Scholar] [CrossRef]
  35. Silva, C.A.; Klauberg, C.; Hudak, A.T.; Carvalho, S.P.; Rodriguez, L.C.E. Mapping aboveground carbon stocks using LiDAR data in Eucalyptus spp. plantations in the state of São Paulo, Brazil. Sci. For. 2014, 42, 591–604. [Google Scholar]
  36. Silva, C.A.; Klauberg, C.; Hudak, A.T.; Vierling, L.A.; Liesenberg, V.; Carvalho, S.P.; Rodriguez, L.C. A principal component approach for predicting the stem volume in Eucalyptus plantations in Brazil using airborne Lidar data. Forestry 2016, 1–12. [Google Scholar] [CrossRef]
  37. McGaughey, R.J. FUSION/LDV3.42: Software for LiDAR Data Analysis and Visualization; USDA, Forest Service Pacific Northwest Research Station: Seattle, WA, USA, 2015; 150p. Available online: http://http://forsys.cfr.washington.edu/fusion/ FUSION_manual.pdf (accessed on 20 May 2014).
  38. Swaine, M.D.; Hall, J.B.; Alexander, L.J. Tree population dynamics at Kade, Ghana. J. Trop. Ecol. 1987, 3, 331–345. [Google Scholar] [CrossRef]
  39. Wright, S.J.; Muller-Landau, H.C.; Condit, R.; Hubbell, S.P. Gap-dependent recruitment, realized vital rates, and size distributions of tropical trees. Ecology 2003, 84, 3174–3185. [Google Scholar] [CrossRef]
  40. Alencar, J.C. Estudos silviculturais de uma população natural de Copaifera multijulga Hayne–Leguminosae, na Amazônia Central. 3—Distribuição espacial da regeneração natural pré-existente. Acta Amazon. 1984, 14, 225–279. [Google Scholar] [CrossRef]
  41. Alencar, J.C.; Almeida, R.A.; Fernandes, N.P. Fenologia de espécies florestais em floresta tropical úmida de terra firme na Amazônia Central. Acta Amazon. 1979, 9, 163–198. [Google Scholar] [CrossRef]
  42. Pedroni, F.; Sanchez, M.; Santos, F.A.M. Fenologia da copaíba (Copaifera langsdorffii Desf.—Leguminosae, Caesalpinioideae) em uma floresta semidecídua no sudeste do Brasil. Rev. Bras. Bot. 2002, 25, 183–194. [Google Scholar] [CrossRef]
  43. Elias, M.E.A. Estabelecimento de Plântulas de Copaifera Multijuga Hayne—(Caesalpiniaceae) em Fragmentos Florestais e Estádios de Sucessão. Master’s Thesis, National Institute for Amazonian Research, Manaus, Brazil, 1997. [Google Scholar]
  44. Montgomery, R.A.; Chazdon, R.L. Light gradient partitioning by tropical seedlings in the absence of canopy gaps. Oecologia 2002, 131, 165–174. [Google Scholar] [CrossRef] [PubMed]
  45. Costa, D.H.M.; Silva, J.N.M.; Carvalho, J.O.P. Crescimento de árvores em uma área de terra firme na Floresta Nacional do Tapajós após a colheita de madeira. Rev. Cienc. Agrar. 2008, 50, 63–76. [Google Scholar]
  46. Rigamonte-Azevedo, O.C.; Wadt, P.G.S.; Wadt, L.H.O. Copaíba: Ecologia e Produção de óleo-resina, 1st ed.; (Documentos 91); Embrapa Acre: Rio Branco, Brazil, 2004; p. 28. [Google Scholar]
  47. Rubin, B.D.; Manion, P.D.; Faber-Langendoen, D. Diameter distributions and structural sustainability in forests. For. Ecol. Manag. 2006, 222, 427–438. [Google Scholar] [CrossRef]
  48. Freitas, C.V.; Oliveira, P.E. Biologia reprodutiva de Copaifera langsdorffii Desf. (Leguminosae, Caesalpinioedeae). Rev. Bras. Bot. 2002, 25, 311–321. [Google Scholar] [CrossRef]
  49. Garcia, L.C.; Lima, D. Comportamento de sementes de Copaifera multijuga durante o armazenamento. Acta Amazon. 2000, 30, 369–375. [Google Scholar] [CrossRef]
  50. Janzen, D.H. Herbivores and the number of tree species in tropical forests. Am. Nat. 1970, 104, 501–528. [Google Scholar] [CrossRef]
  51. Connell, J.H. On the role of natural enemies in prevent competitive exclusion in some marine animal and rainforest trees. In Dynamics of Populations, Proceedings of the Advanced Study Institute on Dynamics of Numbers in Populations; den Boer, K.A., Gradwell, G.R., Eds.; PUDOC: Wageningen, The Netherlands, 1971; pp. 298–312. [Google Scholar]
  52. Condit, R.; Ashton, P.; Baker, P. Spatial patterns in the distribution of tropical tree species. Science 2000, 288, 1414–1418. [Google Scholar] [CrossRef] [PubMed]
  53. Denslow, J.S. Tropical rainforest gaps and tree species diversity. Ann. Rev. Ecol. Syst. 1987, 18, 431–451. [Google Scholar] [CrossRef]
  54. De Steven, D. Tropical tree seedling dynamics: recruitment patterns and their population consequences for three canopy species in Panama. J. Trop. Ecol. 1994, 10, 369–383. [Google Scholar] [CrossRef]
  55. Forget, P.M. Spatial patterns of two rodent-dispersed rain forest trees Carapa procera (Meliaceae) and Vouacapoua americana (Caesalpiniaceae) at Paracou, French Guiana. Biotropica 1994, 26, 408–419. [Google Scholar] [CrossRef]
Figure 1. Location of the forested area of the Tropical Forest Institute (Instituto Floresta Tropical—IFT) (C) in the municipality of Paragominas, Pará, Brazil (AC); 10 m wide, 100 m long transect (D) used to measure regenerating Copaifera spp. (saplings and seedlings) at unmanaged or managed stands by reduced impact logging (RIL). Note: The tree figure in the center of the transect indicates the Copaifera tree. Copaifera seedlings (E).
Forests 08 00257 g001
Figure 2. Number of regenerating Copaifera (saplings and seedlings) in relation to the diameter at ground height class (left) or total height class (right) in both managed and unmanaged stands in 2011 (above) and 2013 (below). D = Kolgomorov-Smirnov adherence test statistic at 5% probability.
Forests 08 00257 g002
Figure 3. LiDAR-derived canopy cover for managed (A) and unmanaged (B) transects (n = 17) over study area. Canopy cover across forest crown cover compared between managed and unmanaged stands (C).
Forests 08 00257 g003
Figure 4. Maps of LiDAR-derived percent forest crown (FC) cover in two managed stand transects (A1,A2) and two unmanaged stand transects (B1,B2).
Forests 08 00257 g004
Figure 5. LiDAR point cloud profiles in managed (A) and unmanaged (B) stands within transects 935 m in length (UTM Easting) and subset of 2 m in width (UTM Northing) (LiDAR data acquired in 2012).
Forests 08 00257 g005
Table 1. Specifications of the LiDAR acquisition in the Instituto Floresta Tropical (IFT), Cauaxi Farm, in the municipality of Paragominas, Pará, Brazil.
FeaturesDatum
SensorOptech ALTM 3100
Date of acquisition27–29 July 2012
Maximum flight altitude (relative to ground)850 m
Maximum off-nadir scan angle11°
Pulse frequency100 kHz
Pulse density13.8 pulses·m−2
Table 2. Descriptive summary variables of Copaifera regeneration (seedlings/saplings) in transects (n = 38) established surrounding trees of Copaifera in stands managed by reduced impact logging (RIL) or unmanaged.
ClassesManaged StandUnmanaged Stand
Regeneration in 2011 (ind. ha−1)250.53 ** 130.00 ** 1
Regeneration in 2013 (ind. ha−1)316.32 *** 255.79 *** 2
Mortality rate (%·ano−1)32.02 n.s. 331.17 n.s. 3
Recruitment rate (%·ano−1)39.49 n.s. 413.67 n.s. 4
Average growth DGH (mm·month−1)0.049 (±0.640)0.029 (±0.241)
Maximum growth DGH (mm·month−1)0.2550.075
Average growth Ht (cm·month−1)0.640 (±0.532)0.241 (±0.200)
Maximum growth Ht (cm·month−1)3.9060.667
Significance: “n.s.”: p > 0.05; “**”: p < 0.01; “***”: p < 0.001; 1: W = 36; p = 0.0139; 2: W = 90; p = 0.0081; 3: W = 233; p = 0.1203; 4: W = 188; p = 0.8366; DGH = diameter at ground height; Ht = total height.
Table 3. Descriptive summary variables of Copaifera regeneration (saplings/seedlings) in transects (n = 38) established surrounding trees of Copaifera in a managed stand by reduced impact logging (RIL) or an unmanaged stand.
ClassesManaged StandUnmanaged Stand
Regeneration—2011
Average DGH (mm)2.50 (±1.40)2.50 (±1.05)
Maximum DGH (mm)20.406.20
Average Ht (cm)19.50 (±11.31)19.30 (±7.90)
Maximum Ht (cm)180.0040.00
Spearman correlation (ρ)0.685 *0.731 *
Regeneration—2013
Average DGH (mm)3.00 (±1.70)2.60 (±1.15)
Maximum DGH (mm)21.109.10
Average Ht (cm)25.40 (±18.20)18.90 (±7.61)
Maximum Ht (cm)230.0053.90
Spearman correlation (ρ)0.703 *0.529 *
Significance: “*”: p < 0.05; DGH = diameter at ground height; Ht = total height.
Table 4. Parameter estimates, standard errors (SE), Wald X2 statistics and p-values for the model predicting the mortality and survival regeneration in the managed and unmanaged stands.
VariablesCoefficientEstimateSEWald X2p-Value
Managed stand
Intercept β 0 −1.6470.296−5.5582.73·10−8 ***
Diameter (mm) β 1 0.2350.1431.6470.099 .
Height (cm) β 2 0.0390.0211.8610.063 .
Distance (m) β 3 0.0190.0092.1800.029 *
Unmanaged stand
Intercept β 0 −0.9350.799−1.1690.242 n.s.
Diameter (mm) β 1 0.1460.3790.3860.700 n.s.
Height (cm) β 2 0.04150.0490.8400.401 n.s.
Distance (m) β 3 −0.0110.025−0.4410.659 n.s.
Significance: “n.s.”: p > 0.05; “***”: p < 0.001; “*”: p < 0.05; “.”: p < 0.1

