
Spatiotemporal Distribution and Driving Factors of Forest Biomass Carbon Storage in China: 1977–2013


1
College of Economics and Management, Nanjing Forestry University, Nanjing 210037, China
2
Faculty of Agriculture, Life, and Environmental Sciences, University of Alberta, Edmonton, AB T6G 2H1, Canada
*
Author to whom correspondence should be addressed.
Forests 2017, 8(7), 263; https://doi.org/10.3390/f8070263
Submission received: 4 June 2017
/
Revised: 19 July 2017
/
Accepted: 21 July 2017
/
Published: 23 July 2017
Abstract
:Increasing forest vegetation is important for carbon dynamics and to maintain the ecological and environmental balance in China. However, there is little understanding of how socioeconomic factors affect forest biomass carbon storage (FBCS). Here, we used continuous functions for biomass expansion factors and China’s seven completed forest inventories to estimate the changes in FBCS for 31 provinces in mainland China between 1977 and 2013. We developed a model that decomposes the contribution of the different socioeconomic factors driving FBCS. We found China’s FBCS increased from 4972 TgC (1 Tg = 1012g) in 1977–1981 to 7435 TgC in 2009–2013, with a mean growth of 77 TgC/a, and the average forest carbon density increased from 36.0 to 38.9Mg/ha (1 Mg = 106g), mainly due to the arbor forest contribution. Among the seven regions in China, the southwestern region currently accounts for the highest proportion (37.3%) of national FBCS, followed by northeastern (19.7%), northern (12.5%) and eastern region (10.8%). The main socio-economic factors affecting FBCS were forest land dependence, industrial structure and economic development level. Optimizing forest type and age structure, improving forest productivity, and strengthening forest management are feasible options to further increase China’s FBCS.
1. Introduction
Forests contain the majority of the carbon stored in terrestrial ecosystems [1] and play a crucial role in mitigating global climate change. Tropical, temperate, and boreal forests cover about 4.1 billion hectares of the earth’s surface, and contain up to 80% of all above-ground, and 40% of all below-ground terrestrial carbon [2]. Above-ground biomass therefore substantially determines the carbon storage potential of forest ecosystems. Reforestation and afforestation are among the options for mitigating atmospheric CO2 concentrations specified under the Kyoto Protocol and Paris Agreement of the UN Framework Convention on Climate Change. In recent years, there has been considerable research on the calculation of forest biomass carbon storage (FBCS; reviewed in Woodbury et al. [3] estimating carbon stocks and sequestration rates in U.S. forests from 1990 to 2005, Pan et al. [4] estimating a global forest sink of carbon for 1990 to 2007, etc.). However, terrestrial carbon stocks are difficult to measure and estimate accurately because of variability among vegetation types and the complexity associated with soil storage [5]. Furthermore, large differences exist in published estimates of forest carbon sinks, possibly due to variation in methods applied and the type of data source. For example, estimates of terrestrial carbon sinks in North America vary widely, ranging from 0.08 to 1.7 Pg [6,7]. Improved estimation of FBCS is required to clarify the role of forests in carbon dynamics at national scales.
Forest inventory data are regarded as the most practical and effective source for estimating FBCS and carbon pools at regional to national scales [8]. Allometric biomass regression equations and biomass expansion factors (BEF; defined as the ratio of all standing biomass to growing stock volume) have been developed for a range of forest types, and are used to convert inventoried forest volume to aboveground biomass, thereby providing the basis for several national-level carbon budgets (e.g., Kauppi et al. [9]; Turner et al. [10]; Fang et al. [11]; Liu et al. [12]). In China, a forest inventory program combining ground surveys and remote sensing commenced in the early 1970s and has been conducted on a five-yearly cycle since 1984. Research on forest vegetation and the carbon pool in China has concentrated on calculating forest carbon sequestration capacity (e.g., Fang et al. [13]; Zhao and Zhou [14]). Only limited research attention has been paid to spatiotemporal changes, or their impact on FBCS, and this has been limited to forest inventory data pre-2009 (e.g., Wang et al. [15]; Guo et al. [16]).
Current patterns of forest vegetation and its role in carbon cycling arise from the combined effects of anthropogenic and natural disturbances over a range of time scales. Although forests can become sources of atmospheric carbon following human or natural disturbance, during subsequent regrowth they can become atmospheric carbon sinks [17]. Natural factors affecting the amount and rate at which forests sequester carbon include climate extremes, wildfire, pest outbreaks, species composition, atmospheric pollutants, and so on [18,19,20,21,22]. Analysis of reforestation programs in some provinces in China have found tree species, forest age, and ownership changes also affect vegetation carbon storage [23,24]. Additionally, Wang et al. [15] quantified a significant negative correlation between the carbon density of forest ecosystems and population density in China. These studies suggest that the influence of human demographics and economic factors relating to forest management are essential for understanding broad-scale patterns of forest carbon dynamics. Knowledge of how such social and economic factors influence FBCS however, is limited to a single study, which suggested that it was significantly affected by forest area, population, and economic development factors [25].However, even this result was based on only a single province, and it is necessary to increase our temporal and spatial understanding of these factors.
As is well known, China began to implement a reform and opening-up policy in 1978, and urban reform started soon after, with the creation of special economic zones in 1980. These form a natural spatial unit for the analysis of socioeconomic factors on FBCS. Thus, the objectives of this study are to (1) quantify spatiotemporal changes in FBCS for the different regions in China, using all data available from the previous seven national forest inventories (collected over the period 1977–2013); (2) establish a decomposition model to ascertain the relative strength of anthropogenic factors affecting FBCS from social and economic perspectives; and (3) provide detailed information about the driving factors of FBCS in China.
To meet these objectives, we believe that the sustained estimation of FBCS is critical to safeguarding the forests in various provinces of China. This is reflected in the analysis of the spatiotemporal distribution, which shows the latest changes in China’s FBCS. Over the past three decades, China has been implementing the world’s most ambitious afforestation and forest conservation programs along with its rapid economic growth [26]. However, the booming economy has a “double-edged sword” effect: there is an increased demand for forest products, while more funds are being made available for forest restoration and conservation, which might help increase FBCS in China. Thus, in this paper an effort is made to highlight the influences of socioeconomic factors on FBCS in China, and to provide guidance for the government and forest department to articulate the strategies of sustainable forest management and climate change mitigation. The paper also makes an effort to propose a quantitative framework that might help future studies in the area of consistent and comparable estimates of FBCS, which is critical for global afforestation endeavors.
2. Materials and Methods
2.1. Estimation of FBCS
Forest ecosystems consist of five carbon storage pools: living trees, downed and dead woods, understory vegetation, forest floor, and soil [27]. Although our methods only estimated the aboveground biomass of living tress, this component is thought to account for 76–90% of total carbon sequestration in forest ecosystems [3,28]. The use of continuous functions for biomass expansion factors (BEF) is the principal method used to calculate national and regional scale forest biomass [13]. Based on China’s forest inventory data comprising the area and volume of dominant species of arbor (forests with a canopy density exceeding 0.2), economic and bamboo forests at provincial scale, the FBCS for each province was estimated using the following equation:
where: q is the carbon coefficient of the forest biomass with an adopted value of 0.5 [29], Ai represents the area (ha) of the ith arbor species, Xi is the corresponding timber volume per unit area (m3/ha), and BEFi is the biomass expansion factor (Mg/m3), Aj(for j=1,2) represents the area in hectares of the economic and bamboo forest (calculated by plant number), and Bj is the per unit biomass (Mg/ha) of the economic and bamboo. The economic forest biomass per unit area in China is 23.7 Mg/ha [11], and the bamboo biomass is estimated in accordance with an average of 0.0225 MgC per plant [30].
In Equation (1) we used the function: BEF = a + b/x, to obtain a variable BEF value for each arbor species, where x (m3/ha) is the timber volume, and a (Mg/m3), and b (Mg/ha) are the corresponding constants for an arbor species from the relevant literature of forest biomass study in China [31] (Table 1). The parameters a and b of some arborspecies, which are not listed in Table 1, were calculated based on estimated values for species with similar density. The FBCS for the periods 2004–2008 and 2009–2013 were estimated based on Equation (1), using data for the seventh and eighth forest inventories in China, and the accounting results of the remaining inventory periods were derived from literature that applied the same method [16].
2.2. DecompositionModel for Driving Factors of FBCS
Increasing carbon sequestration and reducing carbon emissions are the two main ways to mitigate global climate change. The impacts of human activity on carbon emissions have received widespread attention since 1990s [32,33,34,35,36]. However, although increasing the amount of carbon stored in forests would increase sequestration, there is limited knowledge of the socioeconomic factors influencing FBCS. Here, we propose an equation that is mathematically identical to Equation (1), but allows us to ascertain the impacts of different socioeconomic factors on FBCS:
where: FA is the forest area, FPV is forest production value, GDP is the gross domestic product, and POP is the population. The ratios FBCS/FA, FA/FPV, FPV/GDP and GDP/POP, respectively define forest biomass carbon density (FBCD carbon mass per hectare), dependency on forest land (DFL), industrial structure (IS), and per capita gross domestic product (PCGDP).
To reduce the heteroscedasticity of the data and the influence of the random fluctuating trends, Equation (2) was log transformed to obtain Equation (3):
Then, a general regression model can be established to estimate the coefficients:
In Equation (4), M denotes forest management factors such as dependency on forest land, E refers to economic development factors such as industrial structure and PCGDP, P represents population factors, and u is the error term(assumed to be normally distributed), the subscript i represents the ith region, while t is the year of the statistical data.
Forestry output data were obtained from the national statistical website [37]. Regional GDP data come from “Comprehensive Statistical Data and Materials on 50 Years of New China (1981~1987)” [38], China Statistical Yearbook (1988~1992) and the national statistical website (http://www.stats.gov.cn/) (1993~2013). Population data are quoted from the China Statistical Yearbook (1981~2000) and national statistical website (http://www.stats.gov.cn/) (2001~2013). To obtain the panel data for regression analysis, we assumed that the forest area and FBCS in each five-yearly forest inventory cycle are increased by one fifth of the total amount each year of the period.
To avoid collinearity with FBCS, FBCD was removed from Equation (3). Then by using FBCS as the dependent variable and DFL, IS, PCGDP and POP as independent variables, we were able to identify the main socio-economic factors driving FBCS. Considering the independence of time series data, we introduced the year as a control variable. Based on the panel data of 31 provinces in mainland China from 1981 to 2013, an AR(1) autoregressive model was fit with R Software using the logarithmically transformed variables. To test for any spurious trends due to random noise, we used the ADF unit root test and Johansen cointegration test, which showed that all variables were first order differential stationary sequences and that there was a long-term stable equilibrium relationship among variables.
3. Results and Discussion
3.1. Overall Changes of FBCS in China
The changes of FBCS, forest carbon sinks and net primary productivity (NPP) in mainland China (excluding Hong Kong, Macao and Taiwan regions) are shown in Table 2.
Considering all forest types together, Table 2 shows there was an increasing trend in forest biomass carbon storage in China between 1977 and 2013 due to the simultaneous growth of forest area. In 2013, China’s forest area and FBCS were 19118 × 104 ha and7435 TgC, an increase of 5320×104 ha and 2463 TgC from 1981, respectively. The forest carbon sink also increased, with a mean rate of 77 TgC/a during 1981–2013. Apart from the inventory period 1984–1988 and 1994–1998, the average annual carbon sink growth was above 100 TgC/a. In 2009–2013, forest carbon sequestration accumulated at a rate of 114.6 TgC/a (equal to 420.33 Tg CO2/a), representing an offset of 4.68% of CO2 emissions from fuel combustion (8979.8 Tg CO2 in 2013) of the entire People’s Republic of China [39].
Based on the averaged forest area between 1977 and 2013, we calculated that China’s NPP was 0.47 MgC/ha/a. However, the NPP in two adjacent inventory periods were not balanced. The maximum NPP was 0.72 MgC/ha/a in 1984–1993, and the minimum was only 0.06 MgC/ha/a in 1989–1998. Thereafter, China’s NPP was maintained at a stable level (0.62–0.65 MgC/ha/a). The change of forest area was the main reason for the difference of NPP and therefore the NPP of Arbor Forest varied with the same trend.
In the past 32 years, China’s forest biomass carbon density (FBCD) remained stable during different inventory periods. The lowest and highest level of FBCD occurred in 1984–1988 (34.8 MgC/ha) and 2009–2013 (38.9 MgC/ha), respectively, which were close to previous estimates of 36.0MgC/ha [15], 38.4 MgC/ha [13] (Fang et al.,2001) and 38.7 MgC/ha [12]. Compared with other large countries over the same period, China’s FBCD were similar to Europe’s 32.0 MgC/ha [2] and Japan’s 34.7 MgC/ha [40]. However, it was significantly lower than Russia’s 47.6 MgC/ha [12] and America’s 61.0 MgC/ha [10]. Mature or maturing forests have higher NPP than young forests [14]. One reason for the low FBCD in the present study is that 64.7% of the forest areas in China consist of Middle and Young Stands with lower carbon density. This suggests that through optimization of forest age structure, the FBCS and FBCD of Chinese forests have a large potential for growth.
The major component of forest resources in China, arbor forests, accounted for more than 93.2% of the total FBCS across the seven forest inventory cycles. The average annual carbon sink of arbor forests reached 69.6 TgC/a between 1981 and 2013, accounting for 90.4% of the total. The FBCS of economic forest and bamboo forest increased from 134 and 121TgC for the period 1977–1981 to 244 and 248 TgC in 2009–2013, respectively, with a mean increased carbon sink uptake of 3.4 and 4.0 TgC/a, respectively, accounting for 4.4% and 5.2% of the national total. For economic forest however, this value has remained approximately constant since 1998.
3.2. Regional Distribution of FBCS in China
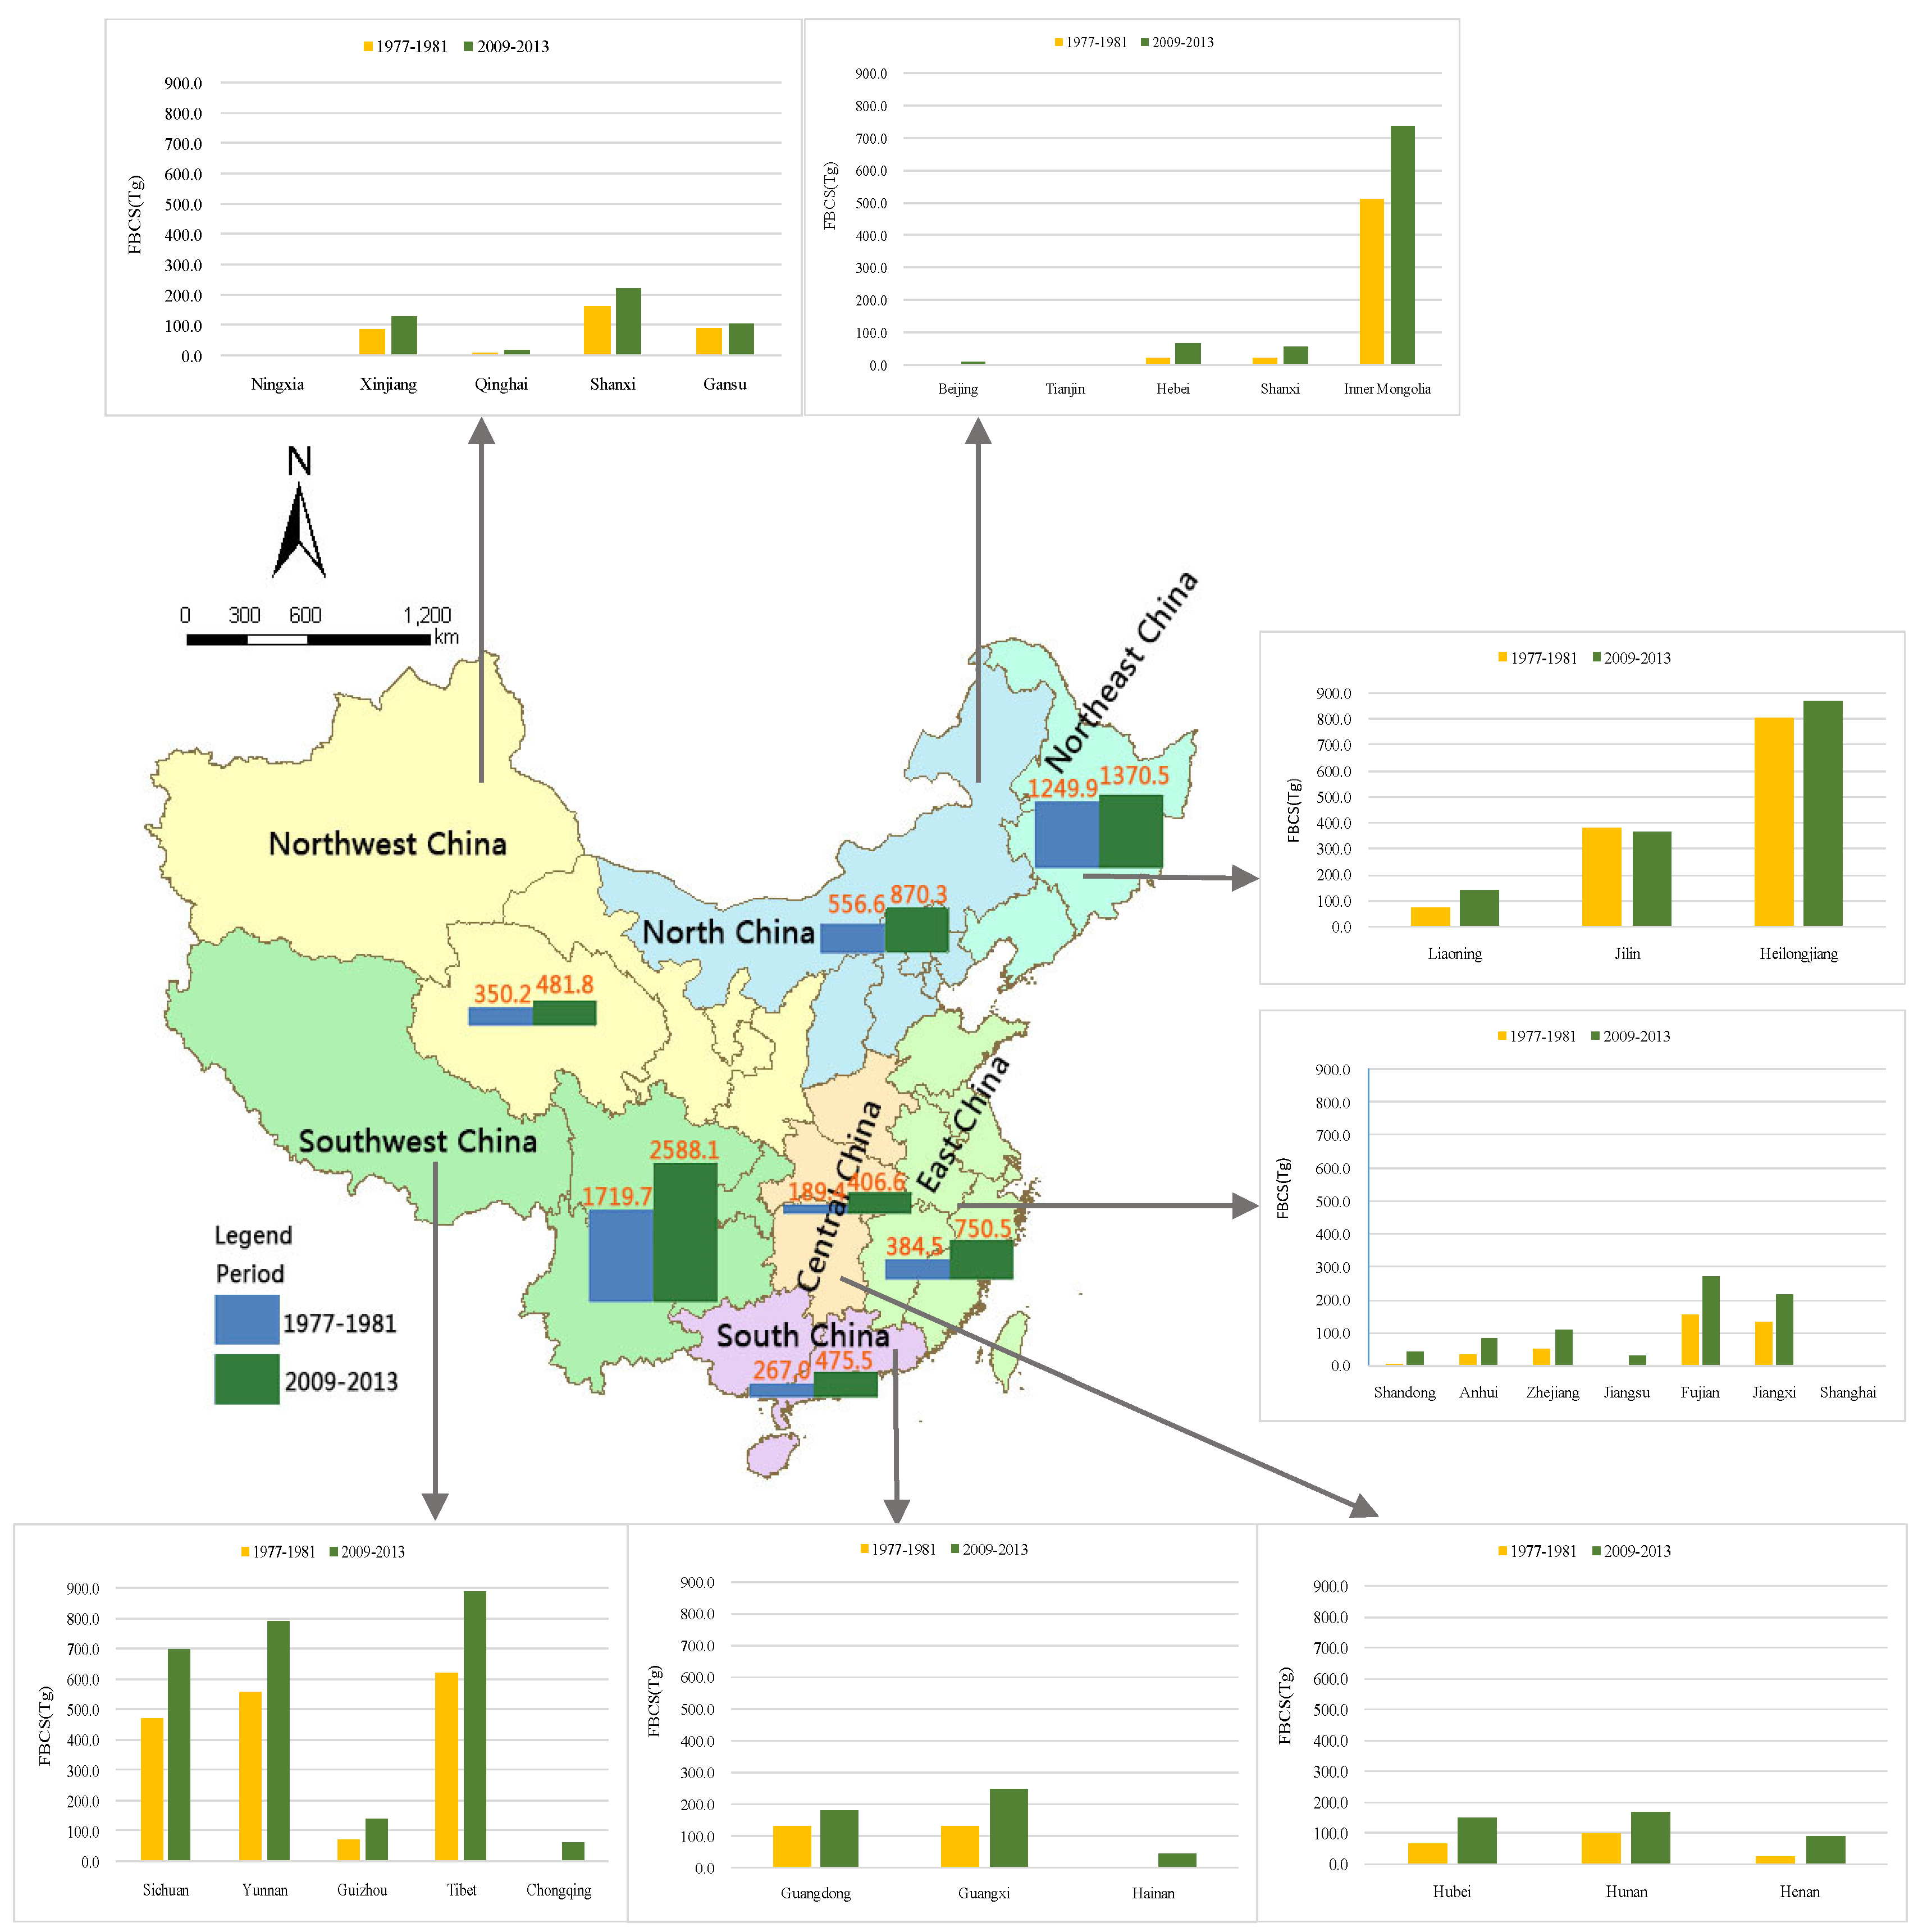
There is considerable regional and temporal variability in FBCS among provinces in China (Figure 1).
In 1977–1981, about 36.5% of the total FBCS of standing forest occurred in the southwestern region (including the provinces of Sichuan, Yunnan, Guizhou, Tibet, and Chongqing), followed by 26.5%,11.8% and 8.2% in the northeastern (containing Liaoning, Jilin, and Helongjiang provinces), northern (e.g., Beijing, Tianjin, Hebei, Shanxi, and Inner Mongolia) and eastern regions (consisting of Shandong, Anhui, Zhejiang, Jiangsu, Fujian, Jiangxi, and Shanghai), respectively. The five largest provinces, with the highest carbon reserves, were Heilongjiang (801.8 TgC), Tibet (621.9 TgC), Yunnan (556.6 TgC), Inner Mongolia (510.7 TgC), and Sichuan (469.6 TgC).These five provinces contributed 62.8% of total FBCS. Shanghai (0.1 TgC), Tianjin (0.1 TgC), Beijing (1.2 TgC), Ningxia (1.8 TgC), and Jiangsu (2.7 TgC) were the five provinces with the lowest carbon reserves, accounting for only 0.1% of the total.
Over the period 2009–2013, the regional carbon storage capacity rankings remain unchanged, but the proportions changed. The southwestern region contributed the largest share (37.3%) of total carbon storages, followed by the northeastern (19.7%), northern (12.5%) and eastern region (10.8%).The provinces with the five highest FBCS are Tibet (890.6 TgC), Heilongjiang (870.0 TgC), Yunnan (793.5 TgC), Inner Mongolia (737.3 TgC), and Sichuan (701.4 TgC), accounting for 57.5% of the total. The provinces with the five smallest FBCS are Shanghai (1.0 TgC), Tianjin (1.9 TgC), Ningxia (3.7 TgC), Beijing (8.3 TgC), and Qinghai (19.6 TgC), together accounting for 0.5% of the total.
From the period 1977–1981 to 2009–2013, the total FBCS of the southwestern region increased from 1719.7 to 2588.1 TgC, and the average annual carbon sink increased by 27.1 TgC. FBCS in the eastern and northern regions increased from 384.5 and 556.6 TgC to 750.5 and 870.3 TgC, with annual average carbon sinks of 11.4 and 9.8 TgC/a, respectively. The FBCS in central China (including the provinces of Hubei, Hunan and Henan) was the smallest among all regions, but the average annual carbon sink increased by 6.8 TgC/a. In contrast, the total amount of FBCS in the northeastern region was relatively large, but its annual increment in carbon sink was the smallest (3.8 TgC/a), because most of the forests in northeastern region consist of boreal forest of lower carbon density.With the improvement of the natural forest protection system in China, it is projected that the commercial logging of state-owned natural forest will be completely stopped during the “13th five-year” Planning of National Economic Development (2016–2020); this would be expected to steadily increase the carbon sink capacity of state-owned forest areas in the northeast region. On the provincial level, there was an increase in the carbon sinks, except for Jilin Province. The six provinces where the carbon sink exceeded 100 TgC were Tibet (268.7 TgC), Yunnan (236.9 TgC), Sichuan (231.8 TgC), Inner Mongolia (226.6 TgC), Fujian (116.3 TgC), and Guangxi (113.8 TgC). This adds up to 53.6% of the country’s total.
3.3. Factors Influencing FBCS
3.3.1. Regression Analysis Results
The regression of FBCS on the socio-economic factors explained over 95% of variation and was significant at the 95% level. The residuals satisfied the data independence assumption. Among the predictor variables, dependency on forest land (DFL) and industrial structure (IS) were the main factors driving the growth of FBCS (Table 3). The effect of PCGDP and population (POP) were significant, but had a smaller effect size. Therefore, we restricted our interpretation of the influence of socio-economic factors on FBCS presented in the following sections to dependency on forest land, economic development, and industrial structure.
3.3.2. Dependency on Forest Land
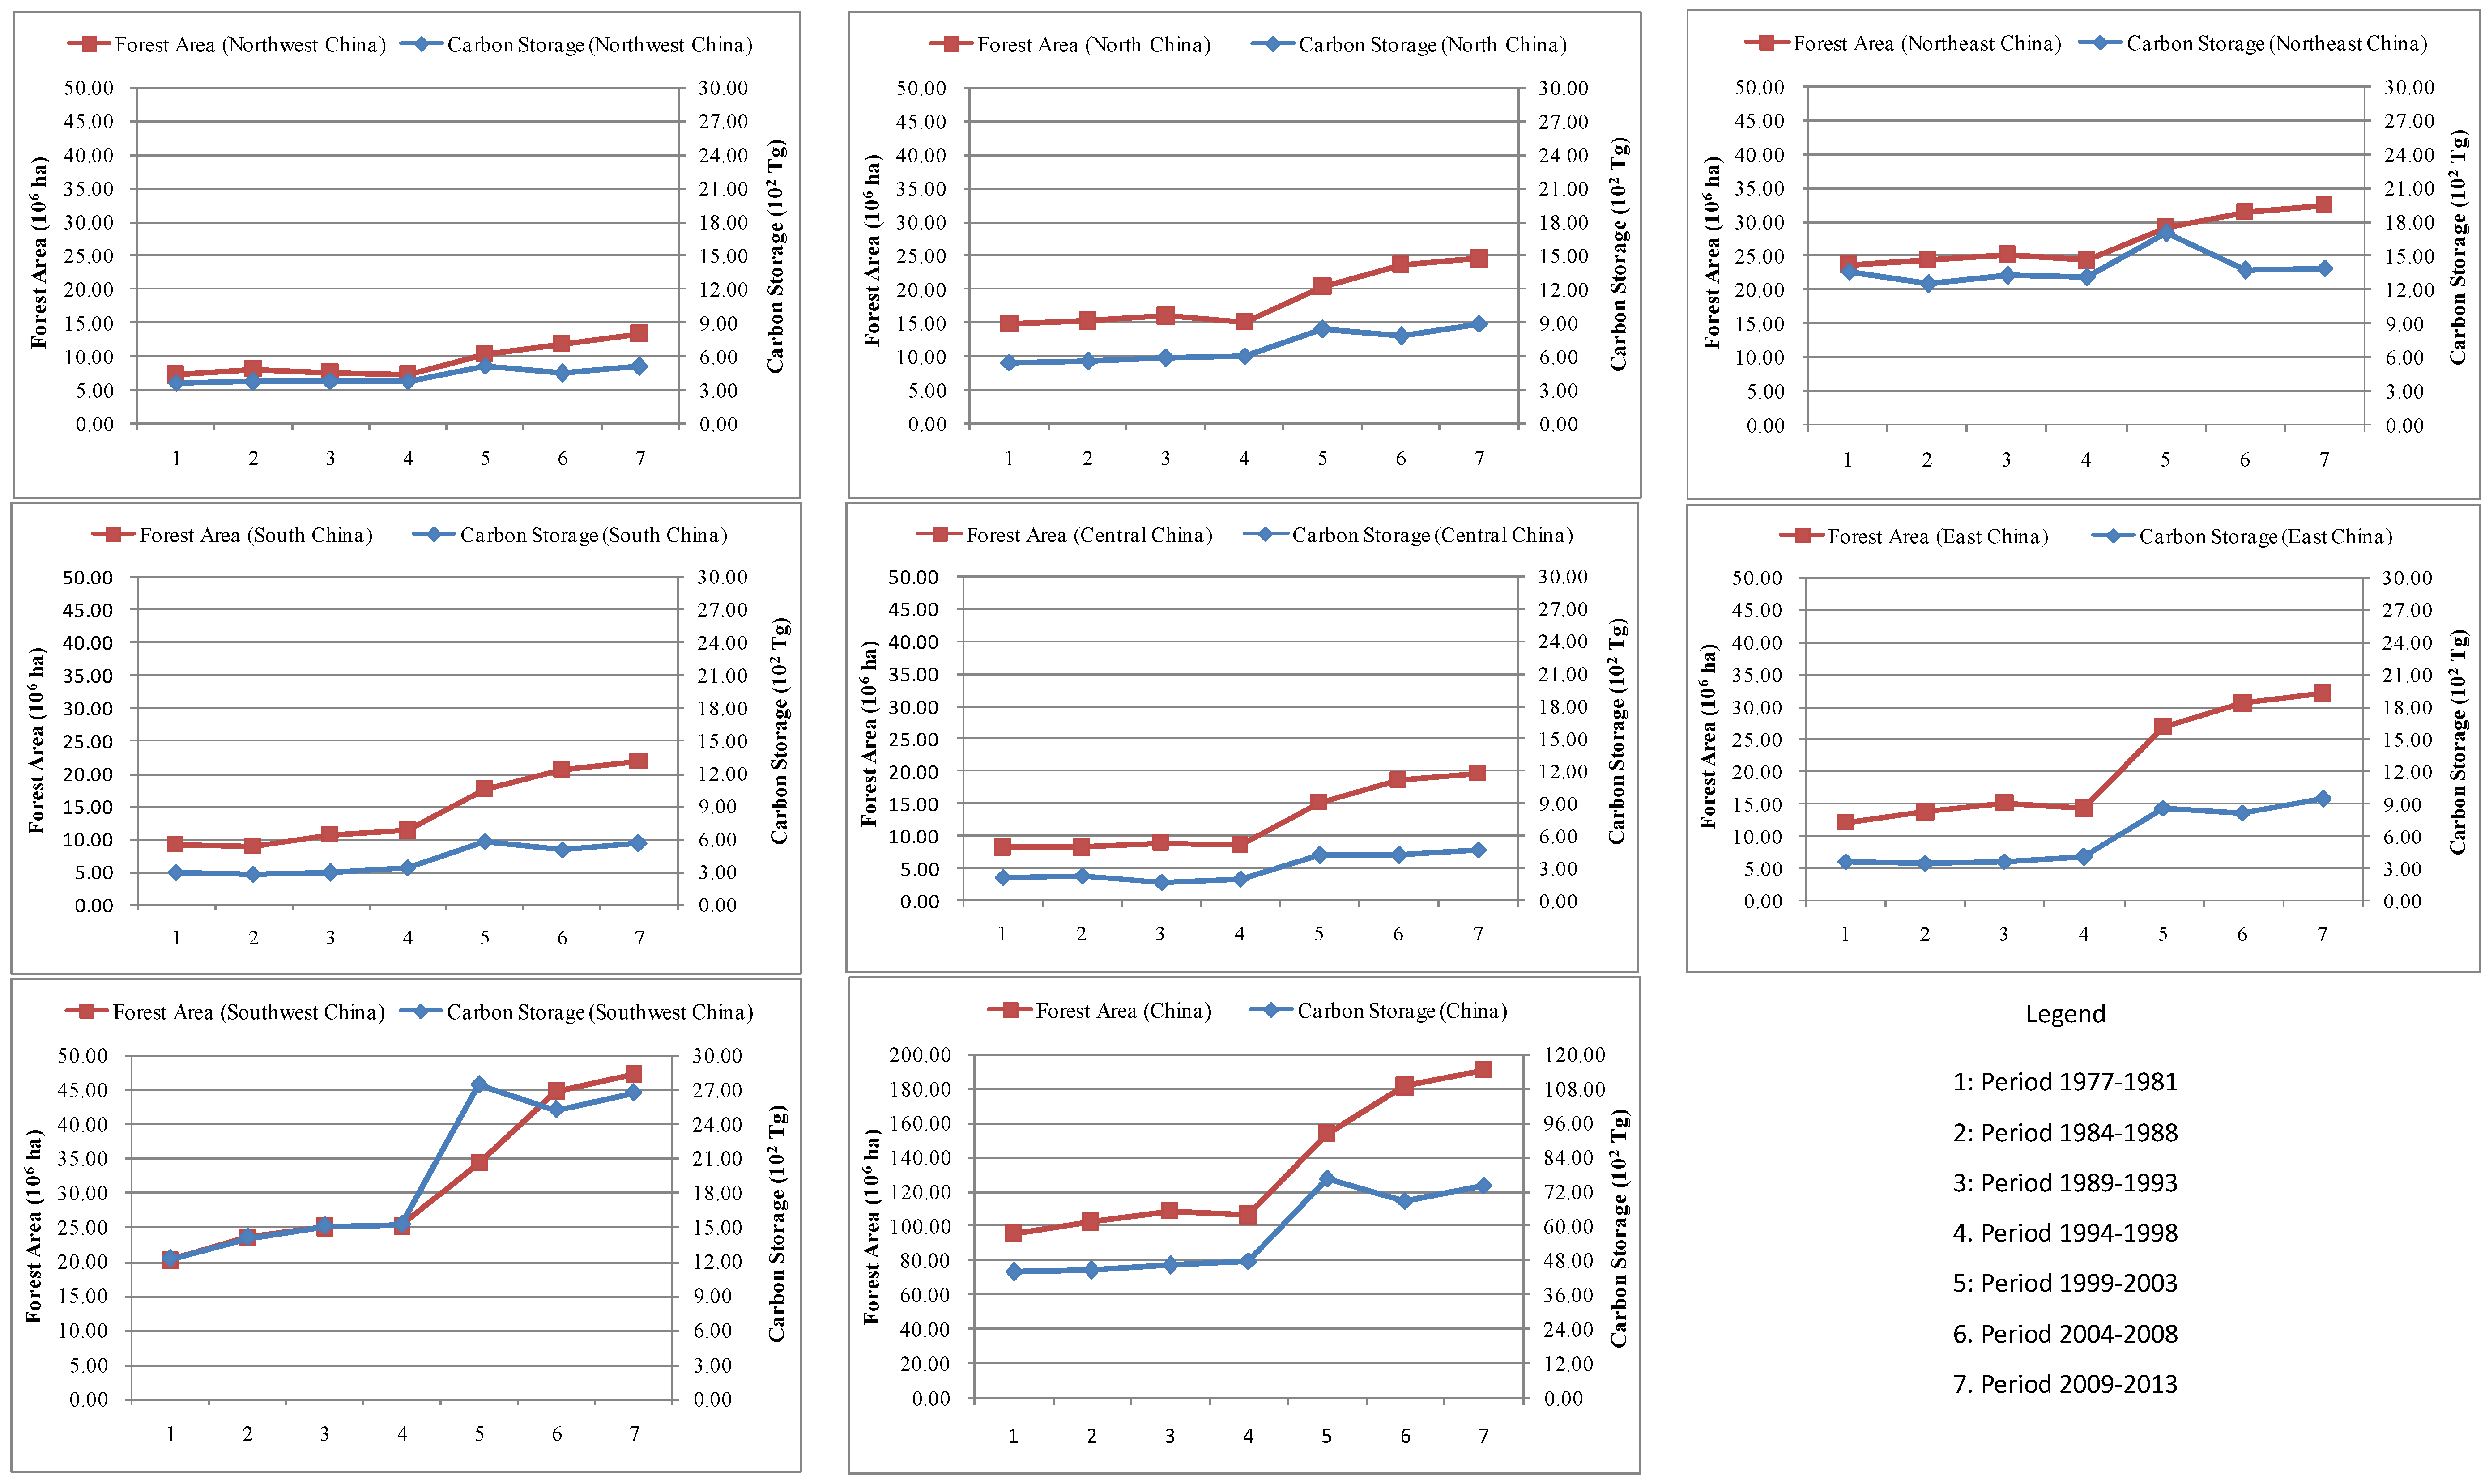
Land use and concurrent land-cover change can result in changes to carbon stocks [41]. Increasing the area of forest land is the most direct way to promote FBCS. It can be seen from Figure 2, the FBCS were generally keeping pace with forest area in past 32 years. Except for Southwest China, the change of FBCS in other regions was highly related to forest area change. Besides, the management of existing forests can also increase carbon sequestration. In the “Sustainable Development Agenda 2030”, the United Nations stated: “By 2020, promote the implementation of sustainable management of all types of forests, halt deforestation, restore degraded forests and substantially increase afforestation and reforestation globally” [42]. Over the last three decades, large scale afforestation and reforestation have meant that China holds the largest individual proportion of plantations area, constituting about one-third of the global total [43]. The national forest inventory in 2009–2013 shows that China has 208 million hectares of forest area and 16.4 billion cubic meters of live wood storage (of which forest reserves reached 15.1 billion cubic meters).In contrast, while China’s plantation area ranks first in the world, its forest area and volume rank fifth and sixth in the world, respectively [44]. Compared with the inventory in 1977–1981, its accumulated forest area increased by 93 million hectares and 6.1 billion cubic meters, with average annual increases of 2.9 million hectares and 191 million cubic meters, respectively. During the “12th Five-Year” Planning of National Economic Development (2011–2015), areas of national afforestation and forest tending were up by30 million and 39.7 million hectares, respectively. Thus, existing planted forests might have a large potential to accumulate additional biomass in living trees, since most of the plantation forests in China are young forests [14] and do not reach their maximum biological storage at current rotation length.
Land-use changes such as afforestation and intensive management of fast-growing tree species can have an immediate effect on the national rate of carbon sequestration [45]. However, comparisons suggest China lacks of forest resources, contribute to a fragile ecological environment. China’s forest coverage is only 21.63%, well below the global average of 31%. The per capita forest area and accumulation are only 1/4 and 1/7 of global levels, respectively. As for forestland productivity, the unit volume of forest production in China is 69% of the world average (131 m3), and the forest annual net growth is only about half that of the forestry developed countries [46].Additionally, after large-scale afforestation in the past 30 years, the structure and distribution of afforestation have changed significantly. Of the 39.58 million hectares of suitable land for forest, 67% were distributed in the arid and semiarid regions of north and northwest China, and a further 12% were distributed in the South karst rocky desertification areas [46]. These regions create more difficulties for afforestation than would be found in more amenable conditions. It is also noteworthy that with the development of urbanization, part of the woodland and grassland biomes have been converted to urbanized land [47], meaning the corresponding land area is converted from a carbon sink to a carbon source.
3.3.3. Economic Development and Industrial Structure
Accompanying China’s post-1978 economic reforms, forest resources and associated carbon stocks continued to grow, due to ongoing capital investment. Since the mid-1980s, China has initiated several ecological restoration projects (e.g., the South China Timber Production Program, Rivers Protection Forest Program, etc.), these are beneficial to both meeting the increasing timber demand, and in mitigating negative environmental impacts. The startup of the six national key forestry programs in 2001 (Natural Forest Conservation Program, the Grain for Green Program, the Shelterbelt Construction Program in North, Northeast and Northwest China, the Beijing-Tianjin Sandstorm-Control Program, the Wildlife Protection and Nature Reserve Development Program, and the Fast-Growing and High-Yielding Plantation Program) signaled a new development stage for Chinese forestry. These six forestry programs cover more than 97% of the counties in China, with a total investment of more than 700 billion yuan [48]. Since 2010, China has been the second largest economy in the world. The growth of the economy, and the growing awareness of the need for environmental protection, has seen China’s forestry investment increase significantly. During the “12th Five-Year” period of National Economic Development, Chinese forestry investment reached 1 trillion and 770 billion yuan [46]. In the eastern region of China, local governments can allocate more of their capital to develop forestry as a result of their strong economies and increasing environmental pressures. These became important factors promoting the increase of FBCS and FBCD observed in the more developed regions of eastern and northern China. Undoubtedly, total FBCS can be enhanced by increasing allocations to forestry, and thereby promoting the coordinated growth of both economy and ecology.
As with the international community, dealing with climate change and developing the low-carbon economy have been commitments of the Chinese government since 2006, when the National Assessment Report of Climate Change was published [49]. The forestry industry is a typical low-carbon industry that has maintained rapid growth momentum in China. According to the “13thFive-Year” Planning of Forestry Development in China, the national forestry industry output value increased from 2.28 trillion yuan in 2010 to 5.94 trillion yuan in 2015, with the average annual growth rate of more than 20%. By 2020, China’s forestry industry output value is expected to reach 8.7 trillion yuan, and forestry employment will reach 60 million people. The ratio of forestry industry output value to total GDP in China has also been steadily increasing. For example, China’s GDP in 2010 and 2015 were 44.13 and 68.26 trillion yuan [50], respectively. The forestry output value in 2010 accounted for 5.2% of GDP, while in 2015this had increased to 8.7%. Despite this, the output value of tertiary forestry industries (e.g., forest tourism) accounted for just 16% of the total forestry output value [46]. Thus, improving the proportion of the forestry industry in the national economy and optimizing the forestry industry structure are important to enhance the comprehensive benefits of forestry.
3.3.4. Other Factors and Future Direction
The ability to estimate forest carbon sequestration has gained increasing global attention. However, it is difficult to accurately measure the FBCS because the forest carbon pool is affected by both natural and anthropogenic disturbance. In this paper, the FBCS only included above-ground tree biomass, neglecting the estimates for below-ground biomass, non-tree vegetation, wood debris, and soil organics. As far as soil carbon was concerned, over two-thirds of the carbon in forest ecosystems were contained in soils and associated peat deposits [2]. In China, the forest biomass carbon sink (including dead woods, harvested wood products, biomass, litter and soil) accounted for 44.4% to 63.2% of the forest’s total [4]. Using these proportions to correct for carbon storage pools not accounted for in our analysis suggests the average annual carbon sinks of total forests in China would have been between 121.8 and 173.4 TgC/a during the study period.
China’s economy has grown the fastest among the world’s major economies during the past decades. By contrast, China’s environment was increasingly deteriorating (e.g., soil erosion is widespread). As noted above, there were few investigations that studied the impact of socioeconomic factors on FBCS, and clarifying the driving factors of FBCS is helpful for tackling the ecological problems of China. However, because of the difficulties of data collection, the regression analysis in this work simply reflected the impacts of a few indicators such as forest area, GDP, and population on FBCS. In follow-up studies, developing models are necessary to discuss more socio-economic factors affecting FBCS to further ascertain the influencing mechanism of FBCS in China.
4. Conclusions
China’s FBCS increased from 4972 TgC in 1977–1981 to 7435 TgC in 2009–2013, with a mean growth of 77 TgC/a. The increase of FBCS was mainly attributed to forest expansion and regrowth, especially the contribution from arbor forests, which accounted for 94.9% (1977–1981) and 93.4% (2009–2013) of the national total, respectively. The FBCS of economic forest and bamboo forest increased by 110 and 127 TgC between 1981 and 2013, for a mean accumulation rate of 3.4 and 4.0 TgC per year, respectively. China’s FBCD ranged from 34.8 to 38.9 MgC/ha, which was close to Europe and Japan, but significantly lower than Russia of 47.6 MgC/ha, the United States of 61.0 MgC/ha. The low carbon density resulted from the high proportion of middle and young stands, and low forestland productivity, which indicated that the FBCS in China has good potential to increase.
There was an uneven spatial distribution of FBCS in China. The southwestern, northeastern, northern and eastern regions contributed 37.3%, 19.7%, 12.5%, and 10.8% of the total FBCS in 2009–2013, respectively. Over the period 1977–2013, the FBCS exhibited an upward trend in each region. The average annual carbon sink in the southwestern region was the greatest (27.1 TgC/a), followed by the eastern (11.4 TgC/a) and northern regions (9.8 TgC/a). The carbon sink of the central region (6.8 TgC/a) was close to the southern region (6.5 TgC/a), while the growth of the northeastern region (3.8 TgC/a) was the smallest, and lower than the northwestern region (4.1 TgC/a). With respect to the provincial distribution, carbon sinks of Tibet, Yunnan, Sichuan, Inner Mongolia, Fujian and Guangxi provinces were respectively more than 100TgC during this time, and the six provinces contributed a total of 53.6% of the Country’s total, whereas the six provinces ranked last nationwide (Jilin, Shanghai, Tianjin, Ningxia, Beijing and Qinghai) accounted for only 0.3% of the country’s total.
From a socioeconomic perspective, the main factors driving the growth of FBCS in China include forest land dependence, industrial structure, and economic development level. Large-scale afforestation (especially the implementation of six national key forestry programs), the rapid growth of forestry industry, and adequate investment in forestry, have made a positive contribution to the continuous increase of China’s FBCS, which has led to effective coordination of environmental protection and socioeconomic developments. However, about two-thirds of suitable lands for forest were located in northern and northwestern regions, of which 59% are arid and semi-arid areas with an annual rainfall below 400 mm. Poor site conditions will result in difficult afforestation and increased costs, and the rate of growth of FBCS due to increases in forested land area is expected to decrease. Therefore, optimizing forest type and age structure, improving forest productivity, and strengthening forest management (e.g., reducing harvest or lengthening rotations for the existing forests) will be effective ways to promote the increase of China’s FBCS.
Acknowledgments
We appreciate the thoughtful comments and suggestions of Dingliang Xing, Hongqiang Yang and the anonymous referees. This work was supported by the National Social Science Fund of China (Grant No. 13CZZ050) and the Humanities and Social Science Fund of the Ministry of Education of China (Grant No. 12YJC630265). The contents of this paper are solely the responsibility of the authors and do not necessarily represent official views of the sponsors.
Author Contributions
Jiameng Yang designed the study, analyzed the date, drafted this manuscript, prepared Figure 2 and all tables, and went through all sectional works. Xiaoxia Ji collected the original data and background materials , and analyzed the data. David C. Deane gave review suggestions for the manuscript on the whole writing process and polished the expression. Linyu Wu collected the data and wrote the paper with results checking. Shulin Chen prepared Figure 1. All authors have approved the final manuscript.
Conflicts of Interest
The authors declare no conflict of interest.
References
- IPCC. Land Use, Land-Use Change, and Forestry: A Special Report of the IPCC; Cambridge University Press: Cambridge, UK, 2000. [Google Scholar]
- Dixon, R.K.; Brown, S.; Houghton, R.A.; Solomon, A.M.; Trexler, M.C.; Wisniewski, J. Carbon pools and fluxes of global forest ecosystems. Science 1994, 263, 185–190. [Google Scholar] [CrossRef] [PubMed]
- Woodbury, P.B.; Smith, J.E.; Heath, L.S. Carbon sequestration in the U.S. forest sector from 1990 to 2010. For. Ecol. Manag. 2007, 241, 14–27. [Google Scholar] [CrossRef]
- Pan, Y.D.; Birdsey, R.A.; Fang, J.Y.; Houghton, R.; Kauppi, P.E.; Kurz, W.A.; Phillips, O.L.; Shvidenko, A.; Lewis, S.L.; Canadell, J.G. A large and persistent carbon sink in the world’s forests. Science 2011, 333, 988–993. [Google Scholar] [CrossRef] [PubMed]
- Gurney, K.R.; Law, R.M.; Denning, A.S. Towards robust regional estimates of CO2sources and sinks using atmospheric transport models. Nature 2002, 415, 626–630. [Google Scholar] [CrossRef] [PubMed]
- Fan, S.; Gloor, M.; Mahlman, J.; Pacala, S.; Sarmiento, J.; Takahashi, T.; Tans, P. A large terrestrial carbon sink in North America implied by atmospheric and oceanic carbon dioxide data and models. Science 1998, 282, 442–446. [Google Scholar] [CrossRef] [PubMed]
- Schimel, D.; Melilo, J.; Tian, H.Q.; McGuire, A.D.; Kicklighter, D.; Kittel, T.; Rosenbloom, N.; Running, S.; Thornton, P.; Ojima, D.; et al. Contribution of increasing CO2 and climate to carbon storage by ecosystems in the United States. Science 2000, 287, 2004–2006. [Google Scholar] [CrossRef] [PubMed]
- Hu, H.F.; Wang, G.G. Changes in forest biomass carbon storage in the South Carolina Piedmont between 1936 and 2005. For. Ecol. Manag. 2008, 255, 1400–1408. [Google Scholar] [CrossRef]
- Kauppi, P.E.; Mielikainen, K.; Kuusela, K. Biomass and carbon budget of European forests, 1971–1990. Science 1992, 256, 70–74. [Google Scholar] [CrossRef] [PubMed]
- Turner, D.P.; Koepper, G.J.; Harmon, M.E.; Lee, J.J. A carbon budget for forest of the conterminous United States. Ecol. Appl. 1995, 5, 421–436. [Google Scholar] [CrossRef]
- Fang, J.Y.; Liu, G.H.; Xu, S.L. Biomass and net production of forest vegetation in China. Acta Ecol. Sin. 1996, 16, 497–508. (In Chinese) [Google Scholar]
- Liu, G.H.; Fu, B.J.; Fang, J.Y. Carbon dynamics of Chinese forests and its contribution to global carbon balance. Acta Ecol. Sin. 2000, 20, 733–740. (In Chinese) [Google Scholar]
- Fang, J.Y.; Chen, A.P.; Peng, C.H.; Zhao, S.Q.; Ci, L.J. Changes in forest biomass carbon storage in China between 1949 and 1998. Science 2001, 292, 2320–2323. [Google Scholar] [CrossRef] [PubMed]
- Zhao, M.; Zhou, G.S. Estimation of biomass and net primary productivity of major planted forests in China based on forest inventory data. For. Ecol. Manag. 2005, 207, 295–313. [Google Scholar] [CrossRef]
- Wang, X.K.; Feng, Z.W.; Ouyang, Z.Y. The impact of human disturbance on vegetative carbon storage in forest ecosystems in China. For. Ecol. Manag. 2001, 148, 117–123. [Google Scholar] [CrossRef]
- Guo, Z.D.; Hu, H.F.; Li, P.; Li, N.Y.; Fang, J.Y. Spatio-temporal changes in biomass carbon sinks in China’s forests during 1977–2008. China Life Sci. 2013, 43, 421–431. (In Chinese) [Google Scholar]
- Brown, S.L.; Schroeder, P.; Kern, J.S. Spatial distribution of biomass in forests of the eastern USA. For. Ecol. Manag. 1999, 123, 81–90. [Google Scholar] [CrossRef]
- Harcombe, P.A.; Harmon, M.E.; Greene, S.E. Changes in biomass and production over 53 years in a coastal Picea sitchensis-Tsuga heterophylla forest approaching maturity. Can. J. For. Res. 1990, 20, 1602–1610. [Google Scholar] [CrossRef]
- Law, B.E.; Turner, D.; Campbell, J.; Sun, O.J.; Van Tuyl, S.; Ritts, W.D.; Cohen, W.B. Disturbance and climate effects on carbon stocks and fluxes across Western Oregon USA. Glob. Chang. Biol. 2004, 10, 1429–1444. [Google Scholar] [CrossRef]
- Krankina, O.N.; Houghton, R.A.; Harmon, M.E.; Hogg, E.H.; Butman, D.; Yatskov, M.; Huso, M.; Treyfeld, R.F.; Razuvaev, V.N.; Spycher, G. Effects of climate, disturbance, and species on forest biomass across Russia. Can. J. For. Res. 2005, 35, 2281–2293. [Google Scholar] [CrossRef]
- Gough, C.M.; Vogel, C.S.; Harrold, K.H.; George, K.; Curtis, P.S. The legacy of harvest and fire on ecosystem carbon storage in a north temperate forest. Glob. Chang. Biol. 2007, 13, 1935–1949. [Google Scholar] [CrossRef]
- Zhang, F.M.; Chen, J.M.; Pan, Y.D.; Birdsey, R.A.; Shen, S.H.; Ju, W.M.; He, L.M. Attributing carbon changes in conterminous U.S. forests to disturbance and non-disturbance factors from 1901 to 2010. J. Geophys. Res. Biogeosci. 2013, 118, 1345–1346. [Google Scholar] [CrossRef]
- Zhou, C.Y.; Wei, X.H.; Zhou, G.Y.; Yan, J.H.; Wang, X.; Wang, C.L.; Liu, H.G.; Tang, X.Y.; Zhang, Q.M. Impacts of a large-scale reforestation program on carbon storage dynamics in Guangdong, China. For. Ecol. Manag. 2008, 155, 847–854. [Google Scholar] [CrossRef]
- Ren, Y.; Wei, X.H.; Zhang, L.; Cui, S.H.; Chen, F.; Xiong, Y.Z.; Xie, P.P. Potential for forest vegetation carbon storage in Fujian Province, China, determined from forest inventories. Plant Soil 2011, 345, 125–140. [Google Scholar] [CrossRef]
- Yang, J.M.; Xu, R.Y.; Cai, Z.J.; Bi, J.; Wang, H.K. Influencing factors on forest biomass carbon storage in eastern China-acase study of Jiangsu province. BioResources 2014, 9, 357–371. [Google Scholar]
- Zhang, K.R.; Song, C.H.; Zhang, Y.L.; Zhang, Q.F. Natural disasters and economic development drive forest dynamics and transition in China. For. PolicyEcon. 2017, 76, 56–64. [Google Scholar] [CrossRef]
- Birdsey, R.A.; Heath, L.S. Carbon changes in U.S. forests. In Productivity of America’s Forests and Climate Change; Joyce, L.A., Ed.; USDA Forest Service, Rocky Mountain Forest and Range Experiment Station, RM-GTR-271: Fort Collins, CO, USA, 1995; pp. 56–70. [Google Scholar]
- Liu, J.; Liu, S.; Loveland, T.R. Temporal evolution of carbon budgets of the Appalachian forests in the U.S. from 1972 to 2000. For. Ecol. Manag. 2006, 222, 191–201. [Google Scholar] [CrossRef]
- Fang, J.Y.; Chen, A.P.; Zhao, S.Q.; Ci, L.J. Estimating biomass carbon of China’s forests: Supplementary notes on report published in Science (291: 2320–2322) by Fang et al. (2001). Acta Phyto. Sin. 2002, 26, 243–249. (In Chinese) [Google Scholar]
- Nie, D.P. Structural dynamics of bamboo stand. Sci. SilvaeSin. 1994, 30, 201–208. (In Chinese) [Google Scholar]
- Fang, J.Y.; Guo, Z.D. Chinese terrestrial vegetation carbon sequestration estimation between 1981 and 2000. China Sci. 2007, 37, 804–812. (In Chinese) [Google Scholar]
- Kaya, Y. Impact of Carbon Dioxide Emission on GNP Growth: Interpretation of Proposed Scenarios. Proceedings of IPCC, Paris, France, 1989. [Google Scholar]
- York, R.; Rosa, E.A.; Dietz, T. STIRPAT, IPAT and ImPACT: Analytic tools for unpacking the driving forces of environmental impacts. Ecol. Econ. 2003, 46, 351–365. [Google Scholar] [CrossRef]
- Ma, C.; Ju, M.T.; Zhang, X.C.; Li, H.Y. Energy consumption and carbon emissions in a coastal city in China. Procedia Environ. Sci. 2011, 4, 1–9. [Google Scholar]
- Zhang, C.; Tian, H.Q.; Chen, G.S.; Chappelka, A.; Xu, X.F.; Ren, W.; Hui, D.F.; Liu, M.L.; Lu, C.Q.; Pan, S.F.; et al. Impacts of urbanization on carbon balance in terrestrial ecosystems of the Southern United States. Environ. Pollut. 2012, 164, 89–101. [Google Scholar] [CrossRef] [PubMed]
- Zhang, W.; Yang, S.Y. The influence of energy consumption of China on its real GDP from aggregated and disaggregated viewpoints. Energy Policy 2013, 57, 76–81. [Google Scholar] [CrossRef]
- National Bureau of Statistics of China (NBSC). National Data. Available online: http://data.stats.gov.cn/easyquery.htm?cn=C01 (accessed on 31 May 2017).
- National Bureau of Statistics of China (NBSC). Comprehensive Statistical Data and Materials on 50 Years of New China; China Statistics Press: Beijing, China, 1999. [Google Scholar]
- International Energy Agency (IEA). CO2 Emissions from Fuel Combustion by Sector in 2014, OECD/IEA, Paris. Available online: http://wds.iea.org/wds/pdf/Worldco2_Documentation.pdf (accessed on 31 May 2017).
- Iwaki, E. Regional distribution of phytomass and net primary production in Japan. In Contemporary Ecology of Japan; Ikushuna, I., Ed.; Kyoritsu Syobban: Tokyo, Japan, 1983; pp. 41–48. [Google Scholar]
- Bolin, B.; Sukumar, R. Global Perspective. In Land Use, Land-Use Change, and Forestry; Watson, R.T., Noble, I.R., Bolin, B., Ravindranath, N.H., Verado, D.J., Dokken, D.J., Eds.; Cambridge University Press: Cambridge, UK, 2000; pp. 23–51. [Google Scholar]
- United Nations (UN). Transforming our World: The 2030 Agenda for Sustainable Development. Available online: https://sustainabledevelopment.un.org/post2015/transformingourworld (accessed on 31 May 2017).
- State Forestry Administration (SFA). The Bulletin of Forestry and Ecological Construction in China; China Forestry Publishing House: Beijing, China, 2008.
- State Forestry Administration (SFA). The Eighth Forest inventory of China; China Forestry Publishing House: Beijing, China, 2015.
- Jandl, R.; Lindner, M.; Vesterdal, L.; Bauwens, B.; Baritz, R.; Hagedorn, F.; Johnson, D.W.; Minkkinen, K.; Byrne, K.A. How strongly can forest management influence soil carbon sequestration? Geoderma 2007, 137, 253–268. [Google Scholar] [CrossRef]
- State Forestry Administration (SFA). The “Thirteenth Five-Year”Planning of Forestry Development; State Forestry Administration: Beijing, China, 2016.
- Deng, X.Z.; Han, J.Z.; Zhan, J.Y.; Zhao, Y.H. Management strategies and their evaluation for carbon sequestration in cropland. Agric. Sci. Technol. 2009, 10, 134–139. [Google Scholar]
- China Green Times (CGT). Six Key Forestry Programs Promote the Development of China’s Forestry. Available online: http://www.zglyxww.com/greentimepaper/html/2003-09/27/content_149271.htm (accessed on 31 May 2017).
- Zhang, J.R.; Zeng, W.H.; Wang, J.N.; Yang, F.L.; Jiang, H.Q. Regional low-carbon economy efficiency in China: Analysis based on the Super-SBM model with CO2 emissions. J. Clean. Prod. 2015, 6, 1–10. [Google Scholar] [CrossRef]
- National Bureau of Statistics of China (NBSC). Chinese Statistics Yearbook 2016. Available online: http://www.stats.gov.cn/tjsj/ndsj/2016/indexch.htm (accessed on 31 May 2017).
Figure 1.
Spatiotemporal distribution of China’s forest biomass carbon storage (FBCS) comparing two five-year periods (1977–1981 and 2009–2013 inclusive). Blue and green bars displayed within the map itself compare regional totals for the two periods, with individual contributions from provinces within the regions shown in the individual barcharts.

Figure 2.
The relationship between FBCS and forest area in seven regions of China. Red and blue broken lines represented forest area and FBCS, respectively.
Figure 2.
The relationship between FBCS and forest area in seven regions of China. Red and blue broken lines represented forest area and FBCS, respectively.


Table 1.
Constants of major tree species in China’sarbor forests.
| Tree Type | a (Mg/m3) | b (Mg/ha) |
|---|---|---|
| Cunninghamialanceolata | 0.4652 | 19.1410 |
| Pinusmassoniana, P. yunanensis | 0.5034 | 20.5470 |
| P. koraiensis | 0.5723 | 16.4890 |
| Larix gmelinii | 0.6096 | 33.8060 |
| Picea asperata, Abies fabri | 0.5519 | 48.8610 |
| P. sylvestnis var | 1.1120 | 2.6951 |
| P. tabulaeformis | 0.8690 | 9.1212 |
| P. armandii | 0.5856 | 18.7440 |
| Other Pinus | 0.5292 | 25.0870 |
| Cypress | 0.8893 | 7.3965 |
| Mixed coniferous-broadleaf forest | 0.8136 | 18.4660 |
| Populus deltoides | 0.4969 | 26.9730 |
| Betula | 1.0687 | 10.2370 |
| Quercus Linn | 1.1453 | 8.5473 |
| Cinnamomum, phoebe nees, Castanopsis, Cyclobalanopsis | 0.9292 | 6.4940 |
| Eucalyptus | 0.8873 | 4.5539 |
| Mixed broadleaf and Sassafras | 0.9788 | 5.3764 |
| Casuarina equisetifolia | 0.7441 | 3.2377 |
| Tsuga, Cryptomeria, Keteleeria, etc. | 0.3491 | 39.8160 |
| Hardwood (Robinia pseudoacacia) | 1.1783 | 2.5585 |
| Tropical forests | 0.7975 | 0.4204 |
Table 2.
Changes in forest area, biomass carbon storage, density, carbon sink and net primary productivity (NPP) in China for seven five-year intervals over the period 1977–2013 and pooled carbon sink estimates for the period 1997–2013 (last row). Empty cells for the period 1977–1981 represent data gaps.
| Inventory Period | All Forest | Economic Forest | |||||||
| Area (104 ha) | Carbon Storage (Tg) | Carbon Density (Mg/ha) | Carbon Sink (Tg/a) | NPP (MgC/ha/a) | Area (104 ha) | Carbon Storage (Tg) | Carbon Density (Mg/ha) | Carbon Sink (Tg/a) | |
| 1977–1981 | 13,798 | 4972 | 36.0 | / | / | 1128 | 134 | 11.9 | / |
| 1984–1988 | 14,898 | 5178 | 34.8 | 29.5 | 0.21 | 1374 | 163 | 11.9 | 4.2 |
| 1989–1993 | 15,960 | 5731 | 35.9 | 110.6 | 0.72 | 1610 | 191 | 11.9 | 5.6 |
| 1994–1998 | 15,684 | 5781 | 36.9 | 10.1 | 0.06 | 2022 | 240 | 11.9 | 9.8 |
| 1999–2003 | 16,902 | 6293 | 37.2 | 102.3 | 0.63 | 2139 | 253 | 11.8 | 2.6 |
| 2004–2008 | 18,138 | 6862 | 37.8 | 113.8 | 0.65 | 2041 | 242 | 11.9 | −2.2 |
| 2009–2013 | 19,118 | 7435 | 38.9 | 114.6 | 0.62 | 2057 | 244 | 11.9 | 0.4 |
| 1997–2013 | 77.0 | 0.47 | 3.4 | ||||||
| Inventory Period | Arbor Forest | Bamboo forest | |||||||
| Area (104 ha) | Carbon Storage (Tg) | Carbon Density (Mg/ha) | Carbon Sink (Tg/a) | NPP (MgC/ha/a) | Area (104 ha) | Carbon Storage (Tg) | Carbon Density (Mg/ha) | Carbon Sink (Tg/a) | |
| 1977–1981 | 12,350 | 4717 | 38.2 | / | / | 320 | 121 | 37.8 | / |
| 1984–1988 | 13,169 | 4885 | 37.1 | 23.9 | 0.19 | 355 | 131 | 36.9 | 1.4 |
| 1989–1993 | 13,971 | 5402 | 38.7 | 103.5 | 0.76 | 379 | 138 | 36.4 | 1.4 |
| 1994–1998 | 13,241 | 5388 | 40.7 | −2.9 | −0.22 | 421 | 154 | 36.6 | 3.2 |
| 1999–2003 | 14,279 | 5862 | 41.1 | 94.9 | 0.69 | 484 | 177 | 36.6 | 4.6 |
| 2004–2008 | 15,559 | 6398 | 41.1 | 107.2 | 0.72 | 538 | 222 | 41.3 | 9.0 |
| 2009–2013 | 16,460 | 6943 | 42.2 | 109.0 | 0.68 | 601 | 248 | 41.3 | 5.2 |
| 1997–2013 | 69.6 | 0.49 | 4.0 | ||||||
Table 3.
Regression results of factors driving the FBCS.
| Variables | Value | Std. Error | t-Statistic | p-Value |
|---|---|---|---|---|
| Intercept | −56.77925 | 10.272784 | −5.527154 | <0.001 |
| Year (Control variable) | 0.02927 | 0.005277 | 5.546823 | <0.001 |
| Ln(DFL) | 0.61761 | 0.026348 | 23.440636 | <0.001 |
| Ln(IS) | 0.63554 | 0.027640 | 22.992923 | <0.001 |
| Ln(PCGDP) | 0.48533 | 0.043356 | 11.194027 | <0.001 |
| Ln(POP) | 0.51807 | 0.103449 | 5.007960 | <0.001 |
© 2017 by the authors. Licensee MDPI, Basel, Switzerland. This article is an open access article distributed under the terms and conditions of the Creative Commons Attribution (CC BY) license (http://creativecommons.org/licenses/by/4.0/).
Share and Cite
MDPI and ACS Style
Yang, J.; Ji, X.; Deane, D.C.; Wu, L.; Chen, S. Spatiotemporal Distribution and Driving Factors of Forest Biomass Carbon Storage in China: 1977–2013. Forests 2017, 8, 263. https://doi.org/10.3390/f8070263
AMA Style
Yang J, Ji X, Deane DC, Wu L, Chen S. Spatiotemporal Distribution and Driving Factors of Forest Biomass Carbon Storage in China: 1977–2013. Forests. 2017; 8(7):263. https://doi.org/10.3390/f8070263
Chicago/Turabian StyleYang, Jiameng, Xiaoxia Ji, David C. Deane, Linyu Wu, and Shulin Chen. 2017. "Spatiotemporal Distribution and Driving Factors of Forest Biomass Carbon Storage in China: 1977–2013" Forests 8, no. 7: 263. https://doi.org/10.3390/f8070263
Note that from the first issue of 2016, this journal uses article numbers instead of page numbers. See further details here.