Warning Signals of Adverse Interactions between Climate Change and Native Stressors in British Columbia Forests

1
Ministry of Forests, Lands and Natural Resource Operations, Skeena Region, Bag 6000, Smithers, BC V0J 2N0, Canada
2
FORCOMP Forestry Consulting Ltd., A-827 Queens Avenue, Victoria, BC V8T 4V8, Canada
3
BC Ministry of Forests, Lands, and Natural Resource Operations 5th Floor, 499 George St., Prince George, BC V2L 1R5, Canada
*
Author to whom correspondence should be addressed.
Forests 2017, 8(8), 280; https://doi.org/10.3390/f8080280
Submission received: 28 June 2017
/
Revised: 31 July 2017
/
Accepted: 1 August 2017
/
Published: 4 August 2017
Abstract
:We examine the direct effects of multiple disturbance agents on individual tree development and stand productivity in 15–40-year-old managed forests in British Columbia, Canada. Our primary interest was to establish a baseline assessment of damage in these forests and, especially, to focus on the degree to which biotic and abiotic stressors cause physical damage and diffuse mortality. Based on extensive climate data for the study area and the ecology of the disturbance agents we explore possible interactions between individual stressors and climate. Mean annual temperature increased by over 1 °C in the last century and annual precipitation increased by 8%, with that in the summer increasing by 18%. Disturbance agents were a central driver of mortality, growth and physical damage and their combined impact in lodgepole pine stands was as much as four times greater than expected particularly in the dominant trees most counted upon for stand productivity and timber supply. Climate-mediated disturbances accounted for five of the top six damage agent categories in terms of percent of basal area impacted but the lack of long-term disturbance monitoring data, a global information gap, limits our ability to conclusively link high damage rates to climatic changes.
1. Introduction
Evidence that the climate is already changing and prospects that it will continue to change even more rapidly in coming decades should be a major impetus to embrace a multi-scale perspective that will aid understanding of how forests and the services they provide are influenced by a continually changing climate [1,2]. Increased temperatures and changing precipitation regimes will directly and indirectly affect tree vitality and growth [3,4]. Rapid environmental changes directly alter tree phenology and physiology, and will ultimately affect species distributions [5,6]. Negative impacts of a changing climate on forests are most likely to be felt first through more frequent and more intense disturbances [7,8]. Altered temperature and precipitation regimes affect the ability of trees to resist insects and pathogens [9,10,11]. Physical damage to trees may also occur when climatic thresholds are crossed (e.g., [12]), for example heavy wet snow loading causing stem breakage and/or forking in trees [1]. Interactions among multiple disturbance agents have the potential to cause large, nonlinear unexpected changes in ecosystem structure and function [13], including reduced productivity in managed forests (e.g., [14]). Forest productivity responses to interactions between climate and disturbance are difficult to predict, and entail large degrees of uncertainty.
Gradual increases in chronic stressors as the climate warms will likely alter individual tree survival and growth with unknown consequences for ecosystem services at larger geographic scales [1,15,16]. This is especially the case for biotic and abiotic stressors such as insects, pathogens and extreme weather events, that cause damage and result in diffuse mortality in managed forests (e.g., [14,17]). The way that such damaging agents and events interact to cause a consistent response within a region and how such behavior is constrained or directed by climate is understood at only a general level [18]. In combination, multiple stressors could result in a major loss of forest productivity due to cumulative effects of stem mortality, reduced growth rates, and physical damage that reduces timber quality and value [19].
Forest pathogens are a prime example of chronic stressors that respond to climate change. Outbreak characteristics of many forest pathogens such as foliar diseases and rusts are sensitive to climatic conditions and are expected to increase in intensity or duration as the climate warms, especially if conditions become warmer and wetter [20,21,22]. Those same organisms may decline or remain unchanged in severity where conditions become drier [22]. In contrast, other pathogens such as root diseases and wound colonizers, that are primarily opportunistic and rely on poor host vigor may display greater virulence in areas where host trees become stressed by drought [22,23]. The pace of current climatic change coupled with the widening range in variability, particularly in precipitation, is creating environmental conditions where both drought and excess summer precipitation can occur in the same location, year over year.
As the climate changes, it is essential to understand the complex interactions occurring in managed forests as a result of changing disturbance drivers, which in turn determine long-term productivity. In our study, we examine the direct effects of chronic stressors on patterns of tree development in managed stands across a wide expanse of northern British Columbia (BC), Canada and explore the interactions that may be occurring between abiotic events, tree species, pests and pathogens under a changing climate. Our study area covers the northern most extent of large-scale commercial forest management in western North America and given that high-latitude ecosystems are expected to respond first to climate change [24] it represents the front line of where we might first expect climate change interactions with chronic stressors in managed forests. Even-aged pine stands dominate this landscape and they are considered especially vulnerable to a wide range of foliar diseases and stem rusts that are expected to expand over the coming decades [17,21,22].
In order to conclusively test a hypothesis as to whether or not the incidence and severity of disturbances across a managed forest landscape have increased over time due to climate change, a number of essential elements are required. Ideally, one would have a 60+ year time series of repeated measurements of managed stands replicated across the landscape following the same harvest techniques and management regime allowing for two 30-year periods (typical climate normals) of measure to compare and contrast. These data sets, in addition to tracking growth rates, would need to consistently monitor forest disturbances including the incidence and severity of attack of insects, disease and abiotic damage over the entire study period. Weather stations would also be required in each managed stand over that 60-year period, tracking daily temperature and precipitation, so that if a given insect, pathogen or abiotic event caused damage on that stand a relationship could be drawn between weather and the disturbance agent. Well documented relationships between each of the possible disturbance agents and weather would also need to exist, yet these remain for the most part poorly understood [25]. In our study area it is impossible to currently meet these high standards of hypothesis testing but our situation is not unique. Terrestrial disturbances are accelerating globally, but their full impact is not quantified due to the lack of an adequate monitoring system [26]. Based on over 100 years of monitoring, some of the most intensively studied managed forests, those of Central Europe, are reported to have experienced increased growth rates due to climate change [27], yet this study explicitly excludes plots damaged by storms or bark beetle infestations. Such reductionist approaches to monitoring forest dynamics, where disturbance damaged plots are removed from data sets, are the norm in traditional forestry [28].
Our objectives are to: (1) show how the climate of our study area has changed over the past century; (2) establish a baseline assessment of mid-rotation managed forests focusing on the variety, incidence, and severity of biotic and abiotic damage to individual tree species by size class considering climate change/disturbance interactions and their implications for future managed stand productivity; and (3) report warning signals associated with the degree to which chronic stressors under the influence of a changing climate may have already affected these forests so that, in the absence of conclusive evidence, forest managers make more proactive, informed decisions.
2. Materials and Methods
2.1. Study Area
Our study covers approximately 17.7 million hectares of gross land area across northern BC (Figure 1) of which 7.9 million hectares contributes to the long-term timber harvesting land base. Within each of seven management units our target population was managed stands between 15 and 40 years of age as of 2011, which were considered even aged in the provincial silviculture records database (RESULTS) and were equal to or greater than 5 ha in size. The combined target population included 6418 stands representing 188,626 ha.
The majority of the study area was within an elevational range of 400–1200 m in the Sub-Boreal Spruce (SBS) biogeoclimatic zone [29], an ecological zone with a continental climate moderated by Pacific Ocean moisture. Mean annual precipitation across the study area is 574.5 mm with greater amounts at higher elevations. Spring is typically the driest season with precipitation evenly distributed among the remaining seasons. Approximately 40% of annual precipitation falls as snow with accumulations on the ground for 4–6 months of the year. Summers are relatively wet, averaging over 150 mm (Table 1), with much of that in the form of convective rainfall. The mean annual temperature of the study area is 2.9 °C, but there is a large range with summer maximum temperatures commonly reaching 30 °C and winter minimum temperatures below −30 °C, and as low as −40 °C in northern portions.
2.2. Climate Data Analysis
We created annual and seasonal climate summaries using Environment Canada daily weather data from 44 weather stations located across the study area (Figure 1). All weather stations used in our study had a minimum of 10 years of data. The station with the longest continuous daily weather record, Ft. St. James BC, covered over 113 years. As part of previous work using a similar dataset for all of northern BC [30], annual weather data for mean precipitation, mean temperature, extreme maximum temperature, and extreme minimum temperature were assessed for their distribution using Shapiro Wilks, Anderson-Darling, and Pearson chi-square tests. Likelihood of distribution normality was determined based on two of the three tests being passed for each of close to 600 data sets, and 95% of the data passed. A subset of seasonal weather data was also tested for normality using the same methods that showed similar results. The results of these earlier tests of normality indicated the use of linear regression was appropriate so we conducted a trend analysis for each weather station in our study to calculate the degree of change over time for each annual and seasonal climate variable using linear regression. Weighted averages were then used to calculate change over time across the study area with weights based on weather station record length.
2.3. Sampling Design and Stand Data Collection
Our sampling design was a two-stage cluster sample within management units. The first stage involved sampling stands and the second stage involved sampling trees within each stand using a series of fixed radius plots. Individual management units were considered as strata and were combined to represent the entire study area. Stands were randomly selected with each stand having the same probability of selection from the target population in each individual management unit and were surveyed from 2011 to 2013. The mean age of our sample stands was 23 years, based on the last date of harvest of the previous mature stands.
Forest cover maps were obtained for each of the sample stands. GPS grid intersection points were mapped at 100 m intervals throughout each sample stand and then 10 of these grid points were randomly selected. At each selected grid point a 3.99 m radius (50 m2) circular plot was established. In each plot, all live and dead trees taller than 1.3 m were tallied by species. Live and dead trees ≥7.5 cm dbh were measured for dbh to the nearest 0.1 cm and up to four trees in this grouping were measured for height (to the nearest 0.1 m) in each plot.
The focus of our study was on chronic disturbance agents, the biotic or abiotic stressors that reduce growth, cause physical defect affecting log merchantability (e.g., broken top, fork) or cause death of a tree, however, all disturbance agents that exceeded established damage criteria were recorded based on the Stand Development Monitoring (SDM) Damage Criteria [31]. All trees, including those that were dead, were assessed for presence of damage by disturbance agents. If a tree was affected by more than one disturbance agent, the agent considered the most severe or most likely to cause mortality was recorded. To definitively determine cause of tree death when multiple agents may have been involved is challenging but we tried to do so. We maintained a separate count of trees affected by severe competition. We used two standard forestry metrics to quantify competitive stress in live trees in each plot. Trees with crown depths of less than 20% or trees with height to diameter ratios of greater than 100 were identified as individuals suffering from severe competition. Overtopped dead stems with no evidence of damage were tallied under competition.
We merged the disturbance agents into three broad groupings (Killers, Maimers and Growth Reducers). The groupings were based on a combination of literature review and professional opinion. Those agents that typically result in mortality in larger trees (≥7.5 cm dbh) were referred to as agents that kill (Killers). Disturbance agents that typically result in stem defects and less commonly result in mortality in larger trees were referred to as agents that maim (Maimers). Many of these agents significantly reduce saw-log lumber recovery to the point that the logs become uneconomical to transport to manufacturing facilities [32]. Growth Reducers were those agents that reduced growth, but rarely maimed or killed larger trees.
We looked at the individual species lodgepole pine (Pinus contorta Douglas & Loud. var latifolia Engelm ex S. Wats), interior spruce [cross of white spruce (Picea glauca Moench Voss) and Engelmann spruce (Picea engelmanii Parry ex Engelm)], subalpine fir (Abies lasiocarpa (Hook.) Nutt.) and trembling aspen (Populus tremuloides Michx.), and at all species combined. Stems per hectare (SPH) and basal area (BA, m2/ha) were calculated for each species and disturbance agent group and further subdivided into the following size classes: >1.3 m tall and <7.5 cm dbh (SPH only), ≥7.5 cm dbh, 7.5 to 12.4 cm dbh, 12.5 to 17.4 cm dbh, and ≥17.5 cm dbh.
Sample data were put through a rigorous data validation process to check for errors, such as missing tree species, missing disturbance agent information, missing tree measurements and inconsistency between the individual tree and summarized tree data that were recorded for each sample plot. Any errors that could not be reconciled resulted in plots within a sample stand being dropped. The resultant dataset was 176 stands, with 165 stands retaining all 10 plots; 9 stands retaining nine plots; one stand retaining eight plots; and one stand retaining five plots. Our sample of 176 stands represents a sampling intensity of 2.7% of stands and 2.6% of the target population area (Table 2).
2.4. Data Analysis
Our analysis consisted of two phases; the first was by individual management units while the second combined all management units. The first phase used tree level weights derived from the area of the stand, the number of plots in a stand and the area of the plots to account for the probability of selection for trees in the second stage of sampling. In the first phase we subdivided data within each management unit by species, size class and disturbance agents into domains [33]. Domain analyses are used when survey data are subdivided into sub-populations of interest that were not part of the original survey design. In our study, these sub-populations included tree species, size class, health status and various combinations of each. The number of observations that fall into a domain is unknown until sampling has been completed. As such, the sample size of a domain is a random variable with a value that is unknown at the time the survey was designed [33]. All estimators, including those for domains matched the resultant stratified two-stage cluster design. Point estimates and standard errors were calculated for domain totals. We then used proportions, based on the number of affected trees to the total number of trees, to define the incidence of disturbance agents by species and diameter class. We used ratio estimation to calculate proportions and standard errors for various tree specific domains. All standard errors were based on the first stage (stand) sampling totals and the within stand variation was ignored under the assumption that it did not significantly contribute to the overall variation. This assumption is common practice [33].
In the second phase of the analysis we combined all management units treating them as strata. We then calculated point estimates and standard errors for the combined domain totals and used a combined ratio estimator to calculate proportions and standard errors for various tree specific domains. We used the same domain and standard error assumptions as the first phase of the analysis. With the exception of our simple tree counts (Table 5 and Appendix A), all other reported results are based on this second phase analysis. A more detailed description of our data analysis complete with formulae is provided in Supplementary Materials.
3. Results
3.1. Climatic Trends in Northern BC
Across the study area mean annual temperature has increased by 1.1 °C since 1895, with the greatest change occurring in winter (2.2 °C), but all seasons have experienced statistically significant increases (p < 0.05) (Table 3). The majority of this change has been driven by increases in minimum temperatures. Annual precipitation has increased by 7.8%, and on a seasonal basis, summer precipitation has increased the most, by 18.3%, though both spring and fall precipitation has also increased significantly. Winter precipitation has decreased but the change was not statistically significant. The increase in winter mean and minimum temperatures could result in generally wetter and heavier snowfalls. Since the mid-1990s, at least two extreme snowfall events have occurred in late fall, in early November 1996 and late October 2006, with several weather stations recording their highest daily snowfalls on record. These two events were widespread across the study area. Several stations received more than 70 cm of snow in less than 24 h. In general, conditions during the growing season have become warmer and wetter while any trends involving extreme snowfall events are more difficult to detect.
3.2. Tree Species Composition and Structure, Disturbance Agents and Competition
We examined 32,881 trees representing 12 different tree species (Table 4). Lodgepole pine was the dominant species in 64.8% of our sample stands, while interior spruce, subalpine fir and trembling aspen were the dominant species in 29.0, 4.5 and the remaining 1.7% of sample stands, respectively. Lodgepole pine and interior spruce represented over 67% of all tallied trees, 87% of all trees ≥7.5 cm dbh and 88% of trees ≥12.5 cm (Table 4). These two are the most commonly planted tree species after logging in northern BC. In general, the larger sized pine and spruce in a stand would be planted trees. The remaining trees, primarily natural ingress after logging, included subalpine fir, trembling aspen, black cottonwood (Populus trichocarpa Torr. & A. Gray), paper birch (Betula papyrifera Marsh.), Douglas fir (Pseudotsuga menzisii (Mirb.) Franco), western hemlock (Tsuga heterophylla (Raf.) Sarg.), western redcedar (Thuja plicata Donn ex D. Don), black spruce (Picea mariana (Mill.) B.S.P.), mountain hemlock (Tsuga mertensiana (Bong.) Carrière) and amabilis fir (Abies amabilis Douglas ex Forbes).
We observed 33 different disturbance agents that negatively impacted individual tree merchantability and survival and this wide variety of disturbance agents is one of the key findings from our study (Table 5).
Based on simple tree counts across all management units, tree species and diameter classes, 17.7% of sampled trees were damaged beyond established criteria (Table 5). These trees are unlikely to reach rotation age (due to agents that kill) or are so damaged they would be culled at time of harvest or have significant losses in milling operations (due to agents that maim) [32]. The majority (65%) of damaged trees ≥7.5 cm dbh were affected by agents that maim, including scarring from animal feeding, forks and broken tops due to abiotic events such as heavy snowfalls, forking caused by insect feeding on tree leaders and disease induced defects including western gall rust stem infections. Since maiming agents do not typically kill larger trees, their incidence in stands tends to increase over time.
Although the disturbance agents we deemed more likely to maim could also kill trees, the majority (96%) of the mortality they caused occurred in small trees <7.5 cm dbh (Appendix A). Disturbance agents that we deemed killers also killed mostly small trees but in contrast to agents that maimed, killer disturbance agents continued to cause mortality in the larger diameter classes. Nineteen percent of the trees killed by these more lethal disturbance agents were ≥7.5 cm dbh. Out of the total count of dead trees we were able to identify the most probable cause of death in 87% of the instances (Appendix A). The mountain pine beetle was the leading large tree killer, responsible for 59% of all mortality in trees 7.5 cm dbh and greater. Comandra blister rust was the leading forest pathogen responsible for 8% of the mortality in trees over 7.5 cm dbh.
Using area weighted mean estimates of tree density across all diameter classes and tree species combined, disturbance agents affected close to twice the number of trees that severe competition negatively impacted, accounting for 17.3% of all compromised trees, while severe competition was responsible for 9.1% overall (Table 6). In trees ≥7.5 cm dbh, disturbance agents accounted for >99% of all compromised trees. Of the trees that were considered undamaged based on existing damage criteria, 66% were < than 7.5 cm dbh, leaving the density of acceptable, undamaged stems of all species ≥7.5 cm dbh at 838 sph (Table 6). The density of undamaged lodgepole pine and interior spruce ≥7.5 cm dbh was just 713 sph (Appendix B).
3.3. Tree Species-Specific Relationships
There were species-specific differences among tree species in the incidence and severity of damage by the various disturbance agents. Combined, disturbance agents damaged 27% of lodgepole pine trees across all diameter classes compared to rates of 6% for interior spruce and 5% for subalpine fir (Appendix B). Lodgepole pine trees ≥7.5 cm dbh were disproportionately affected by some non-species specific disturbance agents including snow-press (86% of all snow-press affected trees). Damaged pine were commonly affected by species-specific disturbance agents including western gall rust, comandra and stalactiform blister rusts and mountain pine beetle. Most importantly, five of the top six damage agent categories in terms of percent of basal area impacted (Killer Abiotics, Insects and Diseases and Maimer Defects and Diseases) may have been influenced by the climatic changes that have already occurred (Table 7). The combined losses to killing agents alone totaled 9.1% of the basal area of lodgepole pine, while sub-lethal losses to maiming agents resulted in a further reduction of 16.4%.
3.4. Disproportionate Damage Among Tree Species and Tree Sizes
Damage was neither uniform among tree species nor was damage evenly distributed among all tree size groupings. Responses were unique to specific combinations of tree species, disturbance agent and tree size. When we combined all disturbance agents and the effects of competition across all species and tree sizes we found the highest incidence of compromised stems occurred in the smallest tree size class (<7.5 cm dbh and >1.3 m tall), and lodgepole pine was by far the most frequently affected species overall. Close to 50% of lodgepole pine trees in the smallest size class were compromised (Figure 2). This rate of damage and loss within the smaller pine trees casts doubt on their availability to be recruited into the larger diameter classes over time. The causal agents responsible for losses in the smallest diameter class were roughly evenly distributed between severe inter-tree competition, agents that maimed and those expected to kill. Of greater importance for future timber productivity, we found close to 30% of lodgepole pine trees in each of the two largest diameter classes were unacceptably damaged by a combination of killing and maiming agents (Figure 2).
For lodgepole pine and interior spruce, the percent of trees ≥7.5 cm dbh that were damaged by disturbance agents increased as their diameter class increased (Figure 2). In lodgepole pine, losses to killing insects (primarily mountain pine beetle) and defects such as broken tops and forks showed the clearest increase as diameter increased. In the largest trees of this species, those > 17.5 cm dbh, 11% of the basal area was attacked by killing insects and 7% of pine basal area was affected by stem defects (Table 7). These stem defects are often the result of extreme snowfall events and as trees age the probability of a tree being exposed to such events increases. In spruce, maiming insects such as the spruce leader weevil appeared to contribute most to the trend of increasing damage in larger diameter class trees.
3.5. Combined Losses to Biotic and Abiotic Damage Agents vs. Expected Rates of Loss
Managed forest yields in BC are predicted using the growth and yield application TIPSY [34]. Losses from abiotic and biotic events are assumed to occur at stable rates of three and four percent, respectively, throughout the rotation period, though data to support these assumptions is lacking. Only in the few stands dominated by subalpine fir did the rates of loss to abiotic and biotic damage that we observed match that which is assumed to occur in these managed stands (Figure 3). In lodgepole pine stands we found the percent of basal area of trees affected by killing agents alone matched or exceeded the expected values in all three diameter classes and the gap between expected and observed loss rates appeared to increase with tree diameter. When losses to maiming agents were combined with those of agents that tend to kill we found rates of loss in terms of percent basal area damaged four times greater than expected in the two largest diameter classes (Figure 3).
3.6. Uncertain Condition of the Largest Trees in Population of Trees ≥7.5 cm dbh
Given the overall trend of increasing levels of damage in larger diameter trees (Figure 2 and Figure 3), we looked more closely at the extent and variability of damage in top height trees (the largest 100 dbh trees per ha) and crop trees (the largest 800 dbh trees per ha) in contrast to the population of all trees ≥7.5 cm dbh. We did this for the most commonly planted tree species, lodgepole pine and interior spruce, and for all tree species combined. If damage was evenly distributed across tree sizes, then the percent basal area damaged in the top 100 and 800 trees per ha 1:1 graphs should be the same. One stand had no trees with a dbh >7.5 cm so our sample in this analysis was based on 175 stands. Top height trees are commonly used to estimate site productivity, guide model projections of future yield and are generally considered free of damage but we found this not to be the case in approximately half (85 of 175 stands) of the stands we assessed (Figure 4, note horizontal cluster of data points representing no top height tree damage). Instead, we found strong evidence of greater variability in damage and, in more than one third of the stands (64 of 175 stands), more damage in top height trees regardless of tree species (Figure 4).
The greatest uncertainty was observed for lodgepole pine top height trees (Figure 4). Top height pine trees in a given stand could be completely free of damage or could have as much as 100% of their basal area impacted. The range of uncertainty narrowed as the largest diameter trees came from a larger pool, from the largest 200 (data not shown), largest 400 (data not shown) to the largest 800 diameter trees per ha. The percent basal area damaged in top height trees was often much greater than that for all trees ≥7.5 cm dbh, whereas for crop trees (largest 800 sph), the percent basal area damaged was virtually the same as the percent of basal area of all trees ≥7.5 cm dbh (Figure 4).
4. Discussion
A changing climate is probably one of the most critical external drivers of forest dynamics [4]. The climate of northern latitude forests in British Columbia, Canada, has been steadily changing since monitoring began in our study area (1895) and increasingly so since the 1970s [35]. Through our analysis of climatic data from over 40 weather stations we found that mean annual temperature has increased more than 1 °C since 1895 and annual and summer precipitation amounts have increased by 8% and 18%, respectively. We cannot say conclusively whether those climatic changes are largely responsible for the high levels of damage observed in 15–40 year-old managed stands because we do not have a baseline record of forest disturbance to compare to. A consistently monitored cohort of managed stands where disturbance agent incidence and impacts were tracked for decades does not exist. Our inability to directly compare our results to long-term records of disturbance is in part a reflection of a shortcoming found throughout traditional forestry where forest disturbances, if acknowledged at all, are often seen as insignificant (see [36]). Science is, however, starting to view forest ecosystems as integrated social-ecological systems [37] and adequate data on forest health status globally is increasingly being seen as a key information gap [25].
In the absence of a consistent long-term record of forest disturbances we turned to the growing body of literature that supports possible links between climatic changes and increased forest disturbance. Warmer and wetter conditions in spring and summer months favor hard pine rusts [38,39,40], the dominant forest pathogens we observed, which combined affected 15% of all lodgepole pine trees. In the only prior extensive survey of forest disturbances in managed stands in BC, a study conducted in the early 1990s, 6% of pine trees were found to be affected by hard pine rusts across the SBS zone [41]. This 1990s study along with other evidence has already been used to support the suggestion that the landscape level incidence of hard pine rusts in the central interior of BC is increasing [42].
Modeling has shown that an increase of only 1 °C in the average temperature adequately warms the climate to convert many spruce leader weevil hazard zones to high hazard [43] and we observed over 11% of the basal area of the largest spruce trees were unacceptably damaged by this insect. Warmer winters have been clearly linked to the mountain pine beetle epidemic in BC [44], which was the leading large tree killer we observed. Extreme snowfall events damage and can even kill trees and the probability of their frequency increasing with climate change in some areas of western North America has been suggested [45]. We cannot compare our results of snow-pressed and broken topped trees to earlier records as once again they do not exist. However, given the magnitude and direction of climatic change already experienced and the documented relationships between these environmental changes and the behavior of chronic abiotic and biotic stressors, increased rates of disturbance and resulting damage would be expected. For the most dominant tree species, lodgepole pine, five of the top six damage agent categories (Killer Abiotics, Insects and Diseases and Maimer Defects and Diseases) may have been negatively influenced by the climatic changes that have already occurred across our study area.
We observed particularly high levels of damage in lodgepole pine dominated stands where, on average, 27% of the trees were unacceptably damaged. Extensive damage to individual pine trees in older operational plantations or in replicated experiments has also been observed in other BC studies [14,19,40,46] and has been forecast to intensify under climate change [17]. We found that rates of loss for pine due to killing agents alone either matched the expected rate of loss (TIPSY projections [34]), or were as much as twice as high as expected in the largest diameter trees. When losses due to maiming agents were included we found overall rates of loss more than four times greater than expected. Adding to the uncertainty in future stand productivity forecasts is the fact that not all maimed tree volume is lost. Damaged trees with poor stem form significantly reduce saw-log lumber recovery and from a timber productivity viewpoint represent a loss of growth, similar to non-lethal growth reductions associated with pathogens such as root disease, which are difficult to model [47]. We cannot state with certainty that the higher than expected rates of loss we observed have been influenced by climatic changes. We do not know if the TIPSY loss projections used to be correct and that damage used to be at a lower level because the manner in which those loss estimates were derived is poorly documented and again, we lack long-term records of damage. The average age of our sample stands was 23 years and the average site index was 19.2 m so the fact that just over 1000 sph of the trees in these stands were greater than 7.5 cm dbh is consistent with TIPSY projections [34], but just over 700 sph of lodgepole pine and interior spruce trees of that size were considered undamaged and this is cause for concern.
Competition has been long considered the primary driver of forest dynamics in even-aged stands [48] but few long-term studies exist to test this assumption [49]. As forest scientists perceive that climate change is significantly impacting forests, there is now a debate as to whether competition or climate is the most important driver of forest dynamics. For example, Zhang et al. [50] concluded, after examining extensive permanent sample plot data across western Canada, that competition was the primary factor causing long-term changes in tree mortality, growth and recruitment and that external climate factors were less important. Price et al. [51] replied, among other concerns, that Zhang et al. [50] overlooked the critical role of climate-sensitive disturbance in their conclusions. We believe this debate cannot be resolved without an actual examination of the causal agents of damage in stands. In the 15–40-year-old stands we studied, it was clear that disturbance agents, and not competition, were the dominant driver of forest dynamics (mortality, growth and physical damage), especially for the dominant trees most counted upon for stand productivity and timber supply. Similar to the work of Lutz and Halpern [49] we found losses to competition were only a factor in the smallest trees.
Our results also contribute to the emerging observation of increasing levels of damage as tree size increases among the larger sized trees in plantations [14,46,52]. This interaction between tree size and damage among the larger trees was most obvious for pine, spruce and aspen and less so for subalpine fir. The trend of increasing damage in larger diameter trees was clearest when the cumulative effect of all disturbance agents was examined. Individual disturbance agents may or may not have damaged larger trees more severely. Reid et al. [46] suggested several mechanisms that might explain why larger or faster growing trees in plantations are more prone to damage from disturbance agents including resource allocation targeted at tree growth at the expense of defense. Faster growth in lodgepole pine has been related to a larger surface area of host tissue susceptible to western gall rust infections [53]. We agree with Burma [13] that disturbance interactions should be studied as emergent phenomena, separate from studies of individual disturbance events and disturbance types. As climate changes, trees might be expected to grow faster at northern latitudes [35], where summers are projected to be, and our data shows, are warmer and wetter. These same environmental changes have, however, been linked to increases in negative interactions among chronic biotic stressors such as foliar diseases and rusts [39].
We looked more carefully at a subset of lodgepole pine and interior spruce trees for evidence of size dependence in damage incidence among the largest diameter 100 trees per ha, a grouping of trees commonly used to predict stand productivity in even-aged stands (top height trees). Top height trees are typically assumed to suffer little damage [54] but we found this not to be the case in approximately half (85 of 175 stands) of the stands we assessed. We also found strong evidence of greater variability in damage and, in more than one third (64 of 175 stands) of the stands, more damage in top height trees. The high incidence of unacceptable damage to larger diameter trees in general, and the unexpected high damage levels observed on top height trees compared to the general population is completely contrary to expectations based on the foundational tenets of stand productivity for even-aged stands [36].
The increased variation in the percent of basal area damaged in the largest trees that we observed challenges long-held growth and yield beliefs [14] and may represent something more fundamental. Increased variance around a stable state, such as stand productivity, caused by chronic stressors, or slow drivers of internal change, may indicate the presence of a regime shift or a tipping point [1,55]. Shifts in climate are arguably the most pervasive slow drivers of ecological change and regime shifts [56]. Pests, pathogens and abiotic agents can be considered forcing factors capable of causing consequences of similar magnitude to climate forcing factors [16]. The effect of multiple forcing agents on tree community productivity may drive shifts in the relative dominance of the component species, with potential ecosystem-level consequences [57,58].
Lodgepole pine-leading stands in northern BC appear to be undergoing a gradual regime shift (c.f., [56]) from productive high yielding systems to pest and damage prone low yield systems aided and abetted by a changing climate. Extensive pine mortality caused by Dothistroma needle blight (Dothistroma septosporum (Dorog. Morelet) in pine-leading stands to the west of our study area [9] have resulted in near complete loss of dominant pine trees in severely affected stands. The combination of physical damage, growth reductions and diffuse mortality observed in pine-leading stands across northern BC are likely to have long-lasting legacies for stand productivity. As multiple chronic stressors overcome the ecological resilience of a system, alternate stable states are possible. The challenge of identifying such regime shifts in forests is difficult due to their slow development.
One of the great problems with the type of gradual regime shift we have described, in contrast with a rapid regime shift, is a social one: convincing enough people to confront business-as-usual before time runs out to reverse unwanted gradual regime shifts [56]. Gradual regime shifts are much more likely to go unnoticed or to be ignored. Slow regime shifts provide a false sense of security, effectively concealing evidence of poorly thought out management practices and providing little warning of future declines [56].
In addition to the slow regime shift occurring in pine stands, we think we have also identified evidence of a social ecological tipping point brought on by the interaction of management practices, disturbance agents and climate change that can reduce timber supply and decrease stability in resource dependent communities unless addressed. This tipping point has been driven by management practices that focused on establishing lodgepole pine leading stands with an expectation of low levels of damage and mortality for individual trees once plantations reached the free-growing stage, an administrative test at about 8–12 years post-planting [59]. Our current study in northern BC and earlier studies in southern BC [14,19] have shown troubling surprises in declaring success too early in stand development. The expected crop trees experienced far less damage at the earlier assessments [14,19] and in contrast to forest management expectations, disturbance agents enhanced by a changing climate have caused the greatest damage to some of the largest diameter trees in mid-rotation stands. Our results highlight the importance of considering the different demographic stages of stand development to understand the effects that climate change may exert on individual trees, species population dynamics, susceptibility to disturbance agents and loss of productivity. This unpredictability of productivity expectations in mid-rotation stands coincides with a major decline in timber supply caused by the mountain pine beetle epidemic [60], adding to an already difficult situation for timber supply in the near term throughout pine dominated management units in the interior regions of BC.
The interactions between stand development and pests, pathogens and abiotic events are complex and poorly understood in the context of climate change. Current yield models used in forestry typically do not account for these processes and interactions and often ignore the effect of multiple slow stressors that are having a cumulative impact on growth rates, physical damage and mortality in managed stands. Unless these impacts are accounted for in models, their yield projections will be increasingly unreliable as climate continues to change [4]. The prediction of the future states of trees, stands and landscapes cannot be made with precision. The tools that we use or develop should incorporate and accept this inherent inability to predict precisely the future and acknowledge that changes or adaptation to known and unknown future conditions are not only something that we must accept, but rather something that has to be promoted and planned from the outset in management plans [61]. Under this new paradigm, management interventions would not be aimed at reaching a precise objective or goal in the future but instead aimed at making sure the system (or the forest) has all of the elements to continue to change and adapt to produce desirable goods and services in the future [62]. This new take on sustainability would focus on the avoidance of irreversible change and loss of resiliency and would ensure future options remain open [63].
Our results clearly point to higher levels of uncertainty associated with the productivity of managed forests and thus future timber supply. The fate of sub-lethally damaged trees and the timber volume they represent adds considerably to this uncertainty. Although we cannot definitively link the extensive damage that we found to the climatic changes that have already occurred we hope our work can serve as a warning which if heeded will lead to more proactive forest management decisions. Forest managers need to consider and evaluate the short- and long-term viability of specific practices in a framework that minimizes risk and reduces the chance of undesirable future outcomes.
5. Conclusions
The climate of northern BC, Canada has changed becoming warmer and generally wetter. Our extensive field surveys of 15–40 year old managed stands across this land base indicate a wide variety and unexpectedly high incidence of damage to individual trees caused by biotic and abiotic disturbance agents. The extent of damage, particularly in the largest trees of the preferred managed species, lodgepole pine, underscores the uncertainty associated with future stand productivity given the complex interactions we observed. In the absence of long-term monitoring data, extensive surveys of current stand conditions, with an emphasis on the incidence and type of damage, as well as traditional tree growth measurements, provides our best chance of closing the information gap and capturing the data needed to make timely informed forest management decisions in an era of rapid climate change.
Supplementary Materials
The following are available online at www.mdpi.com/1999-4907/8/8/280/s1.
Acknowledgments
We thank District staff of the BC Ministry of Forest Lands and Natural Resource Operations for their diligence and hard work in collecting all field data. We thank Russell Klassen for the creation of the database that housed the field data and for his assistance in cleaning and manipulating the data. We also thank Peter Ott for his advice regarding the analysis of the data. Finally, we thank the anonymous reviewers whose suggestions greatly improved this manuscript. This work was publicly funded but did not receive any specific grant from funding agencies in the public, commercial, or not-for-profit sectors. Publishing costs covering open access was publicly funded.
Author Contributions
As lead author Alex Woods conceived and lead the development of the survey protocol and lead the writing of the manuscript. Dave Coates contributed greatly to the writing, drawing from his extensive knowledge of silviculture and stand dynamics. Martin Watts analyzed the stand level survey data after rigorously checking it for errors. Vanessa Foord analyzed the climate data and Erin Holtzman manipulated the stand survey data, error checked and produced tables and graphics used in the manuscript.
Conflicts of Interest
The authors declare no conflict of interest.
Appendix A

Table A1.
Counts of dead trees by diameter class caused by severe inter-tree competition, disturbance agents or by silvicultural treatments, from 176 randomly selected stands across northern BC, Canada.
Table A1.
Counts of dead trees by diameter class caused by severe inter-tree competition, disturbance agents or by silvicultural treatments, from 176 randomly selected stands across northern BC, Canada.
| # Trees Killed | |||||
|---|---|---|---|---|---|
| Diameter Class (cm) | |||||
| <7.5 | 7.5–12.4 | 12.5–17.4 | ≥17.5 | Total | |
| Severe inter-tree competition | 640 | 2 | 0 | 1 | 643 |
| Agents that Maim | |||||
| Western gall rust (Endocronartium harknessii) | 212 | 9 | 0 | 0 | 221 |
| Spruce leader weevil (Pissodes strobi) | 4 | 0 | 0 | 0 | 4 |
| Fork, Dead/Broken top | 5 | 0 | 0 | 0 | 5 |
| Moose (Alces alces) | 133 | 0 | 0 | 0 | 133 |
| Snowshoe hare (Lepus americanus) | 12 | 0 | 1 | 0 | 13 |
| Douglas squirrel (Tamiasciurus douglasii) | 23 | 0 | 0 | 0 | 23 |
| Porcupine (Erethizon dorsatum) | 13 | 1 | 2 | 0 | 16 |
| Black bear (Ursus americanus) | 2 | 5 | 0 | 1 | 8 |
| Unknown mammal | 17 | 0 | 0 | 0 | 17 |
| Agents that Kill | |||||
| Comandra blister rust (Cronartium comandrae) | 389 | 17 | 3 | 0 | 409 |
| Stalactiform blister rust (Cronartium colesporioides) | 22 | 1 | 0 | 0 | 23 |
| Tomentosus root disease (Onnia tomentosa) | 2 | 0 | 0 | 0 | 2 |
| Mountain pine beetle (Dendroctonus ponderosae) | 3 | 40 | 81 | 19 | 143 |
| Warren root collar weevil (Hylobius warreni) | 36 | 4 | 0 | 0 | 40 |
| Engraver beetles (Ips spp.) | 0 | 1 | 0 | 0 | 1 |
| Snowpress | 136 | 15 | 2 | 0 | 153 |
| Fire | 14 | 3 | 0 | 0 | 17 |
| Windthrow | 1 | 0 | 0 | 1 | 2 |
| Flooding | 1 | 2 | 0 | 0 | 3 |
| Unknown, Unidentified Damage Agent | 306 | 17 | 1 | 4 | 328 |
| Silviculture treatments | 317 | 5 | 1 | 0 | 323 |
| Total Dead trees | 2288 | 122 | 91 | 26 | 2527 |
Appendix B
Table A2.
Area weighted mean estimates of stem density in stems per hectare (including standard errors) by disturbance agent and diameter class for the major tree species across 176 randomly selected stands in northern BC, Canada. Note: Some disturbance agent groups did not impact some tree species and blank rows were removed from the table.
| Diameter Class (cm) | ||||||||||
|---|---|---|---|---|---|---|---|---|---|---|
| <7.5 | 7.5–12.4 | 12.5–17.4 | 17.5+ | All Trees | ||||||
| Stems | % | Stems | % | Stems | % | Stems | % | Stems | % | |
| Lodgepole pine | ||||||||||
| Live No Damage | 406.1 (19.9) | 52.0 | 341.8 (6.8) | 79.6 | 147.2 (5.6) | 71.4 | 21.0 (0.9) | 69.8 | 916.2 (26.5) | 63.3 |
| Competition | 135.3 (14.6) | 17.3 | 0.8 (0.4) | 0.1 | 0.0 (0.0) | 0.0 | 0.0 (0.0) | 0.0 | 136.1 (16.5) | 9.4 |
| Killer-Abiotic | 33.2 (10.8) | 4.3 | 8.9 (1.9) | 2.1 | 1.0 (0.4) | 0.5 | 0.6 (0.2) | 2.1 | 43.8 (12.3) | 3.0 |
| Killer-Disease | 45.8 (8.7) | 5.9 | 11.6 (1.9) | 2.7 | 3.9 (1.2) | 1.9 | 0.0 (0.0) | 0.0 | 61.3 (10.6) | 4.2 |
| Killer-Insects | 2.8 (0.8) | 0.4 | 7.0 (2.4) | 1.6 | 15.5 (5.0) | 7.5 | 2.9 (0.9) | 9.5 | 28.1 (9.8) | 1.9 |
| Killer-Unknown | 14.4 (2.8) | 1.8 | 1.3 (0.5) | 0.3 | 0.1 (0.1) | 0.0 | 0.0 (0.0) | 0.0 | 15.8 (2.8) | 1.1 |
| Maimer-Animal | 31.7 (9.4) | 4.1 | 6.1 (2.1) | 1.4 | 3.6 (1.7) | 1.7 | 0.2 (0.1) | 0.7 | 41.6 (9.8) | 2.9 |
| Maimer-Defect | 12.5 (2.5) | 1.6 | 9.6 (1.7) | 2.2 | 11.0 (1.7) | 5.3 | 2.3 (0.6) | 7.5 | 35.3 (4.2) | 2.4 |
| Maimer-Disease | 86.2 (9.6) | 11.0 | 40.2 (4.8) | 9.3 | 23.3 (3.3) | 11.3 | 2.9 (0.5) | 9.7 | 152.6 (15.4) | 10.6 |
| Maimer-Insect | 2.7 (1.4) | 0.3 | 1.2 (0.4) | 0.3 | 0.6 (0.4) | 0.0 | 0.0 (0.0) | 0.0 | 4.5 (1.9) | 0.3 |
| Maimer-Treatment | 7.1 (6.1) | 0.9 | 0.9 (0.5) | 0.2 | 0.1 (0.1) | 0.0 | 0.0 (0.0) | 0.1 | 8.1 (6.2) | 0.6 |
| Reduced Growth | 2.6 (1.2) | 0.3 | 0.1 (0.1) | 0.0 | 0.1 (0.1) | 0.1 | 0.1 (0.1) | 0.4 | 3.0 (1.2) | 0.2 |
| Total | 780.5 (101.6) | 429.5 (45.8) | 206.3 (28.5) | 30.1 (7.4) | 1446.4 (156.7) | |||||
| Interior spruce | ||||||||||
| Live No Damage | 476.2 (22.1) | 81.5 | 138.6 (2.4) | 94.7 | 49.5 (2.7) | 91.1 | 15.0 (1.4) | 80.7 | 679.3 (21.7) | 84.5 |
| Competition | 75.9 (21.7) | 13.0 | 0.0 (0.0) | 0.0 | 0.0 (0.0) | 0.0 | 0.0 (0.0) | 0.0 | 75.9 (22.5) | 9.4 |
| Killer-Abiotic | 13.6 (2.7) | 2.3 | 0.2 (0.1) | 0.1 | 0.1 (0.1) | 0.3 | 0.0 (0.0) | 0.0 | 13.0 (2.4) | 1.7 |
| Killer-Disease | 0.3 (0.3) | 0.1 | 0.0 (0.0) | 0.0 | 0.0 (0.0) | 0.0 | 0.0 (0.0) | 0.0 | 0.3 (0.3) | 0.0 |
| Killer-Insects | 0.2 (0.2) | 0.0 | 0.0 (0.0) | 0.0 | 0.0 (0.0) | 0.0 | 0.0 (0.0) | 0.0 | 0.2 (0.2) | 0.0 |
| Killer-Unknown | 1.6 (0.5) | 0.3 | 0.0 (0.0) | 0.0 | 0.0 (0.0) | 0.0 | 0.1 (0.1) | 0.5 | 1.7 (0.6) | 0.2 |
| Maimer-Animal | 1.7 (0.8) | 0.3 | 0.3 (0.2 | 0.2 | 0.0 (0.0) | 0.0 | 0.4 (0.2) | 2.0 | 2.4 (0.8) | 0.3 |
| Maimer-Defect | 6.5 (1.2) | 1.1 | 1.2 (0.4) | 0.3 | 0.2 (0.1) | 0.3 | 0.7 (0.3) | 3.7 | 8.6 (1.3) | 1.1 |
| Maimer-Insect | 5.9 (2.4) | 1.0 | 5.9 (2.4) | 4.0 | 4.4 (2.7) | 8.2 | 2.2 (1.4) | 12.1 | 18.5 (8.6) | 2.3 |
| Maimer-Treatment | 1.3 (0.6) | 0.2 | 0.1 (0.0) | 0.1 | 0.1 (0.1) | 0.1 | 0.2 (0.1) | 1.1 | 1.6 (0.7) | 0.2 |
| Reduced Growth | 1.0 (0.4) | 0.2 | 0.0 (0.0) | 0.0 | 0.0 (0.0) | 0.0 | 0.0 (0.0) | 0.0 | 1.0 (0.4) | 0.1 |
| Total | 584.3 (70.7) | 146.4 (19.2) | 54.3 (11.9) | 18.6 (5.8) | 803.6 (94.4) | |||||
| Subalpine fir | ||||||||||
| Live No Damage | 362.7 (9.6) | 87.3 | 52.0 (0.8) | 94.5 | 12.5 (0.3) | 94.4 | 6.5 (0.4) | 89.6 | 433.7 (9.3) | 88.4 |
| Competition | 31.7 (10.1) | 7.6 | 0.0 (0.0) | 0.0 | 0.0 (0.0) | 0.0 | 0.0 (0.0) | 0.3 | 31.8 (9.8) | 6.5 |
| Killer-Abiotic | 4.1 (1.0) | 1.0 | 0.6 (0.2) | 1.0 | 0.0 (0.0) | 0.0 | 0.0 (0.0) | 0.0 | 4.7 (1.0) | 1.0 |
| Killer-Unknown | 1.01 (0.5) | 0.2 | 0.2 (0.1) | 0.3 | 0.1 (0.1) | 0.5 | 0.0 (0.0) | 0.0 | 1.2 (0.6) | 0.2 |
| Maimer-Animal | 5.1 (1.0) | 1.2 | 0.4 (0.3) | 0.7 | 0.3 (0.3) | 2.3 | 0.0 (0.0) | 0.0 | 5.8 (1.1) | 1.2 |
| Maimer-Defect | 7.1 (1.7) | 1.7 | 1.3 (0.4) | 2.3 | 0.1 (0.1) | 0.8 | 0.5 (0.3) | 7.5 | 9.1 (1.9) | 1.8 |
| Maimer-Treatment | 3.2 (1.0) | 0.8 | 0.6 (0.5) | 1.0 | 0.0 (0.0) | 0.1 | 0.2 (0.2) | 2.7 | 3.9 (1.4) | 0.8 |
| Reduced Growth | 0.4(0.3) | 0.1 | 0.1 (0.1) | 0.1 | 0.3 (0.2) | 1.9 | 0.0 (0.0) | 0.0 | 0.7 (0.5) | 0.1 |
| Total | 415.3 (86.1) | 55.0 (13.8) | 13.2 (3.2) | 7.3 (3.4) | 490.9 (100.2) | |||||
| Trembling aspen | ||||||||||
| Live No Damage | 232.4 (9.2) | 68.0 | 24.1 (0.9) | 84.1 | 7.4 (0.4) | 90.5 | 5.0 (0.1) | 79.4 | 268.9 (9.0) | 69.8 |
| Competition | 52.7 (6.5) | 15.4 | 0.5 (0.3) | 1.8 | 0.0 (0.0) | 0.0 | 0.0 (0.0) | 0.0 | 53.2 (7.0) | 13.8 |
| Killer-Abiotic | 3.2 (1.0) | 0.9 | 0.2 (0.1) | 0.6 | 0.0 (0.0) | 0.0 | 0.0 (0.0) | 0.0 | 3.4 (1.0) | 0.9 |
| Killer-Disease | 0.2 (0.1) | 0.0 | 0.0 (0.0) | 0.0 | 0.0 (0.0) | 0.0 | 0.0 (0.0) | 0.0 | 0.2 (0.1) | 0.0 |
| Killer-Unknown | 12.4 (3.2) | 3.6 | 0.8(0.6) | 2.8 | 0.0 (0.0) | 0.0 | 0.5 (0.4) | 8.2 | 13.7 (3.5) | 3.6 |
| Maimer-Animal | 31.9 (7.9) | 9.3 | 2.6 (0.9) | 8.9 | 0.6 (0.3) | 7.2 | 0.3 (0.3) | 5.2 | 35.4 (8.5) | 9.2 |
| Maimer-Defect | 0.7(0.3) | 0.2 | 0.0 (0.0) | 0.0 | 0.2 (0.1) | 2.4 | 0.0 (0.0) | 0.0 | 0.9 (0.3) | 0.2 |
| Maimer-Treatment | 8.4 (4.8) | 2.5 | 0.5 (0.3) | 1.8 | 0.0 (0.0) | 0.0 | 0.5 (0.4) | 7.2 | 9.4 (4.6) | 2.4 |
| Reduced Growth | 0.1 (0.1) | 0.0 | 0.0 (0.0) | 0.0 | 0.0 (0.0) | 0.0 | 0.0 (0.0) | 0.0 | 0.1 (0.0) | 0.0 |
| Total | 341.9 (84.9) | 28.7 (6.2) | 8.2 (1.9) | 6.3 (2.8) | 385.0 (90.3) | |||||
References
- Price, D.T.; Alfaro, R.I.; Brown, K.J.; Flannigan, M.D.; Fleming, R.A.; Hogg, E.H.; Girardin, M.P.; Lakusta, T.; Johnston, M.; McKenney, D.W.; et al. Anticipating the consequences of climate change for Canada’s boreal forest ecosystems 1. Environ. Rev. 2013, 21, 322–365. [Google Scholar] [CrossRef]
- Keenan, R.J. Climate change impacts and adaptation in forest management: A review. Ann. For. Sci. 2015. [Google Scholar] [CrossRef]
- Oren, R.; Ellsworth, D.S.; Johnsen, K.H.; Phillips, N.; Ewers, B.E.; Maier, C.; Schäfer, K.V.; McCarthy, H.; Hendrey, G.; McNulty, S.G.; et al. Soil fertility limits carbon sequestration by forest ecosystems in a CO2-enriched atmosphere. Nature 2001, 411, 469–472. [Google Scholar] [CrossRef] [PubMed]
- Kirilenko, A.P.; Sedjo, R.A. Climate change impacts on forestry. Proc. Natl. Acad. Sci. USA 2007, 104, 19697–19702. [Google Scholar] [CrossRef] [PubMed]
- Aitken, S.N.; Yeaman, S.; Holliday, J.A.; Wang, T.; Curtis-McLane, S. Adaptation, migration or extirpation: Climate change outcomes for tree populations. Evolut. Appl. 2008, 1, 95–111. [Google Scholar] [CrossRef] [PubMed]
- Coops, N.C.; Waring, R.H. A process-based approach to estimate lodgepole pine (Pinus contorta Dougl.) distribution in the Pacific Northwest under climate change. Clim. Chang. 2011, 105, 313–328. [Google Scholar] [CrossRef]
- Dale, V.H.; Joyce, L.A.; McNulty, S.; Neilson, R.P.; Ayres, M.P.; Flannigan, M.D.; Hanson, P.J.; Irland, L.C.; Lugo, A.E.; Peterson, C.J.; et al. Climate change and forest disturbances. BioScience 2001, 51, 723–734. [Google Scholar] [CrossRef]
- Bolte, A.; Ammer, C.; Lӧf, M.; Mardsen, P.; Nabuurs, G.-J.; Schall, P.; Spathelf, P.; Rock, J. Adaptive forest management strategies in central Europe: Climate change impacts, strategies and integrative concept. Scand. J. For. Res. 2009, 24, 473–482. [Google Scholar] [CrossRef]
- Woods, A.; Coates, K.D.; Hamann, A. Is an unprecedented Dothistroma needle blight epidemic related to climate change? BioScience 2005, 55, 761–769. [Google Scholar] [CrossRef]
- Weed, A.S.; Ayres, M.P.; Hicke, J.A. Consequences of climate change for biotic disturbances in North American forests. Ecol. Monogr. 2013, 83, 441–470. [Google Scholar] [CrossRef]
- Allen, C.D.; Breashears, D.D.; McDowell, N.G. On underestimation of global vulnerability to tree mortality and forest die-off from hotter drought in the Anthropocene. Ecosphere 2015, 129, 1–27. [Google Scholar] [CrossRef]
- Raffa, K.F.; Aukema, B.H.; Bentz, B.J.; Carroll, A.L.; Hicke, J.A.; Turner, M.G.; Romme, W.H. Cross-scale drivers of natural disturbances prone to anthropogenic amplification: The dynamics of bark beetle eruptions. BioScience 2008, 58, 501–517. [Google Scholar] [CrossRef]
- Buma, B. Disturbance interactions: Characterization, prediction, and the potential for cascading effects. Ecosphere 2015, 6, 1–15. [Google Scholar] [CrossRef]
- Woods, A.J.; Coates, K.D. Are biotic disturbance agents challenging basic tenets of growth and yield and sustainable forest management? Forestry 2013, 86, 543–554. [Google Scholar] [CrossRef]
- Ennos, R.A. Resilience of forests to pathogens: An evolutionary ecology perspective. Forestry 2015, 88, 41–52. [Google Scholar] [CrossRef]
- Flower, C.E.; Gonzalez-Meler, M.A. Responses of temperate forest productivity to insect and pathogen disturbances. Ann. Rev. Plant Biol. 2015, 66, 547–569. [Google Scholar] [CrossRef] [PubMed]
- Heineman, J.L.; Sachs, D.L.; Mather, W.J.; Simard, S.W. Investigating the influence of climate, site, location, and treatment factors on damage to young lodgepole pine in southern British Columbia. Can. J. For. Res. 2010, 40, 1109–1127. [Google Scholar] [CrossRef]
- Haughian, S.R.; Burton, P.J.; Taylor, S.W.; Curry, C.L. Expected effects of climate change on forest disturbance regimes in British Columbia. J. Ecosyst. Manag. 2012, 13, 1–24. [Google Scholar]
- Roach, W.J.; Simard, S.W.; Sachs, D.L. Evidence against planting lodgepole pine monocultures in the cedar-hemlock forests of southeastern British Columbia. Forestry 2015, 88, 345–358. [Google Scholar] [CrossRef]
- Boland, G.; Melzer, M.; Hopkin, A.; Higgins, V.; Nassuth, A. Climate change and plant diseases in Ontario. Can. J. Plant Pathol. 2004, 26, 335–350. [Google Scholar] [CrossRef]
- Woods, A.J.; Heppner, D.; Kope, H.H.; Burleigh, J.; Maclauchlan, L. Forest Health and Climate Change: A British Columbia perspective. For. Chron. 2010, 86, 412–422. [Google Scholar] [CrossRef]
- Sturrock, R.N.; Frankel, S.J.; Brown, A.V.; Hennon, P.E.; Kliejunas, J.T.; Lewis, K.J.; Worrall, J.J.; Woods, A.J. Climate change and forest diseases. Plant Pathol. 2011, 60, 133–149. [Google Scholar] [CrossRef]
- Millar, C.I.; Stephenson, N.L. Temperate forest health in an era of emerging mega-disturbances. Science 2015, 349, 823–826. [Google Scholar] [CrossRef] [PubMed]
- Bunn, A.G.; Goetz, S.J.; Kimball, J.S.; Zhang, K. Northern high-latitude ecosystems respond to climate change. EOS Trans. 2007, 88, 333–335. [Google Scholar] [CrossRef]
- Allen, C.D.; Macalady, A.K.; Chenchouni, H.; Bachelet, D.; McDowell, N.; Vennetier, M.; Kitzberger, T.; Rigling, A.; Breshears, D.D.; Hogg, E.T.; et al. A global overview of drought and heat-induced tree mortality reveals emerging climate change risks for forests. For. Ecol. Manag. 2010, 259, 660–684. [Google Scholar] [CrossRef]
- McDowell, N.G.; Coops, N.C.; Beck, P.S.; Chambers, J.Q.; Gangodagamage, C.; Hicke, J.A.; Huang, C.Y.; Kennedy, R.; Krofcheck, D.J.; Litvak, M.; et al. Global satellite monitoring of climate-induced vegetation disturbances. Trends Plant Sci. 2015, 20, 114–123. [Google Scholar] [CrossRef] [PubMed]
- Pretzsch, H.; Biber, P.; Schütze, G.; Uhl, E.; Rötzer, T. Forest stand growth dynamics in Central Europe have accelerated since 1870. Nat. Commun. 2014, 5, 4967. [Google Scholar] [CrossRef] [PubMed]
- Bruce, D. Yield differences between research plots and managed forests. J. For. 1977, 1, 14–17. [Google Scholar]
- Meidinger, D.; Pojar, J. Ecosystems of British Columbia. Special Report Series 6; BC Ministry of Forests: Victoria, BC, Canada, 1991.
- Egginton, V.N. Historical Climate Variability from the Instrumental Record in Northern British Columbia and Its Influence on Slope Stability. Master’s Thesis, Simon Fraser University, Burnaby, BC, Canada, 2005. [Google Scholar]
- BC Ministry of Forests Lands and Natural Resource Operations (FLNRO). Silviculture Surveys Procedure Manual; Resource Practices Branch: Victoria, BC, Canada, 2014; pp. 189–205.
- Koch, P. Lodgepole Pine in North America; Chapter 17. Defects in Trees and Logs; Forest Products Society: Madison, WI, USA, 1996; pp. 743–763. [Google Scholar]
- Lohr, S.L. Sampling: Design and Analysis, 2nd ed.; Brooks/Cole: Pacific Grove, CA, USA, 2009. [Google Scholar]
- Di Lucca, C.M. TASS/SYLVER/TIPSY: Systems for predicting the impact of silvicultural practices on yield, lumber value, economic return and other benefits. In Stand Density Management Conference: Using the Planning Tools; Bamsey, C.R., Ed.; Clear Lake Ltd.: Edmonton, AB, Canada, 1999; pp. 7–16. [Google Scholar]
- Wang, T.; Campbell, E.; O’Neill, G.A.; Aitken, S.N. Projecting future distributions of ecosystem climate niches: Uncertainties and management applications. For. Ecol. Manag. 2012, 279, 128–140. [Google Scholar] [CrossRef]
- Skovsgaard, J.P.; Vanclay, J.K. Forest site productivity: A review of the evolution of dendrometric concepts for even-aged stands. Forestry 2007, 81, 13–31. [Google Scholar] [CrossRef]
- Seidl, R.; Rammer, W.; Scheller, R.M.; Spies, T.A. An individual-based process model to simulate landscape-scale forest ecosystem dynamics. Ecol. Model. 2012, 231, 87–100. [Google Scholar] [CrossRef]
- Krebill, R.G. Comandra rust outbreaks in lodgepole pine. J. For. 1965, 63, 519–522. [Google Scholar]
- Woods, A.J. Warmer and wetter might not be better. J. For. Sci. 2014, 60, 484–486. [Google Scholar]
- Reich, R.W.; Heineman, J.L.; Nemec, A.F.L.; Bedford, L.; Boateng, J.; Kaffanke, T. Hard pine stem rusts on lodgepole pine at a site-preparation study in sub-boreal British Columbia: Effects over 24 years. Can. J. For. Res. 2015, 45, 411–421. [Google Scholar] [CrossRef]
- Neville, R.J.; Humphreys, N.; Van Sickle, A. Three-Year Overview of Forest Health in Young Managed Stands in British Columbia 1992–1994; FRDA Report No. 236; Canadian Forest Service, Pacific Forestry Centre: Victoria, BC, Canada, 1995.
- Woods, A. Is the health of British Columbia’s forests being influenced by climate change? If so, was this predictable? Can. J. Plant Pathol. 2011, 33, 117–126. [Google Scholar] [CrossRef]
- Sieben, B.G.; Spittlehouse, D.L. Effect of climate change on spruce weevil infestation hazard. In Implications of Climate Change for Pacific Northwest Forest Management; Department Geography. Publication Series, Occasional paper No. 15; University of Waterloo: Waterloo, ON, Canada, 1991; p. 123. [Google Scholar]
- Carroll, A.L.; Taylor, S.W.; Régnière, J.; Safranyik, L. Effects of climate change on range expansion by the mountain pine beetle in British Columbia. In Mountain Pine Beetle Symposium: Challenges and Solutions, Proceedings of the Natural Resources Canada, Canadian Forest Service, Kelowna, BC, Canada, 30–31 October 2003; Shore, T.L., Brooks, J.E., Stone, J.E., Eds.; Information Report BC-X-399; Pacific Forestry Centre: Victoria, BC, Canada, 2004; pp. 223–232. [Google Scholar]
- Lute, A.C.; Abatzoglou, J.T.; Hegewisch, K.C. Projected changes in snowfall extremes and inter-annual variability of snowfall in the western United States. Water Resour. Res. 2015, 51, 960–972. [Google Scholar] [CrossRef]
- Reid, A.; Chapman, W.; Prescott, C. Comparing lodgepole pine growth and disease occurrence at six long-term soil productivity (LTSP) sites in British Columbia, Canada. Can. J. For. Res. 2016. [Google Scholar] [CrossRef]
- Healey, S.P.; Raymond, C.L.; Lockman, I.B.; Hernandez, A.J.; Garrard, C.; Huang, C. Root disease can rival fire and harvest in reducing forest carbon storage. Ecosphere 2016, 7, e01569. [Google Scholar] [CrossRef]
- Bazzaz, F.A. Plant-plant interactions in successional environments. In Perspectives on Plant Competition; Grace, J.B., Tilman, D., Eds.; Academic Press: San Diego, CA, USA, 1990; pp. 239–263. [Google Scholar]
- Lutz, J.A.; Halpern, C.B. Tree mortality during early forest development: A long-term study of rates, causes and consequences. Ecol. Monogr. 2006, 76, 257–275. [Google Scholar] [CrossRef]
- Zhang, J.; Huang, S.; He, F. Half-century evidence from western Canada shows forest dynamics are primarily driven by competition followed by climate. Proc. Natl. Acad. Sci. USA 2015, 112, 4009–4014. [Google Scholar] [CrossRef] [PubMed]
- Price, D.T.; Cook, B.J.; Metsaranta, J.M.; Kurz, W.A. If forest dynamics in Canada’s west are driven mainly by competition, why did they change? Half-century evidence says: Climate change. Proc. Natl. Acad. Sci. USA 2015, 112, E4340. [Google Scholar] [CrossRef] [PubMed]
- Mailly, D.; Gaudrealt, M.; Picher, G.; Auger, I.; Pothier, D. A comparison of mortality rates between top height trees and average site trees. Ann. For. Sci. 2009, 66, 202. [Google Scholar] [CrossRef]
- Van der Kamp, B.J.; Karlman, M.; Witzell, J. Relative frequency of bole and branch infection of lodgepole pine by western gall rust. Can. J. For. Res. 1995, 25, 1962–1968. [Google Scholar] [CrossRef]
- Zeide, B.; Zakrzewski, W.T. Selection of site trees: The combined method and its application. Can. J. For. Res. 1993, 23, 1019–1025. [Google Scholar] [CrossRef]
- Walker, B.H.; Carpenter, S.R.; Rockstrom, J.; Crépin, A.S.; Peterson, G.D. Drivers, “slow” variables, “fast” variables, shocks, and resilience. Ecol. Soc. 2012, 17, 30. [Google Scholar] [CrossRef]
- Hughes, T.P.; Linares, C.; Dakos, V.; van de Leemput, I.A.; van Nes, E.H. Living dangerously on borrowed time during slow, unrecognized regime shifts. Trends Ecol. Evolut. 2013, 28, 149–155. [Google Scholar] [CrossRef] [PubMed] [Green Version]
- Kardol, P.; Campany, C.E.; Souza, L.; Norby, R.J.; Weltzin, J.F.; Classen, A.T. Climate change effects on plant biomass alter dominance patterns and community evenness in an experimental old-field ecosystem. Glob. Chang. Biol. 2010, 16, 2676–2687. [Google Scholar] [CrossRef]
- Langley, J.A.; Megonigal, J.P. Ecosystem response to elevated CO2 levels limited by nitrogen-induced plant species shift. Nature 2010, 466, 96–99. [Google Scholar] [CrossRef] [PubMed]
- Woods, A.J.; Bergerud, W. Are Free-Growing Stands in the Lakes TSA Meeting Timber Productivity Expectations? Forest Practices Branch; BC Ministry of Forests and Range: Victoria, BC, Canada, 2008. Available online: http://www.for.gov.bc.ca/hfp/frep/publications/reports.htm#rep13 (accessed on 10 January 2013).
- Kurz, W.A.; Dymond, C.C.; Stinson, G.; Rampley, G.J.; Neilson, E.T.; Carroll, A.L.; Ebata, T.; Safranyik, L. Mountain pine beetle and forest carbon feedback to climate change. Nature 2008, 452, 987–990. [Google Scholar] [CrossRef] [PubMed]
- Millar, C.I.; Stephenson, N.L.; Stephens, S.L. Climate change and forests of the future: Managing in the face of uncertainty. Ecol. Appl. 2007, 17, 2145–2151. [Google Scholar] [CrossRef] [PubMed]
- Messier, C.; Puettmann, K.; Chazdon, R.; Andersson, K.P.; Angers, V.A.; Brotons, L.; Filotas, E.; Tittler, R.; Parrott, L.; Levin, S.A. From management to stewardship: Viewing forests as complex adaptive systems in an uncertain world. Conserv. Lett. 2015, 8, 368–377. [Google Scholar] [CrossRef]
- Rist, L.; Moen, J. Sustainability in forest management and a new role for resilience thinking. For. Ecol. Manag. 2013, 310, 416–427. [Google Scholar] [CrossRef]
Figure 1.
Location of 176 randomly selected stands aged 15–40 years, and 44 Environment Canada weather stations, across seven management units in northern BC, Canada.
Figure 1.
Location of 176 randomly selected stands aged 15–40 years, and 44 Environment Canada weather stations, across seven management units in northern BC, Canada.
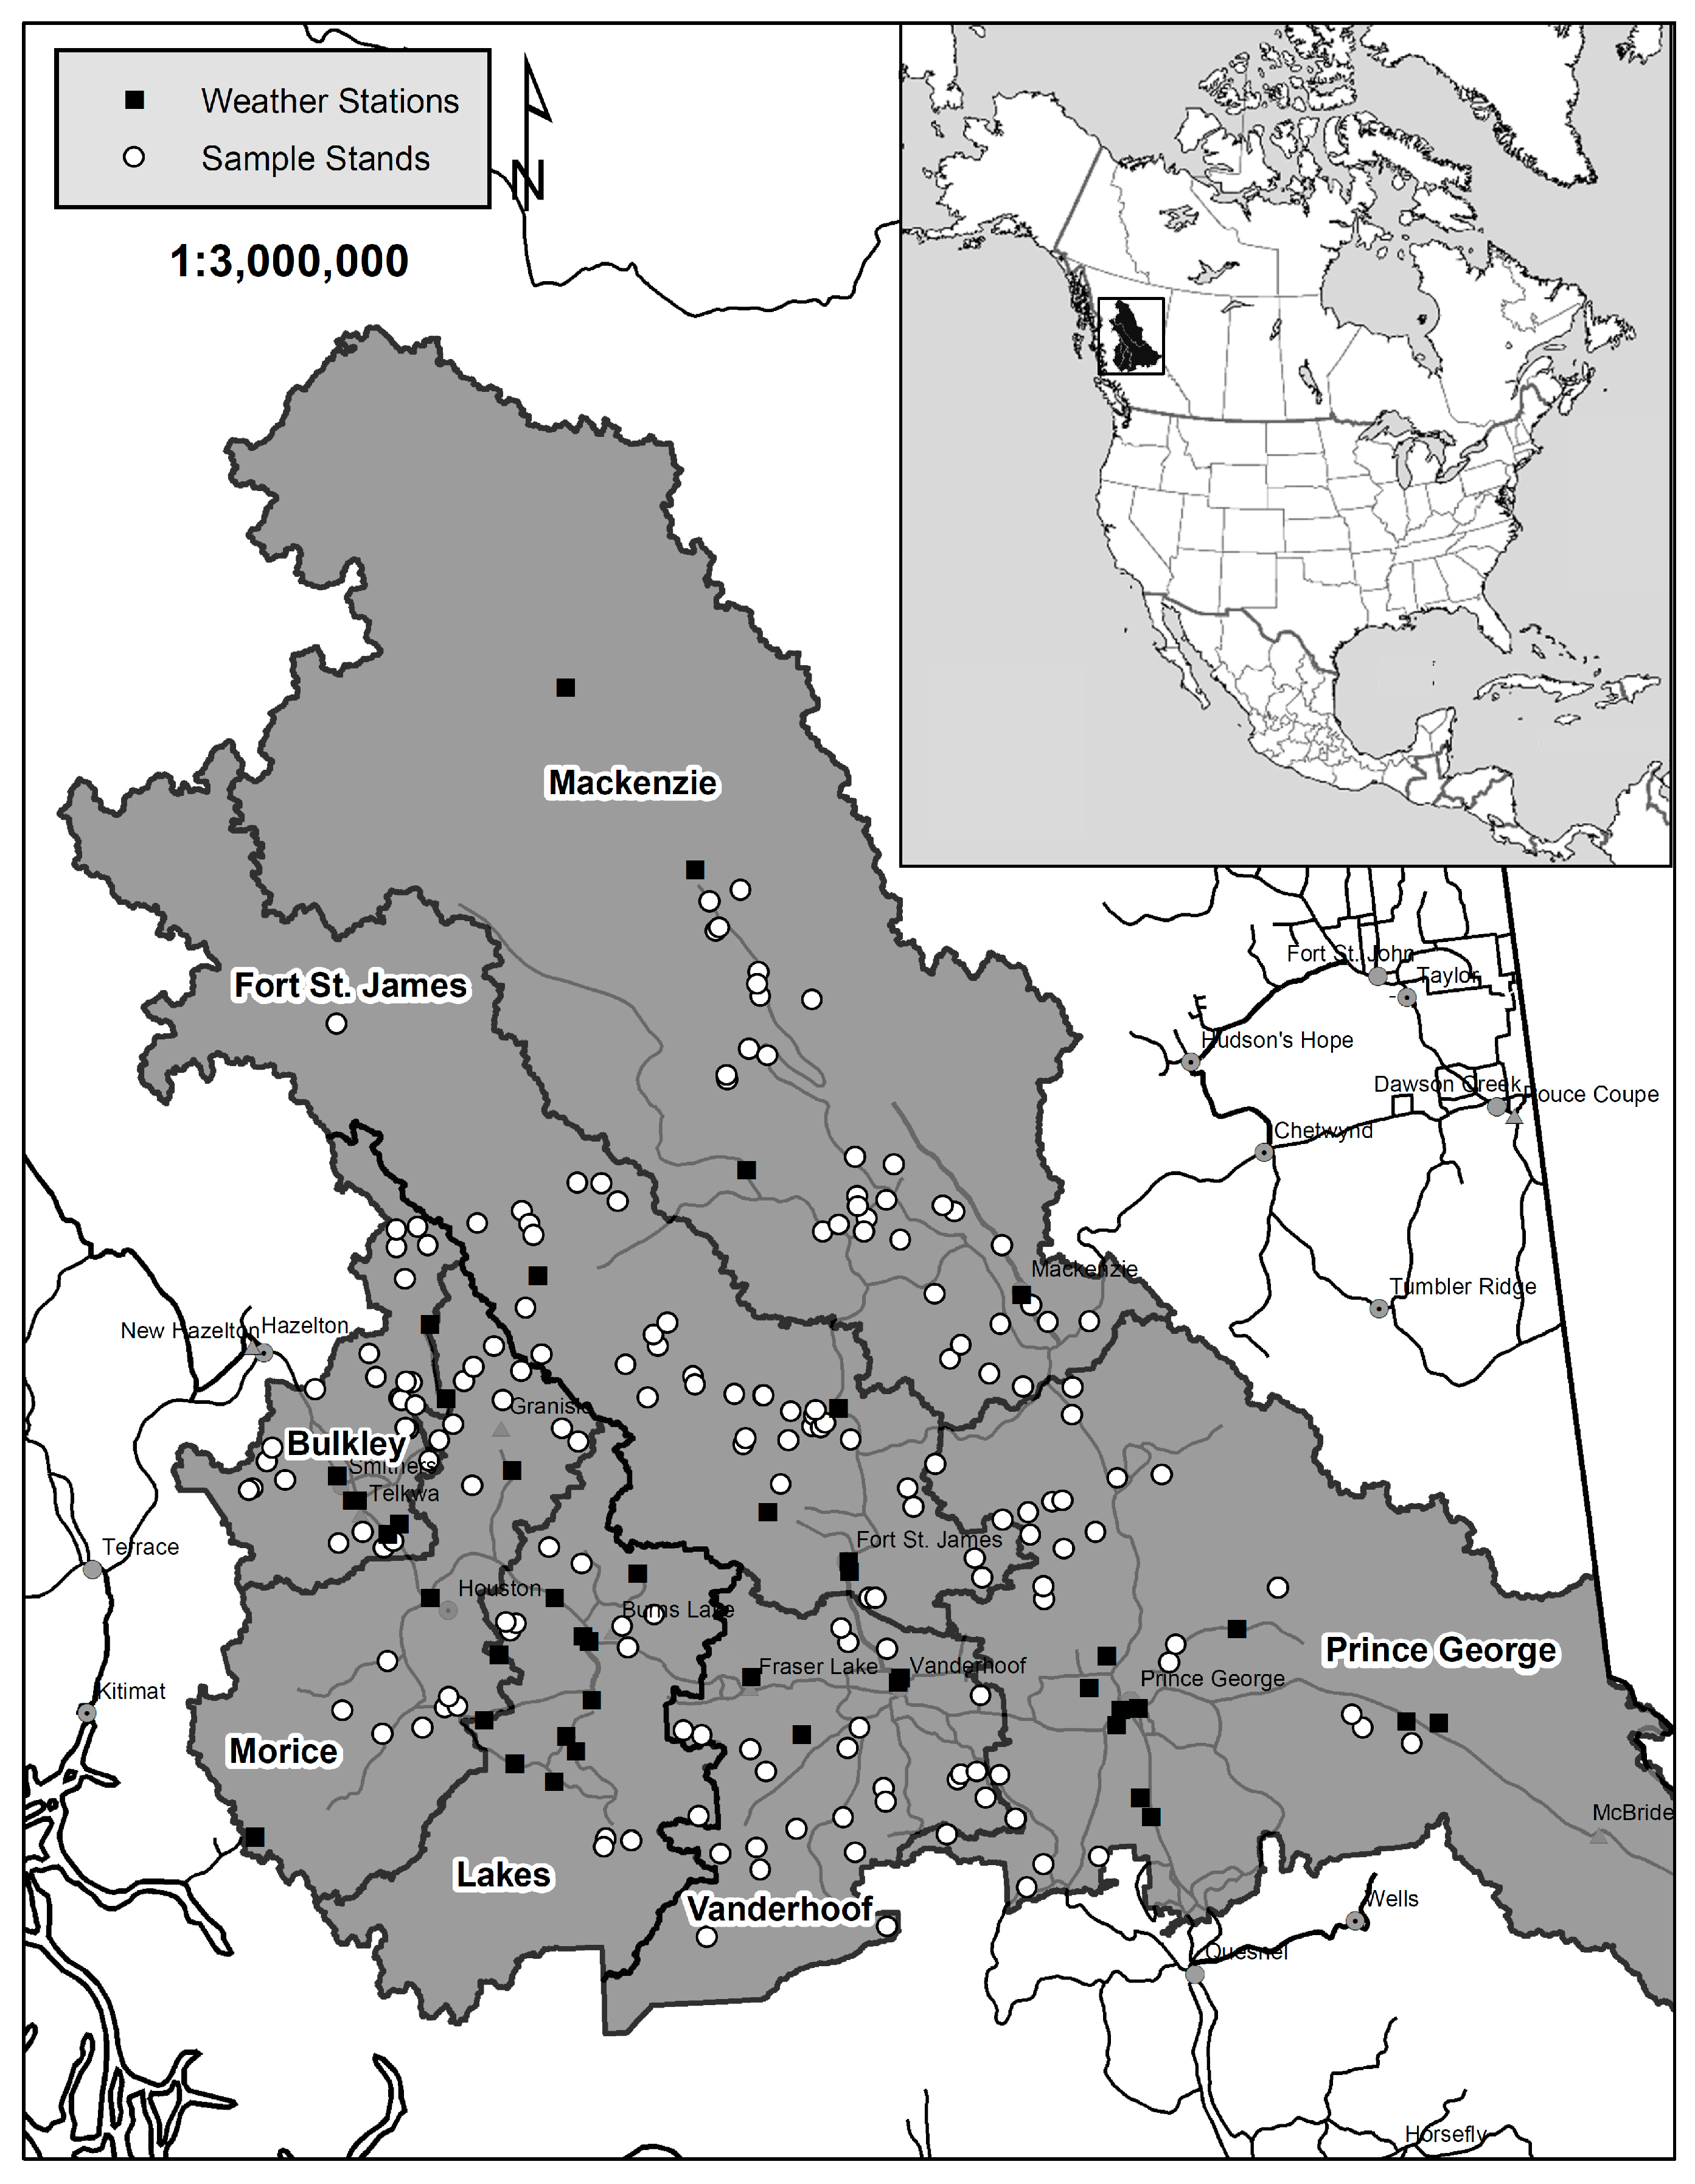
Figure 2.
Area weighted average percent of total stems/ha by diameter class, compromised by disturbance agents that kill, those that maim and by all disturbance agents and competition combined for the four most prevalent tree species and all species combined for 176 stands aged 15–40 across northern BC, Canada.
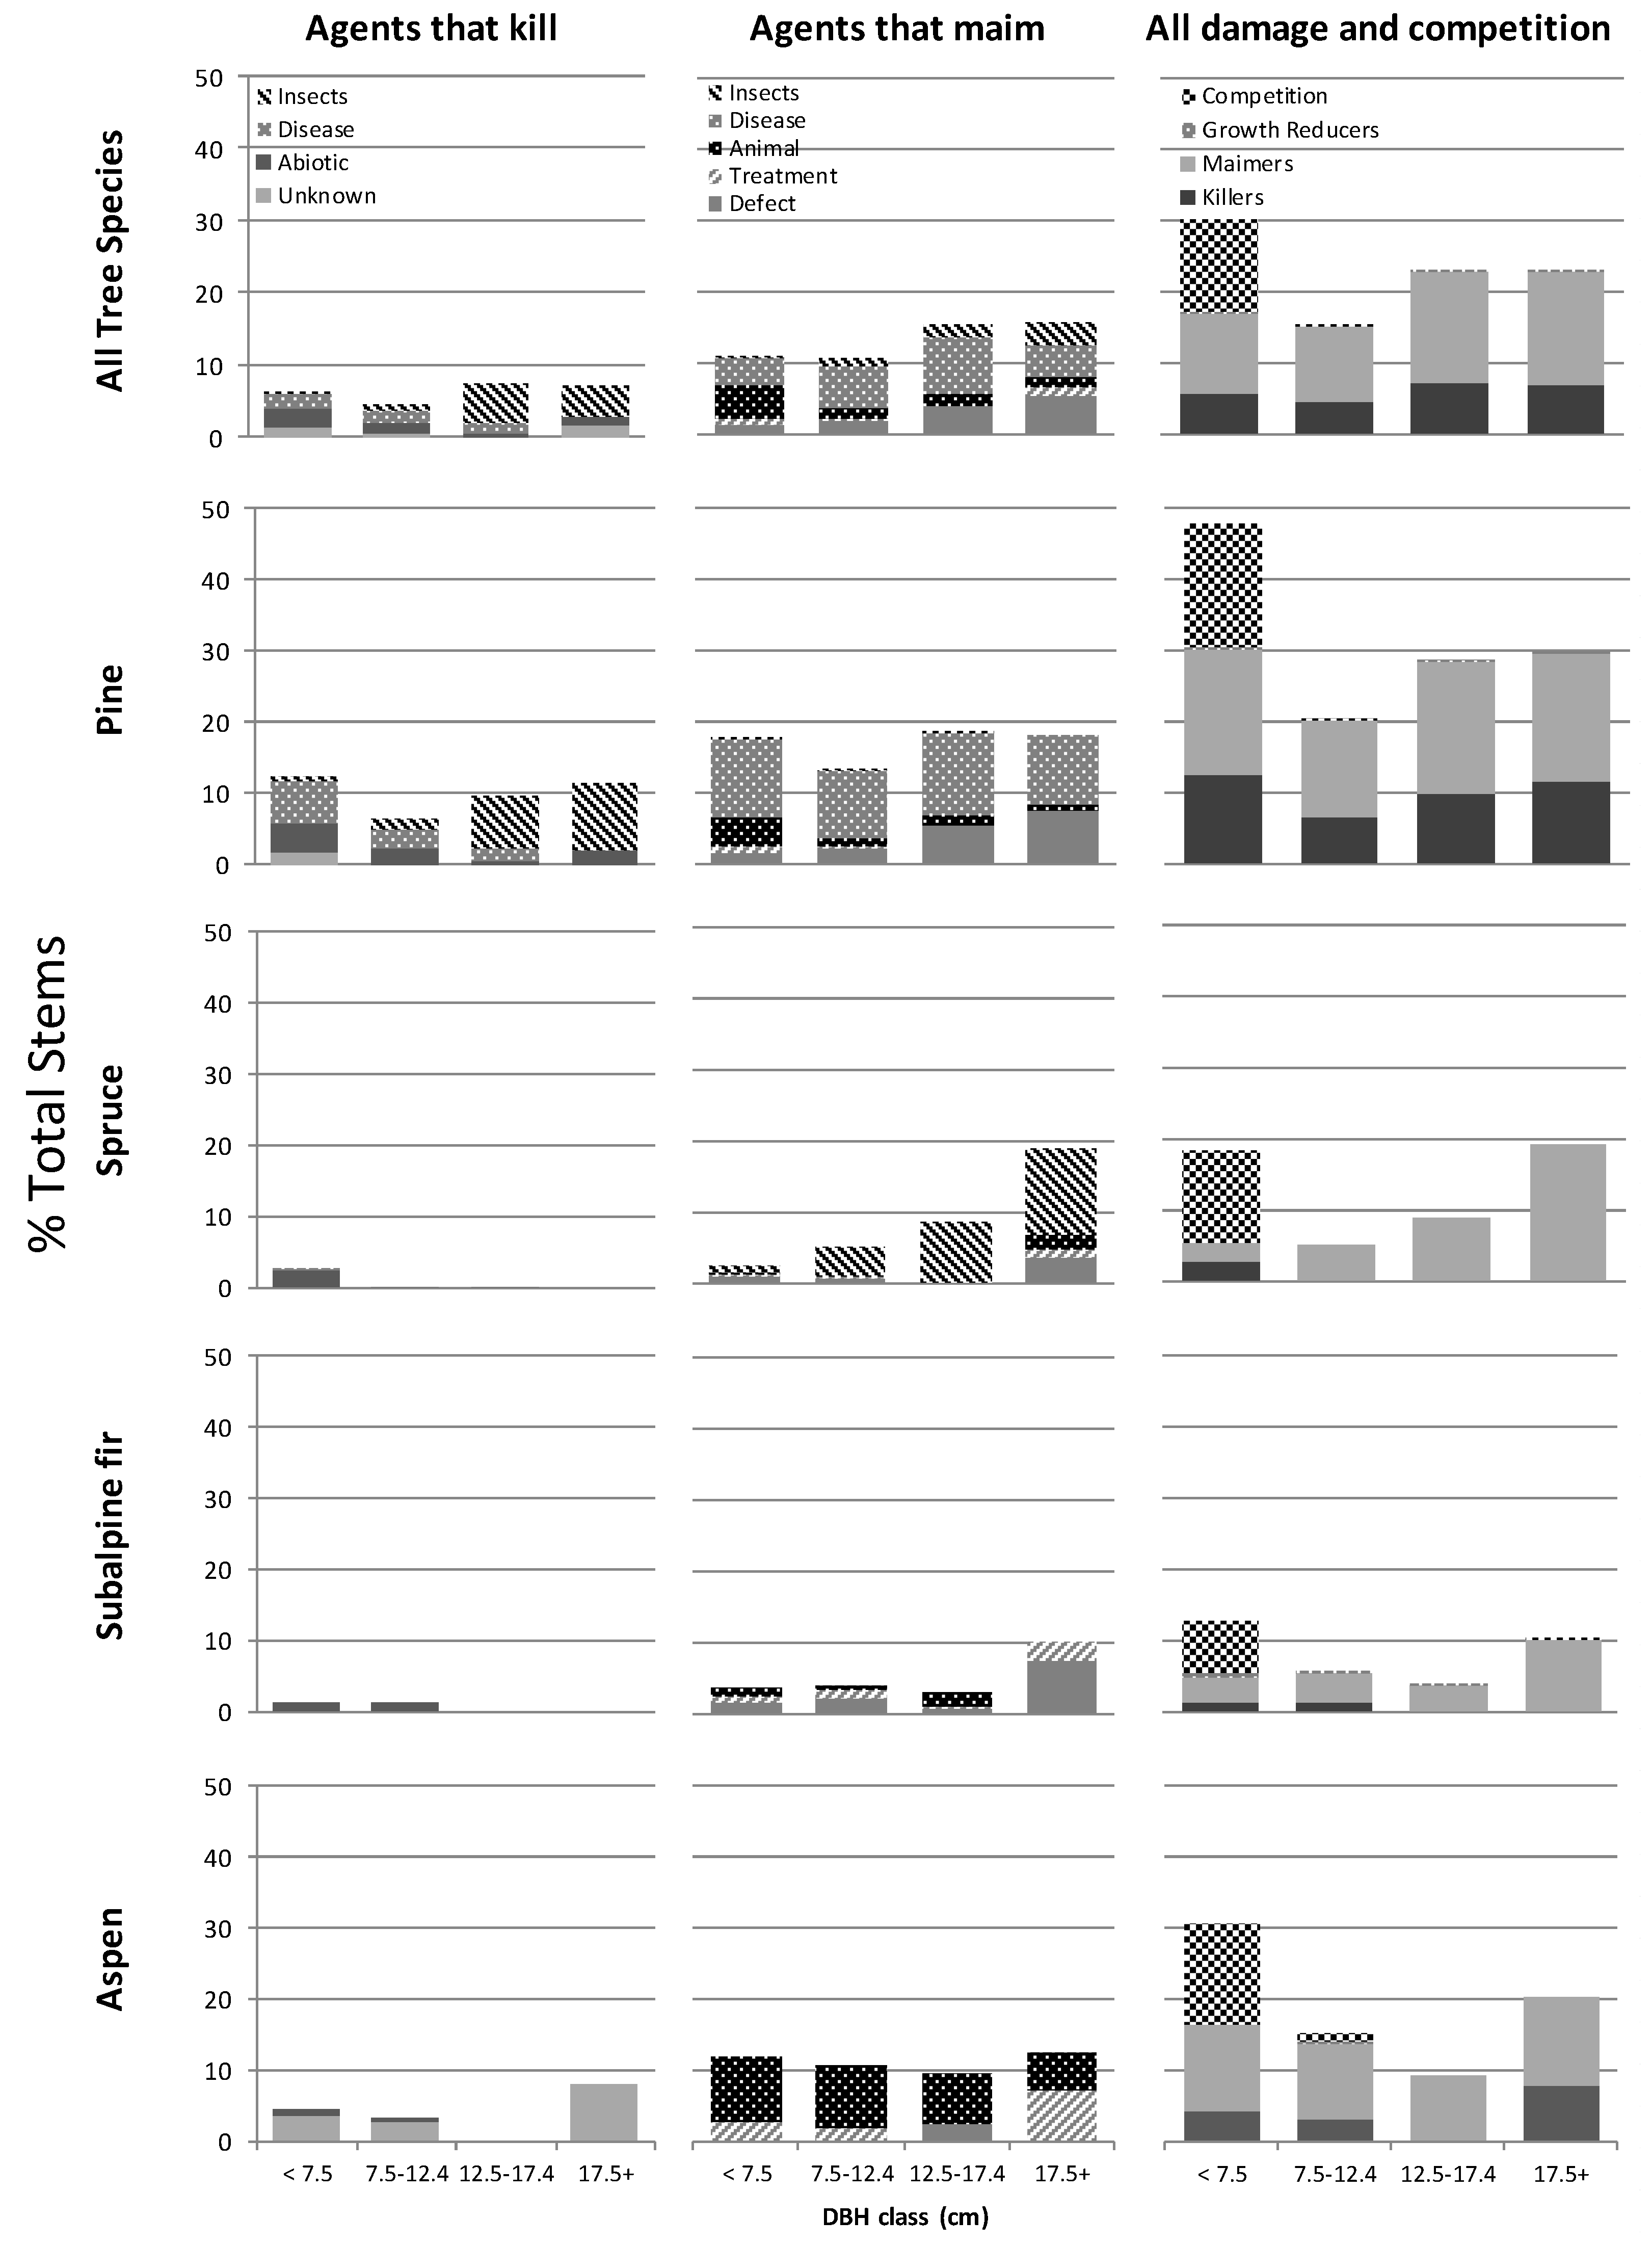
Figure 3.
Area weighted average percent of total basal area (m2/ha) damaged by disturbance agent group and by dbh class (7.5–12.4 cm, 12.5–17.4 and 17.5+) for the four most prevalent tree species and all species combined from 176 stands aged 15–40 across northern BC. The assumed rates of yield loss due to a combination of biotic and abiotic damage in BC’s managed forests are shown in red (4% for insects and disease and 3% for abiotic events).
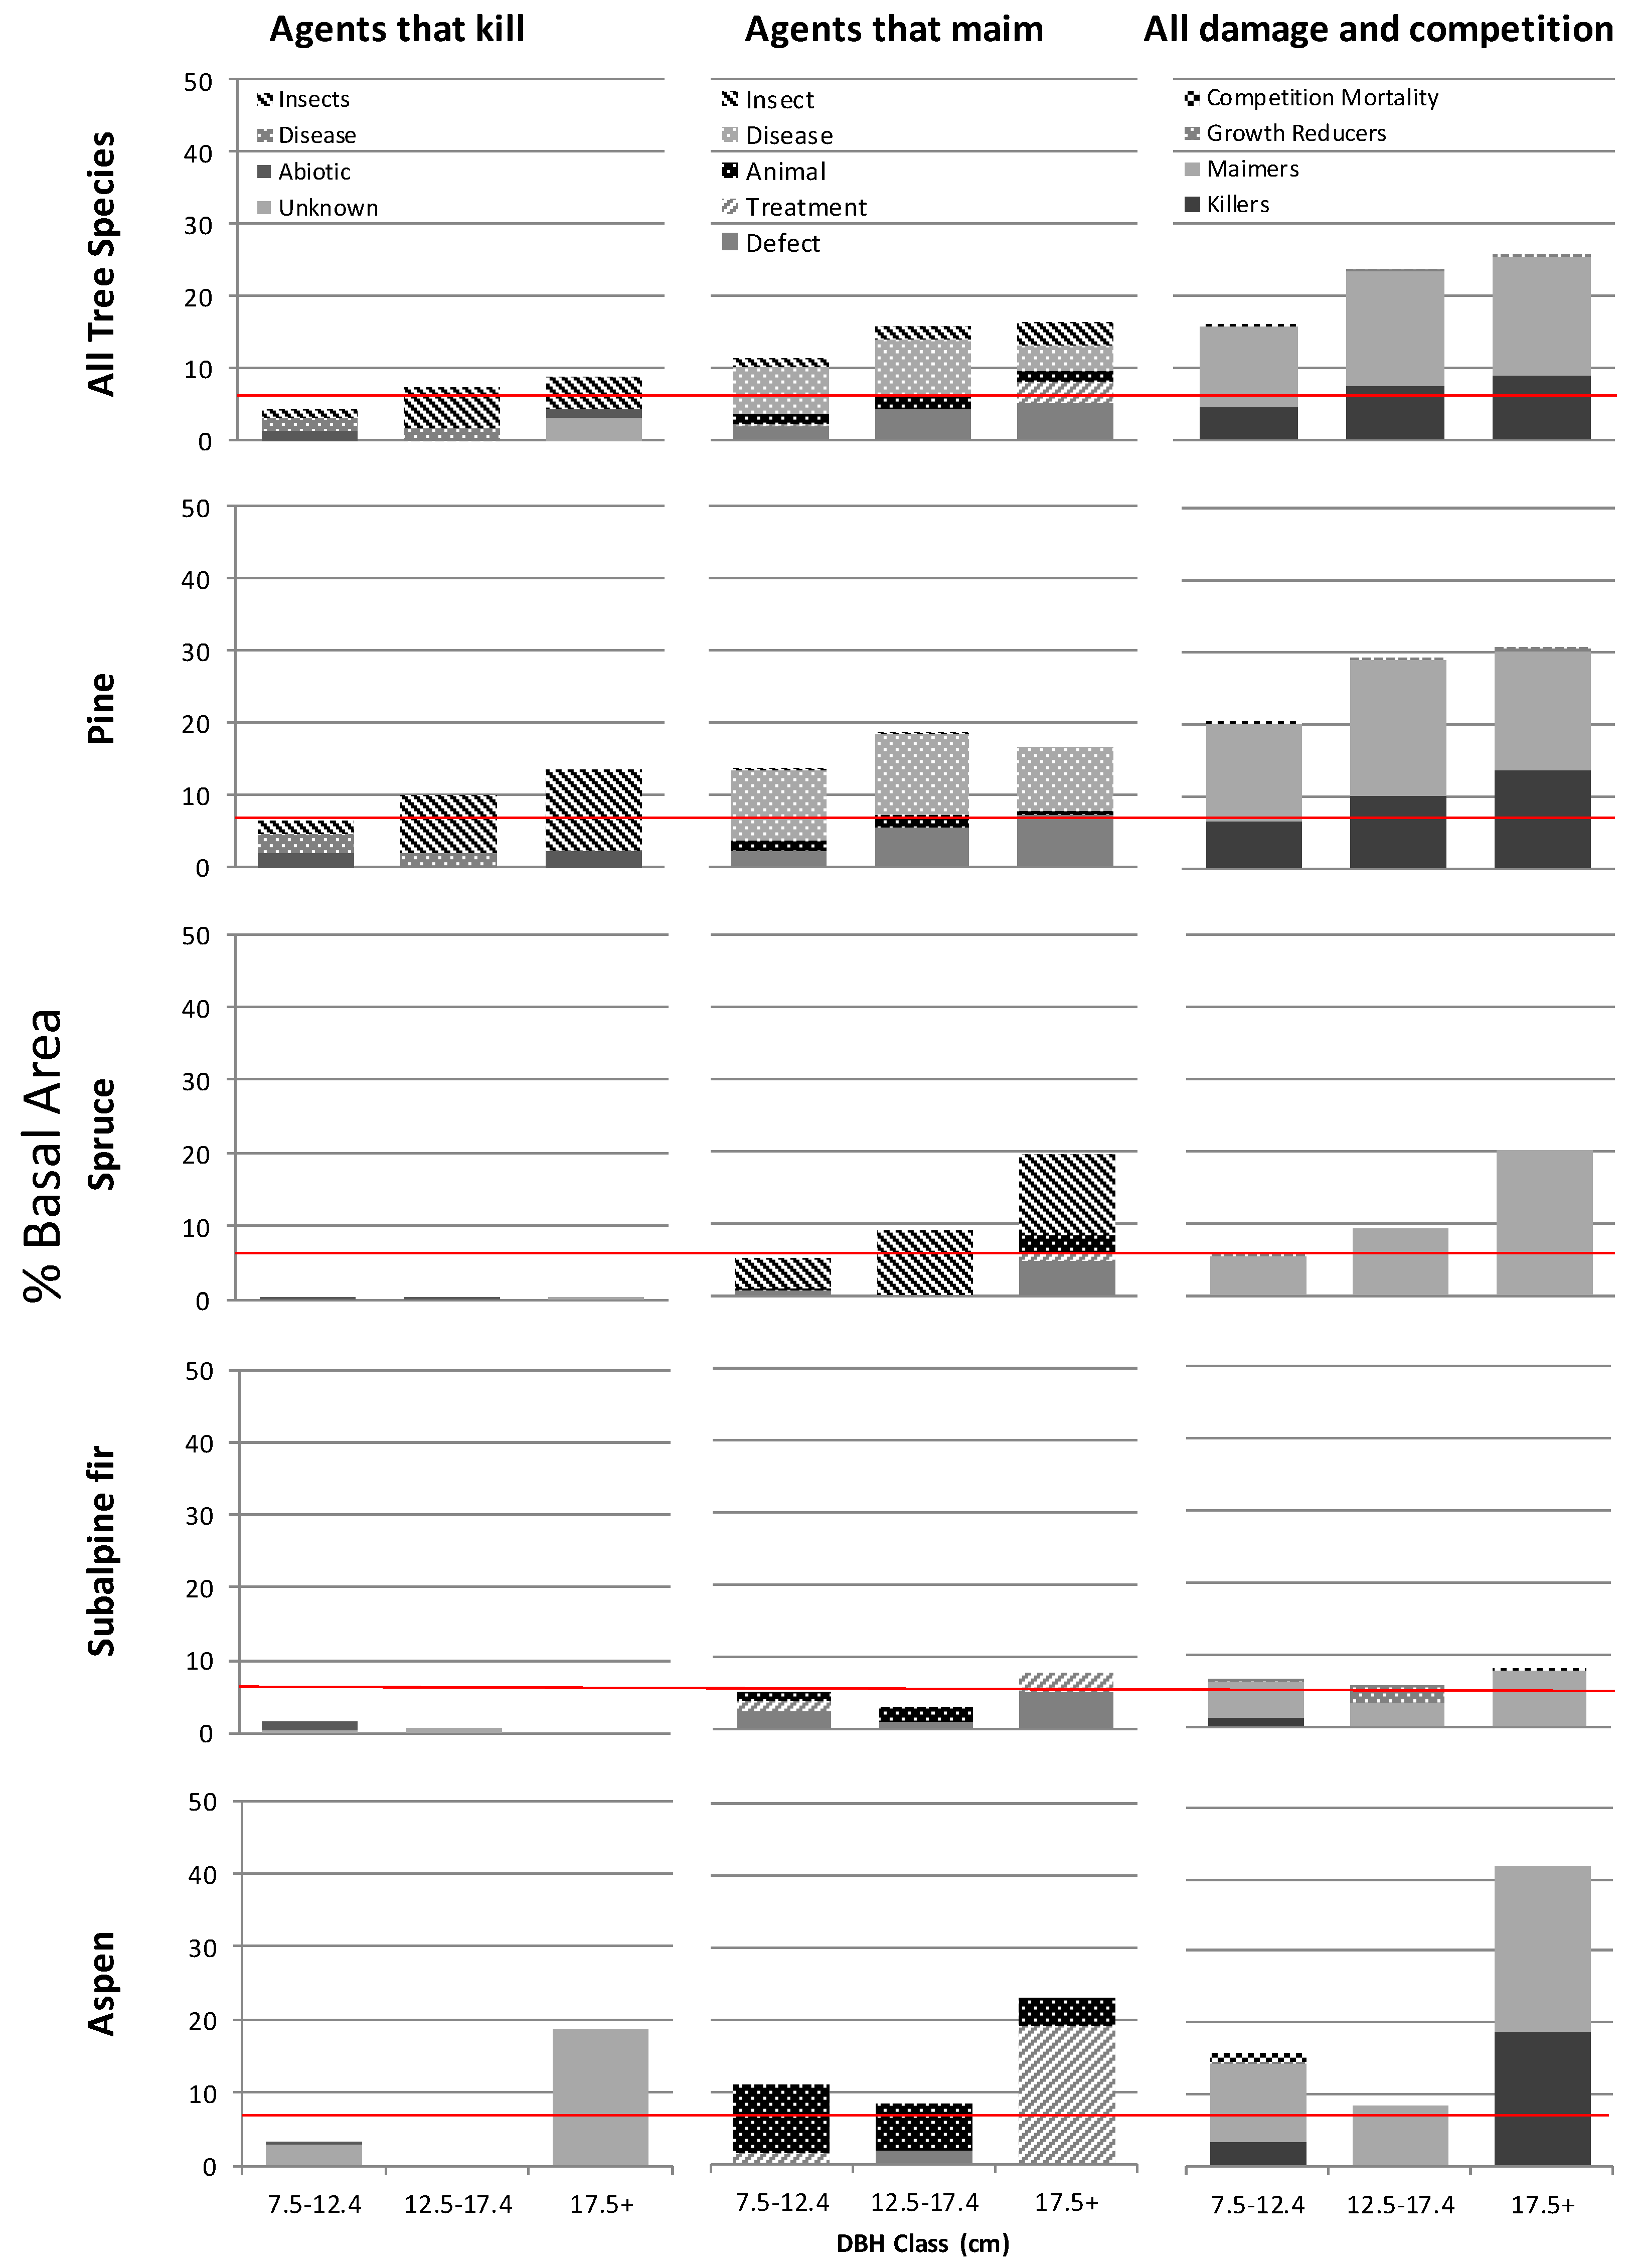
Figure 4.
The percent of lodgepole pine, interior spruce and all tree species combined basal area (m2/ha) that is damaged in the largest diameter 100 and 800 stems per ha in contrast to the percent of basal area that is damaged for the entire sample (all pine, spruce or all tree species combined ≥7.5 cm dbh). If the point is above the 1:1 line, it indicates that cohort of trees have more damage than the entire sample and if below they have less. Each point represents an individual stand.
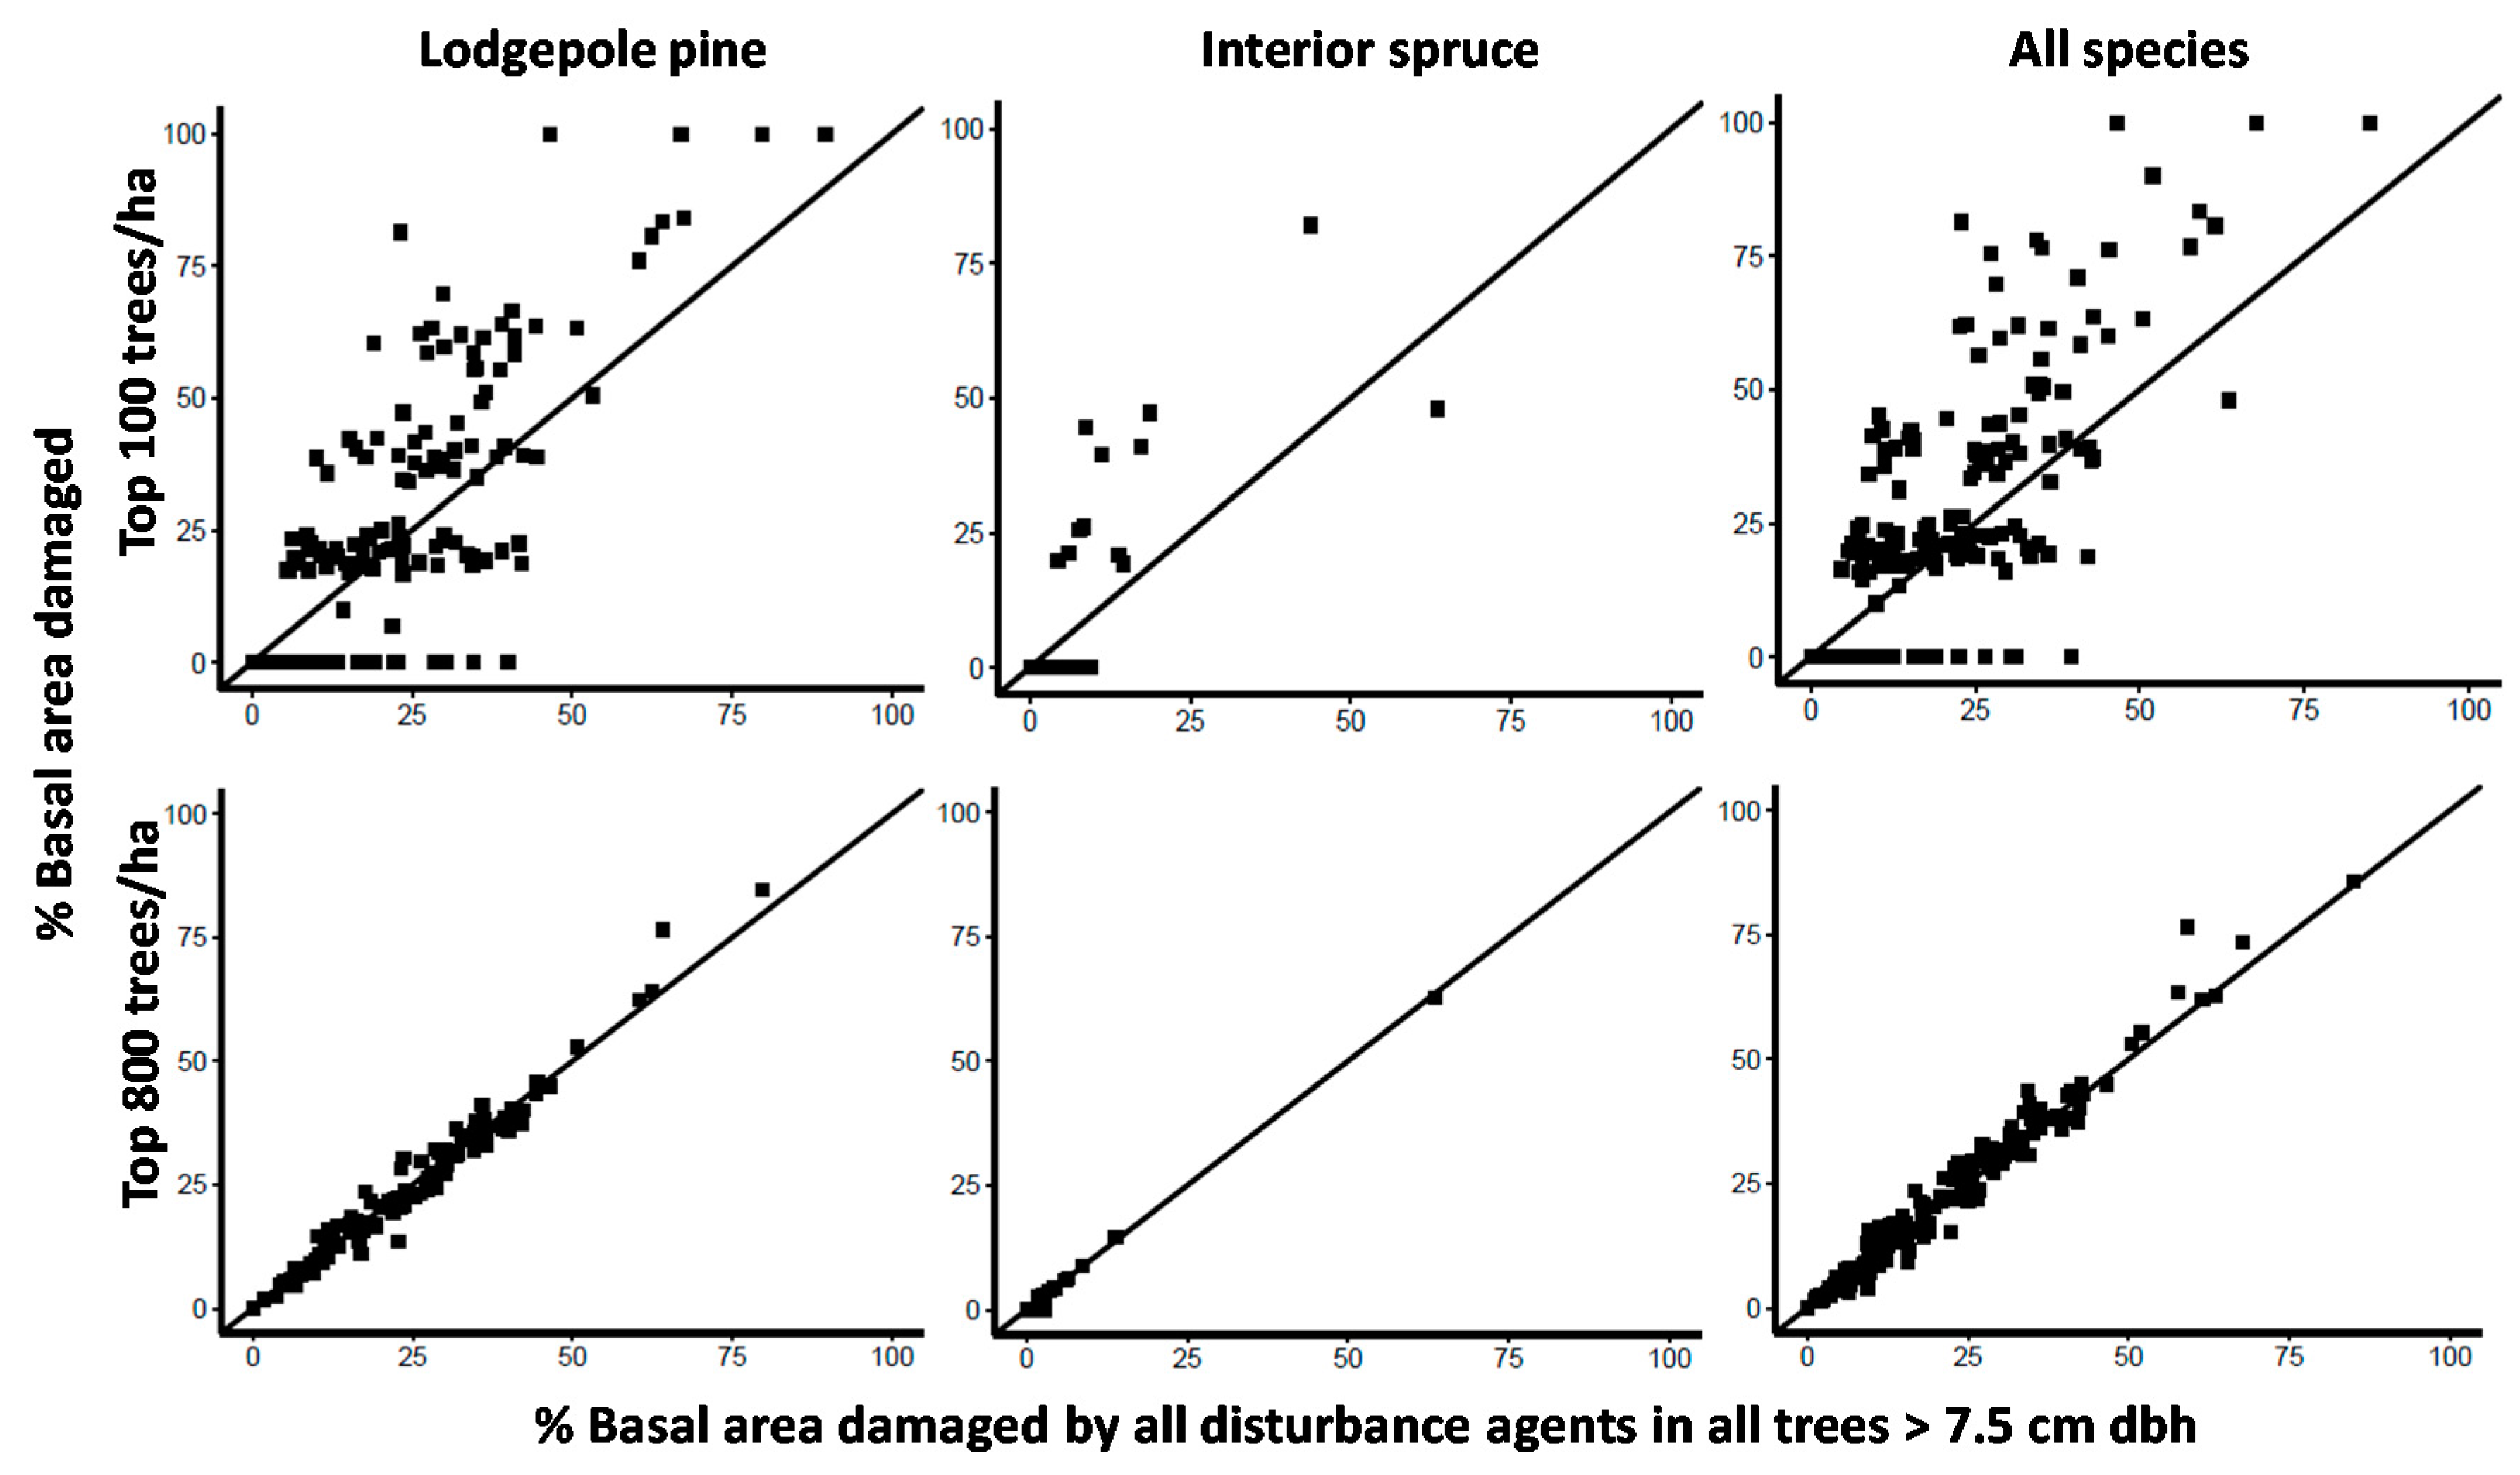
Table 1.
Mean annual and seasonal precipitation and temperature values based on weighted averages of daily weather records from 44 Environment Canada weather stations across northern British Columbia, Canada over the period of 1895–2008.
Table 1.
Mean annual and seasonal precipitation and temperature values based on weighted averages of daily weather records from 44 Environment Canada weather stations across northern British Columbia, Canada over the period of 1895–2008.
| Study Area Climate: 1895–2008 | Annual | Winter | Spring | Summer | Fall |
|---|---|---|---|---|---|
| Precipitation (mm) | 574.5 | 160.6 | 95.8 | 150.5 | 169.8 |
| Mean temperature (°C) | 2.9 | −8.6 | 3.2 | 13.4 | 3.5 |
| Max temperature (°C) | 30.8 | 8.4 | 24.4 | 30.6 | 24.0 |
| Min temperature (°C) | −36.1 | −34.4 | −21.8 | −1.0 | −19.2 |
Table 2.
Target population and sampling intensity represented by 176 randomly selected stands aged 15–40 across seven management units in northern BC, Canada.
Table 2.
Target population and sampling intensity represented by 176 randomly selected stands aged 15–40 across seven management units in northern BC, Canada.
| Management Unit | Target Population | Sample | Sampling Intensity (%) | |||
|---|---|---|---|---|---|---|
| Stands | Area (ha) | Stands | Area (ha) | Stands | Area | |
| Ft. St. James | 581 | 15,914.4 | 38 | 1054.2 | 6.5 | 6.6 |
| Prince George | 1862 | 65,134.2 | 24 | 585.8 | 1.3 | 0.9 |
| Vanderhoof | 924 | 26,334.2 | 25 | 813.3 | 2.7 | 3.1 |
| Mackenzie | 1296 | 36,560.7 | 34 | 966.7 | 2.6 | 2.6 |
| Lakes | 449 | 13,099.5 | 12 | 172.1 | 2.7 | 1.3 |
| Morice | 899 | 21,893.1 | 17 | 482.8 | 1.9 | 2.2 |
| Bulkley | 407 | 9689.8 | 26 | 917.0 | 6.4 | 9.5 |
| Total | 6418 | 188,625.9 | 176 | 4991.9 | 2.7 | 2.6 |
Table 3.
Changes in climatic variables across northern BC, Canada over the period of 1895–2008 using weighted means based on the length of the daily weather data record available from 44 Environment Canada weather stations. Bold values are statistically significant (p < 0.05).
Table 3.
Changes in climatic variables across northern BC, Canada over the period of 1895–2008 using weighted means based on the length of the daily weather data record available from 44 Environment Canada weather stations. Bold values are statistically significant (p < 0.05).
| Changes in Climate | Annual | Winter | Spring | Summer | Fall |
|---|---|---|---|---|---|
| Precipitation (%) | 7.8 | −8.1 | 10.3 | 18.3 | 16.1 |
| Mean Temperature (°C) | 1.1 | 2.2 | 1.0 | 0.8 | 0.5 |
| Max Temperature (°C) | 0.7 | 0.4 | 0.1 | 0.6 | −0.2 |
| Min Temperature (°C) | 3.6 | 3.5 | 3.3 | 1.4 | 1.9 |
Table 4.
Counts of trees by species and diameter class from 176 randomly selected stands aged 15–40 in northern BC, Canada.
Table 4.
Counts of trees by species and diameter class from 176 randomly selected stands aged 15–40 in northern BC, Canada.
| Tree Species | # Trees | ||||
|---|---|---|---|---|---|
| Diameter Class (cm) | |||||
| <7.5 | 7.5–12.4 | 12.5–17.4 | ≥17.5 | Total | |
| Lodgepole pine (Pinus contorta var latifolia) | 8457 | 3881 | 1732 | 242 | 14,312 |
| Interior spruce (Picea glauca × Picea engelmanii) | 5664 | 1373 | 423 | 114 | 7574 |
| Subalpine fir (Abies lasiocarpa) | 4216 | 457 | 112 | 44 | 4829 |
| Trembling aspen (Populus tremuloides) | 3639 | 291 | 82 | 38 | 4050 |
| Paper birch (Betula papyrifera) | 1093 | 32 | 4 | 4 | 1133 |
| Cottonwood (Populus trichocarpa, P. balsamifera) | 593 | 58 | 26 | 24 | 701 |
| Western hemlock (Tsuga heterophyla) | 129 | 11 | 2 | 1 | 143 |
| Black spruce (Picea mariana) | 58 | 8 | 1 | 0 | 67 |
| Western redcedar (Thuja plicata) | 18 | 2 | 0 | 0 | 20 |
| Douglas-fir (Pseudotsuga menziesii) | 28 | 4 | 1 | 2 | 35 |
| Mountain hemlock (Tsuga mertensiana) | 9 | 1 | 0 | 0 | 10 |
| Amabilis fir (Abies amabilis) | 7 | 0 | 0 | 0 | 7 |
| Total | 23,911 | 6118 | 2383 | 469 | 32,881 |
Table 5.
Counts of trees influenced by severe inter-tree competition and damaged by disturbance agents or by silvicultural treatments, by diameter class across 176 stands in northern BC, Canada. Damaged trees and those compromised by competition included both live and dead trees.
Table 5.
Counts of trees influenced by severe inter-tree competition and damaged by disturbance agents or by silvicultural treatments, by diameter class across 176 stands in northern BC, Canada. Damaged trees and those compromised by competition included both live and dead trees.
| # Trees | |||||
|---|---|---|---|---|---|
| Diameter Class (cm) | |||||
| <7.5 | 7.5–12.4 | 12.5–17.4 | ≥17.5 | Total | |
| All trees | 23,911 | 6118 | 2383 | 469 | 32,881 |
| Undamaged trees | 17,106 | 5174 | 1884 | 358 | 24,522 |
| Tree affected by severe inter-tree competition | 2523 | 14 | 0 | 1 | 2538 |
| Diseases that Maim | |||||
| Western gall rust (Endocronartium harknessii) | 725 | 308 | 167 | 17 | 1217 |
| Atropellis canker (Atropellis pinophila) | 0 | 13 | 4 | 1 | 18 |
| Unidentified stem disease | 1 | 0 | 0 | 0 | 1 |
| Insects that Maim | |||||
| Spruce leader weevil (Pissodes strobi) | 34 | 28 | 25 | 13 | 100 |
| Lodgepole pine terminal weevil (Pissodes terminalis) | 12 | 8 | 3 | 0 | 23 |
| Pitch moths (Petrova spp., Synanthedon sequoia) | 1 | 2 | 2 | 0 | 5 |
| Maiming Defects | |||||
| Fork, crook, dead/broken top | 404 | 159 | 103 | 32 | 698 |
| Frost damage | 12 | 1 | 1 | 0 | 14 |
| Sweep | 6 | 3 | 1 | 0 | 10 |
| Sunscald | 6 | 0 | 0 | 0 | 6 |
| Mammals and birds that maim | |||||
| Moose (Alces alces) | 821 | 35 | 10 | 5 | 871 |
| Porcupine (Erethizon dorsatum) | 41 | 11 | 11 | 3 | 66 |
| Douglas squirrel (Tamiasciurus douglasii) | 58 | 2 | 4 | 0 | 64 |
| Snowshoe hare (Lepus americanus) | 54 | 5 | 1 | 0 | 60 |
| Black bear (Ursus americanus) | 4 | 18 | 14 | 5 | 41 |
| Unknown mammal | 37 | 0 | 1 | 0 | 38 |
| Deer (Odocoileus spp.) | 2 | 0 | 0 | 0 | 2 |
| Sapsuckers (Sphyrapicus spp.) | 1 | 0 | 0 | 0 | 1 |
| Diseases that kill | |||||
| Comandra blister rust (Cronartium comandrae) | 678 | 105 | 30 | 0 | 813 |
| Stalactiform blister rust (Cronartium coleosporioides) | 61 | 21 | 3 | 0 | 85 |
| Tomentosus root disease (Onnia tomentosa) | 2 | 0 | 0 | 0 | 2 |
| Blackstain root disease (Leptographium wageneri) | 1 | 0 | 0 | 0 | 1 |
| Insects that kill | |||||
| Mountain pine beetle (Dendroctonus ponderosae) | 5 | 54 | 95 | 20 | 174 |
| Warren root collar weevil (Hylobius warreni) | 42 | 7 | 0 | 0 | 49 |
| Engraver beetles (Ips spp.) | 0 | 1 | 0 | 0 | 1 |
| Abiotic damage events that kill | |||||
| Snowpress | 571 | 100 | 16 | 3 | 690 |
| Fire | 14 | 4 | 1 | 0 | 19 |
| Windthrow | 5 | 2 | 1 | 1 | 9 |
| Flooding | 1 | 2 | 0 | 0 | 3 |
| Trees damaged by silviculture treatments | 356 | 19 | 3 | 5 | 383 |
| Unknown, unidentified killing damage agent | 312 | 21 | 2 | 4 | 339 |
| Growth Reducers | |||||
| Foliar diseases other than Dothistroma | 15 | 0 | 1 | 1 | 17 |
| Dothistroma needle blight (Dothistroma septosporum) | 0 | 1 | 0 | 0 | 1 |
| Total influenced by competition and damage | 6805 | 944 | 499 | 111 | 8359 |
Table 6.
Area weighted mean estimates of stem density in stems per hectare (including standard errors) by condition and diameter class for all tree species combined across 176 randomly selected stands in northern BC, Canada.
Table 6.
Area weighted mean estimates of stem density in stems per hectare (including standard errors) by condition and diameter class for all tree species combined across 176 randomly selected stands in northern BC, Canada.
| Diameter Class (cm) | ||||||||||
|---|---|---|---|---|---|---|---|---|---|---|
| <7.5 | 7.5–12.4 | 12.5–17.4 | 17.5+ | All Trees | ||||||
| Stems | % | Stems | % | Stems | % | Stems | % | Stems | % | |
| Condition | ||||||||||
| Live No Damage | 1628.9 (51.4) | 69.9 | 567.2 (8.3) | 84.5 | 220.1 (6.6) | 77.0 | 50.7 (2.5) | 76.9 | 2466.8 (54.1) | 73.6 |
| Competition | 303.5 (37.3) | 13.0 | 1.4 (0.6) | 0.2 | 0.0 (0.01) | 0.0 | 0.0 (0.0) | 0.0 | 304.9 (36.8) | 9.1 |
| Killer-Abiotic | 56.0 (12.3) | 2.4 | 10.0 (2.0) | 1.5 | 1.2 (0.4) | 0.4 | 0.6 (0.2) | 1.0 | 67.8 (13.7) | 2.0 |
| Killer-Disease | 46.2 (9.7) | 2.0 | 11.6 (2.0) | 1.7 | 3.9 (1.2) | 1.4 | 0.0 (0.0) | 0.0 | 61.7 (11.2) | 1.8 |
| Killer-Insects | 3.0 (0.8) | 0.1 | 7.0(2.4) | 1.0 | 15.5 (5.3) | 5.4 | 2.9 (0.6) | 4.4 | 28.3 (9.3) | 0.8 |
| Killer-Unknown | 30.6 (6.0) | 1.3 | 2.3 (0.9) | 0.3 | 0.1 (0.1) | 0.0 | 1.1 (0.7) | 1.6 | 34.1 (6.4) | 1.0 |
| Maimer-Animal | 113.9 (24.1) | 4.9 | 9.4 (2.5) | 1.4 | 4.5 (1.7) | 1.6 | 0.9 (0.4) | 1.4 | 128.7 (23.9) | 3.8 |
| Maimer-Defect | 27.6 (3.6) | 1.2 | 12.4 (2.0) | 1.8 | 11.8 (1.8) | 4.1 | 3.5 (0.8) | 5.4 | 55.3 (5.5) | 1.6 |
| Maimer-Disease | 86.3 (14.9) | 3.7 | 40.2 (5.4) | 6.0 | 23.3 (3.4) | 8.1 | 2.9 (0.6) | 4.4 | 152.7 (21.3) | 4.6 |
| Maimer-Insect | 8.6 (2.4) | 0.4 | 7.1 (2.6) | 1.1 | 5.0 (3.0) | 1.8 | 2.2 (1.6) | 3.4 | 23.0 (8.6) | 0.7 |
| Maimer-Treatment | 20.3 (8.9) | 0.9 | 2.5 (1.0) | 0.4 | 0.1 (0.1) | 0.0 | 0.9 (0.5) | 1.3 | 23.9 (9.1) | 0.7 |
| Reduced Growth | 4.3 (1.4) | 0.2 | 0.2 (0.1) | 0.0 | 0.4 (0.3) | 0.1 | 0.1 (0.1) | 0.2 | 5.0 (1.6) | 0.1 |
| Total | 2329.2 (221.8) | 671.2 (52.5) | 285.8 (31.3) | 66.0 (12.7) | 3352.1 (277.7) | |||||
Table 7.
Area weighted mean estimates of basal area (BA) in square meters per ha (including standard errors in brackets) by disturbance agent and diameter class for the major tree species across 176 randomly selected stands in northern BC, Canada. Note: Some disturbance agent groups did not impact some tree species and blank rows were removed from the table.
| Diameter Class (cm) | ||||||||
|---|---|---|---|---|---|---|---|---|
| 7.5–12.4 | 12.5–17.4 | 17.5+ | All Trees | |||||
| BA (m2/ha) | % | BA (m2/ha) | % | BA (m2/ha) | % | BA (m2/ha) | % | |
| Lodgepole pine | ||||||||
| Live No Damage | 2.691 (0.056) | 79.3 | 2.377 (0.09) | 70.8 | 0.643 (0.028) | 69.2 | 5.711 (0.165) | 74.4 |
| Competition | 0.006 (0.002) | 0.2 | 0 (0) | 0.0 | 0 (0) | 0.0 | 0.006 (0.002) | 0.1 |
| Killer-Abiotic | 0.066 (0.014) | 1.9 | 0.015 (0.006) | 0.4 | 0.023 (0.005) | 2.5 | 0.104 (0.016) | 1.4 |
| Killer-Disease | 0.09 (0.015) | 2.6 | 0.064 (0.02) | 1.9 | 0 (0) | 0.0 | 0.153 (0.03) | 2.0 |
| Killer-Insects | 0.062 (0.022) | 1.8 | 0.267 (0.084) | 8.0 | 0.103 (0.028) | 11.1 | 0.432 (0.144) | 5.6 |
| Killer-Unknown | 0.01 (0.004) | 0.3 | 0.001 (0.001) | 0.0 | 0 (0) | 0.0 | 0.01 (0.004) | 0.1 |
| Maimer-Animal | 0.049 (0.017) | 1.4 | 0.06 (0.028) | 1.8 | 0.007 (0.004) | 0.7 | 0.116 (0.042) | 1.5 |
| Maimer-Defect | 0.073 (0.012) | 2.1 | 0.181 (0.028) | 5.4 | 0.066 (0.016) | 7.1 | 0.32 (0.036) | 4.2 |
| Maimer-Disease | 0.328 (0.039) | 9.7 | 0.38 (0.053) | 11.3 | 0.082 (0.014) | 8.8 | 0.79 (0.092) | 10.3 |
| Maimer-Insect | 0.011 (0.003) | 0.3 | 0.01 (0.007) | 0.3 | 0 (0) | 0.0 | 0.021 (0.008) | 0.3 |
| Maimer-Treatment | 0.008 (0.004) | 0.2 | 0.001 (0.001) | 0.0 | 0.001 (0.001) | 0.1 | 0.01 (0.005) | 0.1 |
| Reduced Growth | 0.001 (0.001) | 0.0 | 0.002 (0.002) | 0.1 | 0.005 (0.005) | 0.5 | 0.009 (0.007) | 0.1 |
| Total | 3.392 (0.363) | 3.359 (0.471) | 0.929 (0.243) | 7.68 (0.828) | ||||
| Interior spruce | ||||||||
| Live No Damage | 1.011 (0.02) | 94.7 | 0.821 (0.046) | 90.8 | 0.513 (0.052) | 80.0 | 2.344 (0.12) | 89.8 |
| Competition | 0 (0) | 0.0 | 0 (0) | 0.0 | 0 (0) | 0.0 | 0 (0) | 0.0 |
| Killer-Abiotic | 0.002 (0.001) | 0.1 | 0.002 (0.001) | 0.3 | 0 (0) | 0.0 | 0.004 (0.001) | 0.1 |
| Killer-Unknown | 0 (0) | 0.0 | 0 (0) | 0.0 | 0.002 (0.003) | 0.4 | 0.002 (0.003) | 0.1 |
| Maimer-Animal | 0.003 (0.002) | 0.3 | 0 (0) | 0.0 | 0.016 (0.009) | 2.5 | 0.019 (0.01) | 0.7 |
| Maimer-Defect | 0.008 (0.002) | 0.7 | 0.004 (0.002) | 0.4 | 0.03 (0.012) | 4.7 | 0.042 (0.017) | 1.6 |
| Maimer-Insect | 0.044 (0.02) | 4.1 | 0.076 (0.046) | 8.4 | 0.073 (0.043) | 11.4 | 0.192 (0.108) | 7.4 |
| Maimer-Treatment | 0.001 (0) | 0.1 | 0.001 (0.001) | 0.1 | 0.007 (0.003) | 1.1 | 0.009 (0.003) | 0.3 |
| Total | 1.067 (0.144) | 0.904 (0.193) | 0.641 (0.208) | 2.612 (0.478) | ||||
| Subalpine fir | ||||||||
| Live No Damage | 0.37 (0.008) | 93.5 | 0.2 (0.005) | 94.4 | 0.251 (0.013) | 91.9 | 0.821 (0.015) | 93.2 |
| Competition | 0 (0) | 0.0 | 0 (0) | 0.0 | 0.001 (0.001) | 0.2 | 0.001 (0.001) | 0.1 |
| Killer-Abiotic | 0.004 (0.002) | 1.0 | 0 (0) | 0.0 | 0 (0) | 0.0 | 0.004 (0.002) | 0.5 |
| Killer-Unknown | 0.002 (0.001) | 0.4 | 0.001 (0.001) | 0.5 | 0 (0) | 0.0 | 0.003 (0.002) | 0.3 |
| Maimer-Animal | 0.004 (0.003) | 1.0 | 0.004 (0.004) | 2.0 | 0 (0) | 0.0 | 0.008 (0.005) | 0.9 |
| Maimer-Defect | 0.01 (0.003) | 2.5 | 0.002 (0.001) | 0.9 | 0.014 (0.008) | 5.2 | 0.026 (0.008) | 2.9 |
| Maimer-Treatment | 0.006 (0.006) | 1.5 | 0 (0) | 0.1 | 0.007 (0.008) | 2.7 | 0.014 (0.011) | 1.6 |
| Reduced Growth | 0 (0) | 0.1 | 0.005 (0.004) | 2.1 | 0 (0) | 0.0 | 0.005 (0.004) | 0.5 |
| Total | 0.396 (0.098) | 0.212 (0.052) | 0.273 (0.135) | 0.881 (0.22) | ||||
| Trembling aspen | ||||||||
| Live No Damage | 0.171 (0.007) | 84.1 | 0.122 (0.005) | 91.5 | 0.169 (0.005) | 58.2 | 0.463 (0.034) | 73.7 |
| Competition | 0.003 (0.002) | 1.4 | 0 (0) | 0.0 | 0 (0) | 0.0 | 0.003 (0.002) | 0.5 |
| Killer-Abiotic | 0.001 (0.001) | 0.5 | 0 (0) | 0.0 | 0 (0) | 0.0 | 0.001 (0.001) | 0.2 |
| Killer-Unknown | 0.006 (0.004) | 2.9 | 0 (0) | 0.0 | 0.054 (0.04) | 18.6 | 0.06 (0.048) | 9.5 |
| Maimer-Animal | 0.019 (0.007) | 9.3 | 0.009 (0.005) | 6.5 | 0.011 (0.011) | 3.8 | 0.039 (0.021) | 6.2 |
| Maimer-Defect | 0 (0) | 0.0 | 0.003 (0.002) | 2.0 | 0 (0) | 0.0 | 0.003 (0.002) | 0.4 |
| Maimer-Treatment | 0.003 (0.002) | 1.7 | 0 (0) | 0.0 | 0.056 (0.041) | 19.4 | 0.06 (0.044) | 9.5 |
| Total | 0.204 (0.044) | 0.133 (0.031) | 0.291 (0.121) | 0.628 (0.165) | ||||
© 2017 by the authors. Licensee MDPI, Basel, Switzerland. This article is an open access article distributed under the terms and conditions of the Creative Commons Attribution (CC BY) license (http://creativecommons.org/licenses/by/4.0/).
Share and Cite
MDPI and ACS Style
Woods, A.J.; Coates, K.D.; Watts, M.; Foord, V.; Holtzman, E.I. Warning Signals of Adverse Interactions between Climate Change and Native Stressors in British Columbia Forests. Forests 2017, 8, 280. https://doi.org/10.3390/f8080280
AMA Style
Woods AJ, Coates KD, Watts M, Foord V, Holtzman EI. Warning Signals of Adverse Interactions between Climate Change and Native Stressors in British Columbia Forests. Forests. 2017; 8(8):280. https://doi.org/10.3390/f8080280
Chicago/Turabian StyleWoods, Alex J., K. David Coates, Martin Watts, Vanessa Foord, and Erin I. Holtzman. 2017. "Warning Signals of Adverse Interactions between Climate Change and Native Stressors in British Columbia Forests" Forests 8, no. 8: 280. https://doi.org/10.3390/f8080280
Note that from the first issue of 2016, this journal uses article numbers instead of page numbers. See further details here.