Allometric Equations for Estimating Compartment Biomass and Stem Volume in Mature Hybrid Poplars: General or Site-Specific?


1
Fiducie de Recherche sur la Forêt des Cantons-de-l’Est/Eastern Townships Forest Research Trust, 1 rue Principale, Saint-Benoît-du-Lac, QC J0B 2M0, Canada
2
Department of Biology, University of Regina, 3737 Wascana Parkway, Regina, SK S4S 0A2, Canada
*
Author to whom correspondence should be addressed.
Forests 2017, 8(9), 309; https://doi.org/10.3390/f8090309
Submission received: 29 June 2017
/
Revised: 9 August 2017
/
Accepted: 21 August 2017
/
Published: 24 August 2017
Abstract
:We evaluated the extent to which general or site-specific allometric equations, using diameter at breast height (DBH) as a predictor, are more accurate for estimating stem volume, stem biomass, branch biomass, aboveground woody biomass, and coarse root biomass in 14 year-old plantations of Populus canadensis × Populus maximowiczii (clone DN × M-915508) located along an environmental gradient in southern Québec (eastern Canada). The effect of tree size and site on stem wood basic density, moisture content, and proportion of branch biomass was also evaluated. For stem volume, stem biomass, and aboveground biomass, site-specific and general models had comparable fit and accuracy, but lower Akaike’s Information Criterion (AICc) values were observed for the general models. For the branch and coarse root biomass, higher fit and accuracy and lower AICc values were observed for the site-specific models. Allometric trajectory changes (plastic allometry) across sites were mainly observed for coarse root biomass, branch biomass, and stem volume. On the low fertility site, allocation was increased to coarse roots and decreased to stem volume. Site-specific tradeoffs between tree architecture and stem wood density explained the relatively invariant allometry for the whole aboveground woody biomass across the plantation sites. On the high fertility sites, basic wood density was the lowest and declined as tree DBH increased. At all sites, stem wood moisture content and the proportion of branch biomass increased with DBH. Overall, this study showed that biomass allometry, tree architecture, and biomass quality are a function of both tree size and plantation environment in hybrid poplar. Allometric model selection (site-specific or general) should depend on the objective pursued (evaluation of yield, nutrient budget, carbon stocks).
1. Introduction
The afforestation of abandoned farmland with fast-growing species from the Salicaceae family provides tremendous opportunities to increase wood and biomass production, to sequester atmospheric carbon dioxide (CO2) in terrestrial ecosystems, and to accelerate forest ecosystem restoration [1,2,3]. Yet, high nutrient demanding tree species, such as hybrid poplars, pose serious challenges related to nutrient management over multiple rotations on marginal agricultural land [4]. As nutrient-rich coarse roots and branch biomass are increasingly harvested for the production of bioenergy, off-site nutrient exportation is also a growing concern because of its potential adverse impacts on soil fertility and long-term stand productivity [5,6,7].
To correctly evaluate the nutrient budget of hybrid poplar plantations and the impacts of whole-tree harvest vs. stem harvest on carbon and nutrient cycling, and on the provision of several key ecosystem services in planted forests (C and nutrient storage, biomass and wood production, microclimate and habitat creation), an accurate knowledge of plantation structure and biomass distribution in different tree compartments is required. The estimation of stem volume and compartment biomass at the plantation-scale often requires that trees of various sizes be felled, dissected into components, and weighed or measured [8]. Furthermore, coarse root biomass samples need to be collected and weighed following soil monolith excavation on a large surface area, and to a sufficient depth, to insure a representative sample is taken [9]. The biomass and volume data obtained from these destructive sampling procedures are then used to develop allometric equations between a predictor variable that is easily measurable in the field, usually diameter at breast height (DBH), and response variables, such as stem volume or the biomass of a given tree compartment. Then, these relationships are used to scale compartment biomass and volume at the plantation-level using DBH values measured on each tree, or on a representative subset of trees of the plantation [8]. Thus, the allometric equations selected have a direct effect on the volume or biomass estimated at the plantation-level.
For the specific case of hybrid poplar plantations, the use of allometric equations outside of locations reflecting the conditions on which they were developed can lead to important bias in aboveground woody biomass and bole biomass estimates [10]. Large prediction bias was equally observed when branch biomass was estimated using allometric equations developed in other studies with similar or different genetic material from the Populus genus [11]. These observations are not surprising given the many factors that are known to influence allometric relationships between DBH and compartment biomass or volume in hybrid poplars, including plantation environment or site fertility [12,13], genotype or clone family [3,14,15,16], tree age [3], and the presence of diseases, such as leaf rust [14,17]. The choice of analytical procedures used to develop biomass equations can also influence allometric equation parameters, and consequently the predicted values [10,18].
Allometric studies done across different environments can be useful in determining if the size relationship between organs or compartments of a species or a genotype are plastic [19]. Phenotypic plasticity can be defined as the ability of a genotype to express different phenotypes when exposed to different environments [20]. Thus, plasticity in allocation (plastic allometry) can be defined as a change in the allometric trajectory in response to the growth environment, and not only a change in the growth rate [21]. Plastic allometry in biomass allocation is not a universal property among plant species [22]. Many herbaceous species are form-conservative across resource gradients, while others have displayed plastic allocation patterns [23,24]. Such trends have equally been found among tree species. For example, under experimental drought conditions, light availability had largely influenced the allometric trajectory between total biomass and belowground biomass of seedlings in Fagus sylvatica, but not in Picea abies [25]. The recent analysis from Forrester et al. [26] suggests a strong environmental effect on the allometric relationship between DBH and compartment biomass, as shown by the many divergent allometric trajectories found for the same species across European sites.
Among pioneer tree species with an indeterminate growth pattern, contrasting observations have been equally reported. In planted and coppiced-regenerated stands of Eucalyptus globulus, no evidence of environmental effect on aboveground biomass allometry was observed across an interegional climatic and site fertility gradient in Portugal [27]. Similarly, little difference in allometric relationships between DBH and aboveground biomass or root biomass were found after 12 years in both Betula pendula and Betula pubescens growing on contrasting soil types and at different spacings [28]. However, in short-rotation coppices of willows (Salix spp.) the effect of plantation site on aboveground biomass allometry has been well-documented [29,30].
In hybrid poplar, greenhouse studies have shown changes in the root to shoot allometry in response to soil nitrogen (N) availability and to soil pH variations, with proportionally greater biomass being allocated to the shoot under high N availability and at higher soil pH [31,32]. Similarly, at equivalent DBH, less coarse root biomass was observed in 13-year old hybrid poplars growing on high fertility sites than on moderate fertility sites [12]. These previous observations are consistent with the optimal partitioning theory, which suggests that plants primarily allocate biomass or invest resources to compartments that are crucial for acquiring the most limiting resource [33]. Wu and Stettler [34] also observed that crown architecture and allometries were strongly affected by the plantation environment, with more and longer branches characterizing 2 year-old hybrid poplars growing in a warmer and sunnier site than in a cooler and cloudier site.
Most field studies that have attempted to isolate the effect of plantation site on hybrid poplar biomass allometry were confronted with confounding factors (different stand ages, presence of a damaging agent at one site but not at the others, multi-clone sampling) [12,13,14]. Such confounding factors weaken conclusions related to potential allometry changes across sites or environmental gradients. Thus, the question to which extent general or site-specific allometric equations are more accurate for estimating the volume and compartment biomass of a given clone, after a given time period, remains unanswered. Such a question is legitimate given the great demand for more generalized biomass equations, which could reduce labor and costs related to biomass prediction [14]. While biomass allometry varied with site in commercial willow plantations in Sweden, generalized models had prediction errors of less than 10% when compared to site-specific models; an error margin sufficient for management decisions [29,35].
The destructive sampling of trees of different sizes for the purposes of allometric studies can also provide useful information about biomass and wood quality indicators (stem wood basic density, wood moisture content, proportion of aboveground woody biomass consisting of branch biomass) [11,36,37,38]. Some of these biomass properties are known to vary with the plantation environment, but also with tree size or growth rate in poplars [11,13,36]. For example, lower stem density has been reported in poplars growing on high vs. moderate fertility sites [39,40], while wood density and the proportion of branch biomass of a Populus maximowiczii × Populus trichocarpa clone were found to be negatively related to total height and DBH, respectively [13]. In a study involving 37 clones from both the Salix and Populus genera, Tharakan et al. [38] observed that stem wood density and stem moisture content were strongly and negatively correlated. Thus, if wood density decreases with tree size, stem moisture should increase.
In this study, we used allometric scaling (simple power law) [41] to evaluate to which extent general or site-specific equations (with DBH as a predictor variable) are more accurate for estimating stem volume, stem biomass, branch biomass, aboveground woody biomass, and coarse root biomass in 14 year-old monoclonal hybrid poplar plantations located along an environmental gradient in the southern Québec region (eastern Canada). Based on previous studies that have reported plastic allometry for various biomass compartments across plantation environments or resource gradients [12,13,32,34,42], we hypothesize that site-specific equations will be more accurate for predicting biomass of all compartments and stem volume. A secondary objective of this study was to evaluate the effect of plantation site and tree size (DBH) on stem basic density, on stem water content, and on the proportion of aboveground woody biomass consisting of branch biomass. We hypothesize that stem basic density and branch biomass proportion will decrease with tree DBH, and that lower stem basic density will be observed on higher fertility sites. We also hypothesize that stem moisture content will increase with tree DBH.
2. Materials and Methods
2.1. Study Sites and Experimental Design
Three plantation sites, located along a regional elevation and soil fertility gradient, in the Eastern Townships region of southern Québec, were used for this study: Brompton (Bro), Mégantic (Meg), and Ogden (Ogd). All sites were located within a radius of 80 km. Elevation above sea level, mean annual temperature, and mean annual precipitation data for each site are provided in Table 1. A continental subhumid moderate climate characterizes the Brompton and Ogden sites, whereas a continental subpolar–subhumid climate characterizes the Mégantic site, which is located at the highest elevation.
All plantations were established on abandoned farmland sites dominated by herbaceous vegetation. Thick glacial till deposits of at least 2 m of depth and gentle slopes (<5%) characterized the plantation sites [43]. In the year of the study (2013), all plantations were at the end of their 14th growing season. Pre-plantation site preparation included ploughing in the fall of 1999 and disking the following spring, to physically enhance soil conditions and facilitate planting. In the spring of 2000, bare-root planting stock with approximately 2 m-long stems were planted manually at 30 to 40 cm depth. Planting stock (1-0) was provided by the Berthierville nursery of the Ministère des Forêts, de la Faune et des Parcs du Québec (MFFP) of Québec. Competing vegetation was eliminated with an application of glyphosate herbicide over the entire plantation area in June 2000, and between plantation rows only in June 2001, using a modified Argo-type small recreational vehicle with a boom sprayer equipped with a rubber skirt to avoid damaging the trees with spray drift.
Each of the three plantation sites contained a single clone (DN × M-915508), which is a female hybrid between Populus canadensis (DN) and P. maximowiczii (M), developed in Québec and recommended for commercial production over the entire study area [44]. This widely used clone has shown good productivity across a wide range of environmental conditions [45,46,47,48,49]. Each plantation had six different planting densities (plots): (1) 494 trees/ha (4.5 m × 4.5 m/tree); (2) 741 trees/ha (4.5 m × 3 m/tree); (3) 988 trees/ha (4.5 m × 2.25 m/tree); (4) 1111 trees/ha (3 m × 3 m/tree); (5) 1481 trees/ha (3 m × 2.25 m/tree); and (6) 1975 trees/ha (2.25 m × 2.25 m/tree). In each plot, a total of 20 trees was initially planted and plots were separated by two buffer rows. Each buffer row had the same planting density as its adjacent plot. Given that each plot contains the same number of trees, but different tree densities, the plot size varied from 101 to 405 m2 depending on planting density. The experimental design contains 6 plots per site and 3 sites for a total of 18 plots.
2.2. Soil Characteristics
In each plot, a composite soil sample was collected to a 20 cm depth. The soil samples were air dried and sieved (2 mm). Soil pH, percent clay, silt, and sand content, percent organic matter, cation exchange capacity (CEC), base saturation, and available phosphorus (P), calcium (Ca), potassium (K) and magnesium (Mg) concentrations were determined by the Agridirect Inc. soil analysis lab in Longueuil, QC, Canada. The methods used were those recommended by the Conseil des productions végétales du Québec [50]. The determination of soil pH was made using a 1:1 ratio of distilled water to soil. For particle size analyses, the Bouyoucos [51] method was used. Percent organic matter was determined by weight loss after ignition at 550 °C for 4 h. The cation exchange capacity and base saturation were calculated following the recommendations of the Centre de référence en agriculture et agroalimentaire du Québec [52], after Ca, K, and Mg extraction with the Mehlich III method [53] and concentration determination using ICP emission spectroscopy [54]. Soil P was also extracted with the Mehlich III method and its concentration determined using ICP emission spectroscopy. The soil characteristics are presented in Table 1.
2.3. Destructive Sampling for Aboveground Biomass Compartments and Stem Volume
In late October 2013 (end of 14th growing season), 12 healthy and leafless hybrid poplar trees were selected for destructive harvest at each site and their DBH was measured. At the site-level, these 12 trees were selected as follows: 4 trees from the 494 trees/ha plot, 4 trees from the 1111 trees/ha plot, and 4 trees from the 1975 trees/ha plot. Thus, the destructive sampling involved 3 sites × 3 planting densities/site × 4 trees/planting density for a total of 36 trees. In each plot, four trees were selected in order to cover a relatively large range of DBH values. Trees were always selected in an area of the plots where there was full stocking (no mortality) and non-neighbor trees were selected as much as possible to insure the independence of the observations. Selected trees were then cut just above the root collar, aboveground compartments (branches and stem) were separated in the field, and total tree height was measured.
In order to calculate stem volume (outside of the bark) and stem biomass (including bark) for the 36 sampled trees, each tree stem was dissected into sections according to three different DBH classes, and then each section was measured for volume and fresh biomass using a tripod-scale [3]. For large trees (DBH > 20 cm), stems were dissected into four sections: (1) tree base diameter to DBH; (2) DBH to 20 cm diameter; (3) 20 to 10 cm diameter; and (4) 10 cm diameter to 3 cm diameter. For medium size trees (DBH = 10–20 cm), stems were dissected into three sections: (1) tree base diameter to DBH; (2) DBH to 10 cm diameter; and (3) 10 cm diameter to 3 cm diameter. For small trees (DBH < 10 cm), stems were dissected into two sections: (1) tree base diameter to DBH; and (2) DBH to 3 cm diameter. In all cases, the tree tip (end of stem section, with diameter < 3 cm) was pooled with the branch sample. Volumes of different stem sections were then summed to obtain the total stem volume for each of the sampled hybrid poplars. The volume calculations of each stem section were made using Equation (1) [55]:
where V is the volume of a stem section, D1 is the basal diameter of the stem section, D2 is the diameter at the top of the stem section, and L is the length of the stem section. Along each stem section previously described, one subsample (stem disks of approximately 5 cm in length) was collected, fresh-weighed in the field, and taken back to the lab for oven-drying (95 °C) until a constant mass was reached. An oven-dry weight to fresh weight conversion ratio was then calculated for each subsample, and this ratio was used to estimate the dry weight of each stem section fresh-weighed in the field. Finally, for each of the felled trees, the whole branch biomass was fresh-weighed in the field and a branch subsample from two representative branches was collected to determine the dry weight to fresh weight ratio. This ratio was used to estimate the whole-tree branch biomass on an oven-dry mass basis.
V = π/12(D12 + D22 + D1D2) L
2.4. Coarse Root Biomass Sampling
In July 2013, 12 healthy hybrid poplar trees were selected for coarse root biomass (root diameter > 2 mm) sampling at each site. At the site level, those 12 trees were selected following the same criteria as for the aboveground biomass destructive sampling (see Section 2.3). For each selected tree, a large rectangular pit was excavated to a 60 cm depth using a small mechanical excavator. The surface area of the excavated pits corresponded to 25% of the surface area occupied by a single tree [12] in the three different planting density plots (Scheme 1). The position of the quadrant sampled was randomly selected. Thus, for each tree, the soil volume sampled for coarse root biomass was 3.04 m3 in the 494 trees/ha plots, 1.35 m3 in the 1111 trees/ha plots, and 0.76 m3 in the 1975 trees/ha plots. This root sampling method was chosen because it is recommended to use a combination of large monolith sampling and allometric calculations to obtain representative estimates of coarse root biomass at the tree-level [9]. Thus, the sampled tree DBH was measured prior to excavation, as it is a strong predictor of coarse root biomass in planted poplars [5,12,56,57,58]. To facilitate the work of the excavator operator, the sampling area was delineated with white paint sprayed on the ground. During excavation, all coarse roots found in pits were cut with a hand saw, collected, and brought to a washing facility. The entirety of the coarse root samples for each pit was then air-dried for 2 months. For each plot, the entire air-dried coarse root sample was then weighed and a subsample was taken to determine an oven-dry weight to air-dry weight ratio, which was then used to estimate coarse root biomass on an oven-dry basis. This procedure was preferred to the preparation of subsamples in the field on fresh root biomass, which was dirty and required water cleaning prior to weighing and subsampling. Once all of the coarse root biomass was removed from an excavated pit, soil was removed around the tap root of the tree. Tap root length (l), large end diameter (da), and small end diameters (db) were measured in the field with a caliper. The tap root volume was calculated using the Smalian formula [8]: V = πl(da2 + db2)/8. The tap root biomass was obtained by multiplying its volume by the mean density of hybrid poplar coarse roots observed in mature plantations (0.313 g/cm3) [5]. For each sampled tree, the total coarse root biomass (on an oven-dry weight basis) was calculated as follows: 4 × Biomass collected from a pit + Taproot biomass = Total coarse root biomass.
2.5. Aboveground Biomass Properties
Stem basic density was calculated for each of the destructively sampled trees by dividing the oven-dry biomass of the stem (kg) by the green volume of the stem (dm3, outside bark) [40]. The moisture content (%) of a stem biomass was calculated as follows: 100 × (1 − Bdry/Bfresh), where Bdry represents the stem biomass on an oven-dry basis, and Bfresh represents the fresh stem biomass weighed in the field just after tree felling and dissection. The relative proportion (%) of aboveground woody biomass consisting of branch biomass was calculated as follows: 100 × Bbranch/Babv, where Bbranch is the oven-dry biomass of the branches, and Babv is the oven-dry biomass of the stem and branches.
2.6. Allometric Equations
Prior to the development of allometric equations with the data collected on the 36 sampled trees (see Section 2.3 and Section 2.4), a graphical exploration of the data was undertaken on both arithmetic and logarithmic scales [59]. The nonlinearity of the untransformed data distribution was evident from our data set when DBH (predictor variable) values were plotted against stem volume or compartment biomass (response variables) values. The shape of the data distribution strongly suggested a power relationship between DBH and response variables. The graphical exploration of the data also revealed a multiplicative and heteroscedastic error structure on the arithmetic scale, which suggested that log-linear regression should be used in preference to nonlinear regression [60]. Thus, the predictor and response variables were log-transformed prior to analysis. An analysis of covariance (ANCOVA) was further used as an exploratory analysis to test the significance of Site (main effect), DBH (the covariate), and Site × DBH interaction on the response variables (stem volume, stem biomass, branch biomass, aboveground woody biomass, and coarse root biomass) (Table 2). Given the significance of the Site effect and/or the Site × DBH interaction effect in explaining the variation of most response variables, it was reasonable to undertake data analyses using both general and site-specific allometric models.
General allometric equations were developed with the data collected across the three sites (n = 36), while site-specific equations were developed with the 12 sampled trees at each site. For the purpose of this study, all allometric relationships were developed using the linearized form of the simple power law function, as allometric scaling theory generally assumes a power function that describes growth as a multiplicative process [61]. The simple power function is also widely used in forestry and in short-rotation forestry to describe aboveground and belowground compartment biomass or stem volume growth as a function of tree DBH [5,12,62,63,64]. The simple power law and its linearized form obtained following logarithmic transformation are provided in Equations (2) and (3):
where X is the predictor variable (DBH), Y is the response variable (stem volume, stem biomass, branch biomass, aboveground biomass, or coarse root biomass), and a and b are the allometric function parameters. In other studies, many biomass or volume equations for hybrid poplar have been developed with additional predictor variables (e.g., tree height and/or planting density) used in combination with tree DBH [10,57,65]. However, the use of those additional predictor variables was not considered in this study, as it is not supported by the allometry theory, and because tree height and planting density were strongly correlated with DBH (for tree height r = 0.82, p < 0.001; for planting density, r = −0.64, p < 0.001). Such multicollinearity among predictor variables is undesirable when developing allometric models [18,66].
Y = aXb
ln (Y) = ln (a) + b(ln X)
General and site-specific equations were first fitted using the ordinary least squares (OLS) regression method. Residual plots (Figures S1–S5) and the following statistics were used as a basis for comparison between general and site-specific models: (1) the coefficient of determination (R2), which gives the proportion of the variation in the response variable that is explained by variations in the X variable, often referred to as the fit of the linear relationship; (2) the standard error of model parameters; (3) the percent relative standard error (PRSE) of model parameters, calculated as 100 × (SE/θ), where SE and θ are the standard error of the parameter and the parameter value, respectively; (4) statistical significance of model parameters (p-values); (5) the normality of residuals distribution using the Shapiro–Wilk goodness of fit test (p < W); (6) the number of outlier observations (number of outliers/number of observations), with observations having studentized residuals exceeding –2.0 or +2.0 being considered outliers; and (7) the prediction error or bias calculated as the mean absolute percentage error (MAPE) [18]:
where Yo and Yp respectively represent the observed and predicted values for stem volume or the biomass of the different tree compartments, and n is the number of observations. Given that some of the observed values in a few models were considered statistical outliers using the OLS regression method (Table 3), we also used the robust regression method to fit our bivariate allometry data, since robust regression reduces the influence of outliers on estimated allometric parameters [18,67]. The Huber M-estimation method was used in the robust regression analysis [67,68]. The model parameters and their associated standard error and PRSE are provided in Table S1. Given that estimated allometric parameters were identical or near-identical for all models using the OLS or robust regression method (Table S1), only models developed using the OLS regression method are presented. The few outliers detected using the studentized residuals were never removed from the data set. A visual examination of the data confirmed that the detected outliers were not the product of a sampling error, but likely the reflection of a higher variation in measured traits. Table 3 summarizes the parameter estimates and statistics for the general and site-specific equations, while Table 4 shows the prediction error (MAPE) associated with the use of site-specific vs. general equations.
To further test the goodness-of-fit of the general vs. site-specific allometric models, we used the bias-corrected Akaike’s Information Criterion (AICc) test for finite sample sizes [69]. It is generally assumed that the model having the smallest AICc value is the preferred model [69]. Table 5 reports the AICc values for the general and site-specific allometric models developed in this study (see Table 3).
A cross-validation test was also included in order to compare the predictive capacity of the general and site-specific allometric models when applied to an independent data set. Since our data set had a limited amount of observations, especially in the case of the site-specific models, it was not possible to randomly divide our data into a training set and a validation set of equal size. Alternatively, we used the K-fold cross-validation procedure [70]. When the goal of model selection is estimation, the optimal K value (the folds) should be between 5 and 10 [71]. For each model, we used a fivefold cross-validation procedure. The procedure was repeated 5 times, and the cross-validation statistics (cross-validated R2) were averaged (Table 6).
2.7. Statistical Analysis
Soil characteristics data were analyzed using a one-way ANOVA in a fixed factorial design, where Planting density is the main effect and Site is the blocking factor [72]. When a factor was declared statistically significant (p < 0.05, p < 0.01 and p < 0.001), the Tukey-HSD (honest significant difference) test was used to declare significant differences between means (α = 0.05) [73]. For the basic stem density and moisture content data collected on the 36 sampled trees across the three sites, the Tukey-HSD test was used to declare significant differences between site-level means (α = 0.05). Linear regressions were also used to explore the relationships between DBH and stem basic density, stem moisture content, or the proportion of aboveground biomass consisting of branch biomass. All statistical analyses were done using JMP 11 from SAS Institute (Cary, NC, USA).
3. Results and Discussion
3.1. Equations for Compartment Biomass and Stem Volume Estimations, General or Site-Specific?
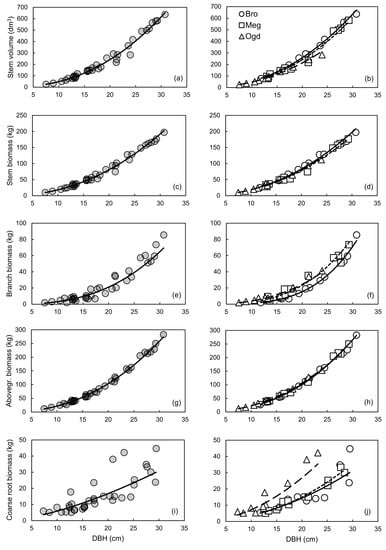
We had hypothesized that the allometric trajectory would change between sites for all compartments. However, plastic allometry was observed only for some compartments (Figure 1). The largest variations in allometric trajectory were observed for coarse root biomass, followed by branch biomass and stem volume (Figure 1b,f,j). Little change in the allometric trajectory was observed between sites for the stem and aboveground biomass (Figure 1d,h). A potential explanation of these results may be related to the independent genetic control of aboveground and belowground biomass traits in hybrid poplars [74].
A reduction of the prediction error (MAPE) and an improvement in the fit (R2), in the normality of residuals distribution and in model accuracy (cross-validated R2) were mainly observed when the site-specific equations for coarse root and branch biomass were compared to the general models (Figures S3 and S5; Table 3, Table 4 and Table 6). The AICc values also suggest that site-specific models should be preferred for those compartments (Table 5). Overall, the site-specific equations also tended to have a reduced number of outliers when compared to the general equations (Table 3). Compared to the site-specific models, the general models for stem biomass and aboveground biomass had a similar fit (R2) (Table 3), a more normal residuals distribution (Figures S2 and S4), lower PRSE and AICc values, and similar prediction error (MAPE) and accuracy (cross-validated R2) (Table 3, Table 4, Table 5 and Table 6). However, despite the site-specific models having much lower AICc values than the general models for stem volume, stem biomass and aboveground biomass, accuracy was very high for both model types (Table 6).
Based on these results, the use of general vs. site-specific allometric relationships should depend on the objective that is pursued. When the goal is to obtain biomass or C stock estimates for the whole aboveground woody biomass or for stem biomass, the use of the general models is straightforward, and independent of the plantation site. If the estimation of nutrients and C stocks in branches and coarse roots or volume yield evaluation is the focus, site-specific equations may provide more accurate estimates (Table 4). An overview of the variation in compartment biomass and stem volume values predicted with the site-specific and general equations is provided in Table 7. The use of the general equation would lead to an underestimation of the coarse root biomass at the Ogden site (from 22% at 10 cm of DBH, up to 88% at 30 cm of DBH) and an overestimation of 10–43% at the Brompton and Mégantic sites for trees with DBH of 20 cm or less (Table 7). The same could be said about the use of the general equation for estimating branch biomass at the Brompton site. It should also be noted that aboveground woody biomass can be estimated using the sum of branch and stem biomass calculated separately, or calculated directly using only the aboveground biomass equation, with little consequence on the predicted values (Table 8).
The relationship between DBH and aboveground biomass was found to be plastic across subgroups of sites for clone OP42 (P. maximowiczii × P. trichocarpa) in southern Scandinavia [13]. However, in the study of Taero et al. [13], plantation age varied considerably between sampled stands (from 3 to 31 years); with age being a factor affecting the relationship between DBH and aboveground biomass in hybrid poplars [3]. Furthermore, other studies have shown that the genome regions associated with the genetic control of biomass traits over the years are mostly independent from one another in hybrid poplars [74,75]. Also, because allometric plasticity is genetically based, it is subjected to differences between genotypes [76]. This could explain the discrepancy between this study and the study by Taero et al. For the aboveground woody biomass compartment, our results corroborate the conclusion of Dillen et al. [14], which suggests that a single equation might be applied for a given clone or a hybrid family, regardless of the environmental conditions, when stand age and plantation management are comparable.
Most of the equations presented in this study satisfied the recently proposed selection criterion for biomass estimation models (PRSE < 30%, MAPE < 10% and Outliers < 10% of observed values) [18]. Yet, MAPE values exceeding 10% were mostly observed for the general models developed for estimating branch and coarse root biomass (Table 4). Our results also indicated that ANCOVA should not be used alone to interpret plastic responses in allometric studies. The results from ANCOVA in Table 2 suggest that the Site effect and the Site × DBH interaction effect were statistically significant, while biologically, allometry for aboveground woody biomass was almost identical across sites (Figure 1h).
3.2. High Plasticity in Coarse Root Biomass Allocation: The Effect of Soil Fertility
The plasticity observed in hybrid poplar coarse root biomass allocation supports the hypothesis that allometric trajectories can vary for particular organs in response to changing environmental conditions [21]. The plastic allometry observed in the coarse root biomass of clone DN × M-915508 (Figure 1j) corroborates previous findings in mature hybrid poplar plantations of the study area, which suggested that hybrid poplars proportionally allocate more biomass to coarse roots on lower fertility sites than on higher fertility sites [12]. In this study, the Ogden site had by far the least fertile soil in terms of P, Ca, and Mg availability, but also in terms of base saturation and CEC (Table 1). Thus, the high allocation of biomass to coarse roots observed at the Ogden site potentially reflects a strategy to improve access to limiting soil nutrients. Such an interpretation is consistent with the optimal partitioning theory, which suggests that plants allocate resources to improve their access to the currently limiting factor [33,77]. Alternatively, given that the storage function of coarse roots gains in importance as trees mature [78], such a function may be more important than the nutrient and water uptake functions of coarse roots in 14 year-old hybrid poplars. Poplars potentially allocate more biomass to coarse roots on the least fertile sites in order to build a larger storage pool for nonstructural carbohydrates and proteins [79]. Such a strategy would be useful to sustain high levels of fine root production, as well as to enhance root exudation, which could then stimulate the microbial decomposition of organic matter and mycorrhizal association, thus improving access to soil nutrients [79].
The predicted values from the site-specific biomass equations further suggest that poplars from lower fertility sites (Ogden) proportionally accumulate more total biomass (aboveground + coarse root) compared to poplars growing on soils of higher fertility (Brompton and Mégantic sites) (Table 7). Such a result is the direct consequence of the invariant allometry observed for aboveground woody biomass across sites, and the plastic allometry observed for coarse root biomass (Figure 1h,j). Therefore, a proportionally lower shoot to root ratio is observed at the Ogden site (Table 7), a trend consistent with the optimal partitioning theory. Thus, although aboveground biomass growth at the population level is generally much lower at low vs. high fertility sites [3,46,47,48], this study provides the first evidence that, at the individual level, hybrid poplars of equivalent DBH potentially accumulate more biomass at the lower fertility sites (Table 1 and Table 7). A recent meta-analysis suggests that in increasingly cold climates, the proportional biomass allocation to roots was greater for both angiosperms and gymnosperms [80]. However, in this regional study, site fertility was found to be a more plausible indicator of differences in shoot to root ratios across sites. This is because higher shoot to root ratios characterized poplars growing at the high fertility sites (Brompton and Mégantic), which are located at opposite ends of the temperature gradient used in this study (Table 1 and Table 7).
From an evolutionary perspective, a higher allocation to coarse root biomass in soils with low resource availability potentially reflects a particular adaptation strategy of riparian poplars, which naturally colonize streamside soils with low nutrient availability (gravel and sand bars) and rapidly subsiding water tables [81,82]. Also, plasticity in belowground allocation in riparian poplars may contribute to enhance tree stability along eroding streambanks and in ecotones facing strong winds. In addition, plasticity in allocation to roots may be important for the rapid colonization of freshly deposited sediments following flood events. Because riparian ecotones often represent a much more stressful environment than the studied plantations, it is probable that a greater proportional allocation to root biomass would be found in natural riparian poplar stands. This would be especially the case in semi-arid regions where riparian poplars are phreatophytic, as they grow deep root systems in the capillary fringe just above the alluvial groundwater table [83]. Because plasticity in allocation is genetically determined [76,84], the numerous stressors affecting tree growth in riparian areas may have contributed to the natural selection of genotypes exhibiting greater plasticity. This may have enhanced the colonizing capabilities of poplars, their resilience to severe disturbances, and their opportunism in the exploitation of resources with variable availability during the growing season.
From a practical perspective, the selection of genotypes having high plasticity in belowground allocation may improve plantation success and resilience under more stressful environments and in a global change context. Genotypes having a high allocation pattern to root biomass could also be interesting for soil phytoremediation and belowground carbon storage [74] as well as streambank and hillside stabilization.
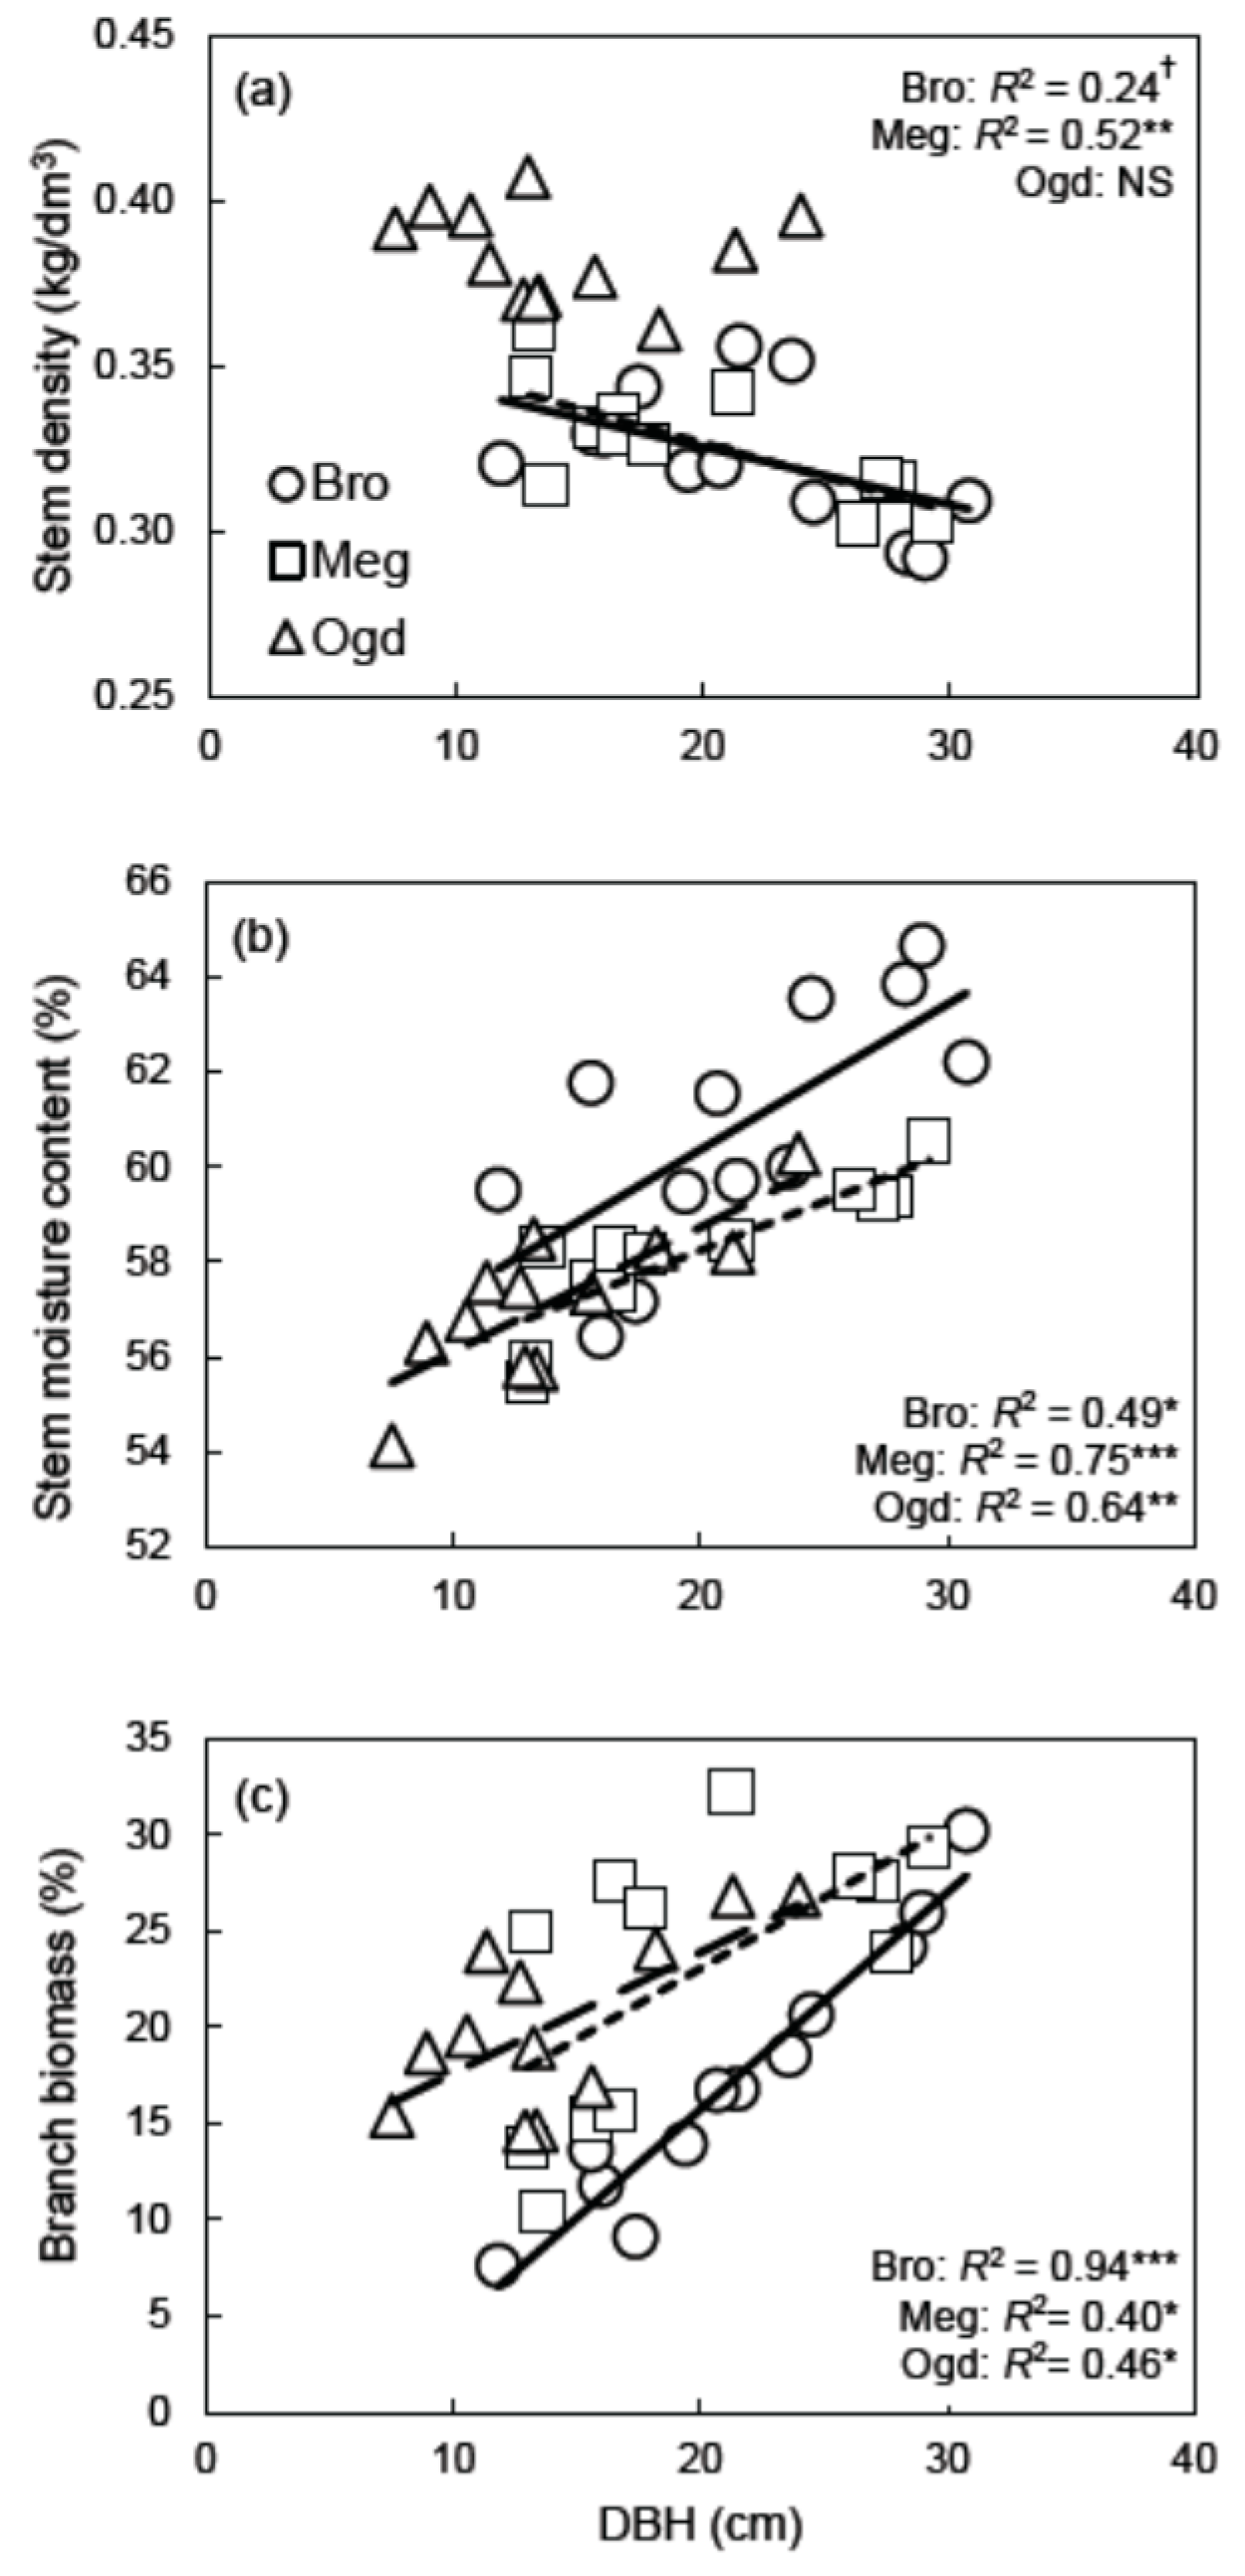
3.3. Plasticity in Architecture and Wood Density Leads to Non-Plastic Allocation to Aboveground Woody Biomass
The results from this study show that the plantation environment affects hybrid poplar aboveground tree architecture (allocation to branch biomass and stem volume), while little plasticity was observed for the allometric relationship between DBH and aboveground woody biomass (Figure 1). Such a static biomass allocation pattern for the aboveground compartment reflects the site-specific tradeoffs that exist between (1) allocation to stem and branch biomass; (2) allocation to stem volume; and (3) physical properties of the stem wood in terms of basic density (Figure 1 and Figure 2a). Because of these tradeoffs, hybrid poplars of the same DBH have accumulated an equivalent amount of dry aboveground woody biomass across the sites after 14 years, despite their differences in architecture at the site-level. Thus, although poplars from the low fertility site (Ogden) had proportionally lower stem volume than poplars growing at the fertile sites (Brompton and Mégantic), the poplars from the Ogden site had higher stem basic density and high branch biomass allocation, which results in a similar allocation to aboveground biomass between the high and low fertility sites (Table 1, Figure 1 and Figure 2a). Although stem basic density was similar between the more fertile sites (Brompton and Mégantic) (Table 1, Figure 2a), the slightly lower stem biomass observed at Mégantic compared to Brompton was compensated for by a higher allocation to branch biomass at Mégantic, thus resulting in an equivalent aboveground allometry between the two sites (Figure 1d,f,h). Changes in tree architecture, but not in aboveground biomass allocation, in response to the growth environment have also been observed in glossy buckthorn (Frangula alnus), a common invasive species of riparian and upland sites [85]. In the Populus genus, the allometry between DBH and branch biomass was equally found to be more variable across European studies compared to the allometry between DBH and stem or aboveground biomass [26].
Differences in the hybrid poplar aboveground architecture between sites were likely related to variations in competition for light across sites [11]. A faster canopy closure was observed at the Brompton site (B. Truax, field observations), a trend that could have resulted in a lower allocation to branches located in the lower canopy and an earlier self-pruning of these lower branches [86]. In recently established plantations, plasticity is frequently observed in traits related to crown architecture and allometries [34]. Such plasticity may reflect the indeterminate growth and opportunistic allocation patterns in hybrid poplars [34].
3.4. Biomass and Wood Quality Indicators
As hypothesized, the mean basic density of stem wood (including bark) was significantly higher (Tukey’s-HSD test, α = 0.05) at Ogden (0.38 kg/dm3), the lower fertility site (Table 1), compared to what was observed at the Brompton and Mégantic sites (0.32 kg/dm3). Other studies done in southern Québec reported similar inter-site variation in stem basic density, but also lower basic density on higher fertility sites [39,40]. Similarly, Hacke et al. [87] showed that the fertilization of hybrid poplars resulted in a decrease in wood density. In agreement with our hypotheses, the results also show that wood basic density is also size-dependent and tends to decrease with tree DBH (Figure 2a). However, this trend was only observed at the high fertility sites (Brompton and Mégantic). Tree size was also negatively correlated to the wood density of a P. maximowiczii × P. trichocarpa clone grown across southern Scandinavia [13]. As hypothesized, there was also a significant positive relationship between DBH and stem moisture content at all sites (Brompton R2 = 0.49, p < 0.05; Mégantic R2 = 0.75, p < 0.001; and Ogden R2 = 0.64, p < 0.01) (Figure 2b). This indicates that independently of the plantation site, the larger the trees of clone DN × M-915508 grow, the more water is contained in their freshly harvested bole biomass. Considering that the stem diameter of woody angiosperm is strongly and positively correlated with the diameter of water-transporting vessels [88], and that fertilization increases tree size and vessel diameter while decreasing wood density in hybrid poplar [87], our results support the idea that hybrid poplars of larger diameter have higher moisture content in their stems and lower basic density probably because they grew larger vessels.
Moisture content at harvest is often the most problematic quality parameter of woody biomass from hybrid poplars intended for the bioenergy market [89]. Likewise, hybrid poplar wood density is another important quality indicator, as wood of higher density produces more energy output per volume unit, but also a higher pulp yield [38,90]. In the study area, the main biomass feedstock used is firewood (split wood or wood log) for home and building heating [91,92,93]. From that perspective, branch biomass is of little interest for most producers, as it would require chipping and drying facilities while causing the exportation of a nutrient-rich harvesting residue that is of great importance for long-term soil fertility [6]. Considering that smaller DBH trees had lower humidity content, higher stem basic density (on the higher fertility sites), and a lower proportion of branches (Figure 2), poplar growers producing firewood or pulp wood should focus on producing trees of small DBH (15–20 cm) if the studied clone is selected. At high fertility sites, this can be achieved with a planting density of between 1000–2000 stems/ha and a 12–15 year rotation. The increase in the proportion of branches with increasing DBH was unexpected, and is contrary to observations reported for other clones [13]. This trend could have been related to the differences in planting densities between sampled plots, with lower planting densities being characterized by high light availability and reduced competition for soil resources, thus favoring crown and DBH growth at the same time.
Wood density is also an important wood characteristic when the goal is to produce solid wood products because of its strong positive correlation with strength, elasticity, and hardness [90]. Lumber, veneer, and plywood production also require poplar trees with a relatively large DBH and a low number of knots in their wood [90]. Thus, given the especially low wood density observed for trees with a DBH > 25 cm, and the positive relationship between DBH and the proportion of branch biomass (Figure 2), clone DN × M-915508 may not be the ideal candidate for solid wood applications. Recent studies found that compared to several Populus nigra × Populus deltoides clones, clone DN × M-915508 had the lowest density, volumetric shrinkage, tangential shrinkage, radial shrinkage, flexural modulus of rupture, and steam bending properties, while showing the worst performance for most of the machining processes [94,95,96].
4. Conclusions
This study has shown that the allometric relationships between DBH and tree compartment biomass or stem volume were plastic, but not for all compartments. Allometric trajectory changes (plastic allometry) across sites were mainly observed for coarse root biomass, branch biomass, and stem volume. At the low fertility site, allocation was proportionally increased to coarse roots and decreased to stem volume. Thus, when the goal is to accurately estimate coarse root biomass and stem volume, allometric relationships should be developed for different site fertility classes. Alternatively, if a generalized model is needed for those compartments, trees sampled for the development of allometric relationships should be taken from a representative subset of sites along the resource gradient of interest. Allometric models developed only with data from high fertility sites may overestimate volume yield and underestimate belowground carbon sequestration and nutrient stocks on low fertility sites, and vice versa. The integration of environmental variables to generalized biomass models might improve their predictive capacity across environmental gradients [26]. Future work should aim at identifying key soil variables that could improve the accuracy of general equations for coarse root biomass and stem volume in hybrid poplar.
Site-specific tradeoffs between tree architecture and stem wood density explained the relatively invariant allometry observed for aboveground woody biomass across plantation sites. This invariant allometry suggests that, for some clones, accurate generalized models could be developed to estimate aboveground woody biomass at the regional scale. Yet, the accuracy of the general model developed for aboveground biomass should be carefully evaluated with independent observations from other plantations with different ages and various planting densities. Finally, additional research involving a larger sample size, a longer environmental gradient, and multiple species or clones is needed to verify if the conclusions from this study can be generalized to the entire Populus genus.
Supplementary Materials
The following are available online at www.mdpi.com/1999-4907/8/9/309/s1, Figure S1: Residual plot and residual distribution for the general and site-specific relationships between ln DBH (cm) and ln Stem volume (dm3); Figure S2: Residual plot and residual distribution for the general and site-specific relationships between ln DBH (cm) and ln Stem biomass (kg); Figure S3: Residual plot and residual distribution for the general and site-specific relationships between ln DBH (cm) and ln Branch biomass (kg); Figure S4: Residual plot and residual distribution for the general and site-specific relationships between ln DBH (cm) and ln Aboveground woody biomass (kg); Figure S5: Residual plot and residual distribution for the general and site-specific relationships between ln DBH (cm) and ln Coarse root biomass (kg); Table S1: Allometric parameter estimates and their associated standard error (SE) and percent relative standard error (PRSE) obtained with the ordinary least squares (OLS) and the robust regression methods for bivariate line fitting.
Acknowledgments
We are grateful to Agriculture and Agri-food Canada (Agricultural Greenhouse Gas Program) for funding this research and paying the open access publishing fees. We also acknowledge funding received from the Conseil Régional des l’Élus de l’Estrie and the Ministère des Forêts, de la Faune et des Parcs du Québec, which was used to establish the initial experimental design. The landowners of the plantation sites (H. Isbrucker, P. Labrecque, M. Blais) are also gratefully acknowledged. We highly appreciated the dedicated work of our field assistants (L. Godbout, J. Lemelin, M.-A. Pétrin, M. Blais). A special thanks to H. Isbrucker for providing us with a large amount of space for sample storage and preparation. A post-doctoral fellowship from the Fiducie de recherche sur la forêt des Cantons-de-l’Est to J. Fortier is gratefully acknowledged. Finally, we thank the two anonymous reviewers of this article for their constructive comments, which have contributed to improving this manuscript.
Author Contributions
B.T. conceived and planted the initial experimental design. J.F., B.T., D.G. and F.L. were involved in sampling design, field sampling, and sample preparation. J.F. analyzed the data and wrote the first draft of the manuscript. B.T., D.G. and F.L. critically revised the manuscript.
Conflicts of Interest
The authors declare no conflict of interest.
References
- Boothroyd-Roberts, K.; Gagnon, D.; Truax, B. Can hybrid poplar plantations accelerate the restoration of forest understory attributes on abandoned fields? For. Ecol. Manag. 2013, 287, 77–89. [Google Scholar] [CrossRef]
- Fortier, J.; Truax, B.; Gagnon, D.; Lambert, F. Biomass carbon, nitrogen and phosphorus stocks in hybrid poplar buffers, herbaceous buffers and natural woodlots in the riparian zone on agricultural land. J. Environ. Manag. 2015, 154, 333–345. [Google Scholar] [CrossRef] [PubMed]
- Truax, B.; Gagnon, D.; Fortier, J.; Lambert, F. Biomass and volume yield in mature hybrid poplar plantations on temperate abandoned farmland. Forests 2014, 5, 3107–3130. [Google Scholar] [CrossRef]
- Heilman, P.E.; Stettler, R.F. Nutritional concerns in selection of black cottonwood and hybrid clones for short rotation. Can. J. For. Res. 1986, 16, 860–863. [Google Scholar] [CrossRef]
- Johansson, T.; Hjelm, B. Stump and root biomass of poplar stands. Forests 2012, 3, 166–178. [Google Scholar] [CrossRef]
- Achat, D.L.; Deleuze, C.; Landmann, G.; Pousse, N.; Ranger, J.; Augusto, L. Quantifying consequences of removing harvesting residues on forest soils and tree growth—A meta-analysis. For. Ecol. Manag. 2015, 348, 124–141. [Google Scholar] [CrossRef]
- Eisenbies, M.H.; Vance, E.D.; Aust, W.M.; Seiler, J.R. Intensive utilization of harvest residues in southern pine plantations: Quantities available and implications for nutrient budgets and sustainable site productivity. BioEnergy Res. 2009, 2, 90–98. [Google Scholar] [CrossRef]
- West, P. Tree and Forest Measurement; Springer: Berlin/Heidelberg, Germany, 2009; p. 190. [Google Scholar]
- Taylor, B.N.; Beidler, K.V.; Cooper, E.R.; Strand, A.E.; Pritchard, S.G. Sampling volume in root studies: The pitfalls of under-sampling exposed using accumulation curves. Ecol. Lett. 2013, 16, 862–869. [Google Scholar] [CrossRef] [PubMed]
- Zabek, L.M.; Prescott, C.E. Biomass equations and carbon content of aboveground leafless biomass of hybrid poplar in Coastal British Columbia. For. Ecol. Manag. 2006, 223, 291–302. [Google Scholar] [CrossRef]
- Stark, H.; Nothdurft, A.; Bauhus, J. Allometries for widely spaced Populus ssp. and Betula ssp. in nurse crop systems. Forests 2013, 4, 1003. [Google Scholar] [CrossRef]
- Fortier, J.; Truax, B.; Gagnon, D.; Lambert, F. Plastic allometry in coarse root biomass of mature hybrid poplar plantations. BioEnergy Res. 2015, 8, 1691–1704. [Google Scholar] [CrossRef]
- Taeroe, A.; Nord-Larsen, T.; Stupak, I.; Raulund-Rasmussen, K. Allometric biomass, biomass expansion factor and wood density models for the OP42 hybrid poplar in southern Scandinavia. BioEnergy Res. 2015, 8, 1–12. [Google Scholar] [CrossRef]
- Dillen, S.Y.; Marron, N.; Bastien, C.; Ricciotti, L.; Salani, F.; Sabatti, M.; Pinel, M.P.C.; Rae, A.M.; Taylor, G.; Ceulemans, R. Effects of environment and progeny on biomass estimations of five hybrid poplar families grown at three contrasting sites across Europe. For. Ecol. Manag. 2007, 252, 12–23. [Google Scholar] [CrossRef]
- Lupi, C.; Larocque, G.; DesRochers, A.; Labrecque, M.; Mosseler, A.; Major, J.; Beaulieu, J.; Tremblay, F.; Gordon, A.M.; Thomas, B.R.; et al. Evaluating sampling designs and deriving biomass equations for young plantations of poplar and willow clones. Biomass Bioenergy 2015, 83, 196–205. [Google Scholar] [CrossRef]
- Oliveira, N.; Rodríguez-Soalleiro, R.; Pérez-Cruzado, C.; Cañellas, I.; Sixto, H. On the genetic affinity of individual tree biomass allometry in poplar short rotation coppice. BioEnergy Res. 2017, 10, 1–11. [Google Scholar] [CrossRef]
- Tuskan, G.A.; Rensema, T.R. Clonal differences in biomass characteristics, coppice ability, and biomass prediction equations among four Populus clones grown in eastern North Dakota. Can. J. For. Res. 1992, 22, 348–354. [Google Scholar] [CrossRef]
- Sileshi, G.W. A critical review of forest biomass estimation models, common mistakes and corrective measures. For. Ecol. Manag. 2014, 329, 237–254. [Google Scholar] [CrossRef]
- Wu, R.; Ma, C.-X.; Lou, X.-Y.; Casella, G. Molecular dissection of allometry, ontogeny, and plasticity: A genomic view of developmental biology. BioSC 2003, 53, 1041–1047. [Google Scholar] [CrossRef]
- Pigliucci, M.; Murren, C.J.; Schlichting, C.D. Phenotypic plasticity and evolution by genetic assimilation. J. Exp. Biol. 2006, 209, 2362. [Google Scholar] [CrossRef] [PubMed]
- Weiner, J. Allocation, plasticity and allometry in plants. Perspect. Plant Ecol. Evol. Syst. 2004, 6, 207–215. [Google Scholar] [CrossRef]
- Enquist, B.J.; Niklas, K.J. Global allocation rules for patterns of biomass partitioning in seed plants. Science 2002, 295, 1517–1520. [Google Scholar] [CrossRef] [PubMed]
- Müller, I.; Schmid, B.; Weiner, J. The effect of nutrient availability on biomass allocation patterns in 27 species of herbaceous plants. Perspect. Plant Ecol. Evol. Syst. 2000, 3, 115–127. [Google Scholar] [CrossRef]
- Shipley, B.; Meziane, D. The balanced-growth hypothesis and the allometry of leaf and root biomass allocation. Funct. Ecol. 2002, 16, 326–331. [Google Scholar] [CrossRef]
- Schall, P.; Lödige, C.; Beck, M.; Ammer, C. Biomass allocation to roots and shoots is more sensitive to shade and drought in European beech than in Norway spruce seedlings. For. Ecol. Manag. 2012, 266, 246–253. [Google Scholar] [CrossRef]
- Forrester, D.I.; Tachauer, I.H.H.; Annighoefer, P.; Barbeito, I.; Pretzsch, H.; Ruiz-Peinado, R.; Stark, H.; Vacchiano, G.; Zlatanov, T.; Chakraborty, T.; et al. Generalized biomass and leaf area allometric equations for European tree species incorporating stand structure, tree age and climate. For. Ecol. Manag. 2017, 396, 160–175. [Google Scholar] [CrossRef]
- António, N.; Tomé, M.; Tomé, J.; Soares, P.; Fontes, L. Effect of tree, stand, and site variables on the allometry of Eucalyptus globulus tree biomass. Can. J. For. Res. 2007, 37, 895–906. [Google Scholar] [CrossRef]
- Johansson, T. Biomass production and allometric above- and below-ground relations for young birch stands planted at four spacings on abandoned farmland. For. Int. J. For. Res. 2007, 80, 41–52. [Google Scholar] [CrossRef]
- Telenius, B.; Verwijst, T. The influence of allometric variation, vertical biomass distribution and sampling procedure on biomass estimates in commercial short-rotation forests. Bioresour. Technol. 1995, 51, 247–253. [Google Scholar] [CrossRef]
- Mosseler, A.; Major, J.E.; Labrecque, M.; Larocque, G.R. Allometric relationships in coppice biomass production for two North American willows (Salix spp.) across three different sites. For. Ecol. Manag. 2014, 320, 190–196. [Google Scholar] [CrossRef]
- Cooke, J.E.K.; Weih, M. Nitrogen storage and seasonal nitrogen cycling in Populus: Bridging molecular physiology and ecophysiology. New Phytol. 2005, 167, 19–30. [Google Scholar] [CrossRef] [PubMed]
- Hjelm, K.; Rytter, L. The influence of soil conditions, with focus on soil acidity, on the establishment of poplar (Populus spp.). New For. 2016, 47, 731–750. [Google Scholar] [CrossRef]
- Bloom, A.J.; Chapin, F.S., III; Mooney, H.A. Resource limitation in plants—An economic analogy. Annu. Rev. Ecol. Syst. 1985, 16, 363–392. [Google Scholar] [CrossRef]
- Wu, R.; Stettler, R.F. Quantitative genetics of growth and development in Populus. III. Phenotypic plasticity of crown structure and function. Heredity 1998, 81, 299–310. [Google Scholar] [CrossRef]
- Verwijst, T.; Telenius, B. Biomass estimation procedures in short rotation forestry. For. Ecol. Manag. 1999, 121, 137–146. [Google Scholar] [CrossRef]
- Beaudoin, M.; Hernández, R.E.; Koubaa, A.; Poliquin, J. Interclonal, intraclonal and within-tree variation in wood density of poplar hybrid clones. Wood Fiber Sci. 1992, 24, 147–153. [Google Scholar]
- DeBell, D.S.; Singleton, R.; Harrington, C.A.; Gartner, B.L. Wood density and fiber length in young populus stems: Relation to clone, age, growth rate, and pruning. Wood Fiber Sci. 2002, 34, 529–539. [Google Scholar]
- Tharakan, P.J.; Volk, T.A.; Abrahamson, L.P.; White, E.H. Energy feedstock characteristics of willow and hybrid poplar clones at harvest age. Biomass Bioenergy 2003, 25, 571–580. [Google Scholar] [CrossRef]
- Pliura, A.; Zhang, S.Y.; MacKay, J.; Bousquet, J. Genotypic variation in wood density and growth traits of poplar hybrids at four clonal trials. For. Ecol. Manag. 2007, 238, 92–106. [Google Scholar] [CrossRef]
- Zhang, S.Y.; Yu, Q.; Chauret, G.; Koubaa, A. Selection for both growth and wood properties in hybrid poplar clones. For. Sci. 2003, 49, 901–908. [Google Scholar]
- Huxley, J.S.; Teissier, G. Terminology of relative growth. Nature 1936, 137, 780–781. [Google Scholar] [CrossRef]
- Cooke, J.E.K.; Timothy, A.M.; Davis, J.M. Shot-term physiological and developmental responses to nitrogen availability in hybrid poplar. New Phytol. 2005, 167, 41–52. [Google Scholar] [CrossRef] [PubMed]
- Robitaille, A.; Saucier, J.-P. Paysages Régionaux du Québec Méridional; Les publications du Québec: Ste-Foy, QC, Canada, 1998; p. 213. [Google Scholar]
- Périnet, P.; Gagnon, H.; Morin, S. Liste des Clones Recommandés de Peuplier Hybride par Sous-Région Écologique au Québec (Mise à Jour Octobre 2010); Direction de la Recherche Forestière, MRN: Québec, QC, Canada, 2010; p. 1. [Google Scholar]
- Eckenwalder, J.E. Descriptions of clonal characteristics. In Poplar Culture in North America; Dickmann, D.I., Isenbrands, J.G., Eds.; NRC Research Press, National Research Council of Canada: Ottawa, ON, Canada, 2001; Part B, Chapter 13; pp. 331–382. [Google Scholar]
- Truax, B.; Gagnon, D.; Fortier, J.; Lambert, F. Yield in 8 year-old hybrid poplar plantations on abandoned farmland along climatic and soil fertility gradients. For. Ecol. Manag. 2012, 267, 228–239. [Google Scholar] [CrossRef]
- Fortier, J.; Gagnon, D.; Truax, B.; Lambert, F. Biomass and volume yield after 6 years in multiclonal hybrid poplar riparian buffer strips. Biomass Bioenergy 2010, 34, 1028–1040. [Google Scholar] [CrossRef]
- Fortier, J.; Truax, B.; Gagnon, D.; Lambert, F. Mature hybrid poplar riparian buffers along farm streams produce high yields in response to soil fertility assessed using three methods. Sustainability 2013, 5, 1893–1916. [Google Scholar] [CrossRef]
- Fortier, J.; Truax, B.; Gagnon, D.; Lambert, F. Linking biomass productivity to genotype-specific nutrient cycling strategies in mature hybrid poplars planted along an environmental gradient. BioEnergy Res. 2017, 10, 876–890. [Google Scholar] [CrossRef]
- Conseil des Productions Végétales du Québec. Méthodes D’analyse des Sols, des Fumiers et des Tissus Végétaux; Gouvernement du Quebec, Ministeres des Communications: Québec, QC, Canada, 1988.
- Bouyoucos, G.J. Hydrometer method improved for making particle size analysis of soils. Agron. J. 1962, 54, 464–465. [Google Scholar] [CrossRef]
- Centre de Référence en Agriculture et Agroalimentaire du Québec. Guide de Référence en Fertilisation, 1st ed.; CRAAQ: Ste-Foy, QC, Canada, 2003; p. 40. [Google Scholar]
- Tran, T.S.; Simard, R.R. Mehlich III-Extractable elements. In Soil Sampling and Methods of Analysis; Carter, M.R., Ed.; Lewis Publishers and CRC Press: Boca Raton, FL, USA, 1993; pp. 43–49. [Google Scholar]
- Association of Official Analytical Chemists. Official Methods of Analysis. Method 984.27: Calcium, Copper, Iron, Magnesium, Manganese, Phosphorus, Potassium, Sodium and Zinc in Infant Formula—Inductively Coupled Plasma Emission Spectroscopic, 16th ed.; AOAC International: Rockville, MD, USA, 1999; p. 1200. [Google Scholar]
- Perron, J.-Y. Inventaire forestier. In Manuel de Foresterie; Ordre des Ingénieurs Forestiers du Québec, Ed.; Les Presses de l’Université Laval: Ste-Foy, QC, Canada, 1996; pp. 390–473. [Google Scholar]
- Ajit; Das, D.K.; Chaturvedi, O.P.; Jabeen, N.; Dhyani, S.K. Predictive models for dry weight estimation of above and below ground biomass components of Populus deltoides in India: Development and comparative diagnosis. Biomass Bioenergy 2011, 35, 1145–1152. [Google Scholar]
- Fang, S.; Xue, J.; Tang, L. Biomass production and carbon sequestration potential in poplar plantations with different management patterns. J. Environ. Manag. 2007, 85, 672–679. [Google Scholar] [CrossRef] [PubMed]
- Heilman, P.E.; Ekuan, G.; Fogle, D. Above- and below-ground biomass and fine roots of 4-year-old hybrids of Populus trichocarpa × Populus deltoides and parental species in short-rotation culture. Can. J. For. Res. 1994, 24, 1186–1192. [Google Scholar] [CrossRef]
- Picard, N.; Saint-André, L.; Henry, M. Manual for Building Tree Volume and Biomass Allometric Equations: From Field Measurement to Prediction; Food and Agricultural, Organization of the United Nations: Rome, Italy; Centre de Coopération Internationale en Recherche Agronomique pour le Développement: Montpellier, France, 2012; p. 215. [Google Scholar]
- Xiao, X.; White, E.P.; Hooten, M.B.; Durham, S.L. On the use of log-transformation vs. nonlinear regression for analyzing biological power laws. Ecology 2011, 92, 1887–1894. [Google Scholar] [CrossRef] [PubMed]
- West, G.B.; Brown, J.H.; Enquist, B.J. A general model for the structure and allometry of plant vascular systems. Nature 1999, 400, 664–667. [Google Scholar]
- Chojnacky, D.C.; Heath, L.S.; Jenkins, J.C. Updated generalized biomass equations for North American tree species. Forestry 2014, 87, 129–151. [Google Scholar] [CrossRef]
- Jenkins, J.C.; Chojnacky, D.C.; Heath, L.S.; Birdsey, R.A. National-scale biomass estimators for United States tree species. For. Sci. 2003, 49, 12–35. [Google Scholar]
- Ter-Mikaelian, M.T.; Korzukhin, M.D. Biomass equations for sixty-five North American tree species. For. Ecol. Manag. 1997, 97, 1–24. [Google Scholar] [CrossRef]
- Ben Brahim, M.; Gavaland, A.; Cabanettes, A. Generalized allometric regression to estimate biomass of Populus in short-rotation coppice. Scand. J. For. Res. 2000, 15, 171–176. [Google Scholar] [CrossRef]
- Gotelli, N.J.; Ellison, A.M. A Primer of Ecological Statistics; Sinauer Associated, Inc.: Sunderland, MA, USA, 2004; p. 510. [Google Scholar]
- Taskinen, S.; Warton, D.I. Robust estimation and inference for bivariate line-fitting in allometry. Biom. J. 2011, 53, 652–672. [Google Scholar] [CrossRef] [PubMed]
- Huber, P.J. Robust regression: Asymptotics, conjectures and Monte Carlo. Ann. Stat. 1973, 1, 799–821. [Google Scholar] [CrossRef]
- Akaike, H. A new look at the statistical model identification. IEEE Trans. Autom. Control 1974, 19, 716–723. [Google Scholar] [CrossRef]
- Stone, M. Cross-validatory choice and assessment of statistical predictions. J. R. Stat. Soc. Ser. B Methodol. 1974, 36, 111–147. [Google Scholar]
- Arlot, S.; Celisse, A. A survey of cross-validation procedures for model selection. Stat. Surv. 2010, 4, 40–79. [Google Scholar] [CrossRef]
- Petersen, R.G. Design and Analysis of Experiments; Marcel-Dekker: New York, NY, USA, 1985; p. 429. [Google Scholar]
- Day, R.W.; Quinn, G.P. Comparisons of treatments after an analysis of variance in ecology. Ecol. Monogr. 1989, 59, 433–463. [Google Scholar] [CrossRef]
- Wullschleger, S.D.; Yin, T.M.; DiFazio, S.P.; Tschaplinski, T.J.; Gunter, L.E.; Davis, M.F.; Tuskan, G.A. Phenotypic variation in growth and biomass distribution for two advanced-generation pedigrees of hybrid poplar. Can. J. For. Res. 2005, 35, 1779–1789. [Google Scholar] [CrossRef]
- Bradshaw, H.D.; Stettler, R.F. Molecular genetics of growth and development in Populus. IV. Mapping QTLs with large effects on growth, form, and phenology traits in a forest tree. Genetics 1995, 139, 963. [Google Scholar] [PubMed]
- Wu, R.; Ma, C.-X.; Littell, R.C.; Casella, G. A statistical model for the genetic origin of allometric scaling laws in biology. J. Theor. Biol. 2002, 219, 121–135. [Google Scholar] [CrossRef]
- Pretzsch, H.; Uhl, E.; Biber, P.; Schütze, G.; Coates, K.D. Change of allometry between coarse root and shoot of Lodgepole pine (Pinus contorta Dougl. ex. Loud) along a stress gradient in the sub-boreal forest zone of British Columbia. Scand. J. For. Res. 2012, 27, 532–544. [Google Scholar] [CrossRef]
- Millard, P.; Grelet, G.-A. Nitrogen storage and remobilization by trees: Ecophysiological relevance in a changing world. Tree Physiol. 2010, 30, 1083–1095. [Google Scholar] [CrossRef] [PubMed]
- Kobe, R.K.; Iyer, M.; Walters, M.B. Optimal partitioning theory revisited: Nonstructural carbohydrates dominate root mass responses to nitrogen. Ecology 2010, 91, 166–179. [Google Scholar] [CrossRef] [PubMed]
- Reich, P.B.; Luo, Y.; Bradford, J.B.; Poorter, H.; Perry, C.H.; Oleksyn, J. Temperature drives global patterns in forest biomass distribution in leaves, stems, and roots. Proc. Natl. Acad. Sci. USA 2014, 111, 13721–13726. [Google Scholar] [CrossRef] [PubMed]
- Kranjcec, J.; Mahoney, J.M.; Rood, S.B. The responses of three riparian cottonwood species to water table decline. For. Ecol. Manag. 1998, 110, 77–87. [Google Scholar] [CrossRef]
- Dickmann, D.I.; Kuzovkina, Y.A. Poplars and willows of the world, with emphasis on silviculturally important species. In Poplars and Willows: Tree for the Society and the Environment; Isebrands, J.G., Richardson, J., Eds.; CAB International and FAO: Rome, Italy, 2015; pp. 8–91. [Google Scholar]
- Rood, S.B.; Bigelow, S.G.; Hall, A.A. Root architecture of riparian trees: River cut-banks provide natural hydraulic excavation, revealing that cottonwoods are facultative phreatophytes. Trees 2011, 25, 907–917. [Google Scholar] [CrossRef]
- Bradshaw, A.D. Evolutionary significance of phenotypic plasticity in plants. Adv. Genet. 1965, 13, 115–155. [Google Scholar]
- Hamelin, C.; Gagnon, D.; Truax, B. Aboveground biomass of glossy buckthorn is similar in open and understory environments but architectural strategy differs. Forests 2015, 6, 1083–1093. [Google Scholar] [CrossRef]
- Peterson, E.B.; Peterson, N.M. Ecology, Management, and Use of Aspen and Balsam Poplar in the Prairie Provinces; Forestry Canada, Northwest Region, Northern Forestry Centre: Edmonton, AB, Canada, 1992; p. 252.
- Hacke, U.G.; Plavcová, L.; Almeida-Rodriguez, A.; King-Jones, S.; Zhou, W.; Cooke, J.E.K. Influence of nitrogen fertilization on xylem traits and aquaporin expression in stems of hybrid poplar. Tree Physiol. 2010, 30, 1016–1025. [Google Scholar] [CrossRef] [PubMed]
- Olson, M.E.; Rosell, J.A. Vessel diameter-stem diameter scaling across woody angiosperms and the ecological causes of xylem vessel diameter variation. New Phytol. 2013, 197, 1204–1213. [Google Scholar] [CrossRef] [PubMed]
- Kauter, D.; Lewandowski, I.; Claupein, W. Quantity and quality of harvestable biomass from Populus short rotation coppice for solid fuel use: A review of the physiological basis and management influences. Biomass Bioenergy 2003, 24, 411–427. [Google Scholar] [CrossRef]
- Balatinecz, J.; Mertens, P.; Boever, L.; de Yukun, H.; Jin, J.; van Acker, J. Properties, processing and utilization. In Poplar and Willows: Tree for the Society and the Environment; Isebrands, J.G., Richardson, J., Eds.; CAB International and FAO: Rome, Italy, 2014; Chapter 10; pp. 527–561. [Google Scholar]
- Côté, M.-A.; Gilbert, D.; Nadeau, S. Characterizing the profiles, motivations and behaviour of Quebec’s forest owners. For. Policy Econ. 2015, 59, 83–90. [Google Scholar] [CrossRef]
- Fortier, J.; Truax, B.; Gagnon, D.; Lambert, F. Potential for hybrid poplar riparian buffers to provide ecosystem services in three watersheds with contrasting agricultural land use. Forests 2016, 7, 37. [Google Scholar] [CrossRef]
- Truax, B.; Gagnon, D.; Lambert, F.; Fortier, J. Multiple-use zoning model for private forest owners in agricultural landscapes: A case study. Forests 2015, 6, 3614–3664. [Google Scholar] [CrossRef]
- Kuljich, S.; Cáceres, C.B.; Hernández, R.E. Steam-bending properties of seven poplar hybrid clones. Int. J. Mater. Form. 2015, 8, 67–72. [Google Scholar] [CrossRef]
- Huda, A.A.S.M.; Koubaa, A.; Cloutier, A.; Hernández, R.E.; Fortin, Y. Variation of the physical and mechanical properties of hybrid poplar clones. Bioresource 2014, 9, 1456–1471. [Google Scholar] [CrossRef]
- Hernández, R.E.; Constantineau, S.; Fortin, Y. Wood machining properties of poplar hybrid clones from different sites following various drying treatments. Wood Fiber Sci. 2011, 43, 394–411. [Google Scholar]
Scheme 1.
Design for coarse root biomass sampling of a single tree. Size of excavated pits represents 25% of the surface area occupied by a single tree (grey square), and thus varied according to the three spacings (or planting densities) selected. Dark grey circles represent trees.
Scheme 1.
Design for coarse root biomass sampling of a single tree. Size of excavated pits represents 25% of the surface area occupied by a single tree (grey square), and thus varied according to the three spacings (or planting densities) selected. Dark grey circles represent trees.
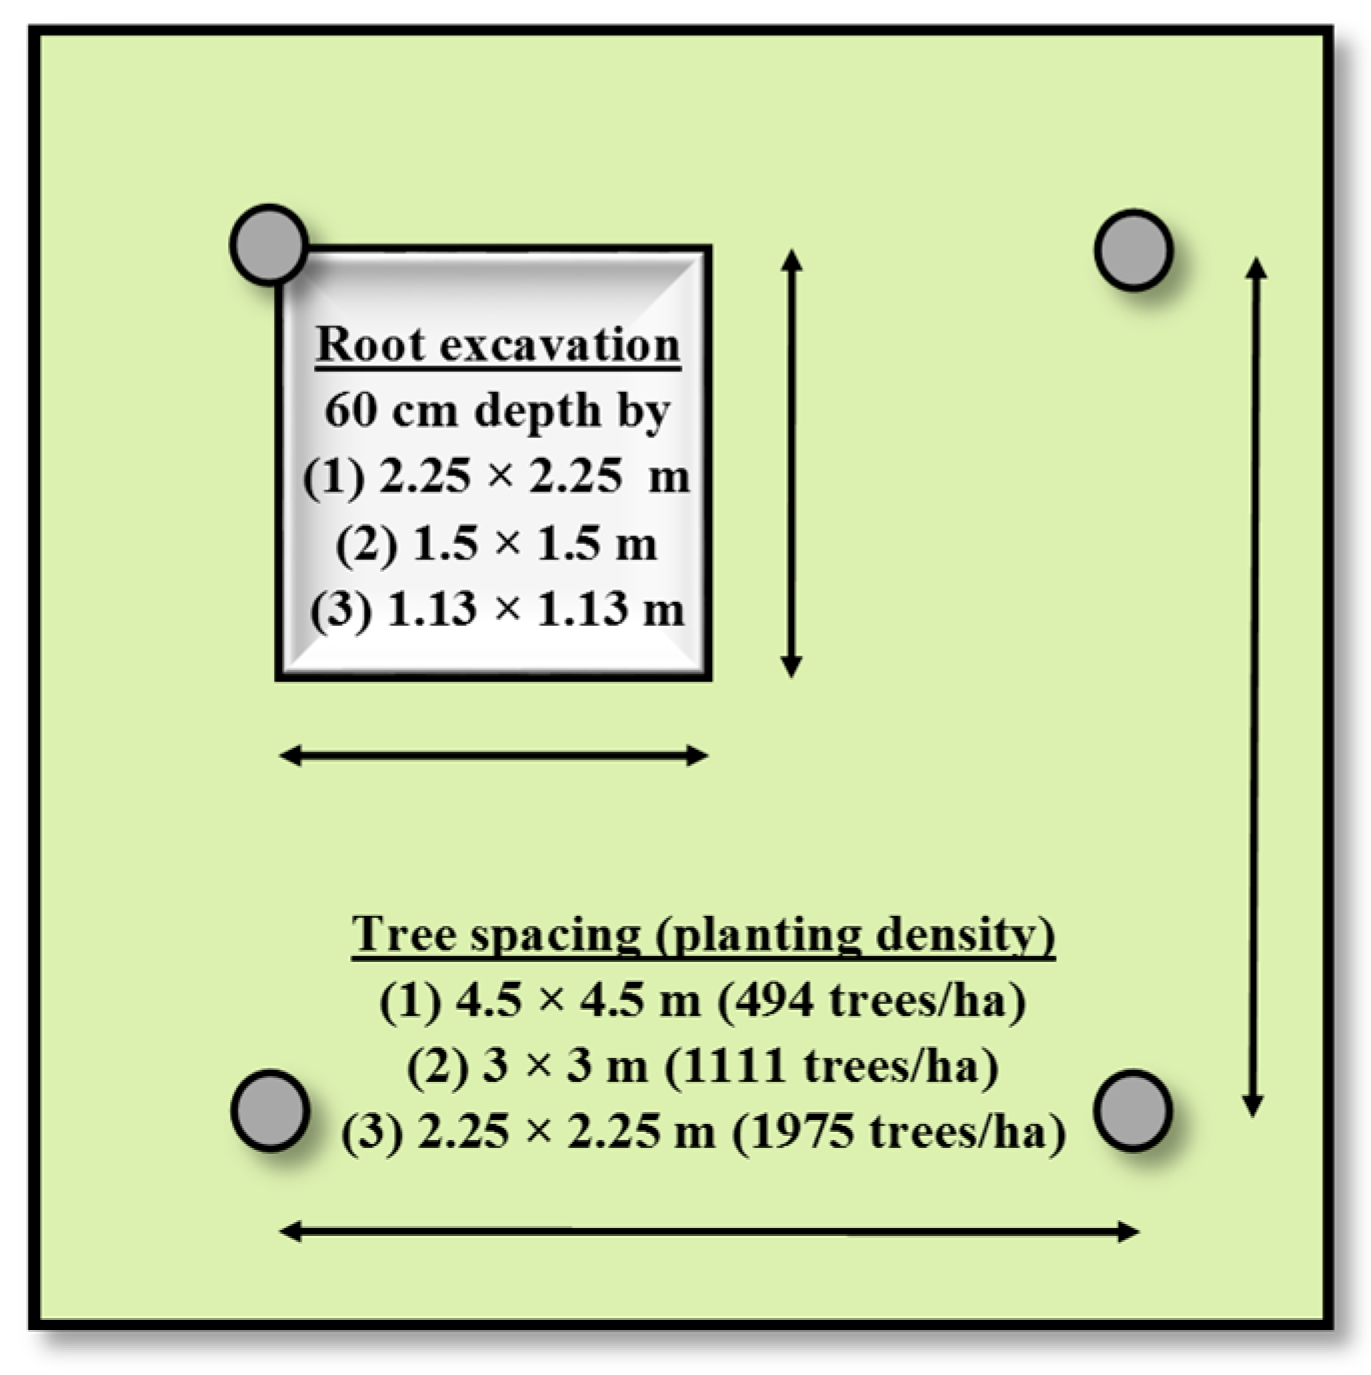
Figure 1.
General allometric relationships (left panels) and site-specific allometric relationships (right panels) between DBH and stem volume (a,b), stem biomass (c,d), branch biomass (e,f), aboveground woody biomass (g,h), or coarse root biomass (i,j). In the right panels: Brompton (Bro), solid line; Mégantic (Meg), small-dashed line; Ogden (Ogd), large-dashed line. All models are in the form of the simple power law equation Y = aXb, using untransformed data. See Table 3 for the parameter estimates and detailed statistics of each relationship on the logarithmic scale.
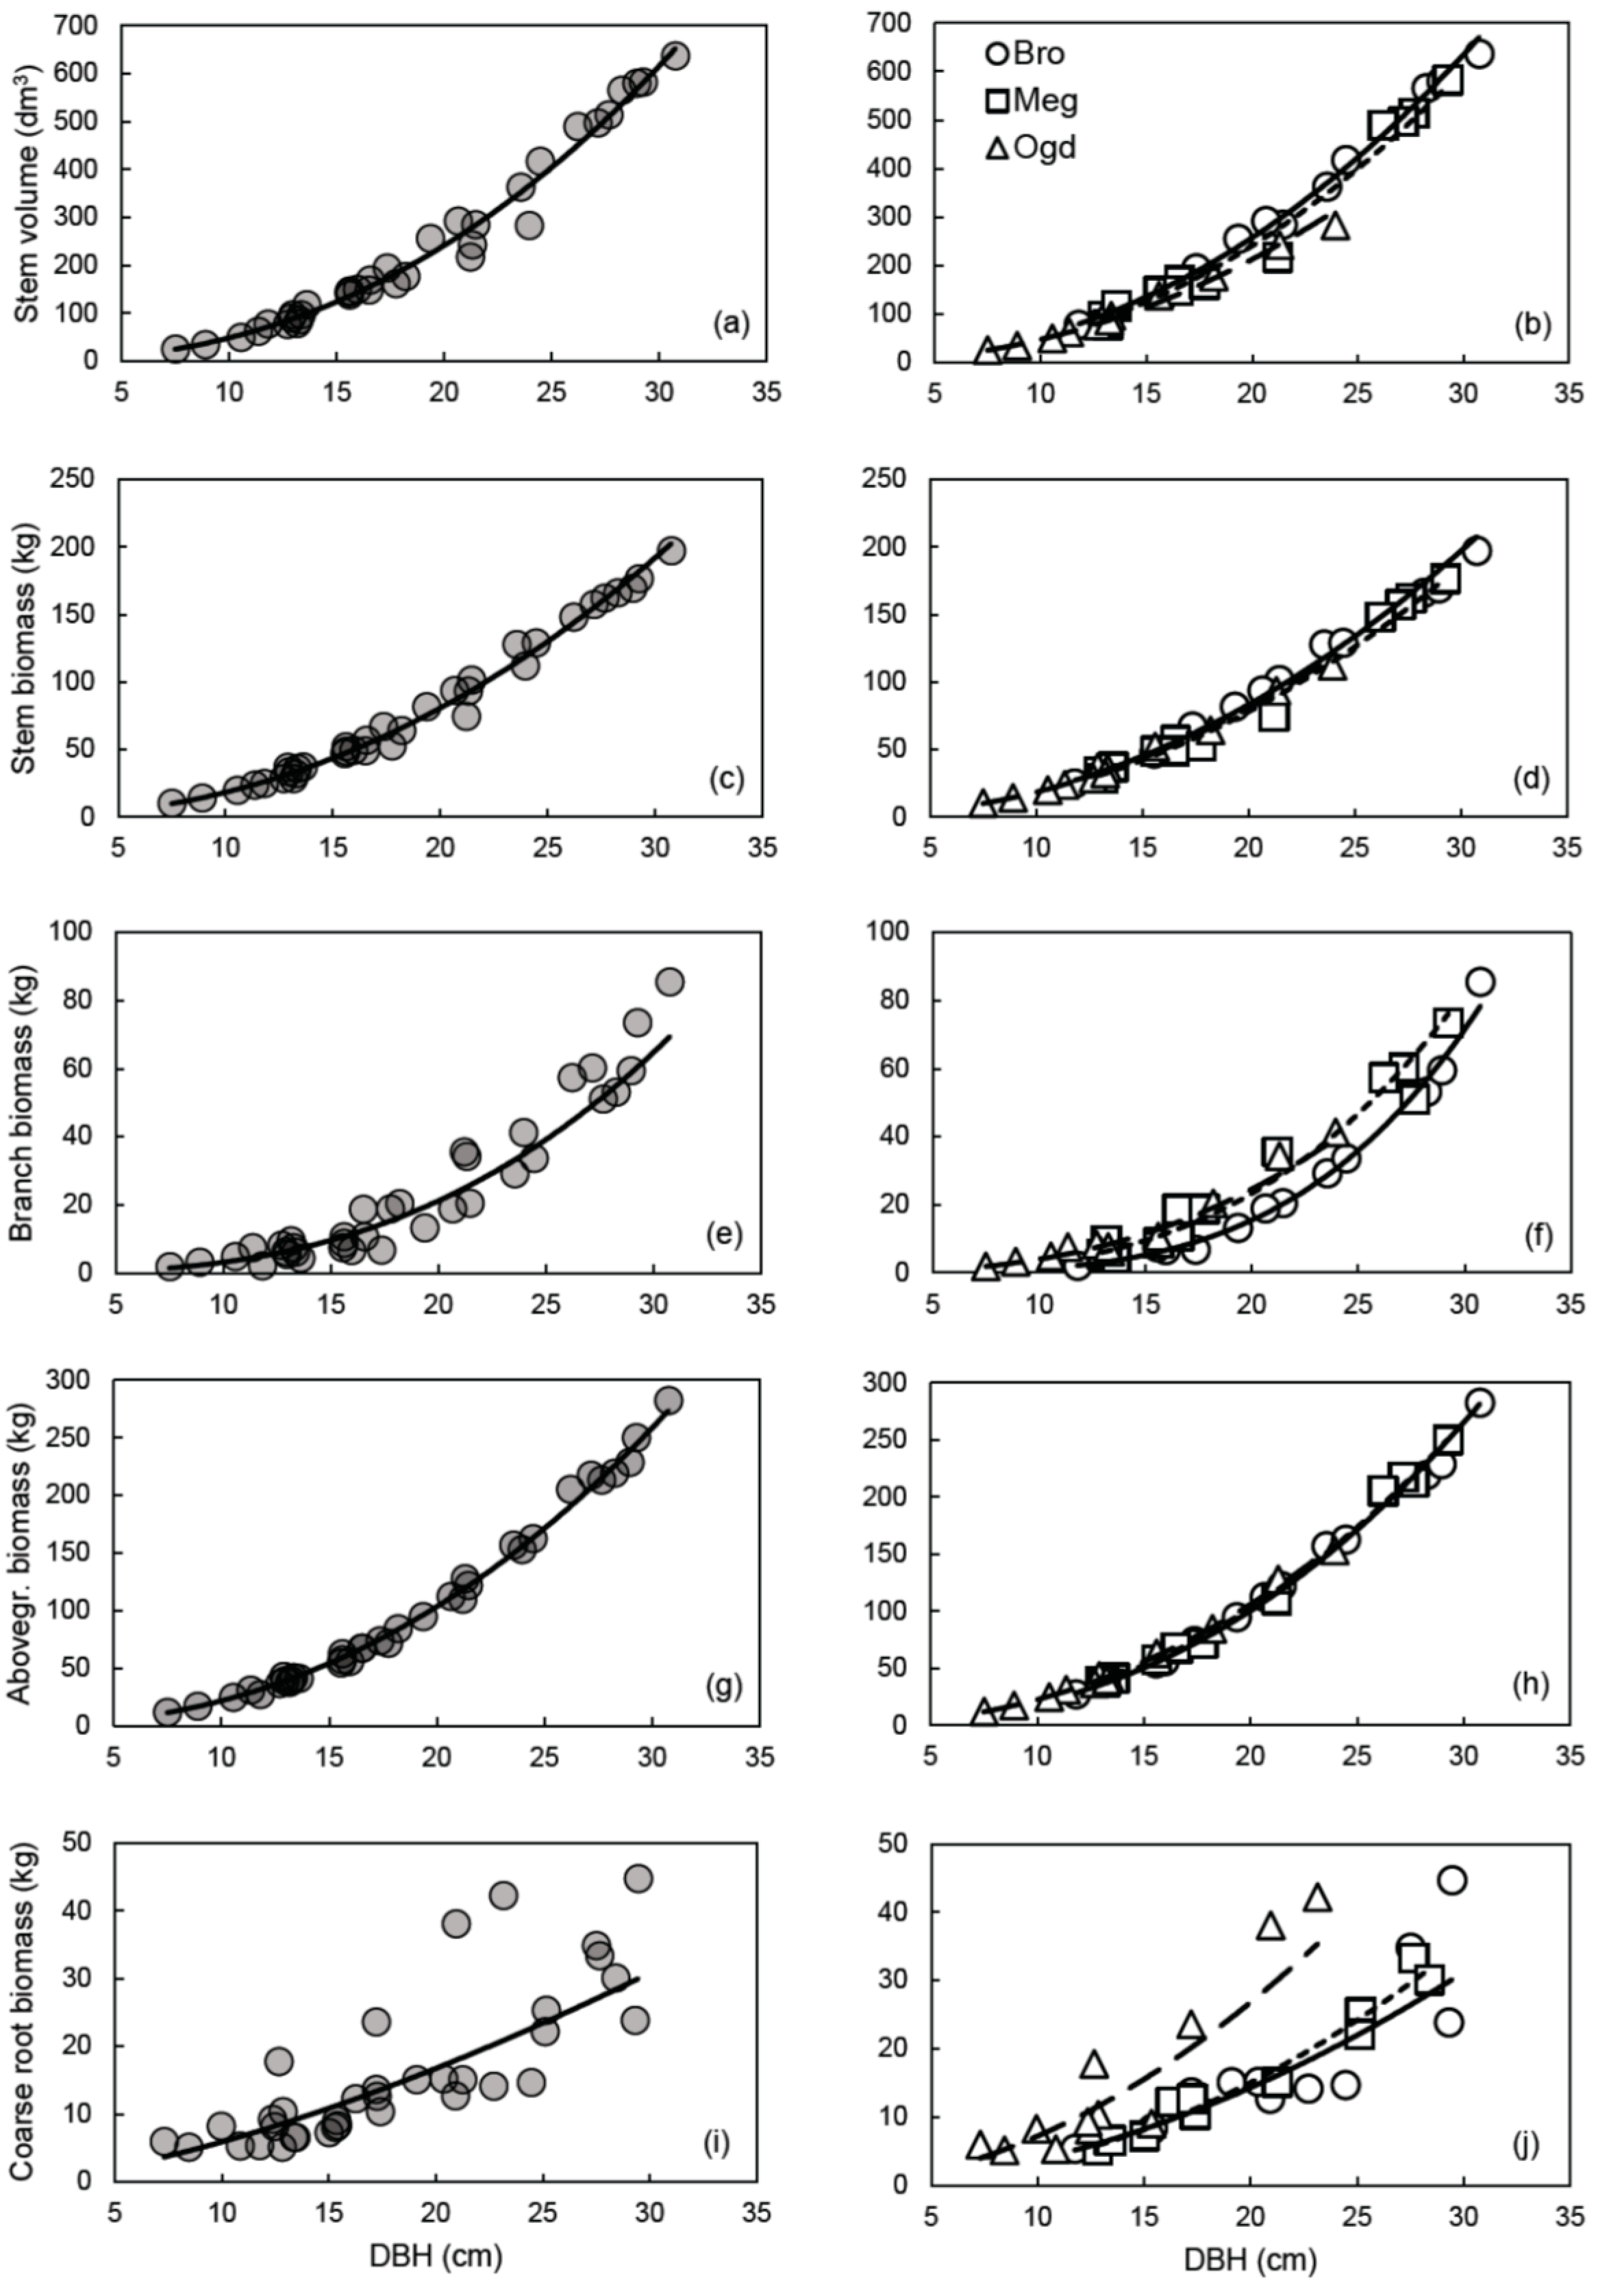
Figure 2.
Site-specific linear least-square regressions between DBH and (a) stem wood basic density, (b) stem moisture content, and (c) the relative proportion of aboveground woody biomass consisting of branch biomass († p < 0.1, * p < 0.05, ** p < 0.01, *** p < 0.001). Brompton (Bro), solid line; Mégantic (Meg), small-dashed line; Ogden (Ogd), large-dashed line.

Table 1.
Site and soil characteristics at the three plantation sites. Site-level characteristics identified with different letters are significantly different (α = 0.05; Tukey’s honest significant difference test).
Table 1.
Site and soil characteristics at the three plantation sites. Site-level characteristics identified with different letters are significantly different (α = 0.05; Tukey’s honest significant difference test).
| Site a | Elev. (m) | MAT b (°C) | MAP b (mm) | pH | OM (%) | P (mg/L) | K (mg/L) | Ca (mg/L) | Mg (mg/L) | Base Sat. (%) | CEC (meq/100 g) | Clay (%) | Silt (%) | Sand (%) | Texture |
|---|---|---|---|---|---|---|---|---|---|---|---|---|---|---|---|
| Bro | 165 | 5.6 | 1146 | 5.27 a | 7.60 a | 44.3 b | 24.1 a | 772 a | 42.3 ab | 31.0 a | 13.9 a | 16.2 a | 58.5 a | 25.3 b | Silty loam |
| Meg | 470 | 4.2 | 1048 | 5.00 b | 6.70 ab | 68.4 a | 33.7 a | 619 a | 53.0 a | 24.5 b | 15.0 a | 13.1 a | 41.4 b | 45.5 a | Loam |
| Ogd | 265 | 5.3 | 1264 | 5.17 ab | 6.02 b | 5.1 c | 29.4 a | 219 b | 29.5 b | 14.8 c | 10.2 b | 14.6 a | 43.2 b | 42.2 a | Loam |
| SE | - | - | - | 0.05 | 0.32 | 4.8 | 2.9 | 45 | 5.8 | 1.5 | 0.9 | 1.6 | 1.3 | 1.2 | - |
| p< | - | - | - | 0.01 | 0.05 | 0.001 | NS | 0.001 | 0.1 | 0.001 | 0.01 | NS | 0.001 | 0.001 | - |
a Abbreviations used in Table 1: Bro (Brompton); Meg (Mégantic); Ogd (Ogden); Elev. (elevation above sea level); MAT (mean annual temperature); MAP (mean annual precipitation); OM (organic matter); Base sat. (base saturation); CEC (cationic exchange capacity); NS (non-significant). b Mean annual temperature and mean annual precipitation for the 1981–2010 period were obtained from the nearest meteorological station (all within a 10 km radius from each study site).
Table 2.
ANCOVA results (p-value) of testing Site as a main effect and diameter at breast height (DBH) as a continuous covariate, and the interaction effect between the main effect and the covariate on the response variables. Data were log-transformed prior to analysis.
Table 2.
ANCOVA results (p-value) of testing Site as a main effect and diameter at breast height (DBH) as a continuous covariate, and the interaction effect between the main effect and the covariate on the response variables. Data were log-transformed prior to analysis.
| Tree Compartments (Response Variables) | Site | DBH | Site × DBH |
|---|---|---|---|
| Stem volume | 0.01 | 0.001 | NS |
| Stem biomass | NS | 0.001 | NS |
| Branch biomass | 0.001 | 0.001 | 0.01 |
| Aboveground woody biomass | 0.01 | 0.001 | 0.05 |
| Coarse root biomass | 0.001 | 0.001 | NS |
Table 3.
Parameter estimates and statistics of general and site-specific allometric relationships between DBH (cm), as a predictor variable, and the volume or biomass of different tree compartments as response variables. All equations are in the form of ln (y) = ln a + b ln (x), where x is DBH and y is the volume or biomass of the tree compartment.
| Tree Compartment | Model | n | DBH Range (cm) | Parameter | R2 | p < W b | n of Outliers | |||||||
|---|---|---|---|---|---|---|---|---|---|---|---|---|---|---|
| ln a | b | |||||||||||||
| Estimate | SE | PRSE a (%) | p < | Estimate | SE | PRSE (%) | p < | |||||||
| Stem | General | 36 | 7.5–30.8 | −1.44 | 0.14 | 9.6 | 0.001 | 2.31 | 0.05 | 2.1 | 0.001 | 0.986 | 0.12 | 2/36 |
| volume | Brompton | 12 | 11.8–30.8 | −1.11 | 0.14 | 12.6 | 0.001 | 2.22 | 0.05 | 2.1 | 0.001 | 0.996 | 0.36 | 0 |
| (dm3) | Mégantic | 12 | 13.0–29.3 | −1.32 | 0.36 | 27.2 | 0.01 | 2.27 | 0.12 | 5.3 | 0.001 | 0.972 | 0.24 | 0 |
| Ogden | 12 | 7.5–24.0 | −1.09 | 0.16 | 14.4 | 0.001 | 2.15 | 0.06 | 2.8 | 0.001 | 0.992 | 0.58 | 0 | |
| Stem | General | 36 | 7.5–30.8 | −2.01 | 0.11 | 5.3 | 0.001 | 2.14 | 0.04 | 1.7 | 0.001 | 0.990 | 0.37 | 2/36 |
| biomass | Brompton | 12 | 11.8–30.8 | −1.94 | 0.20 | 10.5 | 0.001 | 2.13 | 0.07 | 3.1 | 0.001 | 0.990 | 0.15 | 0 |
| (kg) | Mégantic | 12 | 13.0–29.3 | −2.07 | 0.28 | 13.7 | 0.001 | 2.15 | 0.10 | 4.5 | 0.001 | 0.980 | 0.047 | 0 |
| Ogden | 12 | 7.5–24.0 | −1.97 | 0.16 | 8.1 | 0.001 | 2.12 | 0.06 | 2.9 | 0.001 | 0.992 | 0.12 | 1/12 | |
| Branch | General | 36 | 7.5–30.8 | −5.22 | 0.46 | 8.8 | 0.001 | 2.76 | 0.16 | 5.7 | 0.001 | 0.899 | 0.048 | 2/36 |
| biomass | Brompton | 12 | 11.8–30.8 | −8.57 | 0.40 | 4.7 | 0.001 | 3.78 | 0.13 | 3.5 | 0.001 | 0.988 | 0.11 | 1/12 |
| (kg) | Mégantic | 12 | 13.0–29.3 | −6.19 | 0.80 | 13.0 | 0.001 | 3.12 | 0.27 | 8.7 | 0.001 | 0.929 | 0.89 | 0 |
| Ogden | 12 | 7.5–24.0 | −4.68 | 0.43 | 9.1 | 0.001 | 2.63 | 0.16 | 6.2 | 0.001 | 0.963 | 0.83 | 0 | |
| Aboveground | General | 36 | 7.5–30.8 | −2.14 | 0.08 | 3.6 | 0.001 | 2.26 | 0.03 | 1.2 | 0.001 | 0.995 | 0.89 | 2/36 |
| woody biomass | Brompton | 12 | 11.8–30.8 | −2.58 | 0.13 | 5.0 | 0.001 | 2.40 | 0.04 | 1.8 | 0.001 | 0.997 | 0.52 | 0 |
| (kg) | Mégantic | 12 | 13.0–29.3 | −2.38 | 0.13 | 5.6 | 0.001 | 2.34 | 0.05 | 1.9 | 0.001 | 0.996 | 0.62 | 0 |
| Ogden | 12 | 7.5–24.0 | −2.03 | 0.10 | 5.1 | 0.001 | 2.23 | 0.04 | 1.8 | 0.001 | 0.997 | 0.87 | 0 | |
| Coarse root | General | 36 | 7.3–29.5 | −1.69 | 0.47 | 28.2 | 0.01 | 1.50 | 0.17 | 11.1 | 0.001 | 0.706 | 0.019 | 3/36 |
| biomass | Brompton | 12 | 11.8–29.5 | −3.10 | 0.78 | 25.3 | 0.01 | 1.92 | 0.26 | 13.5 | 0.001 | 0.846 | 0.91 | 0 |
| (kg) | Mégantic | 12 | 12.8–28.4 | −3.66 | 0.37 | 10.1 | 0.001 | 2.13 | 0.13 | 5.9 | 0.001 | 0.966 | 0.19 | 1/12 |
| Ogden | 12 | 7.3–23.2 | −2.38 | 0.78 | 32.9 | 0.05 | 1.89 | 0.30 | 16.0 | 0.001 | 0.795 | 0.77 | 0 | |
a PRSE, percent relative standard error; SE, standard error. b W stands for the Shapiro–Wilk test statistics, which were used to test the normality of residuals distribution. p-values <0.05 (in bold) reject the null hypothesis that the residuals are from a normal distribution.
Table 4.
Prediction error of site-specific vs. the general allometric relationships for different tree compartments. The prediction error was calculated as the mean absolute percentage error (MAPE).
Table 4.
Prediction error of site-specific vs. the general allometric relationships for different tree compartments. The prediction error was calculated as the mean absolute percentage error (MAPE).
| Site | Model | MAPE (%) | ||||
|---|---|---|---|---|---|---|
| Stem Volume | Stem Biomass | Branch Biomass | Aboveground Biomass | Coarse Root Biomass | ||
| Brompton | General | 1.2 | 1.2 | 20.4 | 1.0 | 10.3 |
| Site-specific | 0.6 | 1.2 | 3.3 | 0.7 | 6.6 | |
| Mégantic | General | 1.8 | 1.8 | 10.4 | 0.9 | 9.9 |
| Site-specific | 1.9 | 2.0 | 9.0 | 0.8 | 4.0 | |
| Ogden | General | 1.7 | 1.4 | 13.8 | 1.2 | 14.3 |
| Site-specific | 1.1 | 1.4 | 6.9 | 0.9 | 11.9 | |
Table 5.
Values of the corrected Akaike’s Information Criterion (AICc) for the general and site-specific allometric models developed for the different tree compartments.
Table 5.
Values of the corrected Akaike’s Information Criterion (AICc) for the general and site-specific allometric models developed for the different tree compartments.
| Model | Stem Volume | Stem Biomass | Branch Biomass | Aboveground Biomass | Coarse Root Biomass |
|---|---|---|---|---|---|
| General | −57.8 | −76.3 | 28.4 | −100.5 | 32.4 |
| Brompton | −34.1 | −25.2 | −8.9 | −36.2 | 7.2 |
| Mégantic | −9.2 | −14.8 | 10.2 | −32.9 | −9.3 |
| Ogden | −23.9 | −23.5 | 0.2 | −33.7 | 15.4 |
Table 6.
Mean values of cross-validated R2 (fivefold cross-validation repeated 5 times) for the general and site-specific allometric models developed for the different tree compartments.
Table 6.
Mean values of cross-validated R2 (fivefold cross-validation repeated 5 times) for the general and site-specific allometric models developed for the different tree compartments.
| Model | Stem Volume | Stem Biomass | Branch Biomass | Aboveground Biomass | Coarse Root Biomass |
|---|---|---|---|---|---|
| General | 0.984 | 0.988 | 0.889 | 0.995 | 0.656 |
| Brompton | 0.994 | 0.984 | 0.982 | 0.995 | 0.796 |
| Mégantic | 0.961 | 0.971 | 0.892 | 0.995 | 0.947 |
| Ogden | 0.987 | 0.990 | 0.954 | 0.996 | 0.721 |
Table 7.
Comparison of predicted values for different tree compartments calculated with the general and the site-specific models for trees with different DBH values. The percentage of variation associated with the use of the general model instead of the site-specific model is indicated.
Table 7.
Comparison of predicted values for different tree compartments calculated with the general and the site-specific models for trees with different DBH values. The percentage of variation associated with the use of the general model instead of the site-specific model is indicated.
| Tree Characteristics | DBH (cm) | General | Brompton | Variation (%) | Mégantic | Variation (%) | Ogden | Variation (%) |
|---|---|---|---|---|---|---|---|---|
| Volume (dm3) | 10 | 48.6 | 55.1 | −13.4 | 49.9 | −2.6 | 47.9 | +1.5 |
| 15 | 124.1 | 135.8 | −9.5 | 125.3 | −0.9 | 114.7 | +7.6 | |
| 20 | 241.3 | 257.6 | −6.7 | 240.8 | +0.2 | 213.0 | +11.7 | |
| 25 | 404.2 | 423.1 | −4.7 | 399.8 | +1.1 | 344.3 | +14.8 | |
| 30 | 616.1 | 634.8 | −3.0 | 604.9 | +1.8 | 509.8 | +17.3 | |
| Stem biomass (kg) | 10 | 18.4 | 19.1 | −3.9 | 17.7 | +3.9 | 18.5 | −0.8 |
| 15 | 43.7 | 45.2 | −3.4 | 42.2 | +3.6 | 43.9 | −0.3 | |
| 20 | 80.8 | 83.3 | −3.1 | 78.1 | +3.3 | 80.8 | − | |
| 25 | 130.2 | 133.9 | −2.8 | 126.1 | +3.1 | 129.8 | +0.3 | |
| 30 | 192.2 | 197.2 | −2.6 | 186.5 | +2.9 | 191.3 | +0.5 | |
| Branch biomass (kg) | 10 | 3.1 | 1.1 | +63.9 | 2.7 | +14.1 | 4.0 | −27.1 |
| 15 | 9.6 | 5.2 | +45.5 | 9.5 | +0.7 | 11.5 | −20.5 | |
| 20 | 21.2 | 15.5 | +27.0 | 23.3 | −10.1 | 24.6 | −16.1 | |
| 25 | 39.2 | 35.9 | +8.4 | 46.7 | −19.2 | 44.2 | −12.8 | |
| 30 | 64.8 | 71.5 | −10.2 | 82.5 | −27.3 | 71.4 | −10.1 | |
| Aboveground woody biomass (kg) a | 10 | 21.6 | 19.0 | +11.9 | 20.3 | +5.9 | 22.5 | −4.5 |
| 15 | 54.0 | 50.3 | +6.8 | 52.5 | +2.8 | 55.7 | −3.3 | |
| 20 | 103.4 | 100.3 | +3.0 | 102.9 | +0.5 | 106.0 | −2.5 | |
| 25 | 171.3 | 171.4 | −0.1 | 173.4 | −1.2 | 174.4 | −1.8 | |
| 30 | 258.7 | 265.6 | −2.7 | 265.7 | −2.7 | 262.1 | −1.3 | |
| Coarse root biomass (kg) | 10 | 5.9 | 3.8 | +35.9 | 3.4 | +41.7 | 7.2 | −22.2 |
| 15 | 10.9 | 8.2 | +24.1 | 8.2 | +24.9 | 15.6 | −43.1 | |
| 20 | 16.7 | 14.3 | +14.4 | 15.0 | +10.2 | 26.8 | −60.1 | |
| 25 | 23.4 | 22.0 | +6.0 | 24.2 | −3.2 | 40.9 | −74.6 | |
| 30 | 30.8 | 31.2 | −1.4 | 35.6 | −15.6 | 57.8 | −87.5 | |
| Total biomass (kg) b | 10 | 27.5 | 22.8 | +17.1 | 23.8 | +13.6 | 29.8 | −8.3 |
| 15 | 64.8 | 58.6 | +9.7 | 60.6 | +6.5 | 71.3 | −10.0 | |
| 20 | 120.2 | 114.7 | +4.6 | 117.9 | +1.9 | 132.8 | −10.5 | |
| 25 | 194.7 | 193.5 | +0.7 | 197.6 | −1.5 | 215.3 | −10.6 | |
| 30 | 289.5 | 296.8 | −2.5 | 301.4 | −4.1 | 319.9 | −10.5 | |
| Shoot:root ratio c | 10 | 3.7 | 5.0 | −37.5 | 5.9 | −61.5 | 3.1 | +14.5 |
| 15 | 5.0 | 6.1 | −22.8 | 6.4 | −29.5 | 3.6 | +27.8 | |
| 20 | 6.2 | 7.0 | −13.4 | 6.8 | −10.7 | 4.0 | +36.0 | |
| 25 | 7.3 | 7.8 | −6.5 | 7.2 | +1.9 | 4.3 | +41.7 | |
| 30 | 8.4 | 8.5 | −1.2 | 7.5 | +11.2 | 4.5 | +46.0 |
a Predicted values for aboveground biomass were calculated using the aboveground biomass models and not using the sum of stem and branch biomass. b Predicted values for total biomass were obtained by summing predicted values of aboveground biomass and coarse root biomass. c The shoot to root ratio was calculated by dividing the predicted values of aboveground biomass by the predicted values of coarse root biomass. Thus, the shoot to root ratio excludes fine root biomass (diameter < 2 mm).
Table 8.
Predicted values for aboveground woody biomass of trees with different DBH using the sum of predicted values from the stem biomass and branch biomass models (Stem + Branch) or using the predicted value from the aboveground woody biomass models (Abovegr.). Predicted values using the general and the site-specific models are presented.
| DBH (cm) | Aboveground Woody Biomass (kg) | |||||||
|---|---|---|---|---|---|---|---|---|
| General Model | Brompton Model | Mégantic Model | Ogden Model | |||||
| Stem + Branch | Abovegr. | Stem + Branch | Abovegr. | Stem + Branch | Abovegr. | Stem + Branch | Abovegr. | |
| 10 | 21.5 | 21.6 | 20.2 | 19.0 | 20.3 | 20.3 | 22.5 | 22.5 |
| 15 | 53.3 | 54.0 | 50.4 | 50.3 | 51.6 | 52.5 | 55.4 | 55.7 |
| 20 | 102.0 | 103.4 | 98.8 | 100.3 | 101.4 | 102.9 | 105.4 | 106.0 |
| 25 | 169.4 | 171.3 | 169.8 | 171.4 | 172.8 | 173.4 | 174.0 | 174.4 |
| 30 | 257.0 | 258.7 | 268.7 | 265.6 | 269.0 | 265.7 | 262.6 | 262.1 |
© 2017 by the authors. Licensee MDPI, Basel, Switzerland. This article is an open access article distributed under the terms and conditions of the Creative Commons Attribution (CC BY) license (http://creativecommons.org/licenses/by/4.0/).
Share and Cite
MDPI and ACS Style
Fortier, J.; Truax, B.; Gagnon, D.; Lambert, F. Allometric Equations for Estimating Compartment Biomass and Stem Volume in Mature Hybrid Poplars: General or Site-Specific? Forests 2017, 8, 309. https://doi.org/10.3390/f8090309
AMA Style
Fortier J, Truax B, Gagnon D, Lambert F. Allometric Equations for Estimating Compartment Biomass and Stem Volume in Mature Hybrid Poplars: General or Site-Specific? Forests. 2017; 8(9):309. https://doi.org/10.3390/f8090309
Chicago/Turabian StyleFortier, Julien, Benoit Truax, Daniel Gagnon, and France Lambert. 2017. "Allometric Equations for Estimating Compartment Biomass and Stem Volume in Mature Hybrid Poplars: General or Site-Specific?" Forests 8, no. 9: 309. https://doi.org/10.3390/f8090309
Note that from the first issue of 2016, this journal uses article numbers instead of page numbers. See further details here.