Article

Effective Seed Dispersal and Fecundity Variation in a Small and Marginal Population of Pinus pinaster Ait. Growing in a Harsh Environment: Implications for Conservation of Forest Genetic Resources

1
Departamento de Sistemas y Recursos Naturales, Universidad Politécnica de Madrid, Ciudad Universitaria s/n, 28040 Madrid, Spain
2
Department of Biology, University of Utah, 257 S 1400 E Salt Lake, UT 84112, USA
3
Forest Research Institute, Greek Agricultural Organization-Dimitra, 57006 Vassilika-Thessaloniki, Greece
*
Author to whom correspondence should be addressed.
Forests 2017, 8(9), 312; https://doi.org/10.3390/f8090312
Submission received: 3 July 2017 / Revised: 4 August 2017 / Accepted: 23 August 2017 / Published: 26 August 2017
(This article belongs to the Special Issue Genetics and Genomics of Forest Trees)

Abstract

:
Small-size, relict and marginal tree-species populations are a priority for conservation of forest genetic resources. In-situ conservation of these populations relies on adequate forest management planning based on knowledge and understanding of both ecological (i.e., recruitment or dispersal dynamics) and population-genetic processes (i.e., female reproductive success, gene flow or inbreeding). Here, we estimate the fecundity (or female reproductive success) of adult trees (i.e., the number of successfully established offspring/adult tree) and the effective dispersal distance distribution in the pine forest of Fuencaliente (southern Spain), a small-sized, marginal and relict population of maritime pine growing on a steep, craggy hill with just 312 reproductively active individuals. Previous studies have shown the population to present reduced allelic richness and suffer from genetic introgression from nearby exotic plantations of unknown origin. Between 2003 and 2004, we surveyed all adults and recruits and we measured several adult-specific covariates, including the number of cones of all adults. The population was found to be distributed into two nuclei with 268 (Stand 1) and 44 adults (Stand 2). We used inverse modeling to adjust several dispersal-and-fecundity models including a model with random variation in fecundity among adults (Unrestricted Fecundity or UF model). Results show that: (i) the average fecundity is 2.5–3.2 recruits/adult; (ii) the mean effective dispersal distance is restricted to 13–24 m and (iii) fecundity is most likely controlled by the spatial location of adult trees in Stand ,1 but it should be considered randomly distributed in Stand 2 (in this stand five adults mothered 80% of recruits). We conclude that the low fecundity in Stand 1 and the unequal fecundity in Stand 2 may decrease the population genetic diversity and lead to lower effective population size while the low average dispersal distance may reduce the probability of this population expanding to adjacent areas. In light of the results, we define the management priorities for in-situ conservation of this population.

1. Introduction

Small-sized and isolated populations of tree species located in the rear-edge of the range distribution are considered long-term stores of genetic diversity and their conservation is crucial for adaptation of tree species to climate change [1,2]. In situ conservation of genetic resources in such populations relies greatly on adequate forest management aiming at maintaining ecological and population-genetic processes while simultaneously reducing the risk of random genetic drift and allele fixation [3]. Determination, however, of specific management actions to be taken is very challenging without prior information and understanding of some relevant processes governing recruitment by adults, including the adult seed dispersal potential (i.e., the dispersal distance distribution between parents and their successfully established offspring) or the factors affecting adult reproduction success or fecundity (i.e., the number of successfully established offspring produced by an adult tree).
The fecundity of adult trees and the dispersal-distance distribution has often been studied via inverse modeling (IM), a method that estimates simultaneously the number of successfully established offspring and the dispersal-distance distribution using the seed-shadow model [4,5]. In addition, estimation of both parameters through the use of molecular markers for parental assignment has further enhanced the accuracy and precision of these models [6].
The average fecundity and its variation across adults of a population are crucial parameters in population dynamics, especially in small-sized and isolated populations. Fecundity variation among adults will determine the population´s effective size or the within-population spatial genetic structure [7,8]. In addition, depending on pollen flow dynamics, unequal fecundity across adults may likely lead to biparental inbreeding and to a higher risk of random allele fixation and genetic drift that will shape the within-population genetic diversity and its adaptive potential.
For marginal, small-sized and isolated populations suffering from frequent human-induced changes in their population size seed dispersal at short and long distances, determine their probability to recover their initial population size or to occupy new territories [9,10]. Thus, seed dispersal in these populations is intimately related to the probability of the population to survive and/or migrate to new territories, leading to local extinction in cases with limited seed dispersal and/or restricted fertility of adults [9]. Therefore, the study of seed dispersal dynamics is necessary not only for studying species’ responses to climate change but also for developing realistic management plans aiming at conserving species genetic resources in situ [11].
Maritime pine, the focal species of this study, is a wind-dispersed species of the western Mediterranean. In Spain, its natural distribution has been divided into 27 provenances, five of which are considered restricted due to their small population size [12]. This study focuses on one of the restricted provenances of maritime pine, the relict and marginal pine forest of Fuencaliente (Ciudad Real, Spain; Figure 1) located on the southern edge of the species natural distribution range. The Fuencaliente population is considered the unique representative of natural maritime pine forests in the Sierra Morena mountain range (central-southern Spain) and is highly isolated from other natural populations of the species (see the species distribution map in [12]). Historic [13] and palaeobotanical studies suggest that maritime pine grew throughout Sierra Morena mountain range and its surroundings since the Pliocene until the Late Holocene [14,15,16]. The maritime pine range-size reduction, that led Fuencaliente to become a relict, resulted from anthropogenic landscape transformation during the last 4000 years [17]. The main transformation drivers were wood and charcoal over-exploitation for mining and recurrent fires to favor pasture for livestock [18].
The small population of Fuencaliente managed to survive in a marginal habitat (a steep craggy hill) presumably because fires of the last centuries (either natural or human-induced) could not propagate easily in this rocky site. The evolution of this fragmented population depends largely on a well-known process taking place all over the Mediterranean basin: extensive livestock management until the 1970s (approximately) has ceased and the associated activities (frequent pasture burning to induce resprouting that assures livestock feeding) have disappeared. As a result, tree species’ populations are expanding to areas previously used as pastureland [19].
Several studies using allozymes, chloroplast or microsatellite markers have highlighted the importance of Fuencaliente population (as well as other relict populations) to the total species diversity in the Iberian Peninsula [20,21]. This population has a marked reduction in allelic richness, compared to other populations of maritime pine in Spain [22]. In order to aid Fuencaliente’s conservation, recent investigations have studied genetic introgression patterns from nearby exotic plantations of unknown origin [23,24,25]. Another recent study has evaluated the damage that deer (Cervus elaphus L.) cause to this population by rubbing [26]. However, information on recruitment dynamics and its dispersal potential is still scarce, and this data would serve well to establish an adequate conservation plan, which has yet to be reported.
The general objective of this study was to determine recruitment patterns in the population of Fuencaliente and propose specific forest-management actions aiming at conservation of forest genetic resources. We produced accurate estimates of the effective dispersal distance distribution and of adult fecundity using IM. In addition, we determined the most likely tree-specific traits controlling fecundity variation among adults.

2. Materials and Methods
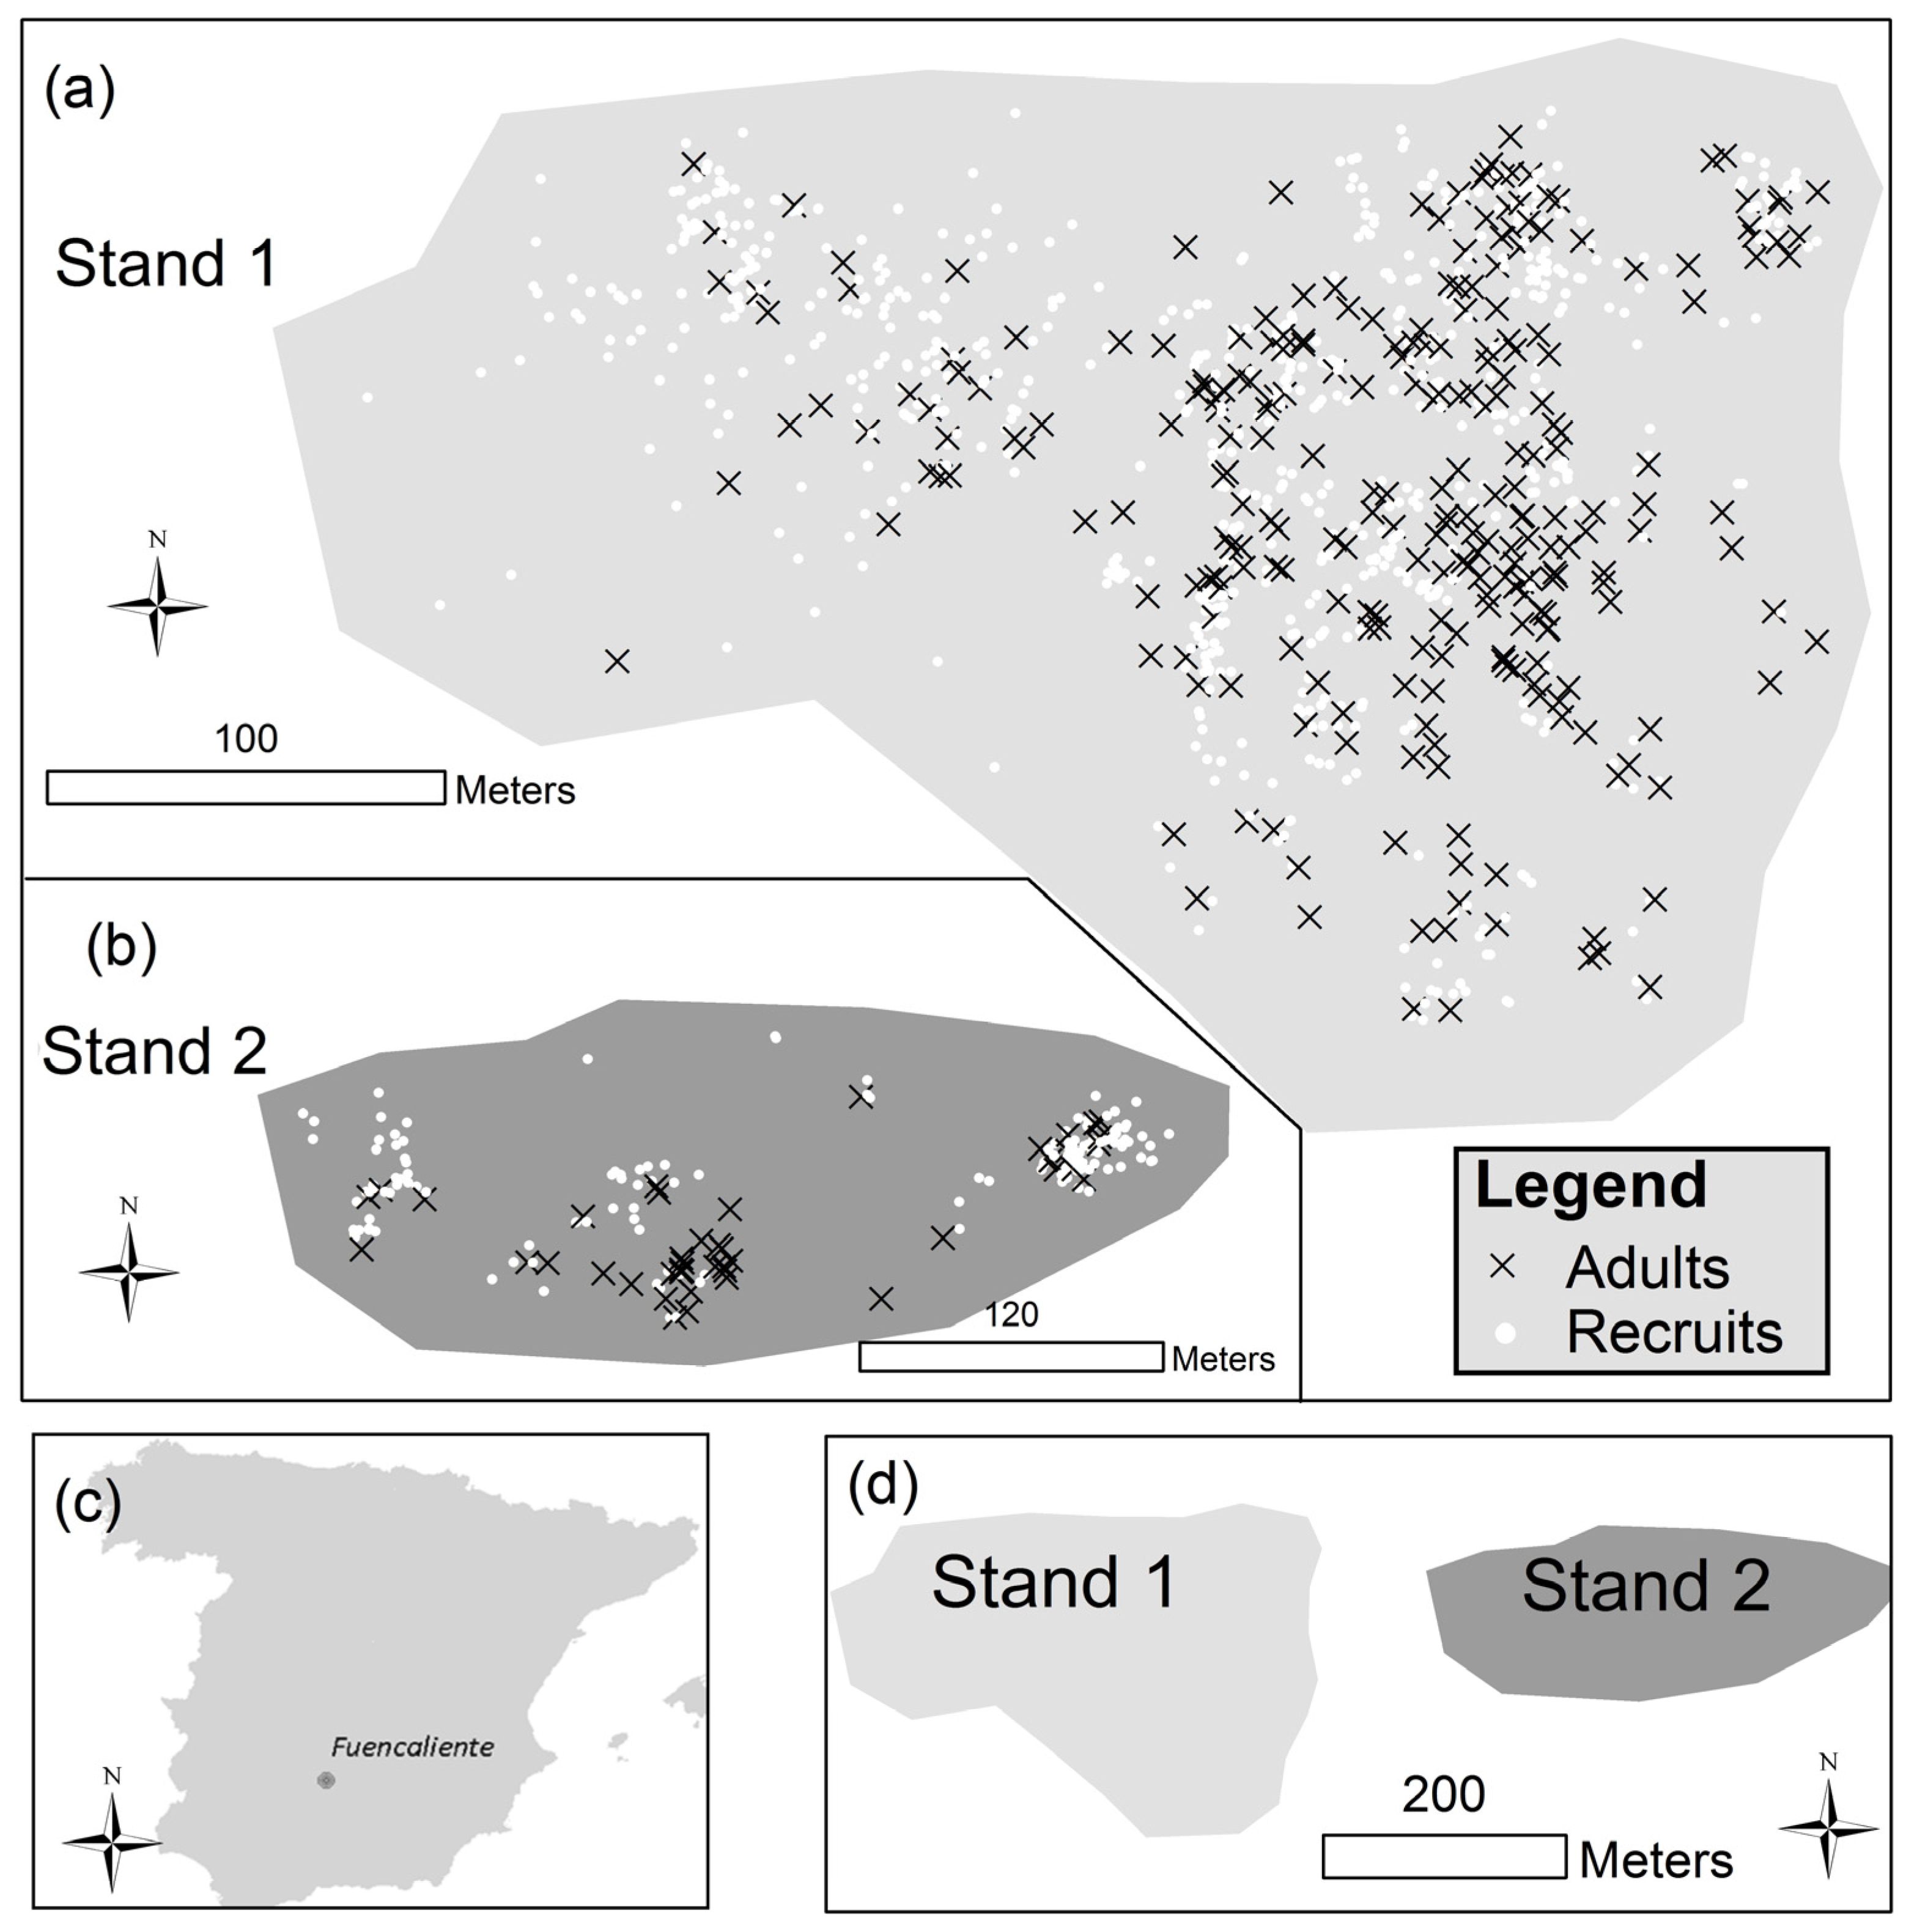
2.1. Study Area

The relict population of Pinus pinaster Ait. is located in the northern part of Sierra Morena mountain range and, more specifically, in Sierra Madrona (38°25′ N, 4°15′ W; Figure 1) close to Fuencaliente village (Ciudad Real). The site is protected under the Natura 2000 network. The climate in this area is Mediterranean-continental, with 14.5 °C mean annual temperature and 680 mm mean annual precipitation (59 mm in the summer months; [26]). The average altitude of the site is 1011 m a.s.l. (ranging from 907 to 1114 a.s.l.). Soils are rocky, poor in nutrients and acid with a main lithological substrate of quartzites [27]. The steepness (40% average slope), the southern exposure, and the eroded terrain greatly reduce the site quality, which can be considered as the most limiting factor for growth and regeneration, conferring this site its marginal characteristics.

2.2. Forest Inventory

In 2003 we performed a full forest survey within the area occupied by the pine population by tagging all individuals with a basal diameter larger than 1.5 mm (only lignified individuals were recorded). The spatial location of surveyed individuals was defined using a GPS (positioning errors were smaller than 1 m). In 2004, we measured tree total height, diameter at the base of the tree and diameter at breast height (DBH) of all trees tagged in 2003 and we determined the number of open cones and the number of serotinous cones on the crown of all trees by counting all visible cones. For the following analyses, trees were classified into two categories:
-
Adults: trees with at least one cone on their crown
-
Recruits: the rest of the individuals
In 2015 we selected 20 recruits to provide a rough description of the age of the recruitment cohort at the time when the forest inventory was realized. Sampling was based on a systematic rectangular grid superimposed on the spatial distribution map of recruits; individuals closest to the grid nodes were selected for sampling. The age of the sampled recruits was determined by growth-ring counting from cores extracted from their base with a Pressler drill (when their basal diameter was sufficiently large). Small-sized recruits were transported to the laboratory for age measurements via visual counting of tree rings at the tree base.

2.3. Modeling Effective Dispersal

Effective dispersal was modeled using the seed-shadow approach [28]. Quadrat counts (2 m × 2 m in size) of recruits were computed using their spatial coordinates. The observed sample (n1, …, nM) consists of the locations and the number of recruits in the j-th quadrat (j = 1, …, M) as well as the locations of N adult trees (tree is indexed by i, i = 1, …, N) along with several covariates measured on each adult (i.e., DBH, number of cones, etc.). We assumed that the number of recruits λij originating from tree i and dispersed to quadrat (or site) j is Poisson distributed with expected value:
λ i j = S i   P ( a   recruit   from   tree   i   lands   upon   site   j )   S i A j f R ( r ) / 2 π   r i j
Being Si the fecundity of tree i (i.e., the number of recruits originating from the specific adult), rij the distance separating adult i form quadrat j and Aj the area of site j. Under this model, the total number of recruits on site j from the N trees is also Poisson distributed with expected value:
λ j = i = 1 N λ i j
The f R ( r ) term of Equation (1) designates the probability density for the random dispersal distance (r) assumed to follow a lognormal distribution with probability density:
f R ( r ) = 1 r σ 2 π exp ( ( ln r μ ) 2 2 σ 2 )   r > 0
and μ and σ2 the scale and shape parameters, respectively.

2.4. Models for Fecundity

We modeled the fecundity term of the seed-shadow model using three approaches. First, fecundities were allowed to vary among adults without any restriction by assigning a parameter to every adult [29]. This model (UF model) has a large number of parameters to be estimated and assumes that variability among the adult´s reproductive success is purely random (Table 1).
The second model (MF) assumes that adult fecundities may be modeled using the average fecundity of adults. Under this model, adults are assumed to have produced the same number of recruits so that a unique estimated parameter (i.e., the average fecundity) is sufficient to describe between-adult variation in reproductive success. Finally, we used adult-specific covariates to model fecundity (as in classical seed-shadow modeling). Several covariates were used for this purpose (Table 1) that can be grouped into three categories depending on the nature of the covariate:
  • Tree size covariates (basal area, BA, and tree height, H). From an ecological perspective, these models inherently assume that reproductive success is a linear function of tree size.
  • Cone number covariates (total cones, Tc, open cones, Oc, and serotinous cones, Sc). Models using covariates related to the cone number assume that the number of seeds and number of recruits produced by adults is linearly related.
  • Spatial covariates (the east-west, Xco, and the north-south, Yco, coordinates of adults). Inherently, these models assume the reproductive success has some relation to the microhabitat conditions surrounding the adult tree.

2.5. Parameter Estimation

Parameters of the UF model were estimated through maximization of the incomplete-data log-likelihood function of the Poisson distribution:
l c ( μ , σ , S 1 , , S N ) = i = 1 N j = 1 M ( λ i j + n i j ln ( λ i j ) ln ( n i j ! ) )
through the EM-algorithm [30] using the procedure described in [29]. Parameters of the rest of the models were estimated via maximization of the complete-data log-likelihood:
j = 1 M ( λ j + n j ln ( λ j ) ln ( n j ! ) )
as described in several publications on seed dispersal modeling (see, for instance, [28] or [4]). Maximization was achieved through numerical optimization using the nlminb function of R [31]. The negative binomial distribution that has been employed in other studies [32] could not be used since the UF model parameters may be estimated analytically only through the Poisson likelihood.

2.6. Model Comparison

The best model to describe fecundity and dispersal was selected using the corrected Akaike´s Information Criterion (AICc) [33]. Model selection was facilitated by the computation of the following measures/indices:
  • The difference between the AICc for the k-th model and the one with the smallest AICc (AICcmin):
    Δ k = AICc k   AICc min
  • The correlation coefficient between observed and predicted counts in quadrats of the k-th model
When the UF model resulted in a valid model, we computed the correlation coefficient between fecundities estimated by this model with the adult-specific covariates. A standard t-test was used to test the hypothesis of the correlation coefficient being larger than zero.

3. Results

3.1. Descriptive Results

The population was found to be divided into two nuclei occupying an area of 7 ha (western stand) and 3.5 ha (eastern stand; we will use the term Stand 1 and Stand 2 for future reference of the western and the eastern stand, respectively). The spatial distribution of adults and recruits in the two stands can be seen in Figure 1. In Stand 1, the average fecundity was 2.56 recruits/adult (268 adults and 686 recruits). In Stand 2, the average fecundity was slightly higher, 3.25 recruits/adult (44 adults and 143 recruits). The average number of cones/adult of Stand 1 (58.2 cones/adult) was twice as large as for Stand 2 (33.9 cones/adult). In addition, a remarkable among-tree variation was found for both stands in the number of cones/adult, which varied between 1 and 587 in Stand 1, and between 1 and 193 in Stand 2. Both distributions were skewed with 25% of trees bearing less than 5 and 3.8 cones/adult for Stand 1 and 2, respectively.
Both stands had a considerably low adult density (38.2 trees/ha and 12.5 trees/ha for Stand 1 and 2, respectively). Both stands were uneven-aged in their structure with several individuals occupying the lower diameter classes (see the DBH column in Table 2). The diameter at the base of the tree-trunk (a variable used as a substitute to DBH in this multi- cohort stand) was very similar for the two stands (27.3 cm and 28.1 cm for Stands 1 and 2, respectively). Finally, the average adult-tree height was 5.4 m for both stands, and 25% of adult trees had a height smaller than 3.5 m.
The mean height of recruits (i.e., individuals without visible cones on their crown) was 0.8 m for both stands, while the mean DBH was 0.5 and 0.3 cm for Stand 1 and Stand 2, respectively. Some large sized individuals exhibited no cones in their crown and, therefore, were classified as recruits (the maximum height of recruits was 6.6 and 4.3 m for Stand 1 and 2, respectively; Table 2). Large-sized recruits without any cones on their crown may have been dispersing some seeds during the previous years, but the total number of seeds produced must have been small (cones of maritime pine, especially serotinous ones, persist on the crown during several years), thus expected errors from misclassification in the recruitment cohort may have no practical importance.
Tree age measurements performed on a subsample of recruits showed that this cohort consisted of individuals that germinated during the time interval from 1973 to 1995 (in 2004 recruits were between 9 and 31 years old, the average age being 22 years).

3.2. Choosing the Best Model for Fecundity

Not surprisingly, the UF model showed the largest log-likelihood in both stands (Table 3). Given the high number of free parameters, this model has a very flexible structure that permits local adjustment due to tree-to-tree differences in fecundities. However, the use of AICc (that punishes models having too many parameters) showed that the best-fit model differed depending on the stand considered.
In Stand 1, the model using one of the spatial coordinates of adults (Yco, the north-south coordinate) was the best in terms of AICc (for this model Δ k = 0 ). The model that assumes an average fecundity for adults (MF model) had a Δ k = 35.3 , substantially larger than the best model. In addition, five models (BA, UF, H, Xco and Oc) had a Δ k larger than the MF model (Table 3) and therefore were not considered in ulterior analyses. Two models, however, including total cones (Tc) or serotinous cones (Sc) as covariates showed an Δ k smaller than the MF model (17.6 and 20.9, respectively) and could be considered as alternatives. Notwithstanding, their relative efficiency showed that both were poor approximations of the process generating the dispersal data of Stand 1 as values of Δ k > 10 are indicative of no empirical support for the corresponding model [34]. Therefore, the results indicated that there was sufficient experimental evidence to conclude that the model using the north-south coordinate of adults (Yco model) was the best model to describe the process generating the dispersal pattern in Stand 1. However, the Yco model showed a rather poor fit considering the low correlation coefficient between observed and predicted counts (r = 0.2, Table 3). In addition, note that the best correlation coefficient was much higher for the UF model (r = 0.3, Table 3).
The results obtained in Stand 2 were quite different. The smallest AICc was obtained for the UF model (AICc = 1220.9), that, by definition, was assigned Δ k = 0 . The null model (MF model), on the other hand, exhibited an Δ k = 70.9 with respect to the UF model. Five other models showed a Δ k larger than the MF model and were not considered in ulterior analyses (Table 3). These were the two tree-size covariates models (BA and H models) and the three seed-set covariate models (Tc, Oc and Sc). Thus, the only models exhibiting an Δ k lower than the one obtained for the null model (apart from the best in terms of AICc, i.e., the UF) were the ones incorporating the spatial coordinates as proxies to fecundity (Yco and Xco). Though, the evidence of the UF model against the two “spatial” models was very strong ( Δ k = 41.4   and   69.3   for the Yco and the Xco models, respectively). Conclusively, our results supported the hypothesis that the UF model was the best model to describe the process generating the dispersal pattern in Stand 2. Finally, the UF model was the best in terms of minimizing the information loss as it exhibited a rather acceptable fit given the high correlation coefficient obtained between observed and predicted counts (r = 0.34, Table 3).

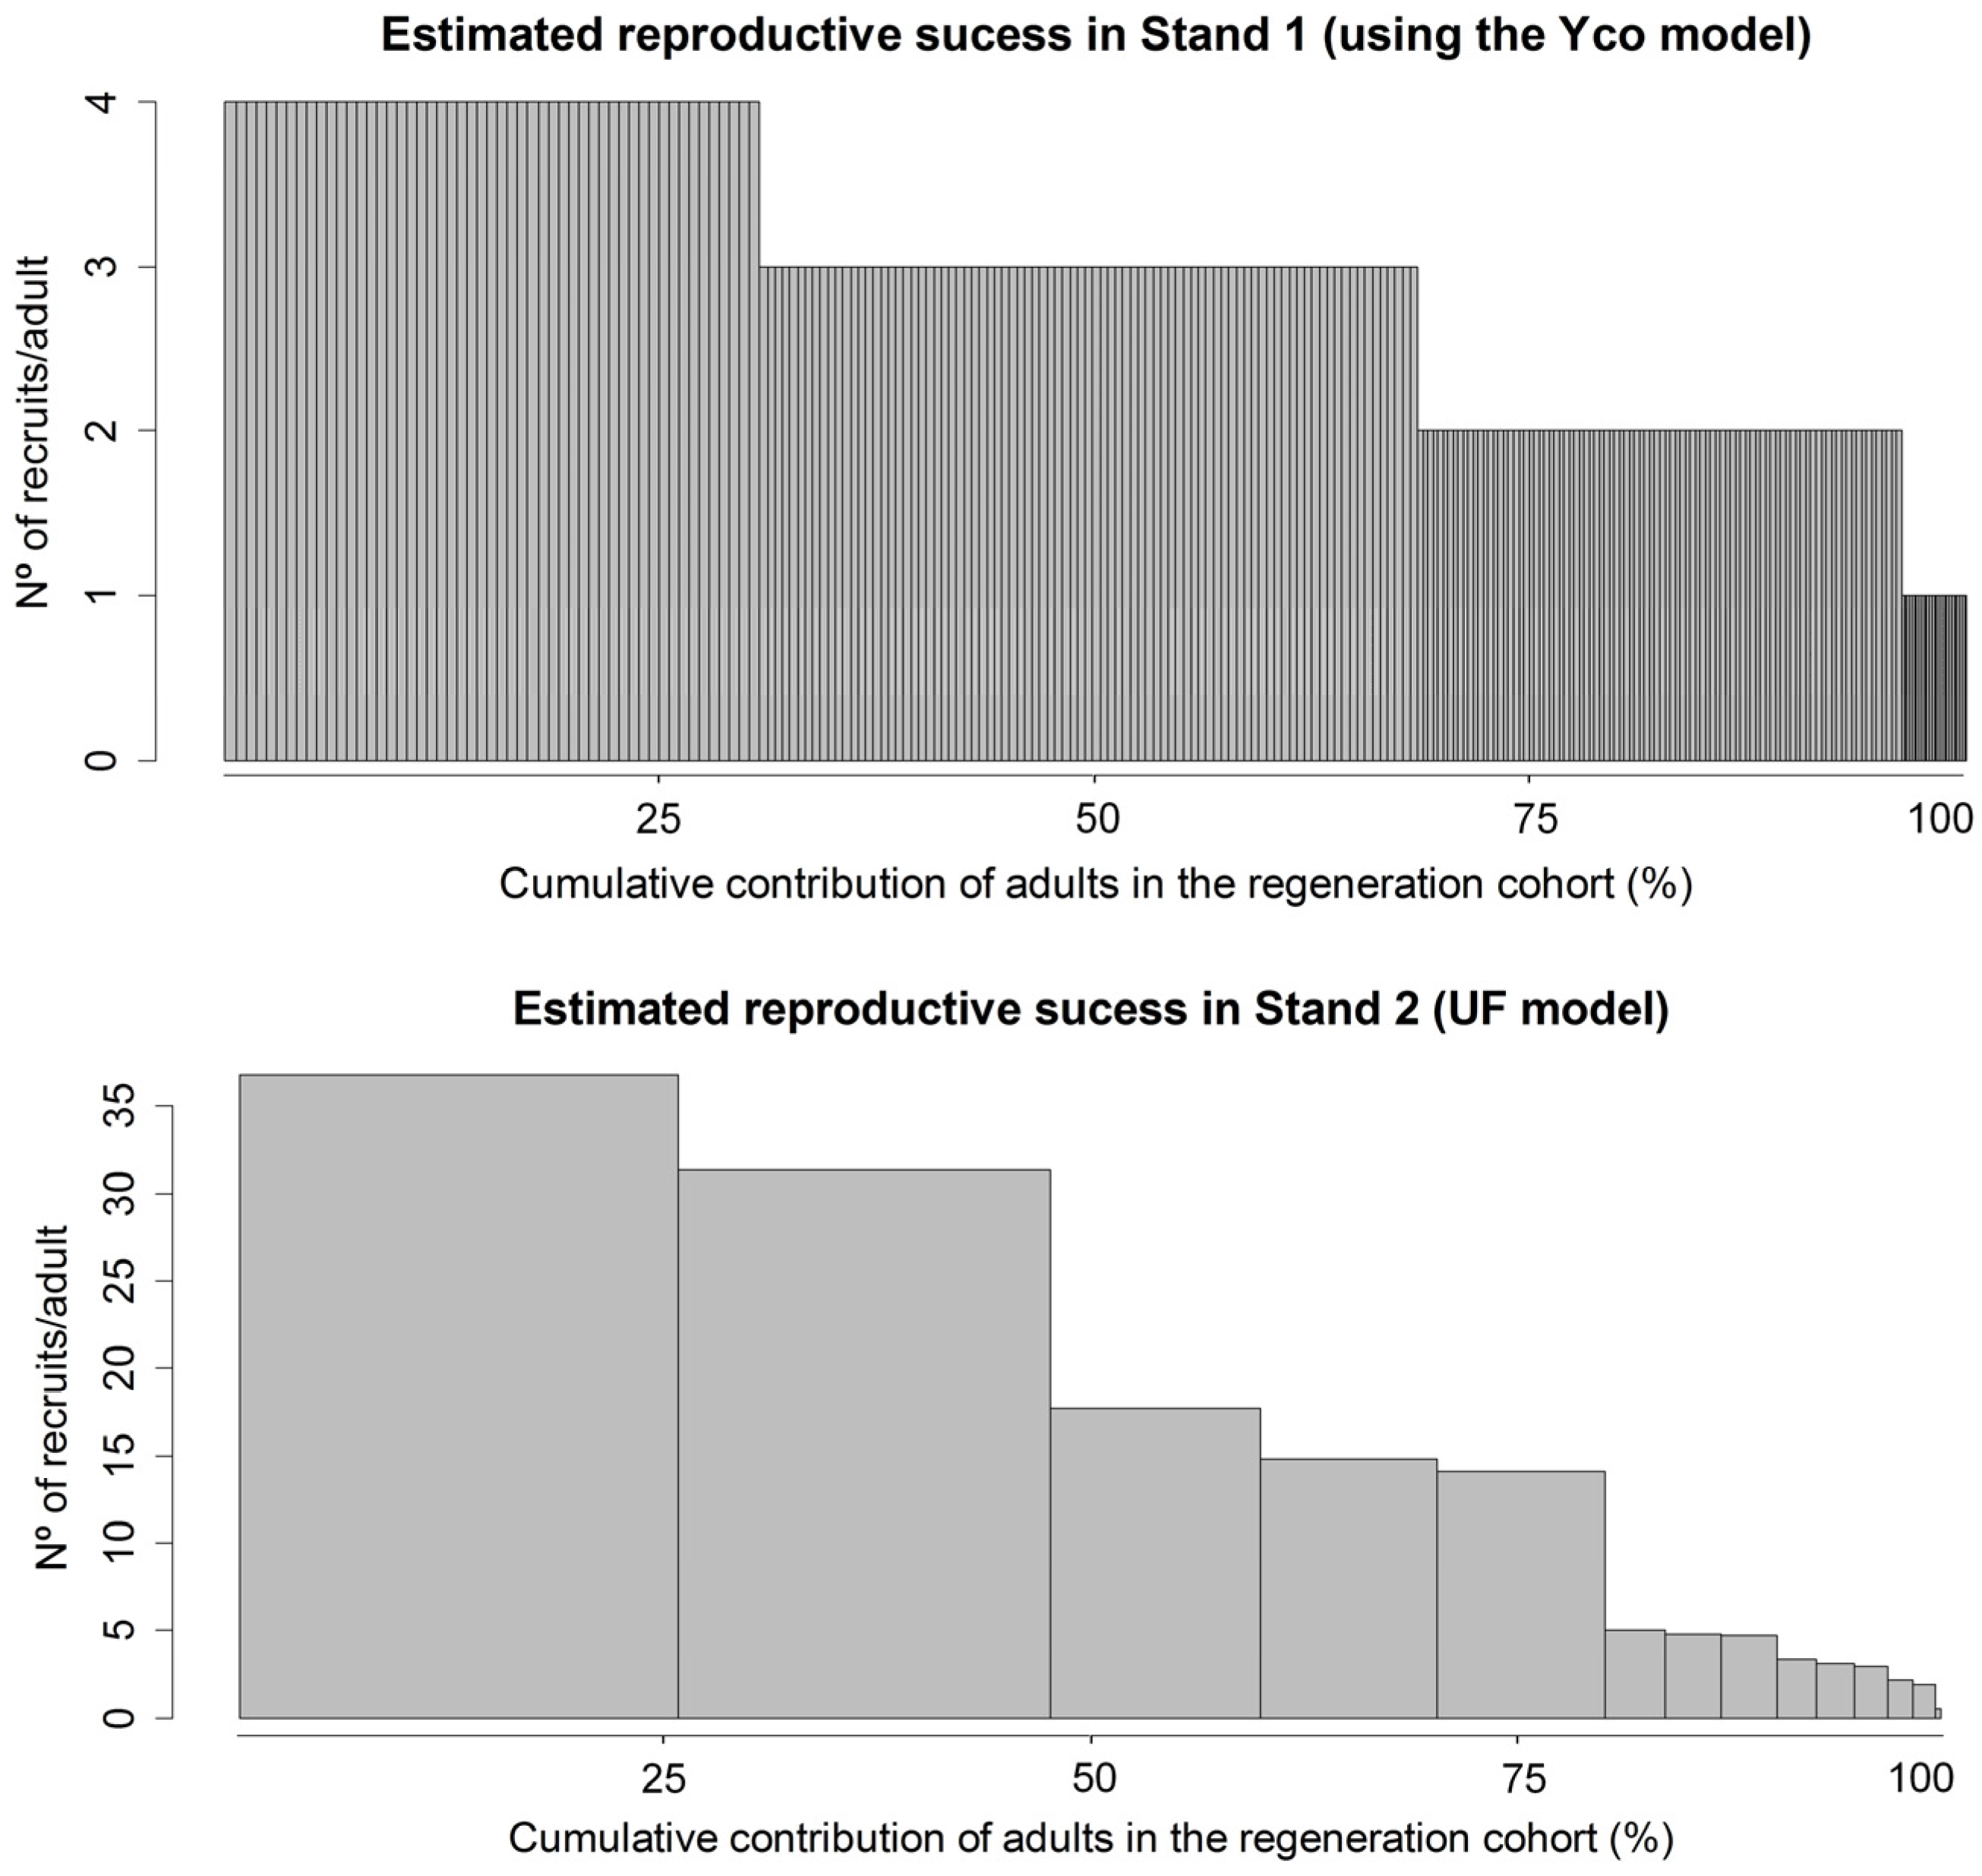
3.3. Dispersal and Fecundity Parameter Estimates

Table 4 shows the estimated parameters for the two stands and the nine postulated models. In addition, it presents the average dispersal distances (mean, mode and median) only for models showing a Δ k smaller than the null model of the corresponding stand. Within the same stand, mean dispersal distances estimated with different models were very similar. For Stand 1, the mean dispersal distance estimates varied between 20.7 and 25.9 m, whereas for Stand 2 they were slightly smaller as they ranged between 12.9 and 15.5 m. The mean dispersal distance in Stand 1 (24 m) was twice as large as in Stand 2 (12.9 m) according to the best model of each stand (i.e., Yco in Stand 1 and UF in Stand 2).
Fecundity estimates in both stands are presented in Table 5. The best model for Stand 1 (Yco model) predicted an average fecundity of 2.6 recruits/adult; this is very similar to the value obtained from the inventory results. Variability of the estimated fecundities was, however, very small for this model (fecundities ranged from 0.1 to 4.3 recruits/adult). Figure 2 shows, in addition, that the relative contribution of each adult to the regeneration cohort, estimated through the fecundities of the Yco model is very homogeneous in Stand 1. Notwithstanding, the variance of (estimated) fecundities is much larger for other models in this stand (according to model Tc, for instance, fecundities of adults varied between 0.04 and 26.08 recruits/adult).
In Stand 2, where the best model was the UF model, we found a much larger variability among estimated fecundities (ranging between 0 and 36.8 recruits/adult) while the variance of the estimated fecundities (63.1) was the largest of all models and stands (Table 5). The rest of the candidate models (Yco, Xco and MF) showed very similar average fecundity estimates but a much smaller among-tree variance in fecundity estimates. Finally, according to the UF model predictions, the fecundity distribution in Stand 2 was very skewed, with three trees having produced 60% of the regeneration (Figure 2). In addition, 30 adults exhibited an estimated fecundity equal to zero and may be considered as being reproductively inactive. Notwithstanding, the number of reproductively inactive adults may be overestimated by the UF model when adults are spatially clustered [35].
Finally, a t-test for the correlation coefficient between the fecundities estimated via the UF model and other adult covariates (i.e., basal area, height, cone numbers and spatial coordinates) showed that correlation was significantly larger than zero only in the case of the y-coordinate of the adult tree (r = 0.34, t = 2.31 with 42 degrees of freedom, p = 0.02). This seems to confirm the results of Table 4 (Stand 2), where we showed that the best model (after the UF model) in terms of AICc reduction was the one using the y-coordinate of adults as a proxy for fecundity. A similar statistical test for Stand 1 was not performed since the UF was not judged appropriate to model these data.

4. Discussion

4.1. Fecundity Dynamics

Cone production by adult trees does not seem to be a limiting factor to regeneration and expansion of this population given that 268 trees in Stand 1 and 44 in Stand 2 are seen with cones in their crowns. Furthermore, some of them (the most vigorous) may be classified as high seed producers having up to 587 and 193 cones in Stand 1 and 2, respectively, while some really short individuals (just 0.5 m height) are seen with cones in their small crowns. Nevertheless, the distribution in reproductive success (in the seed stage) that was shown to be unequal among adults (25% of adults have less than 5 visible cones on their crown in Stand 1) should be a factor that reduces the regeneration potential of this stand.
On the other hand, fecundity is dramatically reduced in both stands. Recruitment in this population started to be effective only after 1973 (the maximum age in the sample of recruits was 31 years when sampling was performed in 2004). This time period coincides with the ceasing of extensive livestock management and the disappearance of the associated activities, such as frequent pasture burning. However, the average number of recruits/adult (3.25 recruits/adult in Stand 2) is a clear indication of low recruitment potential. Several factors may be responsible; among others is the high density of deer living in the area, which by browsing and fraying can cause severe damage and mortality to the regeneration cohort [26]. Deer can also affect fecundity of mature pines since those trees highly damaged by fraying produce fewer cones [26]. In addition, severe summer drought effects in conjunction with the poor edaphic conditions (complete absence of soil in many areas due to erosion) may be important factors contributing to massive mortality during the seed-to-sapling transition. A recent study using seed from this population [23] showed that seedlings obtained from seeds of Stand 1 exhibited higher mortality rates in water-stress experiments as compared to seedlings grown from seeds from nearby plantations.
Our results for Stand 2 also indicate that the distribution of fecundity across adults is highly skewed with the three most successful individuals (6.8% of adults) mothering 60% of the regeneration cohort. Unequal reproductive success in the seedling and sapling stages is a common phenomenon in forest stands and it has been reported previously in maritime pine in Spain [36] and in other tree species [35]. Should this pattern repeat itself during the subsequent years, we may predict an additional loss of genetic variation in a population that has been shown to be poor in terms of allelic composition of the adult cohort [22]. In addition, the unequal fecundity of adults in small populations can increase the genetic bottlenecks and further exacerbate the risk of random genetic drift. These results can aid conservation measures by helping identify individuals from which seed should be collected in order to minimize diversity losses, i.e., from those trees that the model shows that are not mothering recruits.
Results on variance of reproductive success are not reported in Stand 1 because the UF model that allows for a covariate-free estimation of fecundities had to be rejected due to its Δ k being smaller than the null model. Interestingly, the UF model was the best model in Stand 2 (with 3.25 recruits/adults) but could not be informative enough in Stand 1 with just 2.56 recruits/adult given the high number of parameters to be estimated.
The results of this study may further enhance our knowledge on the factors governing fecundity and dispersal. According to our results, the hypothesis that fecundity is greater for bigger individuals should be rejected (see also [8,36]). Models based on tree size (basal area and tree height) to estimate fecundity were rejected for their performance being smaller than the null model. The same conclusion may be reached for covariates related to cone counts in Stand 2. However, in Stand 1, the use of the number of cones as a covariate improved the null model’s performance so, in the absence of other more informative covariates, we may accept the hypothesis that effective fecundity is positively correlated to seed set variables (total number of cones/adult). Nevertheless, these results have to be interpreted with caution since this species has serotinous cones [35] and, therefore, it may be possible that results differ if regeneration is evaluated after a fire since, in that case, we may expect higher fecundity for trees with a higher number of serotinous cones.
Additionally, future studies using molecular markers to identify parentage relationships between parents and successfully established offspring may be used to confirm the patterns revealed by inverse modeling ([37,38]). Previous studies have shown that results for sapling dispersal kernels estimated via classical inverse modeling were remarkably similar to the ones obtained by genetic methods [36,39].
Our results highlight the importance of spatial covariates in estimating the effective adult fecundity and further support the hypothesis that in this relict population of maritime pine the most important factors in shaping the reproductive success of adults (evaluated as the number of seedlings and saplings they disperse) are related to their spatial location. According to model parameter estimates, adults with higher reproductive success are located in the northern part of both stands (note that the β parameter for the Yco models is positive in both stands, Table 4), where we may find better site qualities that allow for higher success in seed germination and establishment. It should be noted that the northern part of these stands corresponds to higher elevations in this population; therefore, Yco covariate might be capturing an environmental gradient, (i.e., a factor causing a direct effect on seed germination and establishment). Another possible explanation is that population expansion from south to north is causing higher reproductive success in the northern part because more sites free of intraspecific competition are available in this previously unoccupied area.

4.2. Effective Dispersal Distances

Average effective dispersal distances were reduced in this population (24 m in Stand 1 and 13 m in Stand 2). In other Pinus pinaster stands of central range [14], an average effective dispersal distance of 40 to 60 m was reported (depending on the model used). The most comprehensive study of maritime pine primary seed dispersal (i.e., before Janzen-Connell effects and secondary dispersal) performed in Spain [40] reported average primary seed dispersal distances of 14–25 m. Therefore, our findings suggest that the average effective dispersal of Fuencaliente population is in the same order of magnitude as primary seed dispersal in other populations.
Reduced dispersal distances may be due to the small height of trees in this population. Indeed, the average tree height of adult individuals was only 5.4 m, and the shortest mature tree in our data-set, bearing two cones on its crown, was just 45 cm in height. As seed dispersal distances are strongly correlated with plant height [41], dispersal distances may have been drastically reduced by tree height (seed release height), which is directly related to site quality. Other factors that could also account for the strong dispersal limitation observed, such as the absence of animal-mediated dispersal or density-dependent mortality [34,42], should also be considered but our data-set does not allow for more specific conclusions to be drawn.
In addition, the fact that the population grows in low stand densities does not seem to have favored effective dispersal at larger distances by offering sites free of conspecific competition [19]. This should be expected in this stand since the low stem density does not imply the existence of adequate sites for seedling establishment. Indeed, favorable microsites for establishment are very limited due to complete soil loss (in some cases) or because they have been already occupied by adult conspecifics. Under these conditions, it seems very unlikely that new recruits will establish in this population in the mid-term. Seemingly, dispersal potential and population expansion are drastically reduced in poor environments due to both decreasing adult tree height and safe-site limitation for seedling establishment.

4.3. Management Implications

In situ conservation of this population is a great priority for forest management and conservation, especially taking into account the results of recent studies on genetic diversity [26,28]. Due to its relict nature, the population of Fuencaliente has been included as one of the provenances of Pinus pinaster and is also considered as a model population for studying genetic introgression by exotic plantations [23]. However, no specific measures have been implemented for the protection, conservation, and restoration of Fuencalinente pine population other than being part of a Natura 2000 Site.
Measures to support the conservation and recovery of this population should include both legislative initiatives towards generating a special legal status that will recognize the uniqueness of the population as well as actions with local institutions and society to achieve higher awareness for this forest genetic resource.
Managerial actions may also enhance the viability of the population. Seeds from the individuals that show lower fecundity, mainly located in the southern part of both stands, should be used for population augmentation. Seedlings grown from these seeds could be used in small plantation programs within the population targeting favorable microhabitats with limitations in seed arrival. This action would increase or at least maintain stand genetic diversity by enhancing recruitment of reproductively inactive individuals. Additionally, as we report in a parallel study [26], deer density in the area should be reduced to avoid excessive damage caused by these animals to regeneration and adult individuals.
On the other hand, silvicultural treatments should be applied in Fuencaliente’s surroundings to reduce fire risk as currently, the population might not be able to recover if it burns due to its small size. Moreover, canopy seed bank contained in closed cones has been severely reduced since the arrival of squirrels (Sciurus vulgaris L.) in this area in 2005 [26]. Finally, seeds from this local population should be used in plantation programs in the nearby areas in accordance with [23] proposal after studying introgression dynamics between the local and the introduced gene pools.

5. Conclusions

Fecundity is very low in the pine forest of Fuencaliente and managerial actions seem to be necessary for the conservation of its genetic resources. In addition, unequal fecundity among adults in one of the stands suggests that further loss of genetic diversity may be expected from reproductive inactivity of the majority of adult trees in Stand 2. Furthermore, we found no evidence that adult tree size is related to higher adult fecundity. However, we found evidence that adult fecundity is mostly related to the spatial location of adults, a finding suggesting that the most limiting factor to regeneration is the lack of microsites favorable for seed emergence and survival. Finally, we report very low dispersal distances for successfully established offspring, a fact that further reduces the probability of the population to expand to adjacent and unoccupied areas. Forest management should aim at reinforcing the reproductive potential of less fecund adults by designing small plantation programs within the population targeting favorable microhabitats with limitations in seed arrival.

Acknowledgments

This work is part of an agreement on conservation and improvement of conifer genetic resources between the Directorate General for Nature Conservation (Ministry of Environment, Spain) and the Technical University of Madrid. It has also received financial support from the Regional Government of Castile-La Mancha. We also thank Fuencaliente Municipality for giving us permission and logistic support for accessing the site to collect the data.

Author Contributions

J.C., L.G. and N.N. conceived and designed the experiments; J.C. performed the experiments; J.C., L.G., M.V. and N.N. analyzed the data; L.G. contributed reagents/materials/analysis tools; N.N. led the writing of the paper. N.N. and L.G. supervised the doctoral thesis of J.C.

Conflicts of Interest

The authors declare no conflict of interest

References

  1. Hampe, A.; Petit, R.J. Conserving biodiversity under climate change: The rear edge matters. Ecol. Lett. 2005, 8, 461–467. [Google Scholar] [CrossRef] [PubMed] [Green Version]
  2. Ganopoulos, I.; Aravanopoulos, F.A.; Argiriou, A.; Kalivas, A.; Tsaftaris, A. Is the genetic diversity of small scattered forest tree populations at the southern limits of their range more prone to stochastic events? A wild cherry case study by microsatellite-based markers. Tree Genet. Genom. 2011, 7, 1299–1313. [Google Scholar] [CrossRef]
  3. Lowe, A.J.; Boshier, D.; Ward, M.; Bacles, C.F.E.; Navarro, C. Genetic resource impacts of habitat loss and degradation; reconciling empirical evidence and predicted theory for neotropical trees. Heredity 2005, 95, 255–273. [Google Scholar] [CrossRef] [PubMed]
  4. Ribbens, E.; Silander, J.A.; Pacala, S.W. Seedling recruitment in forests—Calibrating models to predict patterns of tree seedling dispersion. Ecology 1994, 75, 1794–1806. [Google Scholar] [CrossRef]
  5. Nathan, R.; Muller-Landau, H.C. Spatial patterns of seed dispersal, their determinants and consequences for recruitment. Trends Ecol. Evol. 2000, 15, 278–285. [Google Scholar] [CrossRef]
  6. Moran, E.V.; Clark, J.S. Estimating seed and pollen movement in a monoecious plant: A hierarchical Bayesian approach integrating genetic and ecological data. Mol. Ecol. 2011, 20, 1248–1262. [Google Scholar] [CrossRef] [PubMed]
  7. Petit, R.J.; Bialozyt, R.; Garnier-Géré, P.; Hampe, A. Ecology and genetics of tree invasions: From recent introductions to Quaternary migrations. For. Ecol. Manag. 2004, 197, 117–137. [Google Scholar] [CrossRef]
  8. Gerzabek, G.; Oddou-Muratorio, S.; Hampe, A. Temporal change and determinants of maternal reproductive success in an expanding oak forest stand. J. Ecol. 2017, 105, 39–48. [Google Scholar] [CrossRef]
  9. Hampe, A.; Arroyo, J. Recruitment and regeneration in populations of an endangered South Iberian Tertiary relict tree. Biol. Conserv. 2002, 107, 263–271. [Google Scholar] [CrossRef]
  10. Nathan, R.; Safriel, U.N.; Noy-Meir, I.; Schiller, G. Spatiotemporal variation in seed dispersal and recruitment near and far from Pinus halepensis trees. Ecology 2000, 81, 2156–2169. [Google Scholar] [CrossRef]
  11. Lefèvre, F.; Boivin, T.; Bontemps, A.; Courbet, F.; Davi, H.; Durand-Gillmann, M.; Fady, B.; Gauzere, J.; Gidoin, C.; Karam, M.-J. Considering evolutionary processes in adaptive forestry. Ann. For. Sci. 2014, 71, 723–739. [Google Scholar] [CrossRef]
  12. Alía, R.; Martín, S.; de Miguel, J.; Galera, R.; Agúndez, D.; Gordo, J.; Salvador, L.; Catalán, G.; Gil, L. Las Regiones de Procedencia de Pinus pinaster Aiton en España; Organismo Autónomo Parques Nacionales-ETSI de Montes: Madrid, Spain, 1996. [Google Scholar]
  13. Gil, L. Consideraciones históricas sobre Pinus pinaster Aiton en el paisaje vegetal de la Península Ibérica. Estudios Geogr. 1991, 202, 5–27. [Google Scholar]
  14. Díaz-Fernández, P.M. Relations between modern pollen rain and Mediterranean vegetation in Sierra Madrona (Spain). Rev. Palaeobot. Palynol. 1994, 82, 113–125. [Google Scholar] [CrossRef]
  15. Rubiales, J.M.; García-Amorena, I.; Álvarez, S.G.; Morla, C. Anthracological evidence suggests naturalness of Pinus pinaster in inland southwestern Iberia. Plant Ecol. 2009, 200, 155–160. [Google Scholar] [CrossRef] [Green Version]
  16. Ruiz-Zapata, B.; Gil-García, M.J.; de Bustamante, I. Paleoenvironmental reconstruction of Las Tablas de Daimiel and its evolution during the Quaternary period. In Ecology of Threatened Semi-Arid Wetlands: Long-Term Research in Las Tablas de Daimiel; Sánchez-Carrillo, S., Angeler, D.G., Eds.; Springer: Dordrecht, The Netherlands; Heidelberg, Germany; London, UK; New York, NY, USA, 2010; pp. 23–43. [Google Scholar]
  17. Valbuena-Carabaña, M.; López de Heredia, U.; Fuentes-Utrilla, P.; González-Doncel, I.; Gil, L. Historical and recent changes in the Spanish forests: A socio-economic process. Rev. Palaeobot. Palinol. 2010, 162, 492–506. [Google Scholar] [CrossRef]
  18. Charco, J. Evolución Histórica de los Bosques en Sierra Madrona y Valle de Alcudia (Ciudad Real) y Dinámica del Pinar Relicto de Navalmanzano. Ph.D. Thesis, E.T.S.I. de Montes, Universidad Politécnica de Madrid, Madrid, Spain, 2016. [Google Scholar]
  19. Chauchard, S.; Carcaillet, C.; Guibal, F. Patterns of land-use abandonment control tree-recruitment and forest dynamics in Mediterranean mountains. Ecosystems 2007, 10, 936–948. [Google Scholar] [CrossRef]
  20. González-Martínez, S.; Salvador, L.; Agúndez, D.; Alía, R.; Gil, L. Geographical variation of gene diversity of Pinus pinaster Ait. in the Iberian Peninsula. In Genetic Response of Forest Systems to Changing Environmental Conditions; Muller-Starck, G., Schubert, R., Eds.; Springer: Dordrecht, the Netherlands, 2001; pp. 161–171. [Google Scholar]
  21. Salvador, L.; Alía, R.; Agúndez, D.; Gil, L. Genetic variation and migration pathways of maritime pine (Pinus pinaster Ait) in the Iberian Peninsula. Theor. Appl. Genet. 2000, 100, 89–95. [Google Scholar] [CrossRef]
  22. González-Martínez, S.G.; Gil, L.; Alía, R. Genetic diversity estimates of Pinus pinaster in the Iberian Peninsula: A comparison of allozymes and quantitative traits. For. Syst. 2005, 14, 3–12. [Google Scholar] [CrossRef]
  23. Ramírez-Valiente, J.A.; Robledo-Arnuncio, J.J. Adaptive consequences of human-mediated introgression for indigenous tree species: The case of a relict Pinus pinaster population. Tree Physiol. 2014, 34, 1376–1387. [Google Scholar] [CrossRef] [PubMed]
  24. Unger, G.M.; Vendramin, G.G.; Robledo-Arnuncio, J.J. Estimating exotic gene flow into native pine stands: Zygotic vs. gametic components. Mol. Ecol. 2014, 23, 5435–5447. [Google Scholar] [CrossRef] [PubMed]
  25. Unger, G.M.; Heuertz, M.; Vendramin, G.G.; Robledo-Arnuncio, J.J. Assessing early fitness consequences of exotic gene flow in the wild: A field study with Iberian pine relicts. Evol. Appl. 2016, 9, 367–380. [Google Scholar] [CrossRef] [PubMed]
  26. Charco, J.; Perea, R.; Gil, L.; Nanos, N. Impact of deer rubbing on pine forests: Implications for conservation and management of Pinus pinaster populations. Eur. J. For. Res. 2016, 135, 719–729. [Google Scholar] [CrossRef]
  27. García-Rayego, J.L. Modelados de detalle en roquedos cuarcíticos de áreas de montaña media apalachense de la Meseta sur y Sierra Morena oriental. Ería 2006, 71, 269–282. [Google Scholar]
  28. Clark, J.S.; Silman, M.; Kern, R.; Macklin, E.; HilleRisLambers, J. Seed dispersal near and far: Patterns across temperate and tropical forests. Ecology 1999, 80, 1475–1494. [Google Scholar] [CrossRef]
  29. Nanos, N.; Larson, K.; Millerón, M.; Sjöstedt-deLuna, S. Inverse modeling for effective dispersal: Do we need tree size to estimate fecundity? Ecol. Model. 2010, 221, 2415–2424. [Google Scholar] [CrossRef]
  30. Dempster, A.P.; Laird, N.M.; Rubin, D.B. Maximum likelihood from incomplete data via EM algorithm. J. R. Stat. Soc. B 1977, 39, 1–38. [Google Scholar]
  31. R Development Core Team. 2008 R: A Language and Environment for Statistical Computing. R Foundation for Statistical Computing. Available online: http://www.R-project.org (accessed on 12 January 2017).
  32. Muller-Landau, H.C.; Wright, S.J.; Calderón, O.; Condit, R.; Hubbell, S.P. Interspecific variation in primary seed dispersal in a tropical forest. J. Ecol. 2008, 96, 653–667. [Google Scholar] [CrossRef]
  33. Burnham, K.P.; Anderson, D.R. Model Selection and Multimodel Inference: A Practical Information-Theoretic Approach, 2nd ed.; Springer: New York, NY, USA, 2002; p. 488. [Google Scholar]
  34. Janzen, D.H. Herbivores and the number of tree species in tropical forests. Am. Nat. 1970, 104, 501–528. [Google Scholar] [CrossRef]
  35. Tapias, R.; Gil, L.; Fuentes-Utrilla, P.; Pardos, J.A. Canopy seed banks in Mediterranean pines of south-eastern Spain: A comparison between Pinus halepensis Mill., P. pinaster Ait., P. nigra Arn. and P. pinea L. J. Ecol. 2001, 89, 629–638. [Google Scholar] [CrossRef]
  36. González-Martínez, S.C.; Burczyk, J.; Nathan, R.; Nanos, N.; Gil, L.; Alía, R. Effective gene dispersal and female reproductive success in Mediterranean maritime pine (Pinus pinaster Aiton). Mol. Ecol. 2006, 15, 4577–4588. [Google Scholar] [CrossRef] [PubMed]
  37. De Heredia, U.L.; Nanos, N.; García-del-Rey, E.; Guzmán, P.; López, R.; Venturas, M.; Gil, L. High seed dispersal ability of Pinus canariensis in stands of contrasting density inferred from genotypic data. For. Syst. 2015, 24, 015. [Google Scholar] [CrossRef]
  38. Millerón, M.; de Heredia, U.L.; Lorenzo, Z.; Perea, R.; Dounavi, A.; Alonso, J.; Nanos, N. Effect of canopy closure on pollen dispersal in a wind-pollinated species (Fagus sylvatica L.). Plant Ecol. 2012, 213, 1715–1728. [Google Scholar] [CrossRef]
  39. Millerón, M.; Lopez de Heredia, U.; Lorenzo, Z.; Alonso, J.; Dounavi, A.; Gil, L.; Nanos, N. Assessment of spatial discordance of primary and effective seed dispersal of European beech (Fagus sylvatica L.) by ecological and genetic methods. Mol. Ecol. 2013, 22, 1531–1545. [Google Scholar] [CrossRef] [PubMed]
  40. Juez, L.; González-Martínez, S.C.; Nanos, N.; de-Lucas, A.I.; Ordóñez, C.; del Peso, C.; Bravo, F. Can seed production and restricted dispersal limit recruitment in Pinus pinaster Aiton from the Spanish Northern Plateau? For. Ecol. Manag. 2014, 313, 329–339. [Google Scholar] [CrossRef]
  41. Thomson, F.J.; Moles, A.T.; Auld, T.D.; Kingsford, R.T. Seed dispersal distance is more strongly correlated with plant height than with seed mass. J. Ecol. 2011, 99, 1299–1307. [Google Scholar] [CrossRef]
  42. Sagnard, F.; Pichot, C.; Dreyfus, P.; Jordano, P.; Fady, B. Modelling seed dispersal to predict seedling recruitment: Recolonization dynamics in a plantation forest. Ecol. Model. 2007, 203, 464–474. [Google Scholar] [CrossRef]
Figure 1. Maps of the maritime pine population of Fuencaliente. (a) Location of adults and recruits in Stand 1 and (b) in Stand 2; (c) Location of Fuencaliente population within Spain; (d) Location of both stands in relation to each other.
Forests 08 00312 g001
Figure 2. Adult reproductive success estimated through the best model in each stand. The models using the spatial coordinate (north-south) as a proxy to fecundity (Yco model) is used in Stand 1 (upper panel). In Stand 2 (lower panel) the UF model is used to estimate fecundities. Bar heights represent the estimated number of recruits produced by each adult. Lines represent the estimated relative contribution of each adult (cumulative) to the total number of recruits in each stand.
Forests 08 00312 g002
Table 1. Alternative models for the fecundity term of the seed shadow model.
Type of ModelModel NameAbbr.FormulaNumber of Parameters
Stand 1Stand 2
Full modelUnrestricted FecundityUF S i 26844
Null modelMean fecundityMF   S ¯ 11
Tree size covariatesBasal areaBA S i = β × B a i 11
HeightH S i = β × h i 11
Cone number covariatesTotal conesTc S i = β × T c i 11
Open conesOc S i = β × O c i 11
Serotinous conesSc S i = β × S c i 11
Spatial covariatesX coordinate of adultXco S i = β × X c o i 11
Y coordinate of adultYco S i = β × Y c o i 11
S i : Fecundity of tree i;   S ¯ : average fecundity (over all trees of the stand); B a i : basal area; h i : tree height; T c i : total cones; O c i : number of open cones; S c i : Number of serotinous cones; X c o i and Y c o i : spatial coordinates of tree i and β a parameter.
Table 2. Descriptive statistics for adults and recruits of both stands.
Dbase (cm)DBH (cm)Height (m)Total Cones
St1St2St1St2St1St2St1St2
AdultsMin.5.77.60.00.00.51.21.01.0
1st Qu.16.518.98.813.13.53.55.03.8
Median23.227.417.219.85.05.817.011.5
Mean27.328.119.220.15.45.458.233.9
3rd Qu.35.735.528.727.57.06.867.552.0
Max.68.865.656.344.616.510.0587.0193.0
RecruitsMin.0.10.30.00.00.040.070.00.0
1st Qu.2.14.10.00.00.30.50.00.0
Median4.77.60.00.00.60.80.00.0
Mean5.77.70.50.30.80.80.00.0
3rd Qu.8.211.30.00.01.01.00.00.0
Max.34.331.519.011.16.64.30.00.0
St1: Stand 1; St2: Stand 2.
Table 3. Comparison statistics for different dispersal-and-fecundity models for the two stands (models are ordered, within each stand, according to smaller AICc).
ModelLn(L)AICc Δ k cor
Stand 1Yco−2753.75513.40.00.20
Tc−2762.55531.017.60.20
Sc−2764.15534.320.90.19
MF-null−2771.35548.735.30.18
BA−2823.45652.8Nc0.18
UF−2431.85749.5Nc0.30
H−2883.65773.2Nc0.15
Xco−2911.95829.8Nc0.16
Oc−2982.45970.8Nc0.16
Stand 2UF−546.21220.90.00.34
Yco−628.11262.341.40.22
Xco−642.01290.269.30.20
MF-null−642.81291.870.90.18
Tc−661.81329.8Nc0.18
Sc−663.81333.8Nc0.18
Oc−667.51341.1Nc0.17
BA−691.01388.1Nc0.11
H−692.01390.2Nc0.12
Ln(L): log-likelihood; AICc: Bias-corrected Akaike´s Information Criterion; Δk: Delta AIC (with respect to the model with smaller AICc); Nc: indicates that the corresponding model was not considered (models exhibiting an AICc larger than the MF model were not considered in comparisons); cor: correlation coefficient between observed and predicted counts in quadrats.
Table 4. Parameter estimates and average dispersal distances for the two stands and nine tested models (models are ordered according to increasing Δ k as in Table 3).
Model μ σ 2 β MedianMeanMode
Stand 1Yco2.661.020.0114.3024.055.05
Tc2.870.770.0417.6723.749.79
Sc2.950.780.0819.1125.9010.40
MF-null2.570.962.5813.0720.715.20
BA2.710.8635.33NcNcNc
UF2.260.87-NcNcNc
H2.720.990.00NcNcNc
Xco2.771.160.01NcNcNc
Oc4.251.450.14NcNcNc
Stand 2UF2.270.76-9.6912.945.43
Yco2.310.890.0210.0714.974.56
Xco2.320.920.00410.1815.544.36
MF-null2.320.913.3210.1815.404.45
Tc2.670.800.10NcNcNc
Sc2.670.800.24NcNcNc
Oc2.690.810.16NcNcNc
BA2.460.8644.50NcNcNc
H2.380.970.01NcNcNc
μ , σ 2 : Dispersal kernel parameters, β : parameter of the fecundity model; Nc: Not considered (average dispersal distances (median, mean and mode) are estimated only for models showing a Δ k smaller than the one for the null model of the corresponding stand.
Table 5. Descriptive statistics for estimated fecundities for adjusted models in two stands.
ModelAveMinMaxVarSum
Stand 1Yco2.60.14.30.9699
Tc2.50.0426.018.3692
Sc2.50.047.624.3693
MF-null2.52.52.50.0693
Stand 2UF3.20.036.863.1143
Yco3.32.54.50.3145
Xco3.32.54.00.2146
MF-null3.33.33.30.0146
Ave: Average fecundity; Max, Min: Maximum and minimum estimated fecundity; Sum: Summation of all the estimated fecundities in the stand; Var: Among-adults variance of the estimated fecundities. Note: Models are ordered according to increasing Δ k However, only models with Δ k larger than the null model are shown in each stand.

