Spatio-Temporal Linkages between Declining Arctic Sea-Ice Extent and Increasing Wildfire Activity in the Western United States

1
Carolina Tree-Ring Science Laboratory, Department of Geography, University of North Carolina Greensboro, Greensboro, NC 27412, USA
2
Appalachian Tree-Ring Laboratory, Department of Geography and Planning, Appalachian State University, Boone, NC 28608, USA
*
Author to whom correspondence should be addressed.
Forests 2017, 8(9), 313; https://doi.org/10.3390/f8090313
Submission received: 15 June 2017
/
Revised: 4 August 2017
/
Accepted: 23 August 2017
/
Published: 26 August 2017
(This article belongs to the Special Issue New Insights into Climate Sensitivity of Forest Growth, Health, and Disturbance: Vulnerability, Resilience, and Change)
Abstract
:We examined relationships between monthly Arctic sea-ice extent (ASIE) and annual wildfire activity for seven regions in the western United States during 1980–2015 to determine if spatio-temporal linkages exist between ASIE, upper-level flow, and surface climatic conditions conducive to western U.S. wildfire activity. Winter ASIE had significant (p < 0.05) negative relationships with annual wildfire area burned (rs = −0.391 − −0.683), with the strongest relationship occurring in the Northern Rockies. We explored spatial linkages between ASIE and 300-hPa flow (+), temperature (+), precipitation (−), and soil moisture (+) using monthly values of ASIE and gridded values for the climatic parameters. Relationships were best expressed between January ASIE and conditions in the current-year July over the Pacific Northwest and Northern Rockies. Reduced wintertime ASIE is teleconnected with increased ridging in summertime 300-hPa flow over the western U.S., resulting in warmer and drier conditions during peak fire season. Our findings suggest that reductions in ASIE are one of the driving forces behind the increasing annual trend (>36,000 ha) in area burned in the western U.S. since 1980.
1. Introduction
Arctic sea-ice extent (ASIE) during winter 2017 was the lowest recorded value since satellite records began in 1979 and monthly ASIE levels in the past year were consistently more than two standard deviations below the 1981–2010 average [1]. Accelerated warming in the Northern Hemisphere polar region, termed Arctic amplification [2] is concurrent with the rapid loss of Arctic sea-ice extent of approximately 11%/decade [3] and a 65% reduction in sea-ice thickness since 1975 [4]. In turn, ASIE and the strength of the polar vortex have been linked [5,6], with some of the most noticeable impacts experienced as anomalously cold winter conditions in the eastern North American mid-latitudes [2] and western North American anticyclogenesis [7,8]. However, warm-season impacts associated with increased meridionality and persistence also occur [9,10,11], including more frequent ridging (i.e., higher atmospheric pressure) over the Pacific Northwest and Northern Rockies regions of the coterminous U.S.
The relationships between ASIE, atmospheric flow patterns/modes of variation (e.g., North Atlantic Oscillation; NAO), and surface weather conditions are complex [12], and likely synergistic with other potential controls such as snow cover extent in Eurasia [13]. Our understanding of the processes is constantly evolving (e.g., [13,14]) with recent research suggesting that, among others, ASIE is potentially a controlling factor or interacts with (1) the Atlantic multidecadal oscillation (AMO; [14]); (2) the NAO [13,15]; (3) the western Pacific pattern (WP) and El Nino Southern Oscillation (ENSO; [15]); (4) declining summertime total kinetic energy and zonal flow [16]; (5) the Pacific Decadal Oscillation (PDO; [17]); (6) surface temperature extremes [10]; and (7) surface precipitation extremes [18,19]. An example of the evolution of our understanding of the linkages includes studies [13,20], which found that contrary to earlier work based on empirical data [2,5], model simulations show that lower levels of ASIE are associated with reductions in wintertime cold events in Northern Europe, not increases in these events. In summary, atmospheric perturbations associated with reduced ASIE tend to promote climatic extremes associated with enhanced variance of upper-level flow patterns. In western North America, persistent warm-season ridging results in a combination of extreme heat and drought, factors known to promote wildfire activity [21,22,23].
Marked increases in wildland fire activity and the cost associated with fire control during the past two decades [24] have been concurrent with declining ASIE, suggesting a potential interactive effect. During 1995–2015, costs associated with wildland fire as a percentage of the Forest Service’s annual budget increased from 16% to 52% and are projected to be 67% of the budget by 2025 [24]. Rising costs are attributed to (1) an increased fire-season length of 78 days relative to 1970 increasing the “frequency, size and severity of wildland fires”; (2) an increased Wildland–Urban Interface where higher density human populations and associated infrastructure require additional firefighting resources; and (3) ecosystem changes related to changing climatic conditions that have enhanced fire activity through an increased volume of fine fuels (p. 3 [24]). Increases in western U.S. fire season are largely attributed to warming spring and summer temperatures and snowmelt occurring earlier in spring [22,25] with a key factor being increased meridionality associated with Arctic amplification [2,26] driven by declining ASIE. Here, we examine the relationship between reduced sea-ice cover and increased wildfire activity for seven regions in the western U.S. Specifically, we hypothesize that a spatio-temporal linkage between ASIE and upper-level flow exists and modulates surface climatic conditions in the western U.S. that are favorable for enhanced wildfire activity.
2. Data and Methods
We obtained annual wildfire data (hectares burned) during 1980–2014 from the Federal Fire Occurrence website [27] and data for 2015 from the December 2015 National Incident Management Situation Report [28]. We grouped fire data by the seven Geographic Area Coordination Center (GACC) regions for the western U.S., which includes the Great Basin (GB), Northern California (NC), Northern Rockies (NR), Northwest (NW), Rocky Mountain (RM), Southern California (SC) and Southwest (SW) regions (Figure 1). Data for each region included all wildland fires on state and federal lands regardless of ignition source or fuel type.
We obtained monthly ASIE data during 1980–2015 from the National Snow and Ice Data Center [29]. ASIE data for the entire Arctic region were complete with the exception of December 1987 and January 1988. We also obtained monthly regional ASIE data during 1980–2015 for five of the ten regions identified by the Arctic Regional Ocean Observing system (Barents Sea; Greenland Sea; Baffin Bay; Bering Sea; East Siberian Sea; see [30] for regions). Data for the other five regions were not available during the early part of our study period and therefore were excluded from analysis.
We compared total and regional monthly ASIE (prior year December through current-year September) with annual wildfire activity by GACC region and all regions combined (hereafter “Combined”) during the common period of 1980–2015 using Spearman’s correlation as the wildfire data were non-normally distributed. We examined spatial pattern correlations over the region congruent with the seven GACC regions between ASIE and: (1) gridded 2.5 by 2.5 degree upper-level atmospheric flow (300-hPa) from the NCEP/NCAR Reanalysis 1 [31]; (2) ASIE and gridded 1.0 × 1.0 degree maximum and minimum temperature from Berkeley Earth [32]; (3) ASIE and gridded 0.25 × 0.25 degree precipitation from PRISM [33]; and (4) gridded 2.5 × 2.5 degree soil moisture from the NCEP/NCAR Reanalysis 1 [31] using KNMI Climate Explorer [34].
We calculated wildfire trends for each region and the Combined region using the Theil-Sen non-parametric trend slope and tested for significance using the Mann–Kendall test [35]. The Theil-Sen slope estimate is the median of all slopes between each set of data points and is minimally affected by the influence of outliers [36]. Thus, the test is particularly suitable when working with datasets that are characterized by considerable interannual variability such as extreme fire years (e.g., [23]). We also tested for possible temporal autocorrelation of the wildfire data using the Durbin–Watson test [37] and determined that residuals were not autocorrelated for either the GACC regions or the Combined region.
3. Results
Significant upward trends in area burned occurred for five regions (NR, NW NC, RM and SW) and the Combined region (Table 1, Figure 2). No significant trend existed for the SC and GB regions (Table 1, Figure 2). For the Combined region, the annual increase in area burned was 36,043 ha from 1980 to 2015 (Table 1) and was inversely related to wintertime ASIE.
The relationships between total ASIE and wildfire activity were consistently negative in all months examined, with the strongest relationships occurring in either prior-year December or current-year January for NW, NR, NC, GB, RM and Combined regions (Table 2). For the SC region and SW region, the strongest relationships occurred with April and June ASIE values, respectively (Table 2). The significant relationships between regional ASIE and wildfire activity are negative (Table 3). With three exceptions, relationships between regional ASIE and regional wildfire activity were weaker than those for total ASIE (Table 2, Table 3). The strongest relationships between wildfire activity and regional ASIE were most frequently found for the Greenland Sea, Barents Sea and East Siberia Sea regions.
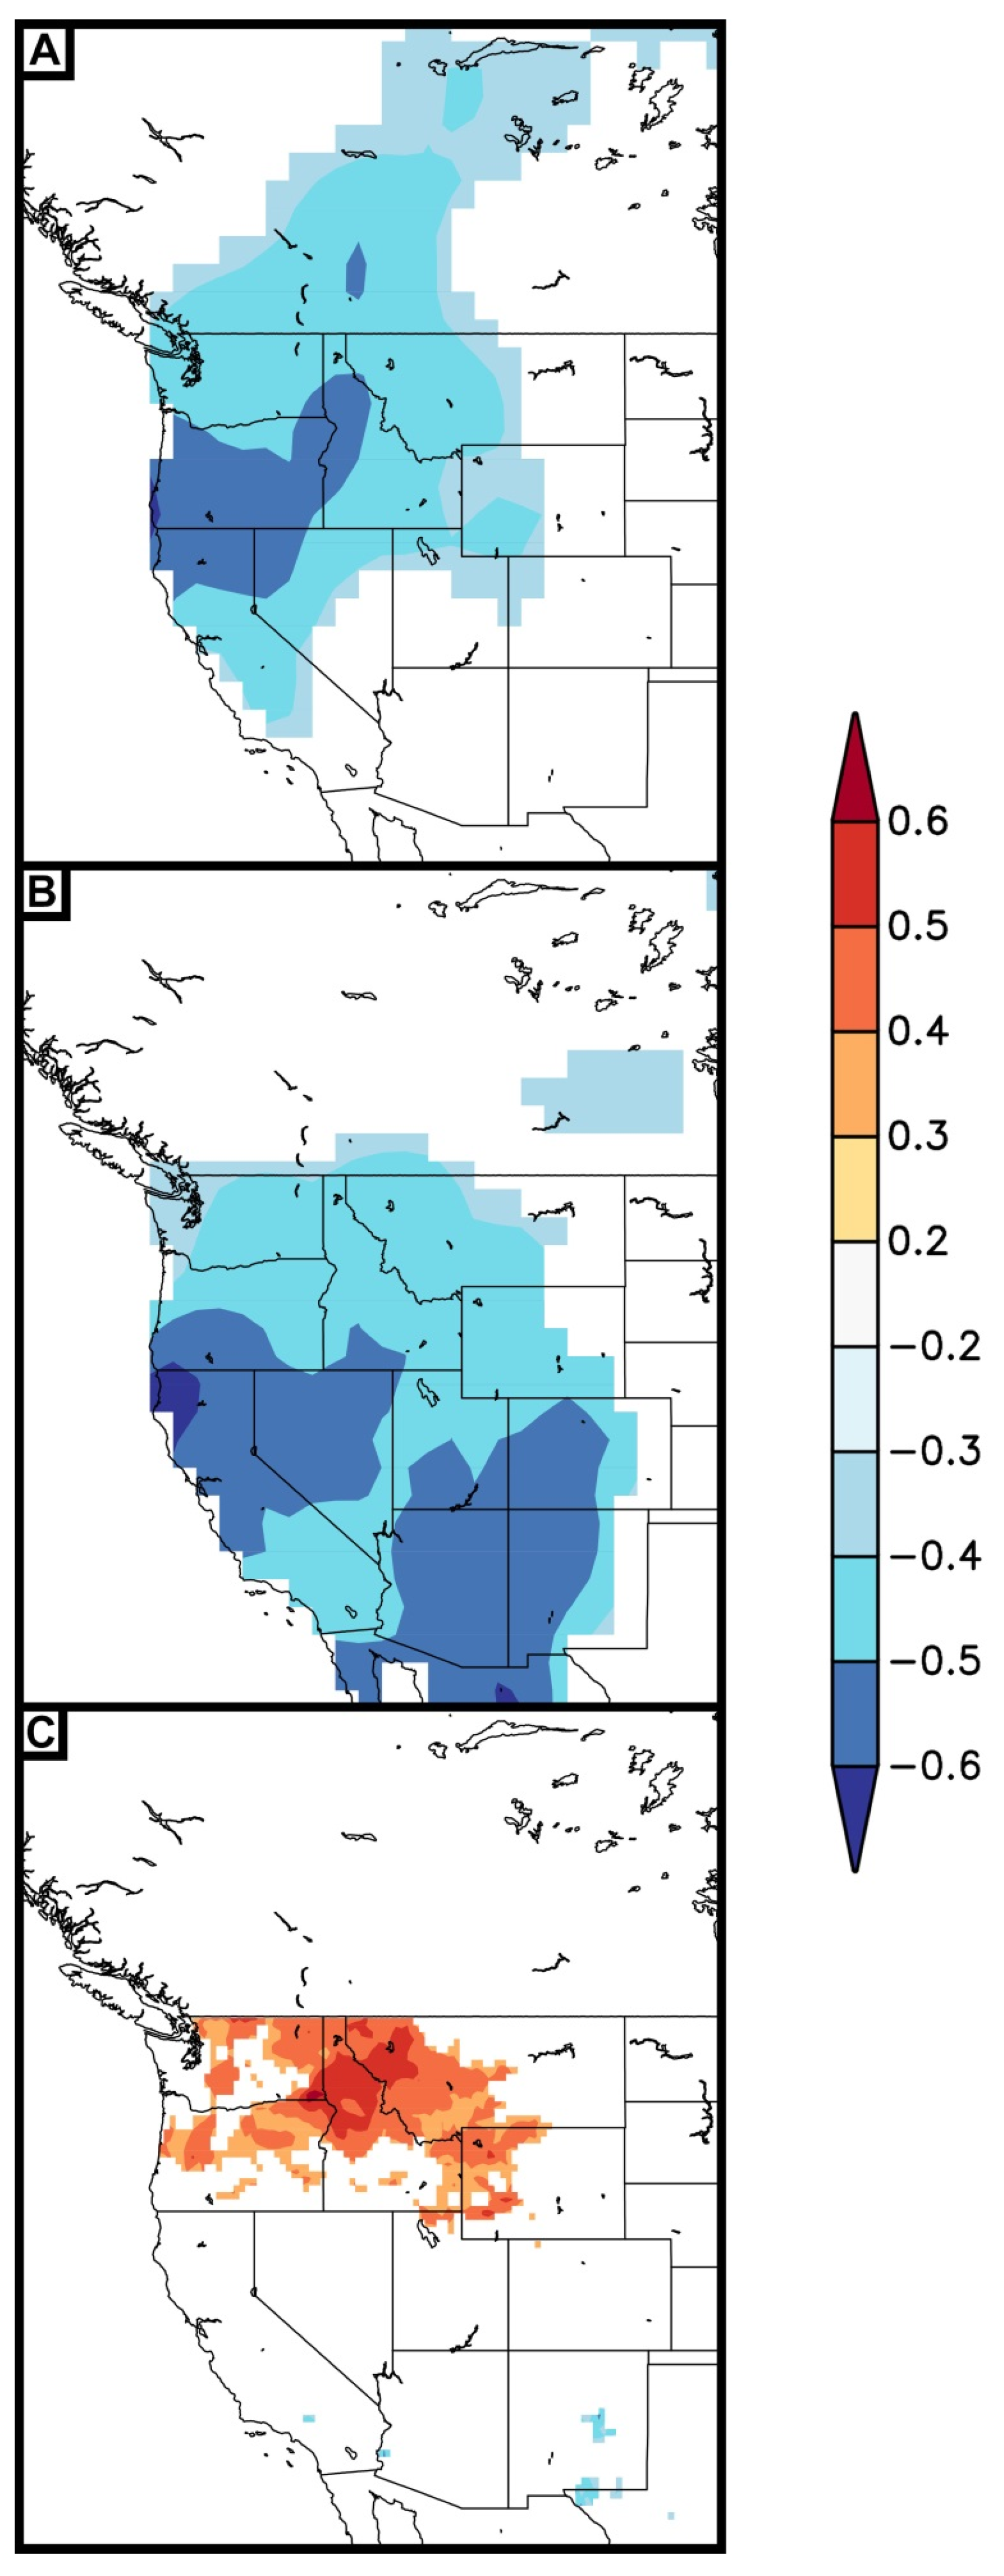
Relationships between winter ASIE with maximum temperature (Tmax), minimum temperature (Tmin), and precipitation were significant in the current-year summer months, with the strongest linkages between January ASIE and July surface climate conditions (Figure 3A–C). Significant negative relationships exist between January ASIE and July Tmax and July Tmin temperatures (Figure 3A,B) and are best expressed in the Pacific Northwest for Tmax. Relationships between January ASIE and Tmin were stronger and more geographically extensive (Figure 3B). Significant positive relationships exist between January ASIE and precipitation, with the strongest relationships centered in Idaho and Montana at 47° N and 115° W (Figure 3C).
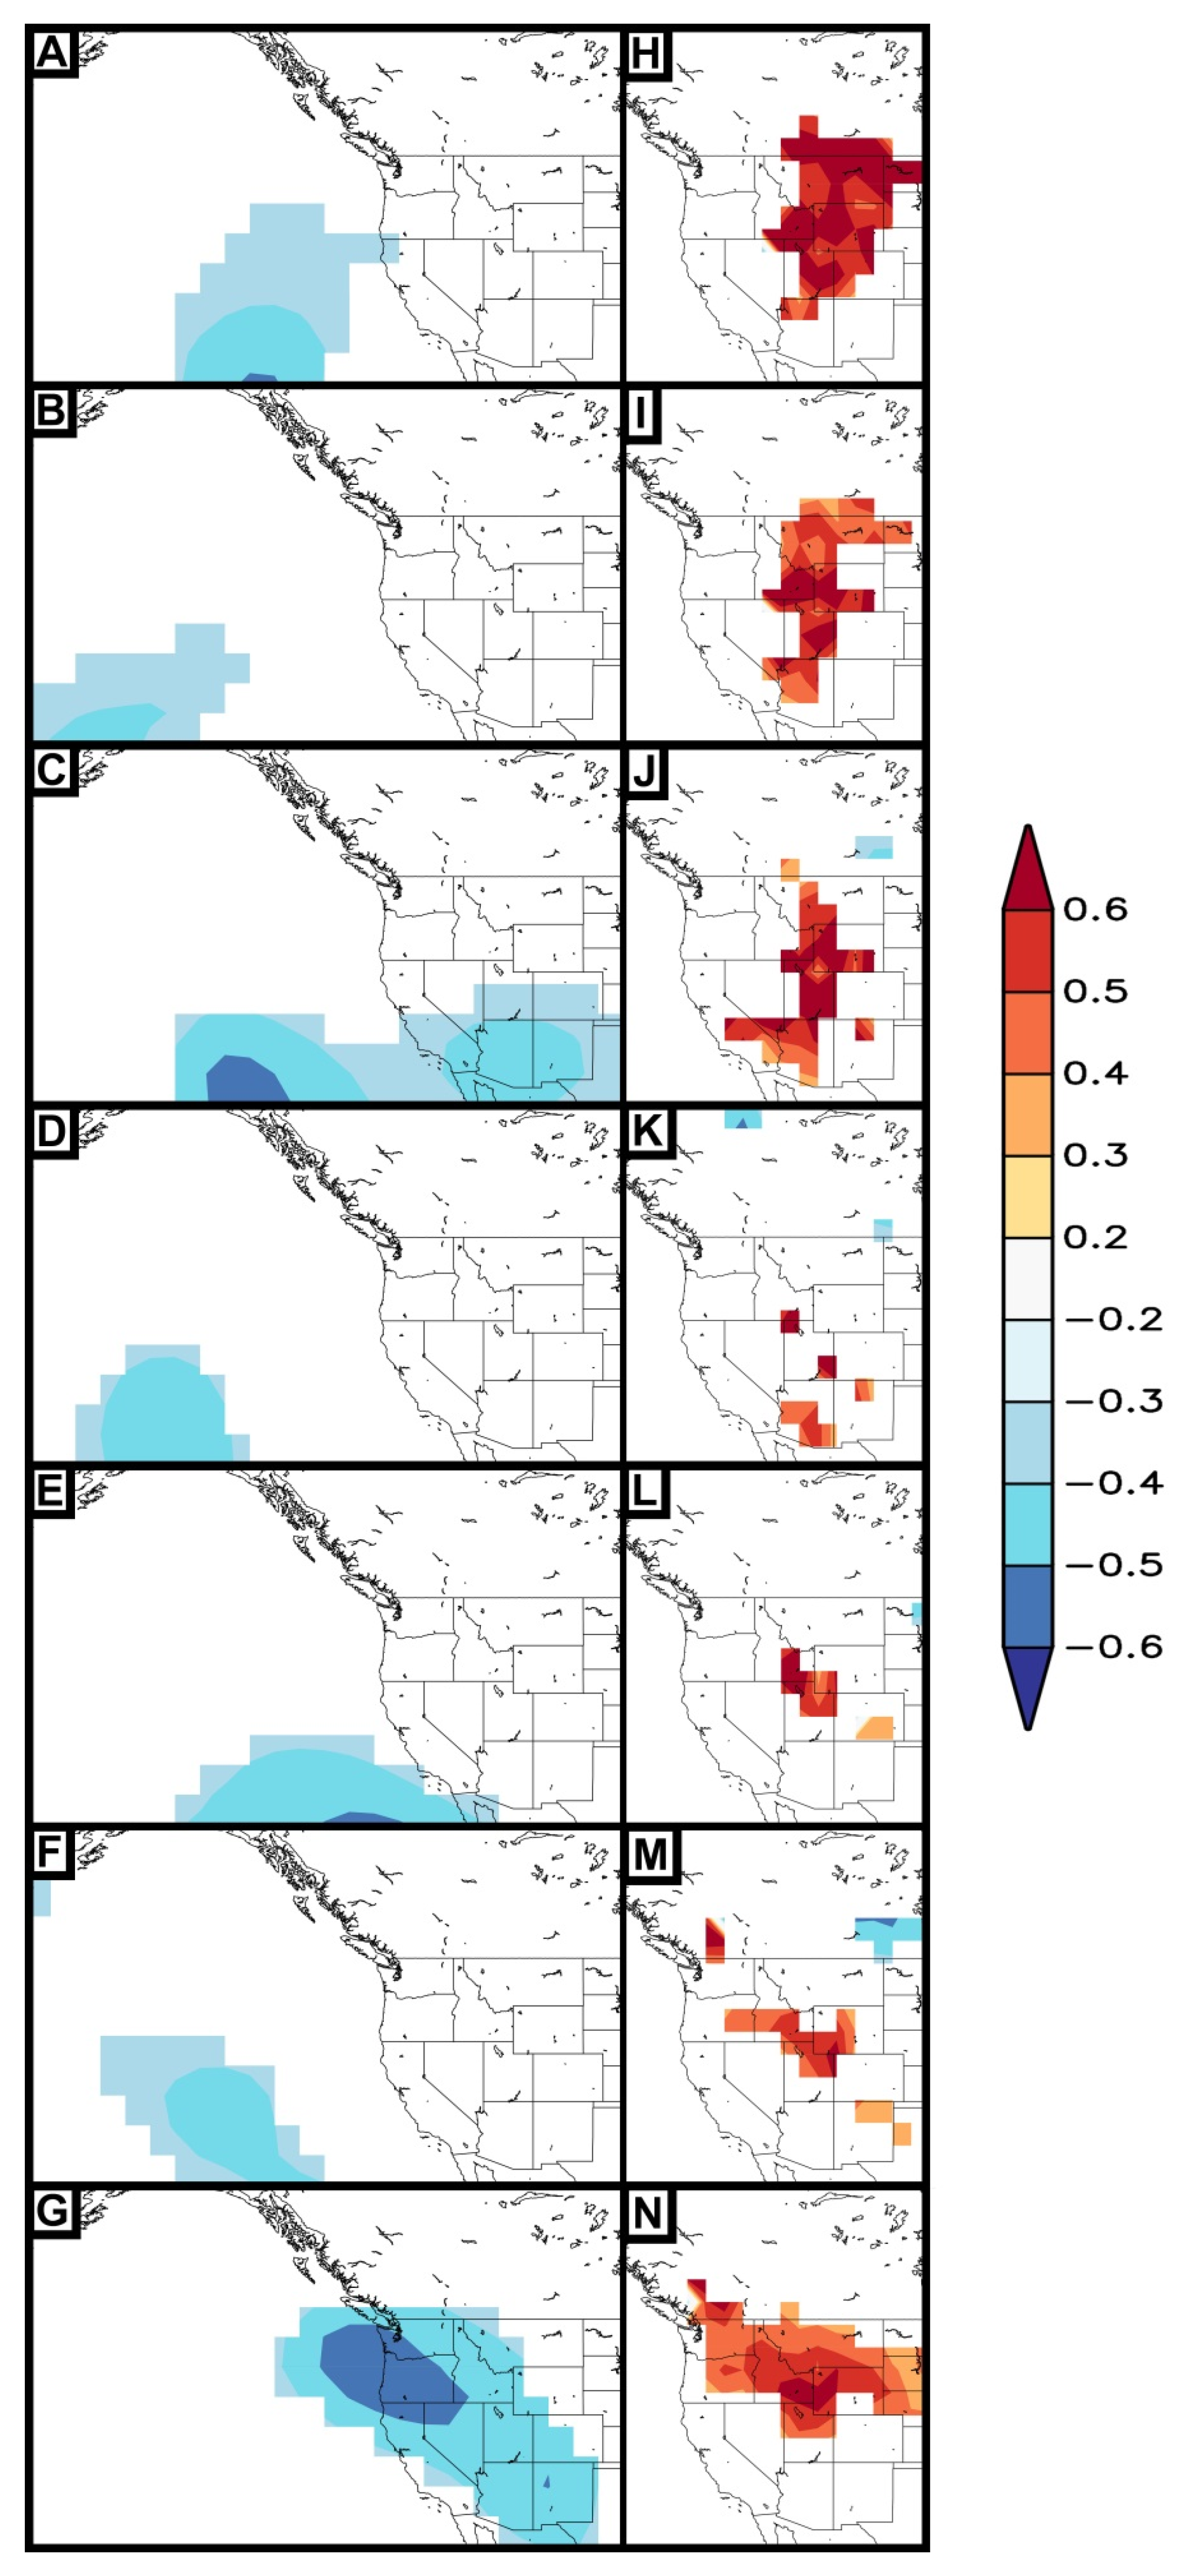
Relationships between January ASIE and 300-hPa geopotential heights were negative during January through July (Figure 4A–G) with the strongest correlations occurring principally in the eastern Pacific until July when the correlation pattern was best expressed over the Pacific Northwest. For soil moisture, significant positive relationships occurred along the axis of the Rocky Mountains during winter (January–March), weakened during the April and May snowmelt period, and re-strengthened during summer, particularly July (Figure 4H–N).
4. Discussion
Wildfire activity in the western U.S. has significantly increased for most regions during the past 36 years (Table 1, Figure 2) with a marked increase of years with consistently large area burned beginning in 1999. Mean area burned from 1999 to 2015 (1,846,667 ha) was 2.5 times greater than during 1980–1998 (737,167 ha), and all regions experienced similar inflection dates for increased fire activity. The increase in area burned is related to an increase in fire-season length [38,39,40] where fire season begins earlier and ends later. In the Northern Rockies, Knapp and Soulé [39] examined trends during 1900–2004 in the onset and frequency of major mid-latitude cyclones (MLC) during the latter half of summer, which coincides with peak fire season. They found that, beginning in the mid-1980s, the onset of MLCs—which reduce fire activity by bringing cooler temperatures and precipitation—occurred later, the frequency of MLCs significantly decreased, and these changes were coincident with greater wildfire activity. Similarly, Jolly et al. [40] found that fire-weather season length and annual area burned were positively related on a global scale, while Spracklen et al. [41] found the combination of May–October mean temperature and fuel moisture conditions accounted for 24%–57% of interannual variability in area burned in the western U.S.
Here, we posit a linkage between changes in ASIE, fire-season climatic conditions, and wildfire activity. In regions north of approximately 36° N, wintertime ASIE extent is strongly and consistently related to wildfire activity in the following summer (Table 2). Additionally, the relative contribution of specific ASIE regions varies among the GACC regions (Table 3). For example, Greenland Sea ASIE had the greatest influence during winter and Barents Sea ASIE during the summer, suggesting that the spatio-temporal patterning of ASIE, in addition to total ASIE, is related to western wildfire activity. Years with reduced wintertime ASIE extent create conditions responsible for the development of an upper-atmosphere ridge in the eastern Pacific and along the west coast of the coterminous U.S. (Figure 4G). In turn, subsidence beneath and on the eastern side of the ridge promotes warmer (Figure 3A,B) and drier conditions (Figure 3C) that are most pronounced for the NW, NR and RM regions, suggesting that wintertime ASIE may modulate summertime conditions.
Associations between January ASIE and soil moisture, and January ASIE and 300-hPa flow, are spatially congruent. We identified the following linkages: (1) low January ASIE years are concurrent with ridging over the east Pacific or western conterminous United States (Figure 4A–G); (2) the ridging leads to sinking air motions that promote dryness downslope (east) of the ridge (Figure 4H–N); and (3) these patterns weaken during April and May (coincident with snowmelt) and re-strengthen in mid-summer, particularly July (Figure 4G, N). Warmer and drier conditions that persist through the winter and spring promote earlier snowmelt and reductions in soil moisture in the early summer. In turn, these conditions allow for a mid-summer warm up through a reduction in evaporative cooling, setting up a positive feedback loop whereby reduced soil moisture promotes warmer and drier conditions favorable to higher 300-hPa heights.
Northern Hemisphere wintertime conditions may “remember” ASIE from the previous summer through a series of physical changes in the troposphere that weaken the polar jet stream [42]. Several studies have concluded that the Arctic amplification is resulting in increased meridionality and persistence in upper-level flow patterns that result in greater variance of surface weather conditions [2,9,43,44]. Similarly, Wu et al. (p. 5523 [45]) examined winter sea ice concentration (SIC) from Baffin Bay to eastern Newfoundland and found significant correlations between winter SIC anomalies and 500-hPa anomalies during the subsequent summer that acted as a “possible precursor for summer atmospheric circulation and rainfall anomalies over northern Eurasia”. Our results suggest that reduced wintertime ASIE years are coincident with and may promote summertime atmospheric conditions (i.e., ridging and subsidence) that enhance the likelihood of wildfire in the western U.S.
For North America, there are dramatic (65%) increases in the percentage of days experiencing amplified meridional flow during summer (JAS) in the most recent “Arctic amplification era” (post- AD 2000) (p. 11 [9]). Petrie et al. [44] found linkages between decreasing ASIE and amplified upper-level flow during summer (JJA), and Gedalof et al. (p. 159 [46]) identified a linkage between 500-hPa blocking events in summer and large increases in wildfire activity in the northwestern U.S., noting that upstream ridging “would divert storm tracks out of the region and reduce relative humidity.” Soil moisture variability in the western U.S. also may express a memory component as average winter (DJF) temperatures are linked to soil moisture conditions in the following spring [47] or summer. Similarly, our results (Figure 4A–N) suggest that upper-atmosphere flow, and, subsequently, surface climatic conditions that promote wildfire are synergistically teleconnected to winter ASIE.
Regions south of 36° N (SC and SW) had stronger relationships with ASIE in the late spring/early summer, but major differences in the extent of association with ASIE. For the SW region, peak fire season is in early summer and then diminishes mid-way through the July–August monsoon season [38]. We found the strongest relationship between ASIE and wildfire activity occurs in June in the SW region (Table 2 and Table 3). For the SC region, the lack of a strong signal suggests little meaningful connection with ASIE fluctuations, but plant communities in this region have been substantively modified by human activities, there is limited forest cover, and peak fire season occurs in late summer/early fall [38]. Further, the mean latitude of both the SW and SC regions makes them less likely to be impacted by changes in summertime 300-hPa meridionality relative to the PNW and NR regions.
The linkage between ASIE on wildfire activity throughout most of the GACC regions is stronger than other climate teleconnections that have been examined for the western U.S. The influence of El Niño–Southern Oscillation (ENSO) and/or the Pacific Decadal Oscillation (PDO) to drought and subsequent wildfire activity has been documented throughout much of the southwestern [48,49,50] and northwestern U.S. [51,52,53]. In the Pacific Northwest (PNW) and northern Rockies regions, ENSO is not significantly correlated with wildfire [46,54,55] although warm-phase PDO conditions are weakly, but positively related to wildfire activity in the PNW [46,51] and regional fire years in the northern Rockies [56]. Conversely, the interactive effects of the PDO phase with ENSO events may increase wildfire activity [21], although the combination of phases promoting more fires varies regionally with the strongest relationships in the southern Rocky Mountains [54]. Further, the influence of the Atlantic Multidecadal Oscillation (AMO) has been shown to modulate the strength and spatial patterning of ENSO and PDO effects on wildfire in western North America [57]. While many of the above-described atmospheric modes of variation also have been linked to increasing wildfire activity in the western United States [21,54,57,58,59,60], caution must be taken when establishing direct causal linkages between declining ASIE and increasing wildfire activity through correlative analyses. In short, low (high) levels of ASIE perturb atmospheric flow through interactions with latitudinal temperature gradients, which in turn can impact atmospheric thickness, zonal (meridional) flow patterns [12,16] and surface climatic conditions associated with both wildfire and specific modes of variation [21].
While we find a strong relationship between ASIE and wildfire (Table 2 and Table 3) throughout the western U.S., it is implicit in our findings that this relationship is not direct, but rather operates through synergistic and complex atmospheric teleconnections that ultimately lead to surface weather conditions conducive for wildfire. For example, in describing how low ASIE levels appear to be a significant factor in the promotion of negative NAO conditions, Screen (p. 7 [13]) highlights the potential importance of “co-varying atmospheric variability” as a cause of cooling in Europe. Similarly, future work linking ASIE and western US wildfire activity should explore potential driving forces such as snow cover extent in Eurasia [13], sea surface temperature anomalies in the Atlantic and Pacific [45], and the interplay between ASIE and atmospheric modes of variability [12,61].
During the past century, anthropogenic activity has suppressed wildfire activity below what would be expected given climate conditions, creating a “fire deficit” (p. E535 [62]). Thus, recent large fires during the past two decades may be a response towards equilibrium [62]. The considerable plant community heterogeneity of the selected regions increases the likelihood that multiple climate/fire responses exist within a single region [63,64], yet we are assessing the regions as homogeneous units. While the effect of human modification varies significantly between forest types (e.g., [65]), Westerling et al. [22] found that the largest increase in wildfire activity in the western U.S. in the late 20th century occurred in the relatively undisturbed mesic mid- to high-elevation forest types (e.g., spruce–fir–lodgepole pine forests) that dominate the northern Rocky Mountains. Fire regimes in these forests have experienced minimal anthropogenic influence [66] as: (1) the duration of fire-suppression activities is a fraction of historic fire-free intervals; and (2) the intense fires that typically occur in these environments cannot be suppressed easily if at all. Yet, we found the strongest relationship between ASIE and wildfire in the Northern Rockies region.
Considerable debate remains about the effects of Arctic warming on midlatitude weather [13,67]. Thus, it is possible that the relationship between winter ASIE and fire activity in the western U.S. may be modulated by high-latitude (or other) controls we have not examined that also are temporally consistent with the reductions in ice cover observed since 1980. Further, our analysis is geographically constrained by the spatial limitations of the (1) GACC regions, which are designed for organizational purposes and are not ecoregions defined by either biogeographic or climatic homogeneity; and (2) scaling of the KNMI Climate Explorer data [34] based on either 1° × 1° or 2.5° × 2.5° latitude/longitudinal grids. However, the spatio-temporal connections between upper-level flow, surface temperature, precipitation, and soil moisture conditions support our hypothesized linkages to increased western U.S. wildfire activity and decreasing ASIE.
5. Conclusions
We have identified a new and potentially substantive connection between decreasing ASIE and increasing wildfire activity in the western U.S. during 1980–2015, which if operative represents the strongest multi-region-wide climate teleconnection (cf. ENSO and PDO) examined for the western U.S. Understanding the linkages between Arctic amplification and enhanced meridionality of mid-latitude upper-level atmospheric flow remains uncertain and may express strong regional, seasonal and interannual variability [68]. Here, our findings suggest a broad-scale teleconnective feature related to ASIE that indirectly modulates wildfire activity with evidence that summertime 300-hPa flow is influenced by prior-winter ASIE. Specifically, we identify a temporally consistent response between wintertime ASIE and increased 300-hPa ridging, higher temperatures, and drier conditions during fire season that are congruent with conditions favorable for increased wildfire activity.
A better understanding of the possible atmospheric teleconnections related to ASIE is needed to improve future projections of climatic control of western U.S wildfire activity, specifically the increasing meridionality of 300-hPa circulation. Given the recent trajectories for declining ASIE, model projections for increased fire potential in the U.S. under a changing climate [69], and recent large increases in the costs of managing U.S. wildfire activity [24], it is likely that fire management activities and the associated costs will continue to rise in the coming decades. Future research may benefit from the addition of finer-resolution fire and climate data allowing for a more precise geographical analysis of the areas that are most vulnerable to changing climatic conditions associated with decreasing ASIE.
Acknowledgments
We thank Justin Maxwell and Chip Konrad for their constructive comments on an earlier version of this manuscript. We thank Justin Maxwell for the construction of figure one and Thomas Patterson for his assistance with the construction of figures three and four. We also thank the three anonymous reviewers and the editor, Glenn Juday, for their suggestions.
Author Contributions
Paul Knapp and Peter Soule’ conceived and designed the experiments, performed the experiments, analyzed the data and wrote the paper.
Conflicts of Interest
The authors declare no conflicts of interest.
References
- National Snow and Ice Data Center (NSIDC). Available online: http://nsidc.org/arcticseaicenews (accessed on 1 June 2017).
- Cohen, J.; Screen, J.A.; Furtado, J.C.; Barlow, M.; Whittleston, D.; Coumou, D.; Francis, J.; Dethloff, K.; Entekhabi, D.; Overland, J.; et al. Recent Arctic amplification and extreme mid-latitude weather. Nat. Geosci. 2014, 7, 627–637. [Google Scholar] [CrossRef] [Green Version]
- Polyak, L.; Alley, R.B.; Andrews, J.T.; Brigham-Grette, J.; Cronin, T.M.; Darby, D.A.; Dyke, A.S.; Fitzpatrick, J.J.; Funder, S.; Holland, M.; et al. History of sea-ice in the Arctic. Quat. Sci. Rev. 2010, 29, 1757–1778. [Google Scholar] [CrossRef]
- Lindsay, R.; Schweiger, A. Arctic sea ice thickness loss determined using subsurface, aircraft, and satellite observations. Cryosphere 2015, 9, 269–283. [Google Scholar] [CrossRef]
- Kim, B.-M.; Son, S.-W.; Min, S.-K.; Jeong, J.-H.; Kim, S.-J.; Zhang, X.; Shim, T.; Yoon, J.-H. Weakening of the stratospheric polar vortex by Arctic sea-ice loss. Nat. Commun. 2014, 5, 4646. [Google Scholar] [CrossRef] [PubMed]
- Kug, J.S.; Jeong, J.H.; Jang, Y.S.; Kim, B.M.; Folland, C.K.; Min, S.K.; Son, S.W. Two distinct influences of Arctic warming on cold winters over North America and East Asia. Nat. Geosci. 2015, 8, 759–762. [Google Scholar] [CrossRef]
- Tang, Q.; Zhang, X.; Yang, X.; Francis, J.A. Cold winter extremes in northern continents linked to Arctic sea-ice loss. Environ. Res. Lett. 2013. [Google Scholar] [CrossRef]
- Swain, D.L. A tale of two California droughts: Lessons amidst record warmth and dryness in a region of complex physical and human geography. Geophys. Res. Lett. 2015, 42, 9999–10003. [Google Scholar] [CrossRef]
- Francis, J.A.; Vavrus, S.J. Evidence for a wavier jet stream in response to rapid Arctic warming. Environ. Res. Lett. 2015, 10, 014005. [Google Scholar] [CrossRef]
- Budikova, D.; Chechi, L. Arctic sea ice and warm season North American extreme surface air temperatures. Clim. Res. 2016, 67, 15–29. [Google Scholar] [CrossRef]
- Hall, R.J.; Jones, J.M.; Hanna, E.; Scaife, A.A.; Erdélyi, R. Drivers and potential predictability of summer time North Atlantic polar front jet variability. Clim. Dynam. 2017, 48, 3869–3887. [Google Scholar] [CrossRef]
- Vihma, T. Effects of Arctic sea ice decline on weather and climate: A review. Surv. Geophys. 2014, 35, 1175–1214. [Google Scholar] [CrossRef]
- Screen, J.A. The missing Northern European winter cooling response to Arctic sea ice loss. Nat. Commun. 2017, 8, 14603. [Google Scholar] [CrossRef] [PubMed]
- Osborne, J.M.; Screen, J.A.; Collins, M. Ocean-atmosphere state dependence of the atmospheric response to Arctic sea ice loss. J. Clim. 2017, 30, 1537–1552. [Google Scholar] [CrossRef]
- Oshika, M.; Tachibana, Y.; Nakamura, T. Impact of the winter North Atlantic Oscillation (NAO) on the Western Pacific (WP) pattern in the following winter through Arctic sea ice and ENSO: Part I—Observational evidence. Clim. Dyn. 2015, 45, 1355–1366. [Google Scholar] [CrossRef]
- Coumou, D.; Lehmann, J.; Beckmann, J. The weakening summer circulation in the Northern Hemisphere mid-latitudes. Science 2015, 348, 324–327. [Google Scholar] [CrossRef] [PubMed]
- Screen, J.A.; Francis, J.A. Contribution of Sea-Ice Loss to Arctic Amplification is Regulated by Pacific Ocean Decadal Variability. 2016. Available online: https://ore.exeter.ac.uk/repository/handle/10871/20995 (accessed on 15 May 2017).
- Budikova, D.; Ford, T.W.; Ballinger, T.J. Connections between north-central United States summer hydroclimatology and Arctic sea ice variability. Int. J. Climatol. 2017. [Google Scholar] [CrossRef]
- Wu, B.; Zhang, R.; Wang, B.; D’Arrigo, R. On the association between spring Arctic sea ice concentration and Chinese summer rainfall. Geophys. Res. Lett. 2009. [Google Scholar] [CrossRef]
- Screen, J.A.; Deser, C.; Sun, L. Reduced risk of North American cold extremes due to continued Arctic sea ice loss. Bull. Am. Meteorol. Soc. 2015, 96, 1489–1503. [Google Scholar] [CrossRef]
- Westerling, A.L.; Swetnam, T.W. Interannual to decadal drought and wildfire in the western United States. EOS Trans. AGU 2003, 84, 545–555. [Google Scholar] [CrossRef]
- Westerling, A.L.; Hidalgo, H.G.; Cayan, D.R.; Swetnam, T.W. Warming and earlier spring increase western US forest wildfire activity. Science 2006, 313, 940–943. [Google Scholar] [CrossRef] [PubMed]
- Dennison, P.E.; Brewer, S.C.; Arnold, J.D.; Moritz, M.A. Large wildfire trends in the western United States, 1984–2011. Geophys. Res. Lett. 2014, 41, 2928–2933. [Google Scholar] [CrossRef]
- United States Department of Agriculture (USDA). The Rising Cost of Wildfire Operations: Effects on the Forest Service’s Non-Fire Work. 2015. Available online: http://www.google.com/url?sa=t&rct=j&q=&esrc=s&source=web&cd=1&ved=0ahUKEwio7YnF0N_NAhXKbj4KHYK_A8wQFggcMAA&url=http%3A%2F%2Fwww.fs.fed.us%2Fsites%2Fdefault%2Ffiles%2F2015-Fire-Budget-Report.pdf&usg=AFQjCNFldr8E5eakl5fxli4WIwKKYD7DQg&bvm=bv.126130881,d.cWw (accessed on 4 April 2016).
- Westerling, A.L. Increasing western US forest wildfire activity: Sensitivity to changes in the timing of spring. Phil. Trans. R. Soc. B 2016, 371. [Google Scholar] [CrossRef] [PubMed]
- Francis, J.A.; Vavrus, S.J. Evidence linking Arctic amplification to extreme weather in mid-latitudes. Geophys. Res. Lett. 2012, 39. [Google Scholar] [CrossRef]
- Federal Fire Occurrence. Available online: http://wildfire.cr.usgs.gov/firehistory/data.html (accessed on 15 January 2016).
- National Incident Management Situation Report. Available online: http://gacc.nifc.gov/nwcc/predict/intelligence.aspx (accessed 15 January 2016).
- Fetterer, F.; Knowles, K.; Meier, W.; Savoie, M. Sea-Ice Index. 2002. Available online: http://nsidc.org/data/g02135 (accessed on 15 January 2016).
- Arctic Regional Observing System. Available online: http://arctic-roos.org/observations/sea-ice-variability-in-regions (accessed on 8 June 2017).
- Kalnay, E.; Kanamitsu, M.; Kistler, R.; Collins, W.; Deaven, D.; Gandin, L.; Iredell, M.; Saha, S.; White, G.; Woollen, J.; et al. The NCEP/NCAR 40-year reanalysis project. Bull. Am. Meteorol. Soc. 1996, 77, 437–471. [Google Scholar] [CrossRef]
- Berkeley Earth. Available online: Berkeleyearth.org/ (accessed on 3 June 2017).
- PRISM. PRISM Climate Group, Oregon State University. 2004. Available online: http://prism.oregonstate.edu (accessed on 6 June 2016).
- Trouet, V.; Van Oldenborgh, G.J. KNMI Climate Explorer: A web-based research tool for high-resolution paleoclimatology. Tree Ring Res. 2013, 69, 3–13. [Google Scholar] [CrossRef]
- Sen, P.K. Estimates of the regression coefficient based on Kendall’s tau. J. Am. Stat. Assoc. 1968, 63, 1379–1389. [Google Scholar] [CrossRef]
- Wilcox, R.R.; Keselman, H.J. Modern regression methods that can substantially increase power and provide a more accurate understanding of associations. Eur. J. Pers. 2012, 26, 165–174. [Google Scholar] [CrossRef] [PubMed]
- Durbin, J.; Watson, G.S. Testing for serial correlation in least squares regression, II. Biometrika 1951, 38, 159–179. [Google Scholar] [CrossRef] [PubMed]
- Westerling, A.L.; Gershunov, A.; Brown, T.J.; Cayan, D.R.; Dettinger, M.D. Climate and wildfire in the western United States. Bull. Am. Met. Soc. 2003, 84, 595–604. [Google Scholar] [CrossRef]
- Knapp, P.A.; Soulé, P.T. Trends in midlatitude cyclone frequency and occurrence during fire season in the Northern Rockies: 1900–2004. Geophys. Res. Lett. 2007. [Google Scholar] [CrossRef]
- Jolly, W.M.; Cochrane, M.A.; Freeborn, P.H.; Holden, Z.A.; Brown, T.J.; Williamson, G.J.; Bowman, D.M. Climate-induced variations in global wildfire danger from 1979 to 2013. Nat. Commun. 2015, 6, 7537. [Google Scholar] [CrossRef] [PubMed]
- Spracklen, D.V.; Mickley, L.J.; Logan, J.A.; Hudman, R.C.; Yevich, R.; Flannigan, M.D.; Westerling, A.L. Impacts of climate change from 2000 to 2050 on wildfire activity and carbonaceous aerosol concentrations in the western United States. J. Geophys. Res. Atmos. 2009. [Google Scholar] [CrossRef]
- Francis, J.A.; Chan, W.; Leathers, D.J.; Miller, J.R.; Veron, D.E. Winter Northern Hemisphere weather patterns remember summer Arctic sea-ice extent. Geophys. Res. Lett. 2009, 36. [Google Scholar] [CrossRef]
- Screen, J.A.; Simmonds, I. Exploring links between Arctic amplification and mid-latitude weather. Geophys. Res. Lett. 2013, 40, 959–964. [Google Scholar] [CrossRef] [Green Version]
- Petrie, R.E.; Shaffrey, L.C.; Sutton, R.T. Atmospheric response in summer linked to recent Arctic sea-ice loss. Q. J. R. Meteorol. Soc. 2015, 141, 2070–2076. [Google Scholar] [CrossRef]
- Wu, B.; Zhang, R.; D'Arrigo, R.; Su, J. On the relationship between winter sea ice and summer atmospheric circulation over Eurasia. J. Clim. 2013, 26, 5523–5536. [Google Scholar] [CrossRef]
- Gedalof, Z.; Peterson, D.L.; Mantua, N.J. Atmospheric, climatic, and ecological controls on extreme wildfire years in the northwest United States. Ecol. Appl. 2005, 15, 154–174. [Google Scholar] [CrossRef]
- Hamlet, A.F.; Mote, P.W.; Clark, M.P.; Lettenmaier, D.P. Twentieth-century trends in runoff, evapotranspiration, and soil moisture in the western United States. J. Clim. 2007, 20, 1468–1486. [Google Scholar] [CrossRef]
- Swetnam, T.W.; Betancourt, J.L. Fire-southern oscillation relations in the southwestern United States. Science 1990, 249, 1017–1249. [Google Scholar] [CrossRef] [PubMed]
- Swetnam, T.W.; Betancourt, J.L. Mesoscale disturbance and ecological response to decadal climatic variability in the American southwest. J. Clim. 1998, 11, 3128–3147. [Google Scholar] [CrossRef]
- Taylor, A.H.; Beaty, R.M. Climatic influences on fire regimes in the northern Sierra Nevada Mountains, Lake Tahoe Basin, Nevada, USA. J. Biogeogr. 2005, 32, 425–438. [Google Scholar] [CrossRef]
- Hessl, A.; McKenzie, D.; Schellhaas, R. Drought and Pacific Decadal Oscillation linked to fire occurrence in the Inland Pacific Northwest. Ecol. Appl. 2004, 14, 425–442. [Google Scholar] [CrossRef]
- Heyerdahl, E.K.; Brubaker, L.B.; Agee, J.K. Annual and decadal climate forcing of historical fire regimes in the interior Pacific Northwest, USA. Holocene 2002, 12, 597–604. [Google Scholar] [CrossRef]
- Heyerdahl, E.K.; McKenzie, D.; Daniels, L.D.; Hessl, A.E.; Littell, J.S.; Mantua, N.J. Climate drivers of regionally synchronous fires in the inland northwest (1651–1900). Int. J. Wildland Fire 2008, 17, 40–49. [Google Scholar] [CrossRef]
- Schoennagel, T.; Veblen, T.T.; Romme, W.H.; Sibold, J.S.; Cook, E.R. ENSO and PDO variability affect drought-induced fire occurrence in Rocky Mountain subalpine forests. Ecol. Appl. 2005, 15, 2000–2014. [Google Scholar] [CrossRef]
- Gedalof, Z. Climate and spatial patterns of wildfire in North America. In The Landscape Ecology of Fire; Springer: Dordrecht, The Netherlands, 2011; pp. 89–115. [Google Scholar]
- Morgan, P.; Heyerdahl, E.K.; Gibson, C.E. Multi-season climate synchronized forest fires throughout the 20th century, northern Rockies, USA. Ecology 2008, 89, 717–728. [Google Scholar] [CrossRef] [PubMed]
- Kitzberger, T.; Brown, P.M.; Heyerdahl, E.K.; Swetnam, T.W.; Veblen, T.T. Contingent Pacific–Atlantic Ocean influence on multicentury wildfire synchrony over western North America. Proc. Natl. Acad. Sci. USA 2007, 104, 543–548. [Google Scholar] [CrossRef] [PubMed]
- Fauria, M.M.; Johnson, E.A. Climate and wildfires in the North American boreal forest. Philos. Trans. R. Soc. Lond. B Biol. Sci. 2008, 363, 2315–2327. [Google Scholar] [CrossRef] [PubMed]
- Barbero, R.; Abatzoglou, J.T.; Brown, T.J. Seasonal reversal of the influence of El Niño–Southern Oscillation on very large wildfire occurrence in the interior northwestern United States. Geophys. Res. Lett. 2015, 42, 3538–3545. [Google Scholar] [CrossRef]
- West, A.M.; Kumar, S.; Jarnevich, C.S. Regional modeling of large wildfires under current and potential future climates in Colorado and Wyoming, USA. Clim. Change 2016, 134, 565–577. [Google Scholar] [CrossRef]
- Balmaseda, M.A.; Ferranti, L.; Molteni, F.; Palmer, T.N. Impact of 2007 and 2008 Arctic ice anomalies on the atmospheric circulation: Implications for long-range predictions. Q. J. R. Meteorol. Soc. 2010, 136, 1655–1664. [Google Scholar] [CrossRef]
- Marlon, J.R.; Bartlein, P.J.; Gavin, D.G.; Long, C.J.; Anderson, R.S.; Briles, C.E.; Brown, K.J.; Colombaroli, D.; Hallett, D.J.; Power, M.J.; et al. Long-term perspective on wildfires in the western USA. Proc. Natl. Acad. Sci. USA 2012, 109, E535–E543. [Google Scholar] [CrossRef] [PubMed]
- Girardin, M.P.; Ali, A.A.; Carcaillet, C.; Mudelsee, M.; Drobyshev, I.; Hely, C.; Bergeron, Y. Heterogeneous response of circumboreal wildfire risk to climate change since the early 1900s. Global Change Biol. 2009, 15, 2751–2769. [Google Scholar] [CrossRef]
- Parisien, M.A.; Snetsinger, S.; Greenberg, J.A.; Nelson, C.R.; Schoennagel, T.; Dobrowski, S.Z.; Moritz, M.A. Spatial variability in wildfire probability across the western United States. Int. J. Wildland Fire, 2013, 21, 313–327. [Google Scholar] [CrossRef]
- Mallek, C.; Safford, H.; Viers, J.; Miller, J. Modern departures in fire severity and area vary by forest type, Sierra Nevada and southern Cascades, California, USA. Ecosphere 2013, 4, 1–28. [Google Scholar] [CrossRef]
- Schoennagel, T.; Veblen, T.T.; Romme, W.H. The interaction of fire, fuels, and climate across Rocky Mountain forests. Bioscience 2004, 54, 661–676. [Google Scholar] [CrossRef]
- Screen, J.A. Far-flung effects of Arctic warming. Nat. Geosci. 2017, 10, 253–254. [Google Scholar] [CrossRef]
- Overland, J.; Francis, J.A.; Hall, R.; Hanna, E.; Kim, S.-J.; Vihma, T. The melting Arctic and midlatitude weather patterns: Are they connected? J. Clim. 2015, 28, 7917–7932. [Google Scholar] [CrossRef]
- Liu, Y.; Goodrick, S.L.; Stanturf, J.A. Future US wildfire potential trends projected using a dynamically downscaled climate change scenario. For. Ecol. Manag. 2013, 294, 120–135. [Google Scholar] [CrossRef]
Figure 1.
Geographic Area Coordination Center (GACC) regions.
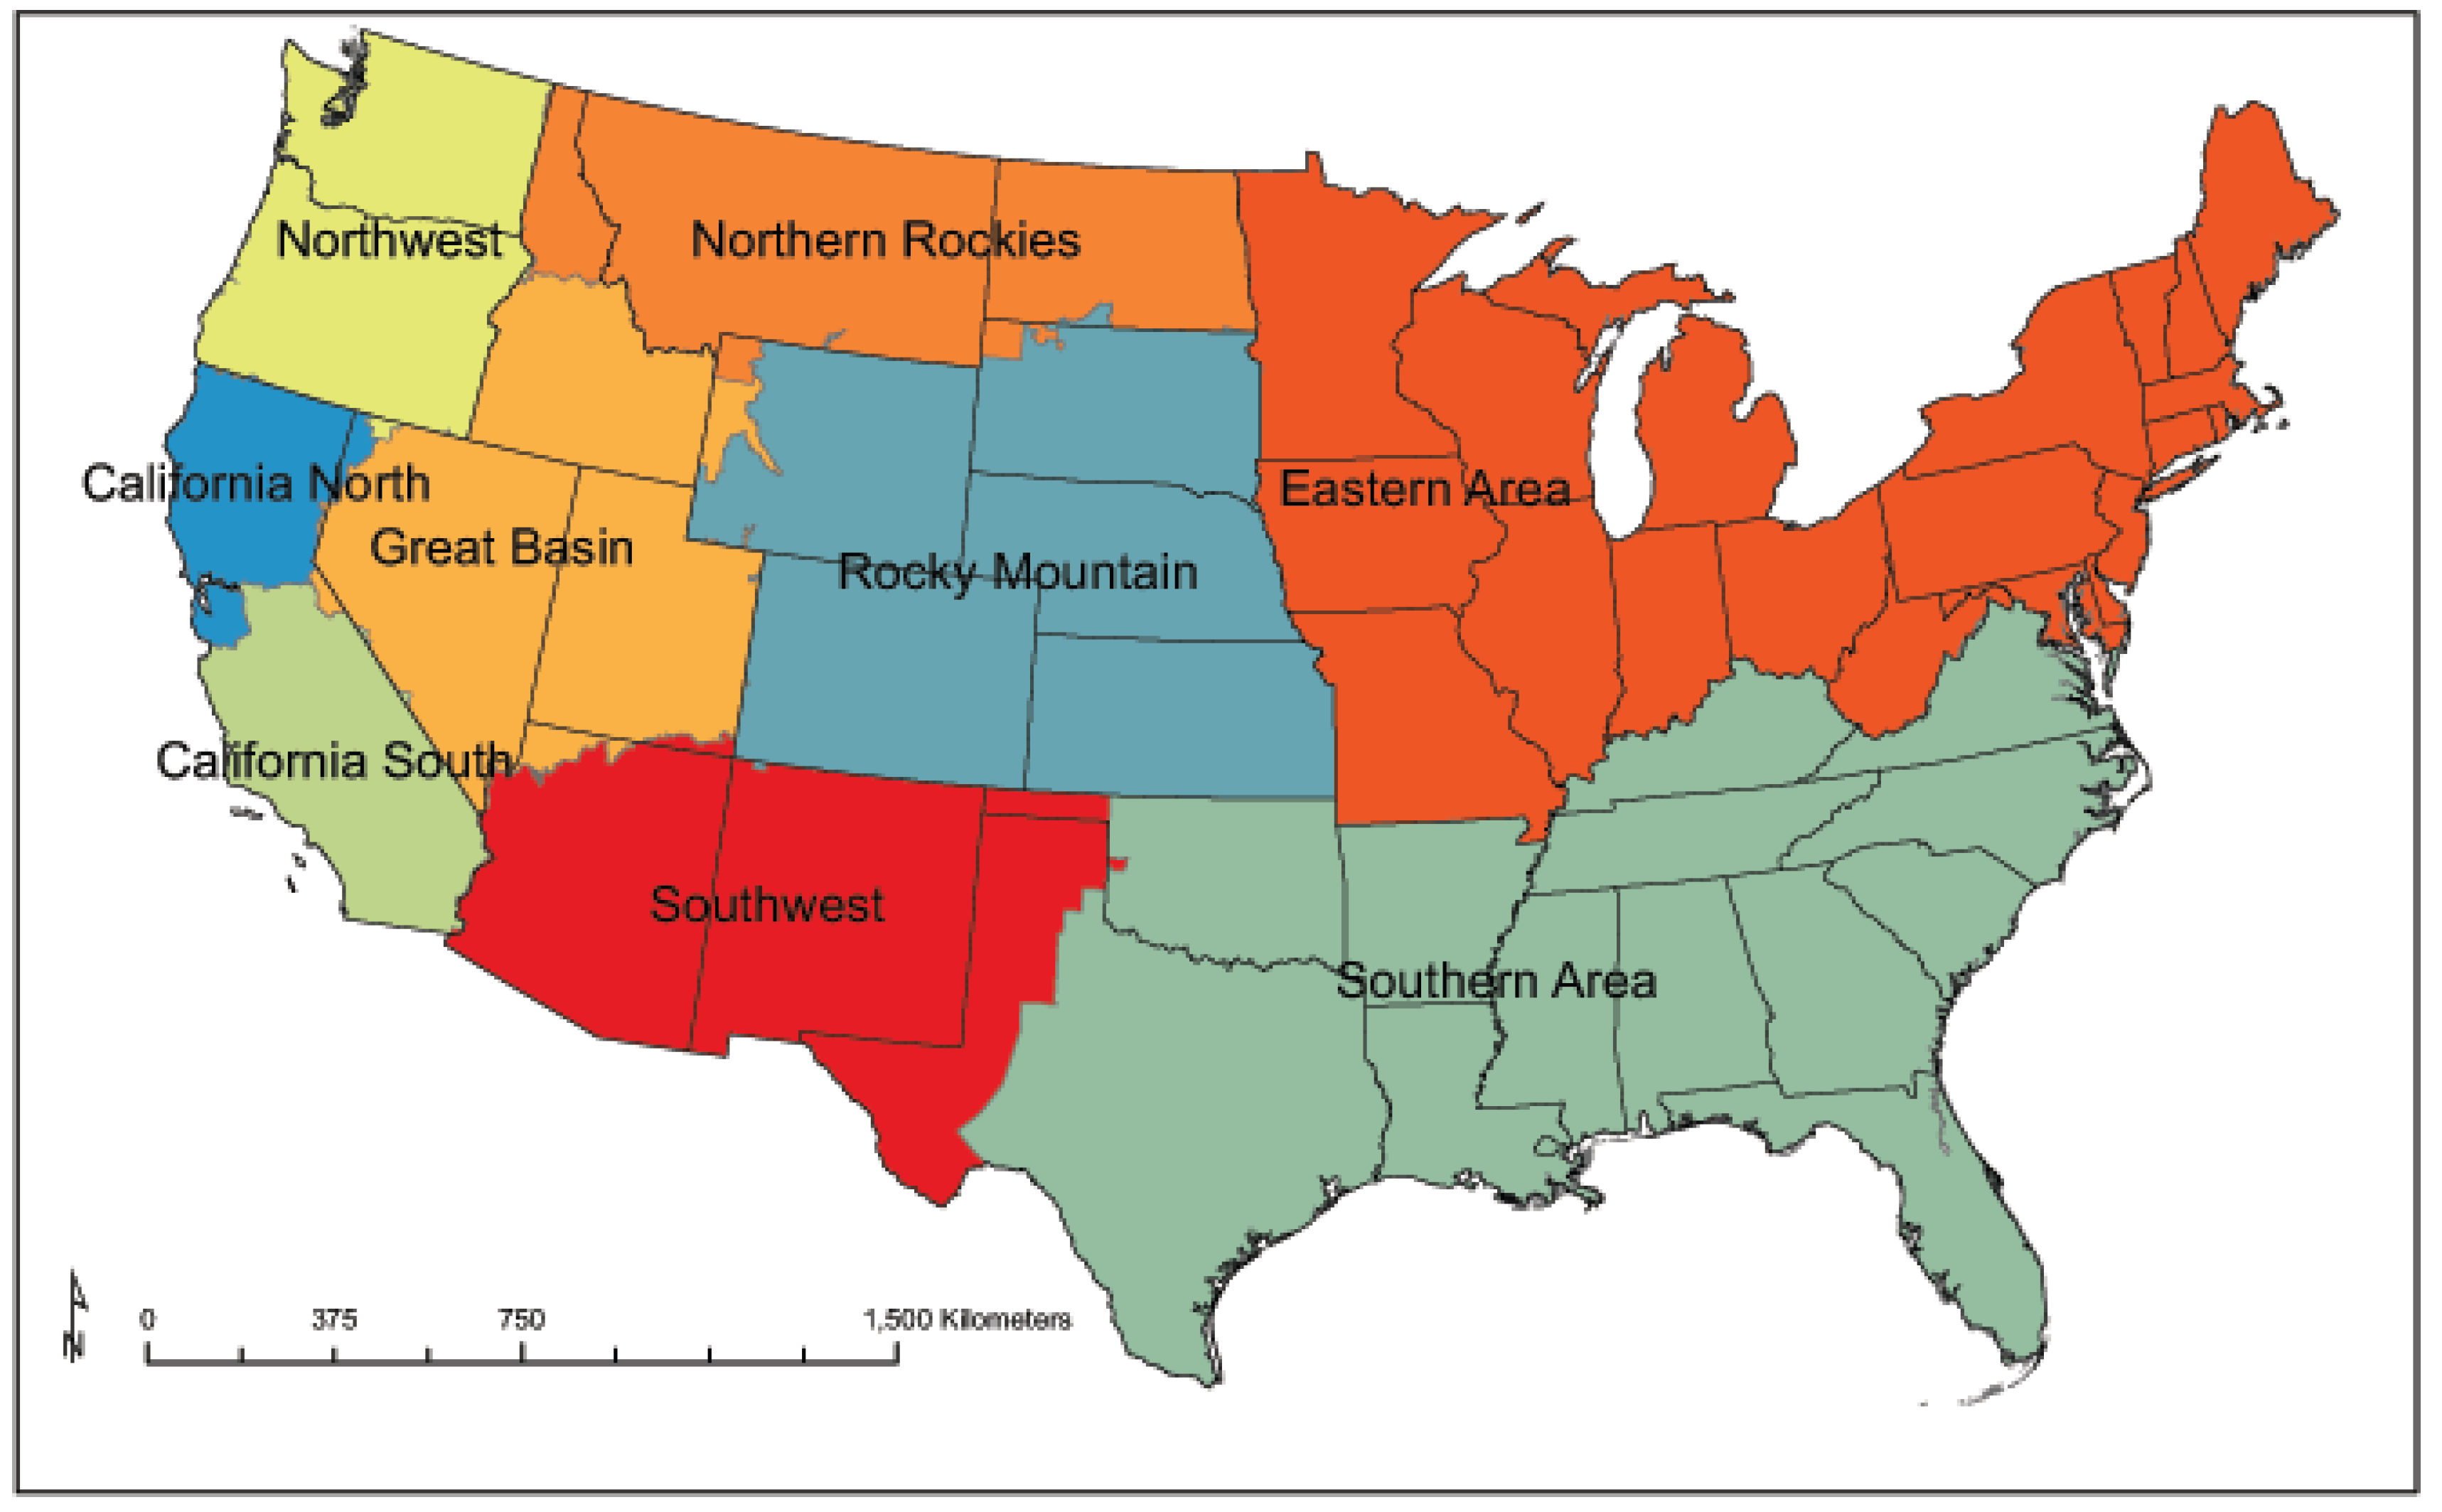
Figure 2.
Wildland fire area burned (ha × 1000) 1980–2015 by GACC region: (A) NR; (B) NW; (C) NC; (D) SC; (E) GB; (F) RM; (G) SW; and (H) Combined.
Figure 2.
Wildland fire area burned (ha × 1000) 1980–2015 by GACC region: (A) NR; (B) NW; (C) NC; (D) SC; (E) GB; (F) RM; (G) SW; and (H) Combined.
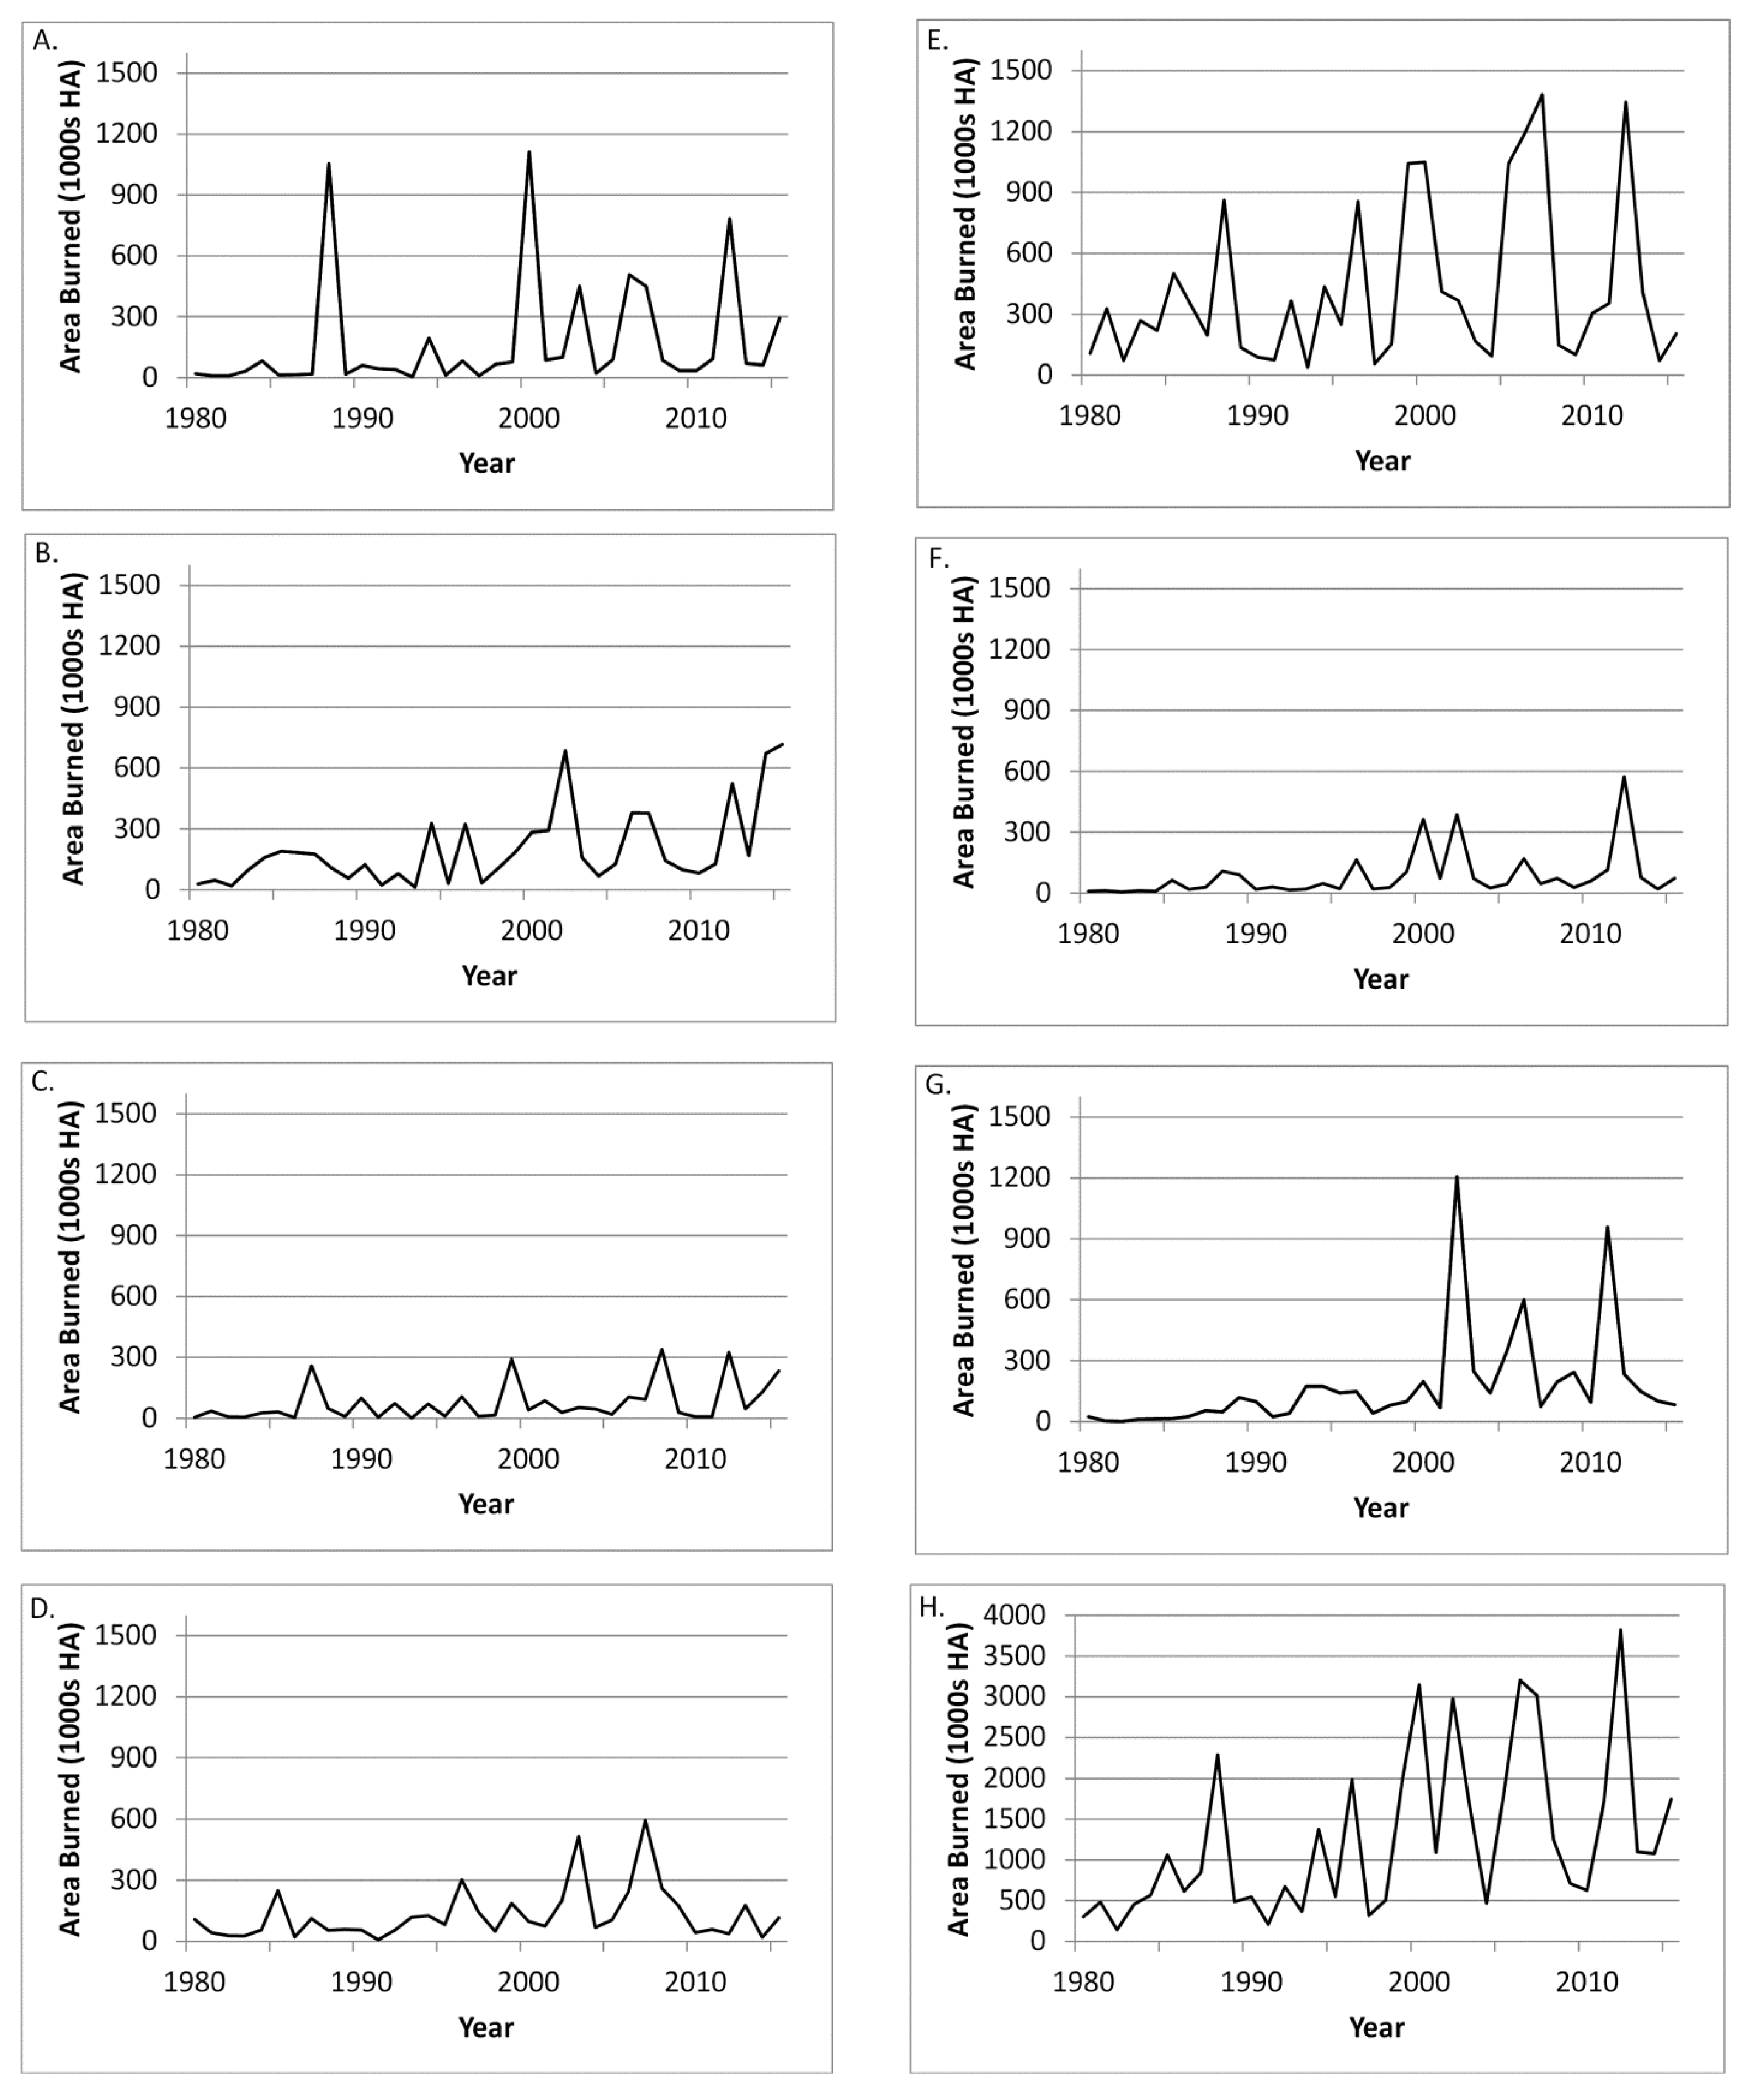
Figure 3.
Significant (p < 0.05) correlations of January ASIE with July: (A) maximum temperature; (B) minimum temperature and (C) precipitation.
Figure 3.
Significant (p < 0.05) correlations of January ASIE with July: (A) maximum temperature; (B) minimum temperature and (C) precipitation.

Figure 4.
Significant (p < 0.05) correlations between January ASIE and monthly 300 hPa (A–G) and monthly soil moisture (H–N) from January (top) through July (bottom).
Figure 4.
Significant (p < 0.05) correlations between January ASIE and monthly 300 hPa (A–G) and monthly soil moisture (H–N) from January (top) through July (bottom).

Table 1.
Results of non-parametric Mann–Kendall test for significance (* p < 05, ** p < 0.01, + p < 0.1) in temporal trends in wildfire activity for the seven GACC regions and all regions combined during 1980–2015 (n = 36). The non-parametric slope value Q shows the trends (hectares burned/year) by region over the same period.
| Region | Mann–Kendall Trend Test Significance | Sen’s Slope Estimator Q (Hectares/Year) |
|---|---|---|
| Northern Rockies | ** | 2787.4 |
| Northwest | ** | 5860.7 |
| Northern California | * | 1711 |
| Southern California | + | 2266.8 |
| Great Basin | NS | 3880.1 |
| Rocky Mountain | ** | 1849.3 |
| Southwest | ** | 5685.8 |
| Combined | ** | 36043 |
Table 2.
Spearman rank-order correlations (p-values) between monthly total Arctic sea-ice extent and annual wildfire area burned during 1980–2015. Significance for 2-tailed tests with * p <0.05 and ** p < 0.01. Shaded boxes represent month with highest correlation for each region.
Table 2.
Spearman rank-order correlations (p-values) between monthly total Arctic sea-ice extent and annual wildfire area burned during 1980–2015. Significance for 2-tailed tests with * p <0.05 and ** p < 0.01. Shaded boxes represent month with highest correlation for each region.
| Region and Month | December Lag | January | February | March | April | May | June | July | August | September |
|---|---|---|---|---|---|---|---|---|---|---|
| Northern Rockies | −0.593 ** | −0.683 ** | −0.555 ** | −0.468 ** | −0.443 ** | −0.388 * | −0.506 * * | −0.457 ** | −0.413 * | −0.408 * |
| Northwest | −0.527 ** | −0.506 ** | −0.411 * | −0.420 ** | −0.384 * | −0.299 * | −0.382 * | −0.404 * | −0.365 * | −0.344 * |
| Northern California | −0.419 * | −0.397 * | −0.338 | −0.371 * | −0.326 | −0.215 | −0.283 | −0.331 * | −0.326 | −0.286 |
| Southern California | −0.324 | −0.254 | −0.221 | −0.306 | −0.362 * | −0.171 | −0.148 | −0.274 | −0.273 | −0.223 |
| Great Basin | −0.338 | −0.391 * | −0.305 | −0.288 * | −0.163 | −0.104 | −0.190 | −0.180 | −0.152 | −0.105 |
| Rocky Mountain | −0.568 ** | −0.582 ** | −0.513 ** | −0.508 ** | −0.453 ** | −0.403 * | −0.444 ** | −0.493 ** | −0.443 ** | −0.441 ** |
| Southwest | −0.548 ** | −0.573 ** | −0.611 ** | −0.636 ** | −0.645 ** | −0.611 ** | −0.674 ** | −0.620 ** | −0.626 ** | −0.607 ** |
| Combined | −0.652 ** | −0.660 ** | −0.562 ** | −0.539 ** | −0.464 ** | −0.392 * | −0.505 ** | −0.512 ** | −0.479 ** | −0.439 ** |
Table 3.
Spearman rank-order correlations (p-values) between monthly regional Arctic sea-ice extent and annual wildfire area burned during 1980–2015. Significance for 2-tailed tests with * p <0.05 and ** p < 0.01. Regions without statistically significant relationships (i.e., p > 0.05 are not shown). Shaded boxes highlight where the regional Arctic sea-ice extent (ASIE) relationship was stronger than that obtained using total ASIE. Dashes (--) indicate no significant correlation.
| Region and Month | December Lag | January | February | March | April | May | June | July | August | September |
|---|---|---|---|---|---|---|---|---|---|---|
| Northern Rockies | −0.533 ** | −0.503 ** | −0.580 ** | −0.541 ** | −0.465 ** | −0.386 * | −0.457 ** | −0.456 ** | −0.474 ** | −0.395 * |
| Baffin | Greenland | Greenland | Greenland | Barents | Barents | E. Siberian | Barents | Barents | E. Siberian | |
| Northwest | −0.458 ** | −0.530 ** | −0.528 ** | −0.523 ** | −0.388 * | -- | −0.422 * | −0.486 ** | −0.506 ** | −0.405 * |
| E. Siberian | Greenland | Greenland | Greenland | E. Siberian | -- | E. Siberian | Barents | Barents | Barents | |
| Northern California | −0.418 * | -- | −0.341 * | −0.477 ** | -- | -- | -- | -- | -- | -- |
| Barents | -- | Greenland | Greenland | -- | -- | -- | -- | -- | -- | |
| Southern California | −0.532 ** | -- | -- | -- | -- | -- | -- | −0.337 * | -- | -- |
| Greenland | -- | -- | -- | -- | -- | Greenland | -- | -- | ||
| Great Basin | −0.457 ** | −0.399 * | -- | −0.375 * | −0.480 ** | −0.346 * | -- | −0.413 * | −0.521 ** | −0.489 ** |
| Baffin | Greenland | -- | Baffin | Baffin | Baffin | -- | Barents | Barents | Barents | |
| Rocky Mountain | −0.560 ** | −0.387* | −0.363 * | −0.398 * | −0.386 * | −0.352 * | −0.466 ** | −0.491 ** | −0.432 ** | −0.416 * |
| Baffin | E. Siberian | Greenland | Greenland | Baffin | Baffin | Baffin | Barents | Barents | E. Siberian | |
| Southwest | −0.512 ** | −0.479 ** | −0.531 ** | −0.565 ** | −0.586 ** | -458 ** | −0.589 ** | −0.572 ** | −0.578 ** | −0.567 ** |
| E. Siberian | E. Siberian | Greenland | E. Siberian | E. Siberian | Greenland | Baffin | E. Siberian | E. Siberian | E. Siberian | |
| Combined | −0.613 ** | −0.539 ** | −0.558 ** | −0.567 ** | −0.466 ** | −0.366 * | −0.467 ** | −0.541 ** | −0.490 ** | −0.444 ** |
| E. Siberian | Greenland | Greenland | Greenland | Barents | Barents | Baffin | Barents | Barents | E. Siberian |
© 2017 by the authors. Licensee MDPI, Basel, Switzerland. This article is an open access article distributed under the terms and conditions of the Creative Commons Attribution (CC BY) license (http://creativecommons.org/licenses/by/4.0/).
Share and Cite
MDPI and ACS Style
Knapp, P.A.; Soulé, P.T. Spatio-Temporal Linkages between Declining Arctic Sea-Ice Extent and Increasing Wildfire Activity in the Western United States. Forests 2017, 8, 313. https://doi.org/10.3390/f8090313
AMA Style
Knapp PA, Soulé PT. Spatio-Temporal Linkages between Declining Arctic Sea-Ice Extent and Increasing Wildfire Activity in the Western United States. Forests. 2017; 8(9):313. https://doi.org/10.3390/f8090313
Chicago/Turabian StyleKnapp, Paul A., and Peter T. Soulé. 2017. "Spatio-Temporal Linkages between Declining Arctic Sea-Ice Extent and Increasing Wildfire Activity in the Western United States" Forests 8, no. 9: 313. https://doi.org/10.3390/f8090313
Note that from the first issue of 2016, this journal uses article numbers instead of page numbers. See further details here.