Effects of the Antiozonant Ethylenediurea (EDU) on Fraxinus ornus L.: The Role of Drought

Department of Environmental Biology, Sapienza University of Rome, P.le Aldo Moro, 5, 00185 Rome, Italy
*
Author to whom correspondence should be addressed.
Forests 2017, 8(9), 320; https://doi.org/10.3390/f8090320
Submission received: 10 July 2017
/
Revised: 31 July 2017
/
Accepted: 10 August 2017
/
Published: 30 August 2017
(This article belongs to the Special Issue Impact of Ozone on Forests)
Abstract
:Ethylenediurea (EDU) is a synthetic chemical known to protect plants from the phytotoxic effects of tropospheric ozone (O3). Although many studies have proposed the use of EDU for studying the O3 effects under field conditions, its mechanism of action is not fully understood, and it is unclear whether it exerts a specific antiozonant action, or if it may also interact with other oxidative stresses. The aim of this work was to evaluate the effect of EDU on forest species in a Mediterranean environment where, during summer, vegetation is exposed to multiple oxidative stresses, such as O3 and drought. The experiment was conducted on Fraxinus ornus L. (Manna ash) plants growing in six mesocosms, three maintained under full irrigation, while the other three were subjected to drought for 84 days. In each mesocosm, three plants were sprayed every 15 days with 450 ppm EDU. Gas exchange and chlorophyll “a” fluorescence measurements carried out through the experimental period highlighted that EDU did not affect stomatal conductance and had an ameliorative effect on the functionality of drought-stressed plants, thus suggesting that it may act as a generic antioxidant. The implications of these findings for the applicability of EDU in field studies are discussed.
1. Introduction
It is now widely acknowledged that current tropospheric ozone (O3) levels have the potential to cause foliar injury, growth and yield reductions of crops and natural vegetation [1,2]. However, despite more than 50 years of studies, knowledge of the phytotoxic effects of O3 is far from complete, particularly with respect to forest trees [2,3]. Indeed, since most of these studies were carried out in laboratory or semi-controlled environments, a robust determination of the O3 impact on forests, under realistic field conditions, is still missing [4]. In this regard, the southern part of Europe requires special research efforts [5,6]. Besides being characterized by a strong photochemical activity that favors the O3 formation process, the typical Mediterranean climate in this region determines the co-occurrence of multiple environmental stress factors [7,8,9], among which drought requires particular attention [10]. In fact, under drought conditions, stomatal conductance can be strongly reduced, consequently limiting O3 uptake and protecting vegetation from potentially harmful O3 concentrations [8,11,12]. At the same time, however, given that both factors act as oxidative stresses on plants, it may be difficult to establish a cause-effect relationship between O3 and tree response under natural conditions, where drought may have important confounding effects [13,14,15].
The use of the chemical compound ethylenediurea, N-[-2-(2-oxo-1-imidazolidinyl) ethyl]-N-phenylurea (abbreviated EDU), can be of some help in field studies [16,17,18,19]. Carnhan [20] found that EDU can specifically protect plants from O3 leaf injury and, since then, EDU has been largely used for the assessment of O3 effects on growth and yield of both herbaceous [17,19,21,22,23,24,25] and woody plants [26,27,28,29,30,31]. EDU is systemic in plants [32] and can be applied as foliar spray or soil drench, the latter method being the least effective for protecting fast-growing tree species [30]. It has been also applied via stem injection and gravitational infusion in different tree species, providing protection from O3 injury [27,33]. However, the protective mechanism of EDU is still not fully understood [18]. Some studies [34,35,36] have shown that EDU acts by maintaining a high antioxidant enzyme activity and level during O3 exposure, but other studies concluded that EDU does not significantly affect the antioxidant content in leaves [24]. It is also unclear whether EDU limits stomatal O3 uptake by inducing a decrease in the stomatal conductance of treated plants [16,17].
In a recent review [25], Agathokleous suggested that the mode of action of EDU could be based on hormesis, i.e., a stimulatory effect exerted by EDU on plant defenses against O3. In this context, the possible interaction of EDU with other oxidative stress factors besides O3 should be further investigated. Indeed, Albert et al. [37] have shown that EDU application counteracted some of the negative impacts of UV-B on Betula nana L., thus suggesting that EDU can protect plants from other oxidative stress factors besides ozone. Recently, Xin et al. [38] showed that moderate drought does not affect the capability of EDU to protect potted Populus plants from O3, but, to the best of our knowledge, no study has investigated the possible confounding effect of drought when using EDU under Mediterranean environmental conditions.
Within this framework, the present paper aims to: (1) evaluate whether EDU affects stomatal conductance of Fraxinus ornus L. (Manna ash) and (2) verify whether EDU interacts with water stress by reducing drought effects, since this knowledge is of key importance when determining the usefulness of EDU for field studies of O3 effects in Mediterranean forests. F. ornus was selected as the target species, being known to be moderately sensitive to ozone [39], as well as to drought [9,10,40]. It is a small deciduous tree distributed across a wide range of environments in the Mediterranean area and forms mixed forests together with evergreen species such as Quercus ilex L., or deciduous oaks such as Quercus cerris L. [41]. We hypothesize that: (i) based on hormesis, the mechanism of EDU does not imply a decreased O3 uptake through a reduction of stomatal conductance and (ii) EDU-induced stimulation of plant defenses can ameliorate the oxidative effects of severe drought stress.
2. Materials and Methods
2.1. Experimental Site and Plant Material
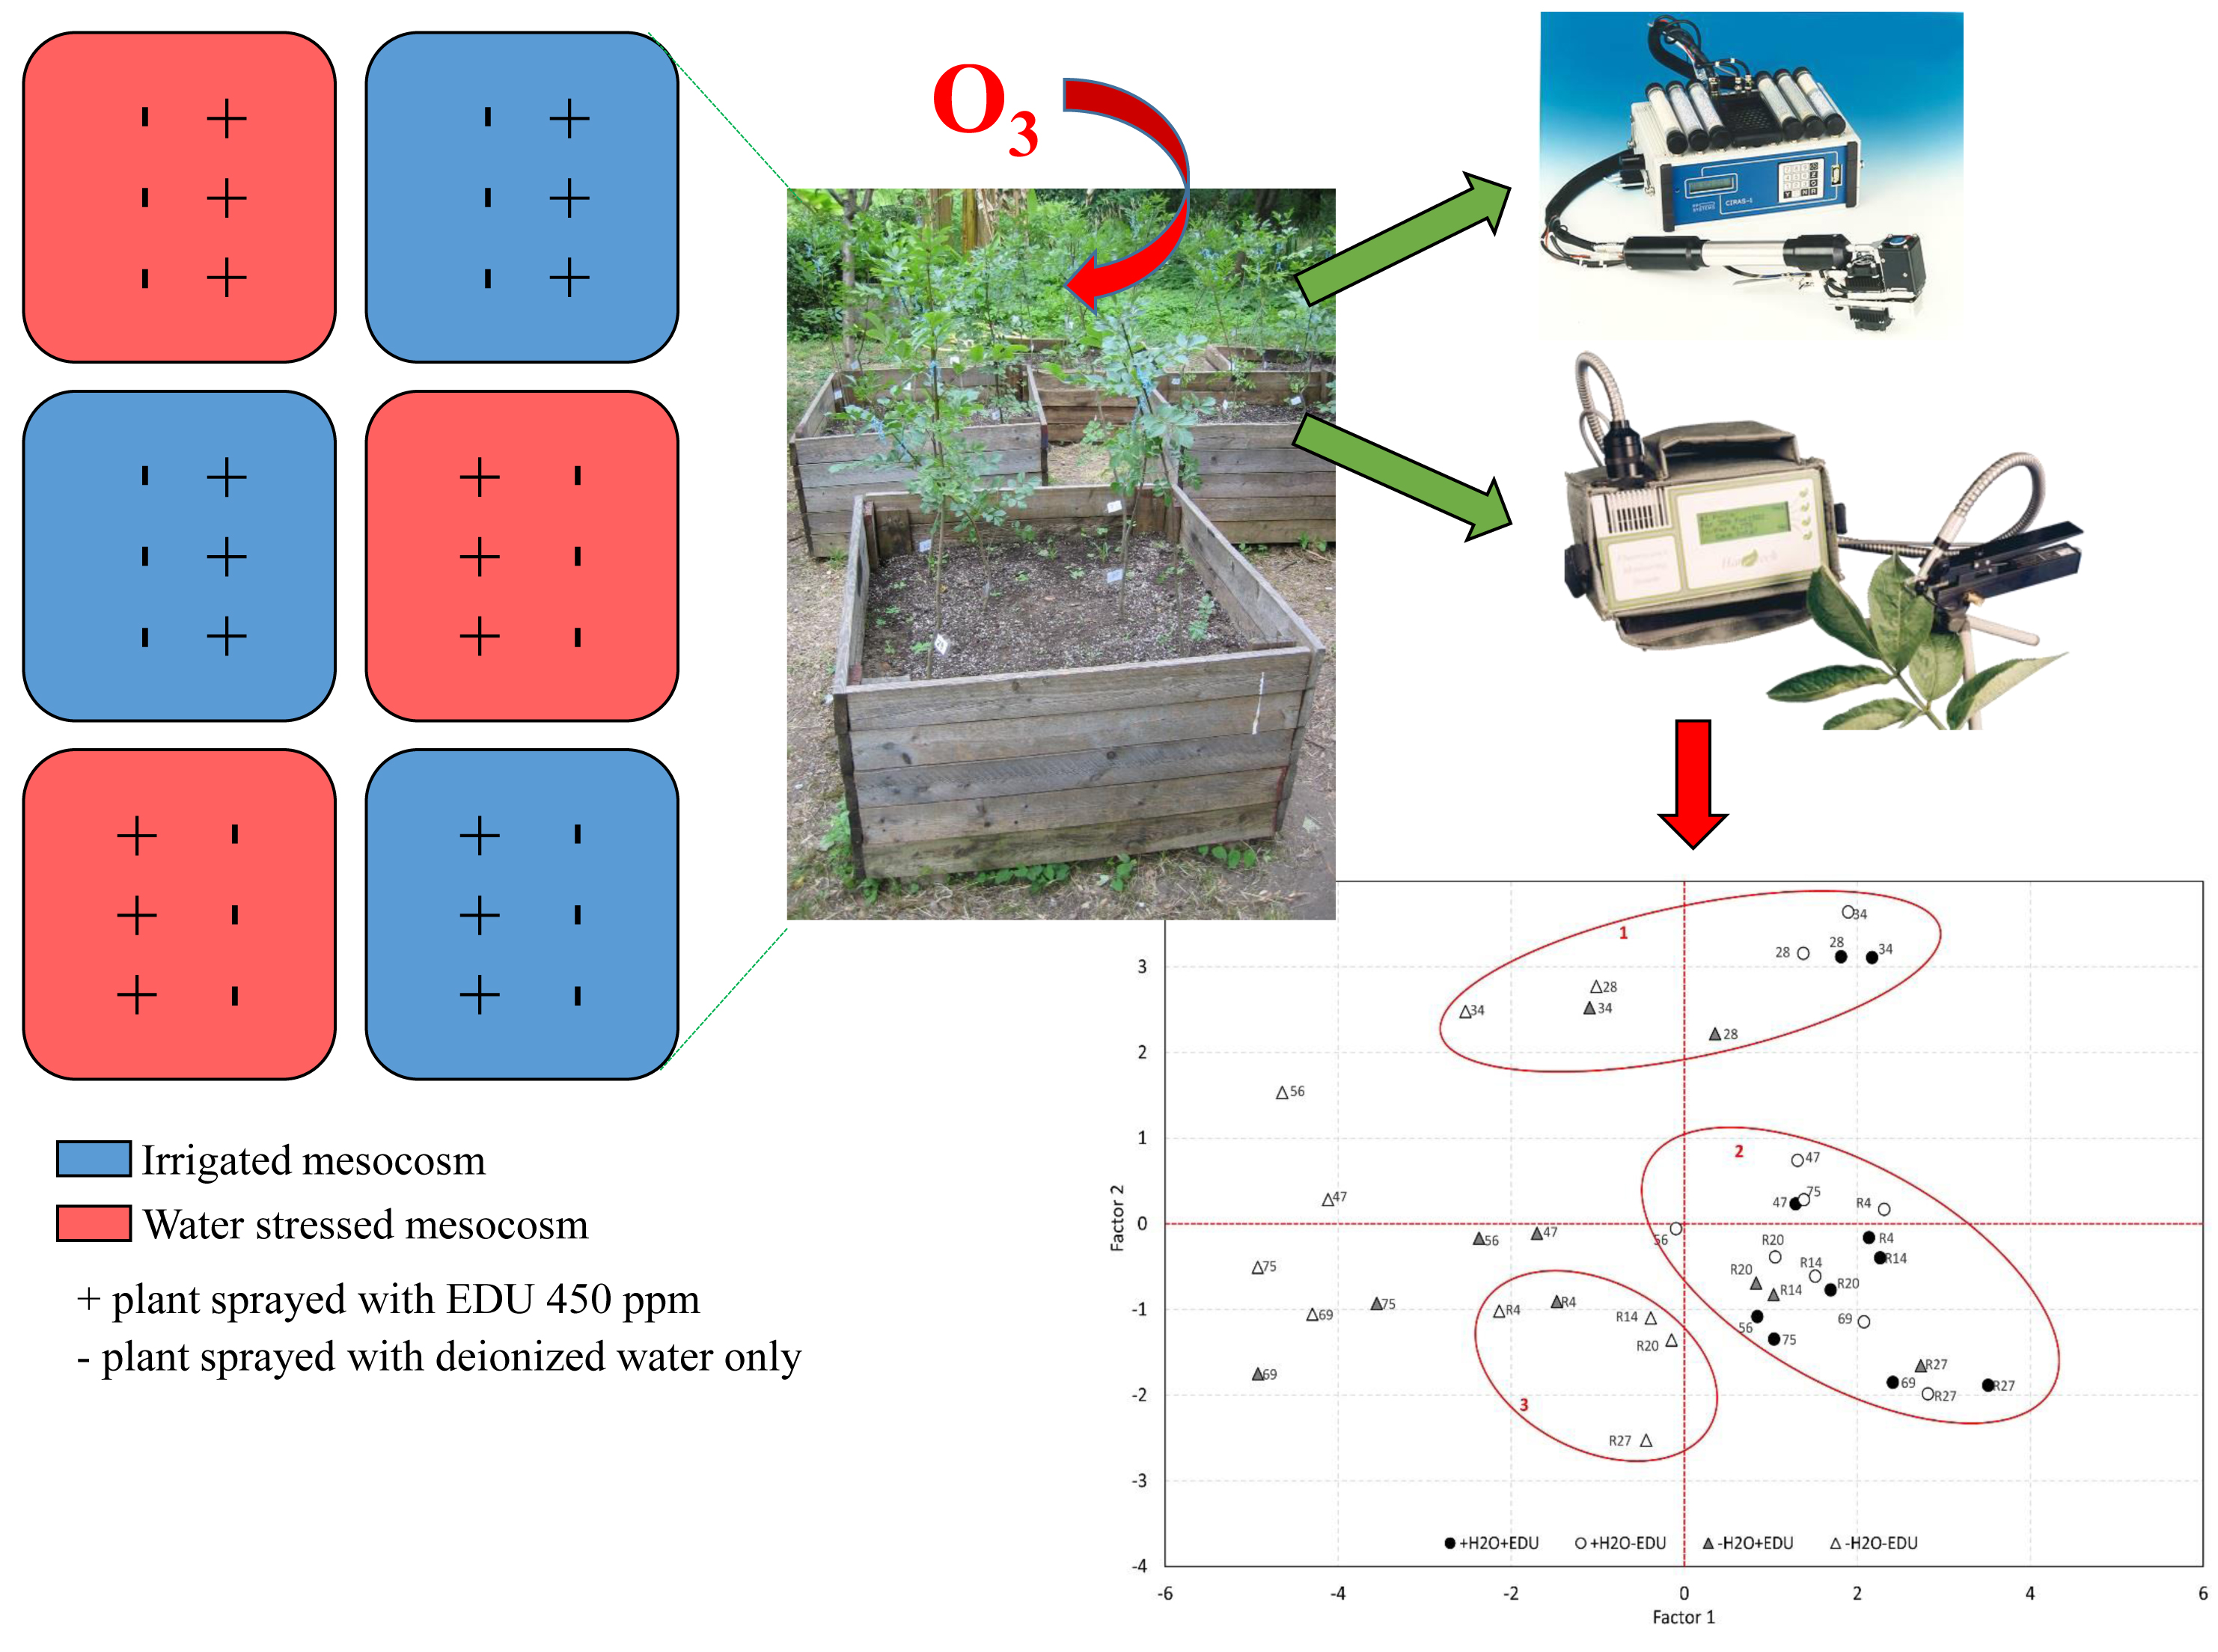
The experiment was conducted in the botanical garden of the Department of Environmental Biology, Sapienza University of Rome (Rome, Italy), from June to October 2006. Climate data of the site were provided by Osservatorio Meteorologico “Torre Calandrelli”, Collegio Romano (RM). Ozone concentrations were continuously monitored in situ using a UV photometric analyser (Model 1008, Dasibi Environmental Corp., Glendale, CA, USA). From hourly means of ozone concentration during daylight hours (i.e., with solar radiation levels >50 W m−2), the Accumulated exposure Over the Threshold of 40 ppb (AOT40, ppm h) was calculated for the experimental period [42].
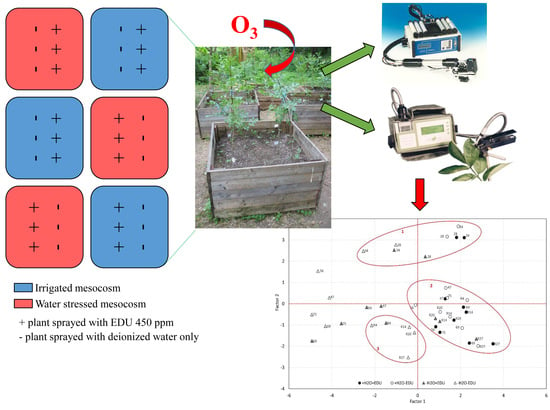
Thirty-six Fraxinus ornus saplings, two years old (mean height: 85.2 cm ± 12.5 cm), obtained from the forest nursery of the Aurunci Regional Park (Southern Latium, Italy), were planted on 31 May in 6 woody mesocosms of 1 m3 volume each (square base 1 m × 1 m, 1 m height; 6 plants per mesocosm). The rooting substrate consisted of garden soil, sand and peat (1:1:1); the plants were fertilized with slow-release Osmocote (Scotts Italia S.R.L., Treviso, Italy, NPK 15-8-11 and micoelements), 9 g per plant. The soil depth in each mesocosm was ~90 cm. The plants were allowed to adapt to the new conditions for 15 days until complete leaf development.
2.2. Experimental Design
Three mesocosms were irrigated to field capacity during the whole experiment, while the other three were subjected to water stress. The latter state was obtained by suspending artificial irrigation from 16 June (Day Of Treatment, DOT = 0), to 8 September (DOT = 84); during this period, natural rainfall was also excluded by covering the water-stressed mesocosms with plastic sheets, which were removed when not necessary in order to prevent soil heating. In all mesocosms, the Soil Water Content (SWC, %) in the first 10 cm was measured gravimetrically, by weighing a known volume of soil (10 cm3), which was then oven-dried at 60 °C and reweighed [43]. From each mesocosm, two soil cores were collected in the area between the plants, in order to avoid damaging plant roots. The sampling scheme for SWC measurements is reported in Table 1.
The EDU treatment started on 10 July (DOT 24) and was repeated every 14 days until 5 September (DOT 81), for a total of five EDU applications (Table 1). Three plants per mesocosm were treated, and the chemical was applied by foliar spray instead of soil drench, in order to be coupled with the total exclusion of irrigation in the drought-stressed mesocosms. The applied EDU concentration was 450 ppm, which was chosen on the basis of previous studies on Fraxinus species [28] and other tree species [44,45]. Following Manning et al. [18], the EDU solution was freshly prepared before each application by dissolving pure EDU powder (source: UNECE/ICP Crops biomonitoring, 1997) in warm distilled water. The remaining plants were sprayed with distilled water only. The treatment was applied at sunset, in order to prevent rapid evaporation of the solution from the leaves, and both leaf surfaces were sprayed until runoff.
In summary, the experimental design consisted of four combinations of water and EDU treatments, labeled as follows: +H2O−EDU (control), +H2O+EDU, −H2O−EDU, and −H2O+EDU. Each experimental set consisted of 9 plants in total and was replicated across 3 mesocosms (3 plants each).
2.3. Gas Exchange Measurements
Gas exchange was measured on sun-exposed, fully developed leaves growing on the upper portion of the trees. Sampled leaves were permanently marked with colored wires, and the same age cohort of leaves was assessed through the whole experiment.
Net photosynthesis (Pn, μmol CO2 m−2 s−1), leaf transpiration (E, mmol H2O m−2 s−1), stomatal conductance (gs, mmol H2O m−2 s−1) and sub-stomatal CO2 concentration (Ci, ppm) were simultaneously recorded in vivo by a portable open system CIRAS I (PP Systems, Hitchin, UK), under environmental levels of irradiance (PAR, μmol photons m−2 s−1), relative humidity (RH, %), leaf-to-air Vapour Pressure Difference (VPD, mbar) and air temperature (Tcuv, °C), which were also recorded by the instrument. The ratio between sub-stomatal and external CO2 concentration (Ci/Ca, dimensionless) was also calculated. Gas exchange was measured in the morning from 8:00 to 12:00 h GMT + 1 on the dates reported in Table 1, from June to October 2006. On each day, all plants were sampled, and the number of sampled leaves varied from a minimum of 9 (1 per plant) to a maximum of 30 (3–4 per plant) for each of the four combinations of water and EDU treatments, depending on the photoperiod and environmental conditions.
2.4. Chlorophyll “a” Fluorescence Measurements
Modulated Chlorophyll “a” (Chl a) fluorescence was measured using a Fluorescence Monitoring System (FMSII, Hansatech, UK), on the same dates and times and on the same leaves used for gas exchange (Table 1). The number of sampled leaves varied from a minimum of 9 (1 per plant) to a maximum of 30 (3–4 per plant) for each of the four combinations of water and EDU treatments, depending on the photoperiod and environmental conditions. The maximum quantum yield of PSII was evaluated on dark-adapted (40 min) leaves as Fv/Fm = (Fm − F0)/Fm), where F0 is the basal fluorescence, Fv the variable fluorescence and Fm the maximum fluorescence. The effective quantum efficiency ΦPSII was calculated as (Fm′ − Fs)/Fm′, where Fs is the steady state fluorescence and Fm′ is the maximum fluorescence measured in the light. Photochemical (qP) and non-Photochemical (qNP) quenching was also calculated [46].
2.5. Statistical Analyses
Data were analyzed using Statistica v 7.0 software (StatSoft, Inc., Tulsa, OK, USA). The effects of drought and EDU treatments on each measurement date were evaluated by applying two-way Analysis of Variance (ANOVA) to gas exchange and chlorophyll fluorescence measurements. The input data for the ANOVA test were all leaf-level measurements, recorded for each experimental set on each measurement date. Significant differences between means were then determined through the post hoc Student-Newman-Keuls test at a significance level of 0.05. Normality and homogeneity of variance (Levene′s test) requirements were tested previously. The time effect was not considered.
A multivariate statistical technique, i.e., Principal Component Analysis (PCA, with Equimax rotation), was used to investigate and reveal structures of variability and correlations between variables within different sampling dates. For this analysis, data measured from DOT 28, after the beginning of both water stress and EDU treatments, to R27, were pooled together. The principal components were then computed via a correlation matrix, in order to standardize the different variables’ scales. The selection of the principal factors was based on those with eigenvalues greater than 1.
3. Results
3.1. Meteorological Conditions and Ozone Levels
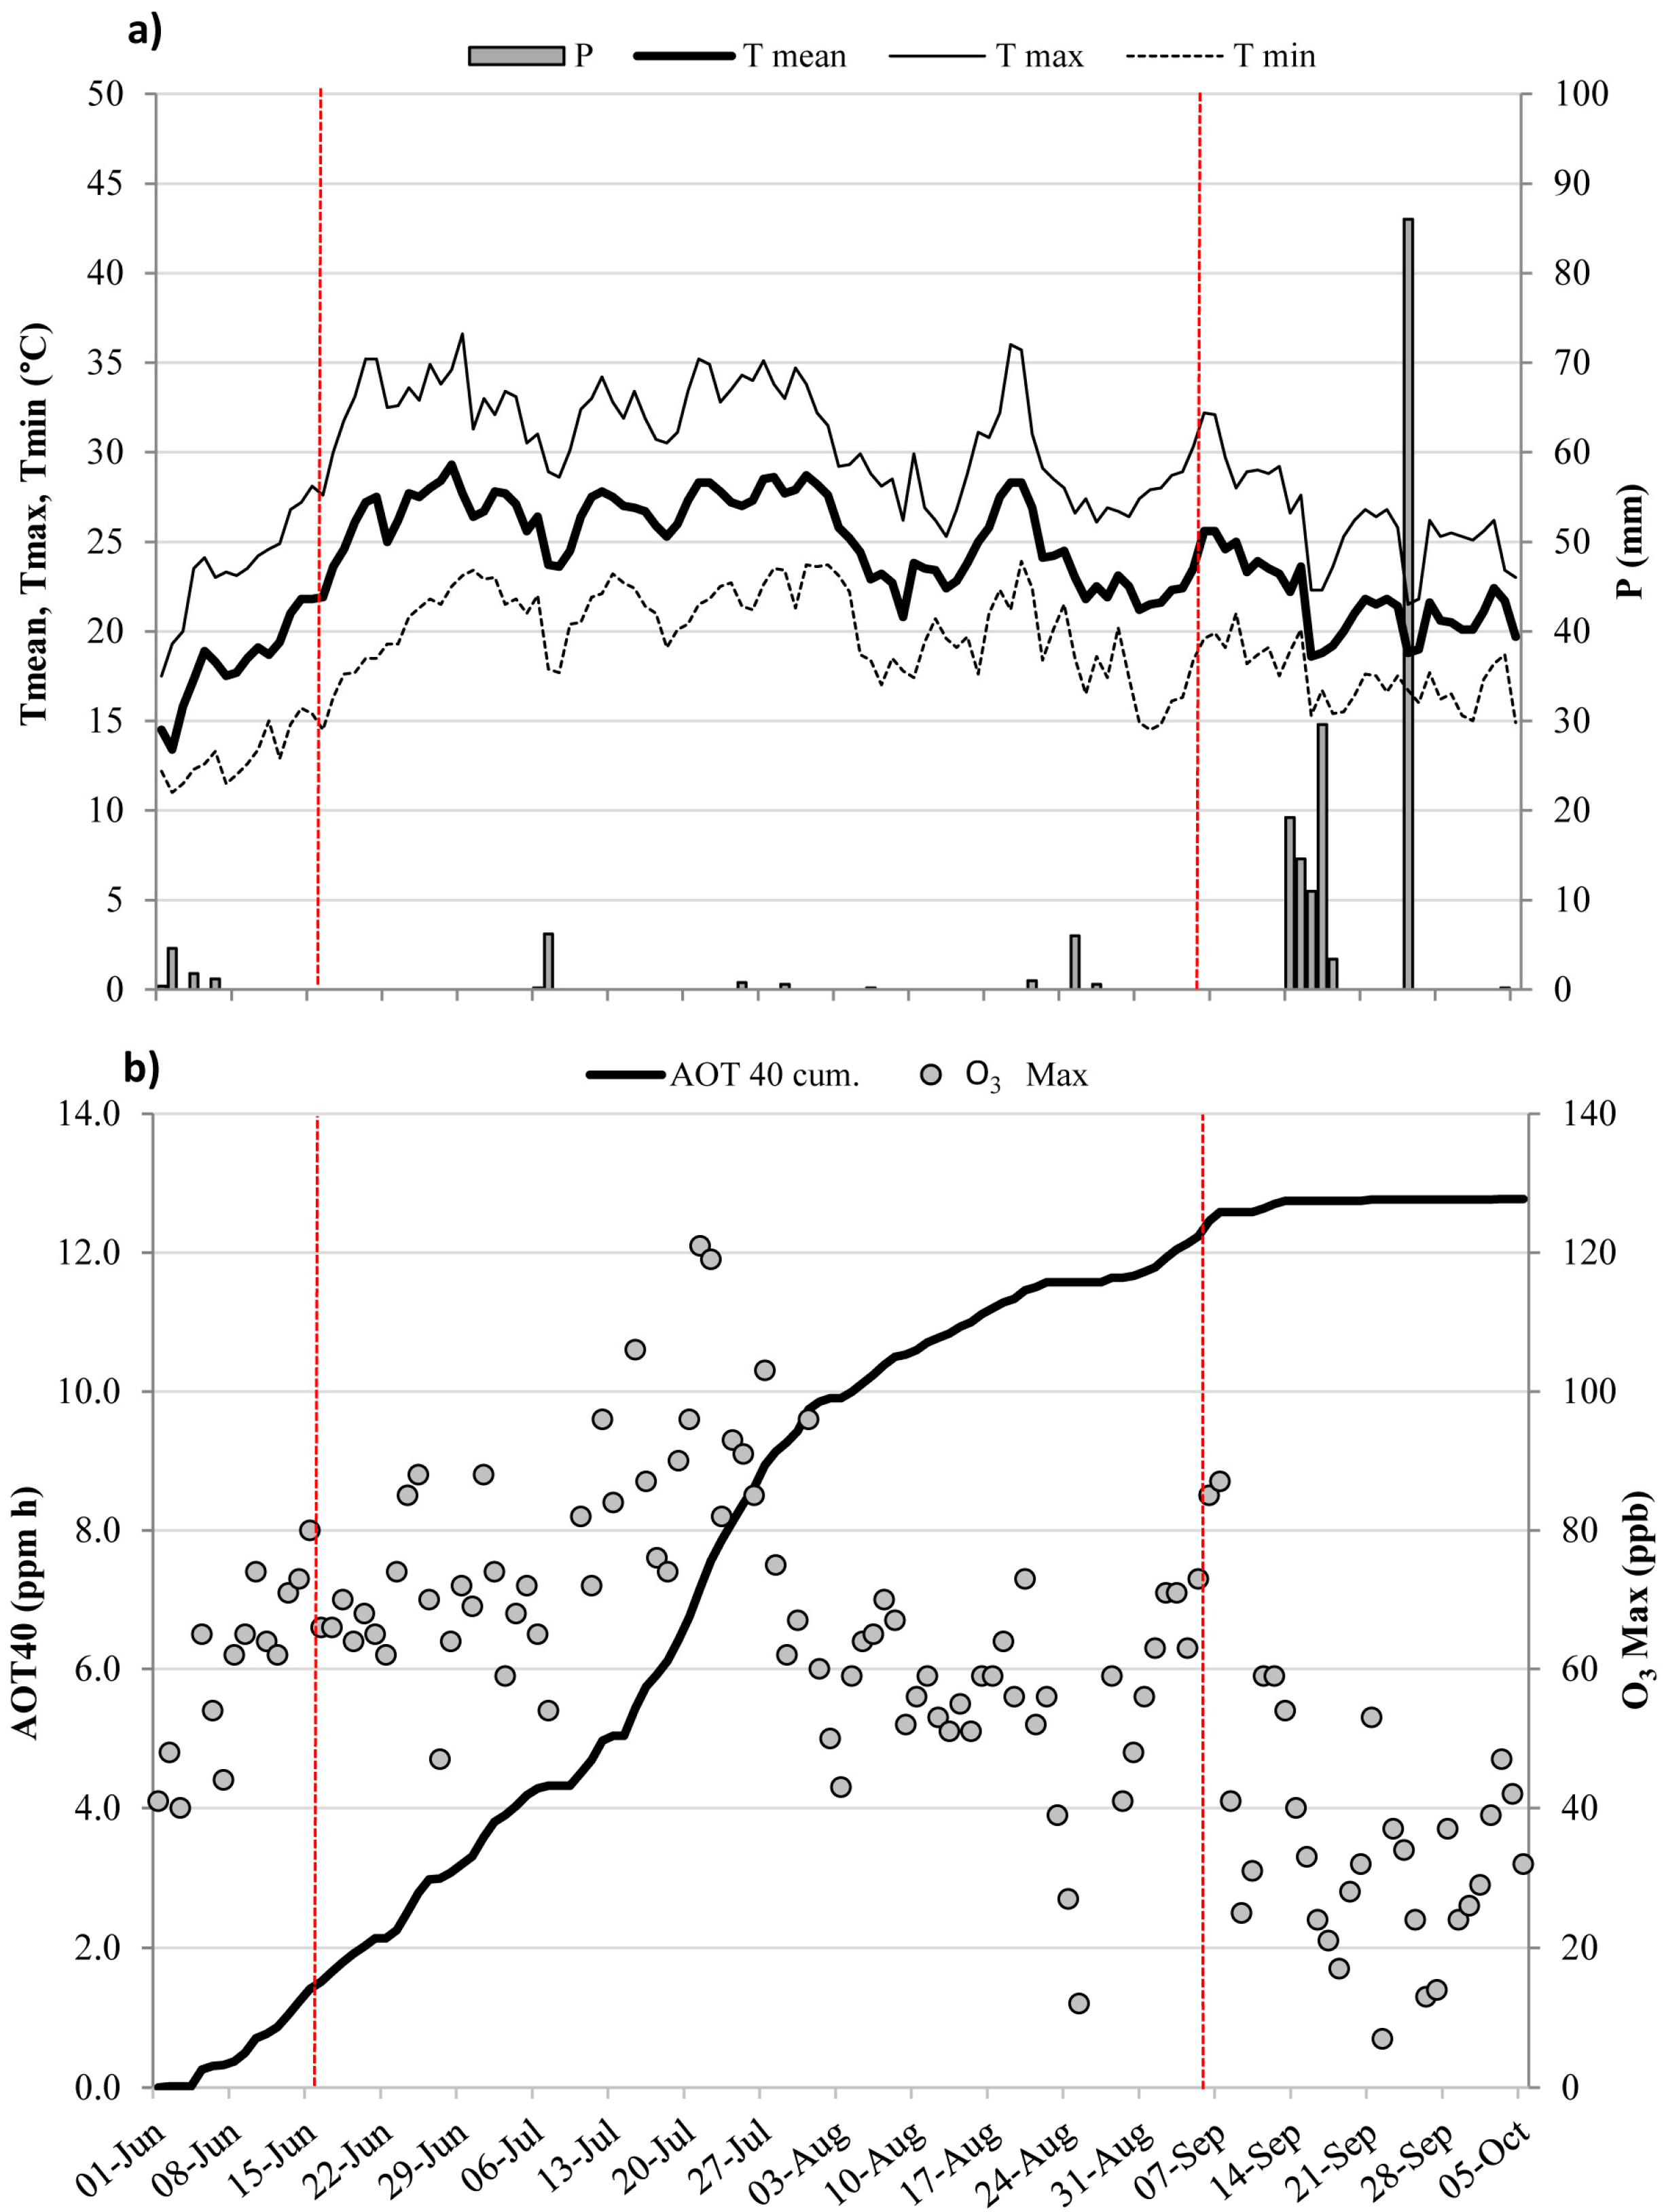
The daily pattern of air temperature and rainfall during the study period is shown in Figure 1a, together with cumulated AOT40 and the daily maximum O3 trend (Figure 1b). The highest daily mean temperature was recorded on 29 June (29.3 °C, Figure 1a), and rainfall occurred mainly during mid- and late September. Precipitation during the experimental drought period was scarce (15.6 mm in total from 16 June to 5 September). O3 was high in June and July, reaching the maximum value on 21 July (121 ppb, Figure 1b) and decreasing in September. AOT40 exceeded the critical level for the protection of forest trees (5 ppm h, [47]), already on 13 July, and cumulative exposure at the end of the entire experimental period (5 October) was 12.7 ppm h.
The values of the environmental parameters irradiance (PAR, μmol photons m−2 s−1), relative humidity (RH, %), leaf-to-air Vapour Pressure Difference (VPD, mbar) and air temperature in the leaf cuvette (Tcuv, °C) on the dates of ecophysiological measurements are shown in Supplementary material (Figure S1).
3.2. Soil Water Content
In the irrigated mesocosms (+H2O), SWC was never below 30%, while in the water-stressed mesocosms it decreased progressively during summer, dropping to values as low as 9% after 34 days from the last irrigation (DOT 34) and reaching the minimum of 6% at the end of the experimental drought (DOT 84). SWC increased again to control values after re-watering (from R4) (Figure 2).
3.3. Ecophysiological Analyses
In the well-watered plants, gas exchange showed slight variations during the whole period, since a significant effect of EDU was only highlighted on DOT 75, when +H2O+EDU had lower gs (−35%) and Pn (−51%) than control plants (Figure 3a,b; Table 2; Figure S2, Table S1), in correspondence with lower PAR values (Figure S1).
In both drought-stressed sets (−H2O+EDU, −H2O−EDU), instead, Pn, gs and E were significantly reduced already by DOT 12, and reached the lowest values with respect to those of the control set at DOT 75 (Pn: −96% and −92%; gs: −95% and −93%; E: −93% and −90% in −H2O+EDU and −H2O−EDU, respectively) (Figure 3a,b,d; Table 2; Figure S2). This marked gas exchange reduction persisted in both drought-stressed sets after 4 days from re-watering (R4), without any significant difference between EDU treatments. A different EDU response was instead evident from R14: −H2O+EDU recovered its Pn, gs and E values to those of the control set, while −H2O−EDU showed an incomplete recovery of gas exchange, which remained significantly lower than that of the control after 27 days from re-watering (R27) (Figure 3; Table 2; Figure S2).
The Ci/Ca ratio was only slightly affected by both drought and EDU (Figure 3c; Table 2; Figure S2, Table S1).
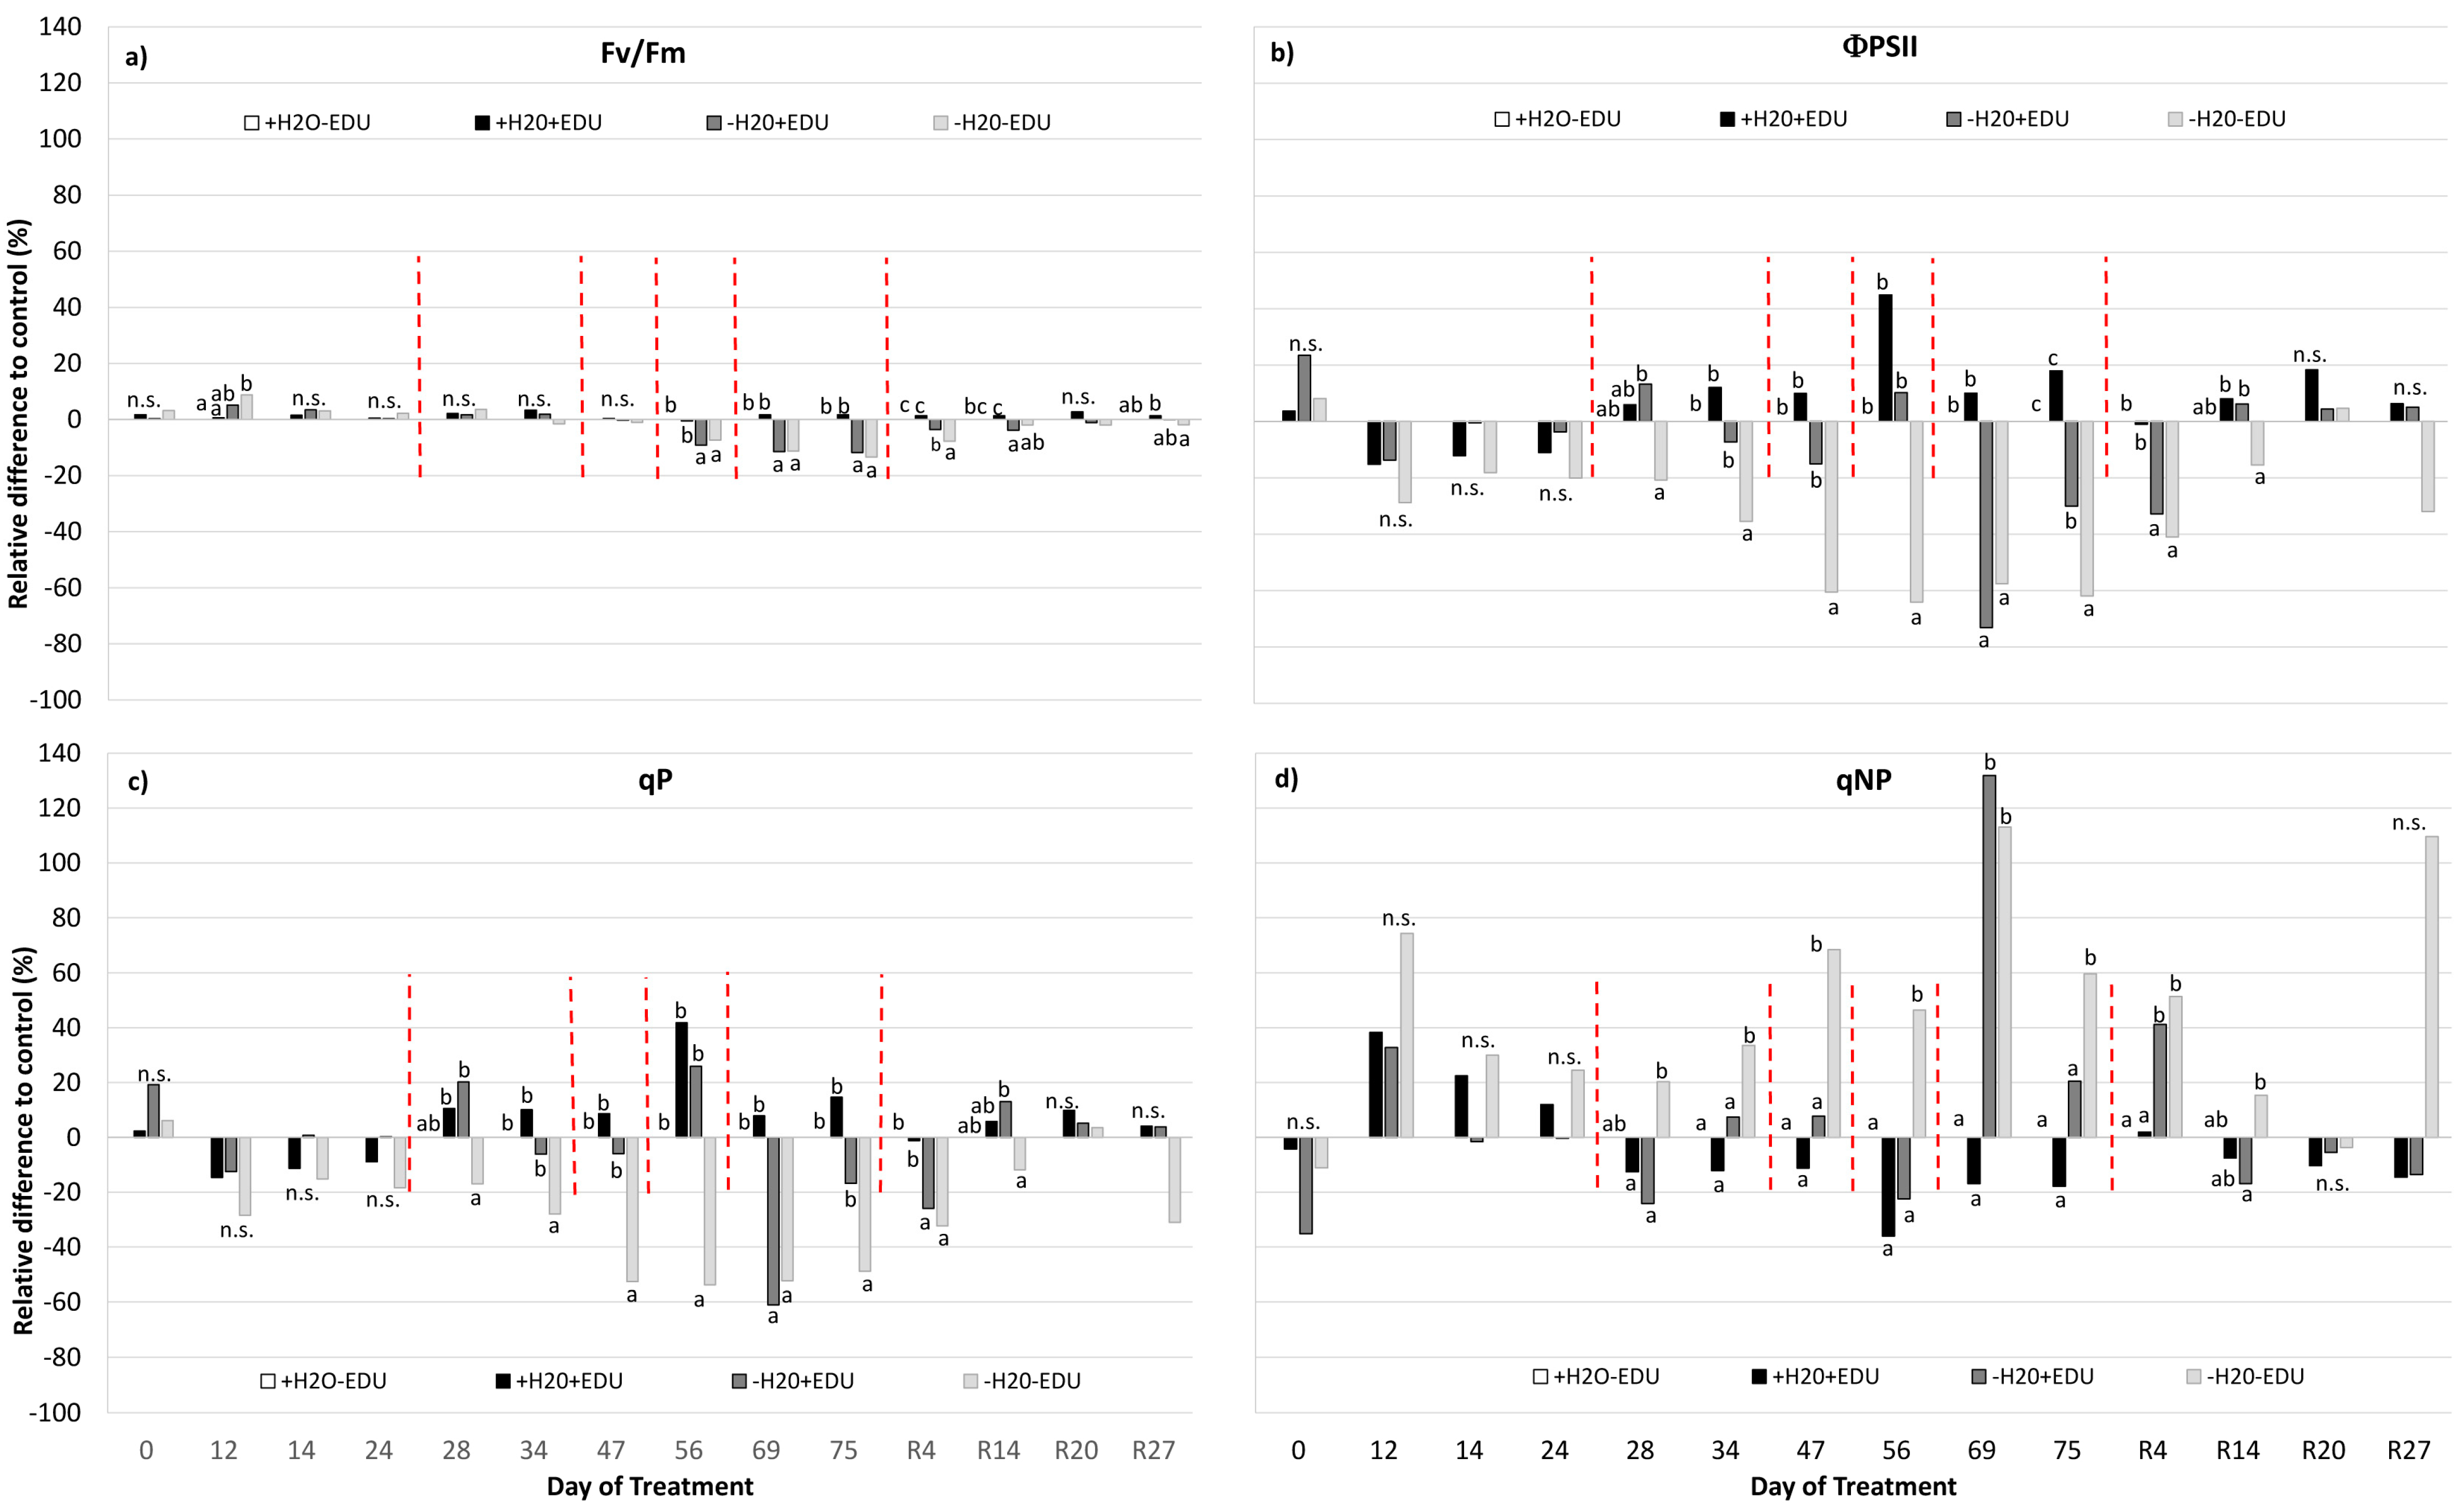
Drought had no significant effects on chlorophyll fluorescence parameters until DOT 34, when ΦPSII, qP and qNP were affected (Figure 4, Table 2, Table S2). Fv/Fm was reduced only when drought conditions were severe (from DOT 56), and in both −H2O−EDU and −H2O+EDU, the decrease in Fv/Fm was less than −15% with respect to the control (Figure 4a, Table S2). Interestingly, during most of the drought period, −H2O−EDU had significantly lower values of ΦPSII and qP and higher qNP than −H2O+EDU (Figure 4b–d, Table S2). This EDU effect was also evident for R14 but, differently from what was observed for gas exchange, no significant difference was evident between sets 20 days after re-watering (R20).
3.4. Principal Component Analysis
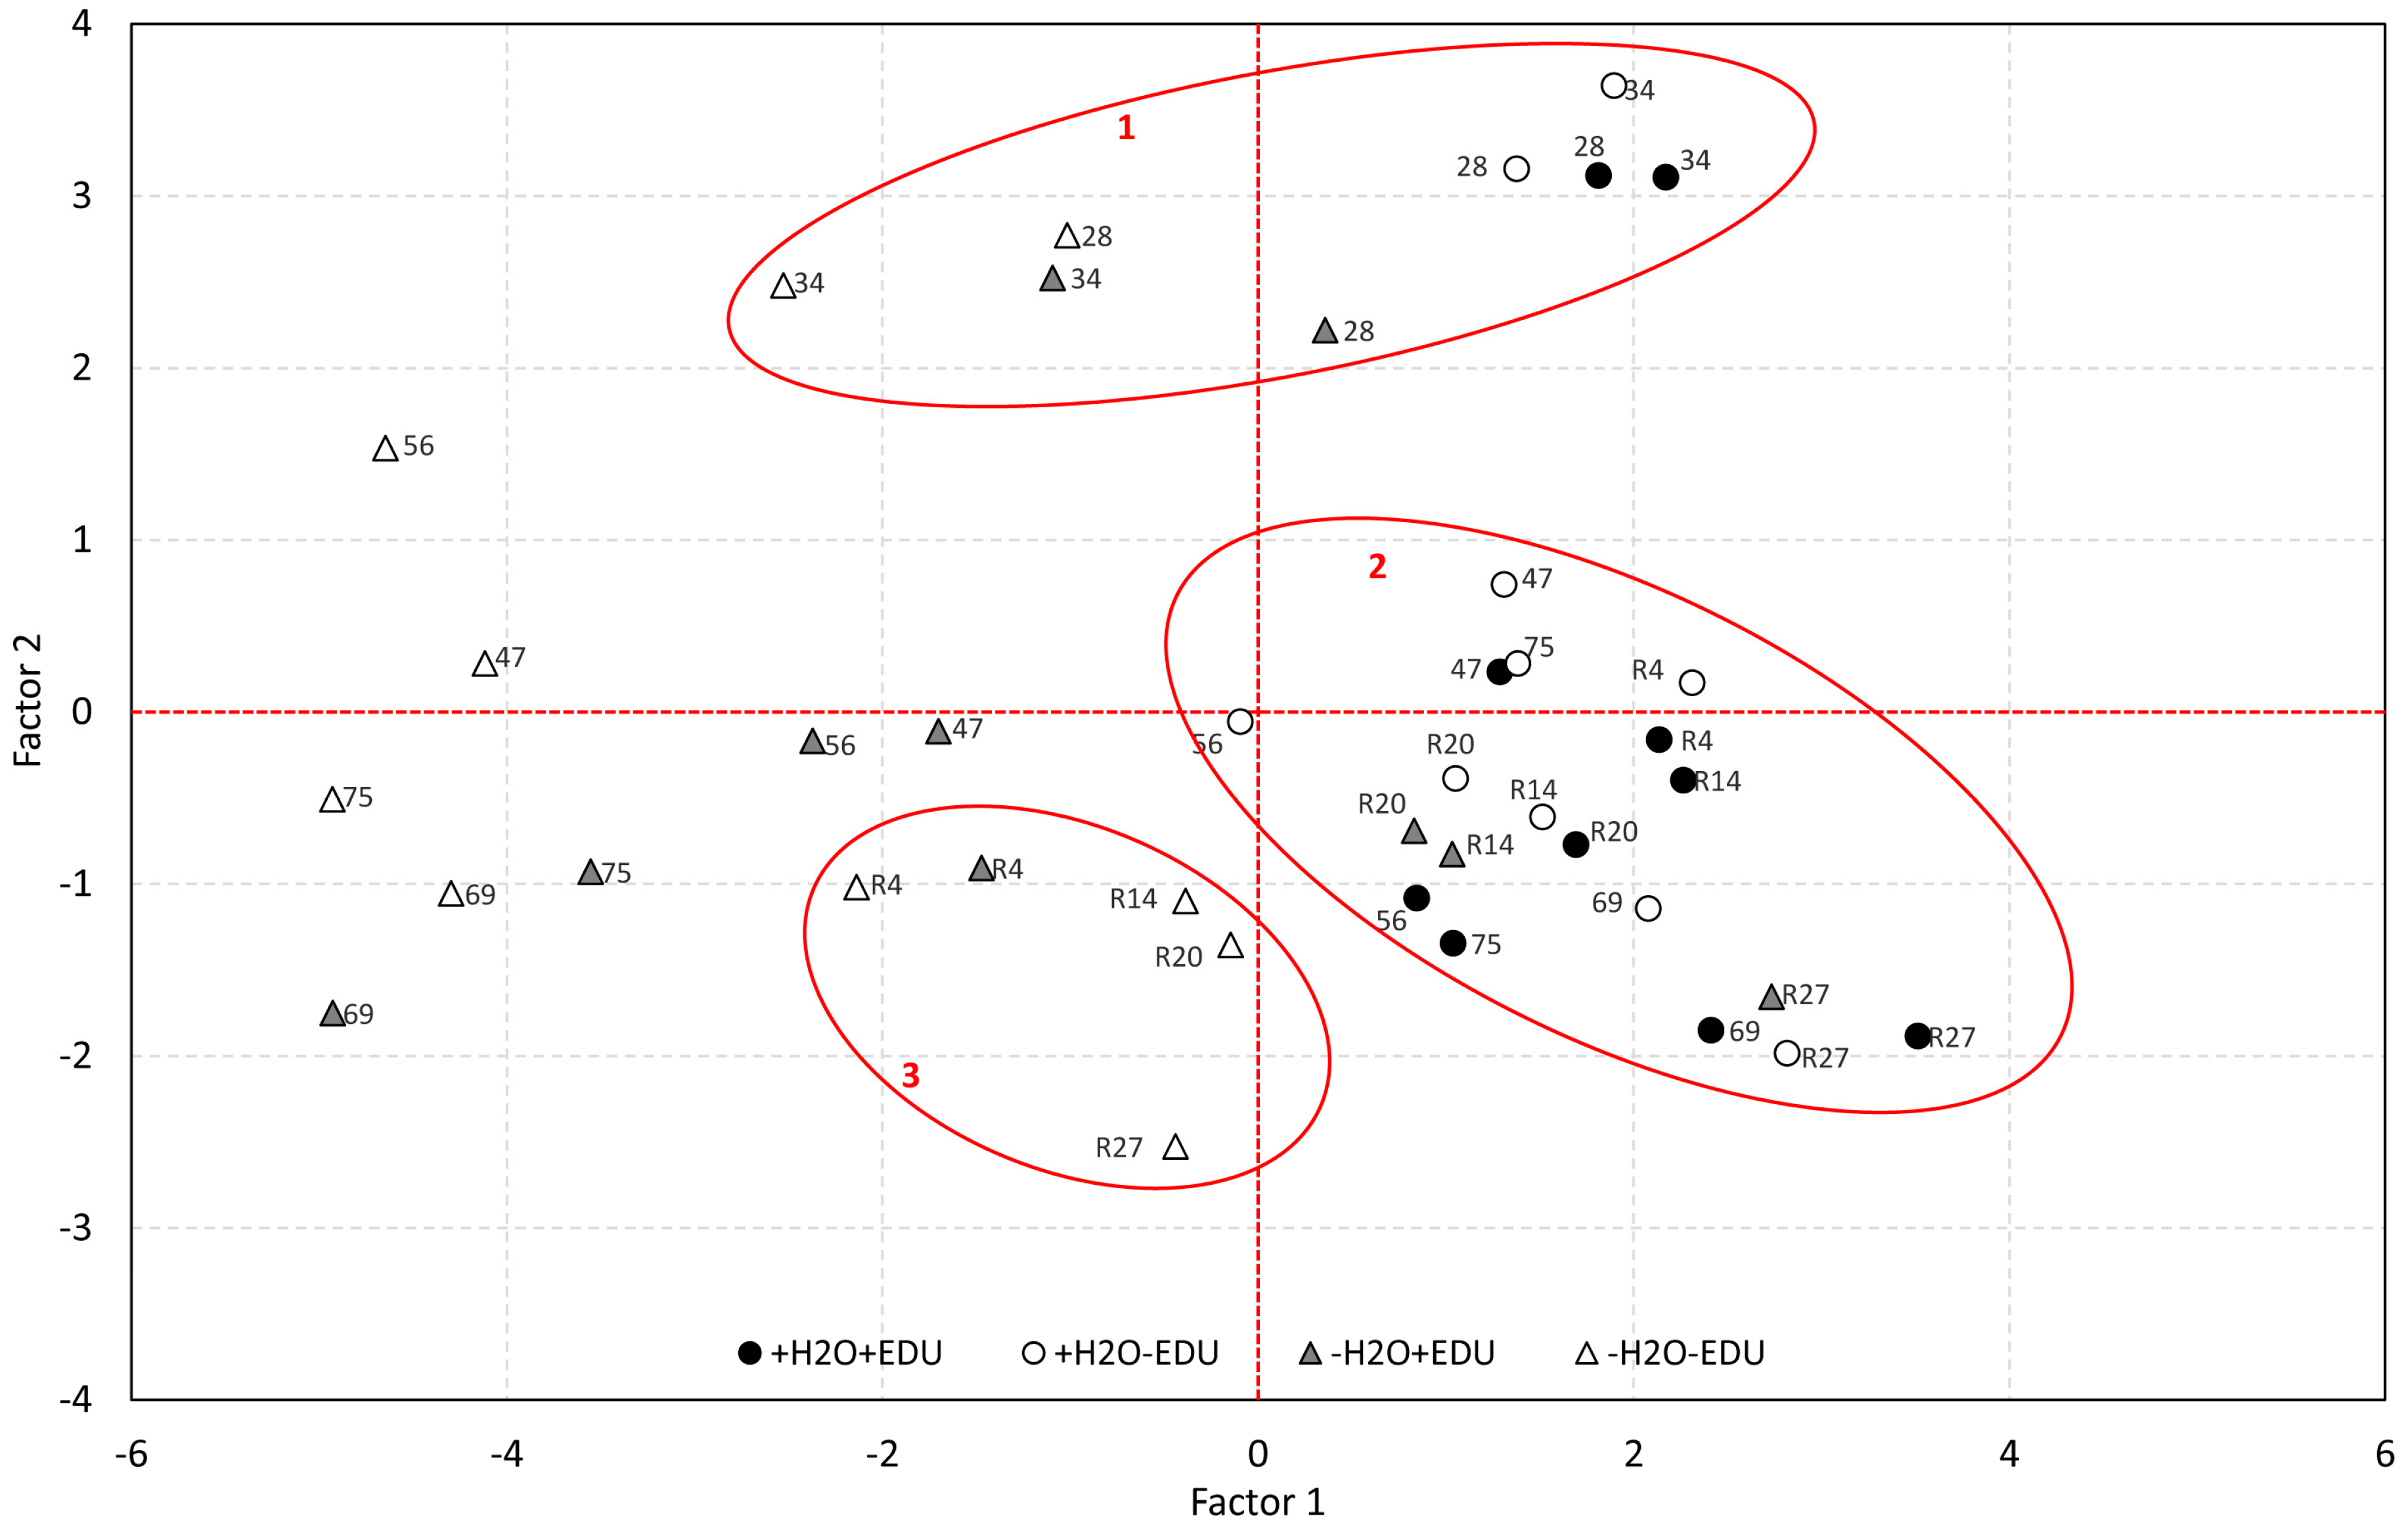
The Principal Component Analysis was performed by pooling together the ecophysiological data, soil water content, AOT40 and maximum daily ozone concentrations, measured from DOT 28, after the beginning of both water stress and EDU treatments, to R27. The number of variables was reduced to two factors, explaining 77.4% of the original variables’ variance (Table 3). Factor 1 accounted for more than 52% of the information of the original variables and was characterized by significant loadings of the ecophysiological parameters (gs, Pn, Fv/Fm, ΦPSII, qP and qNP), as well as by soil water content. By contrast, for Factor 2, more than 25% of the variance was explained by ozone alone, both maximum (O3 Max, negative loading), and cumulated (AOT40, positive loading).
In Figure 5, the two factors are plotted, thus highlighting the separation of data in different groups according to the experimental set and sampling date. Cluster 1 includes all experimental sets on DOT 28 and 34, i.e., the two irrigated sets (+H2O−EDU and +H2O+EDU) and the two water-stressed sets (−H2O−EDU and −H2O+EDU) at the beginning of the drought conditions. A second large cluster (cluster 2) groups the two irrigated experimental sets during August, September and October (DOT 47, 56, 69, 75, R4, R14, R20, R27), as well as R14, R20 and R27 for the −H2O+EDU set, i.e., the dates after re-watering on which this set recovered completely from drought. The August sampling dates (DOT 47, 56, 69, 75) of both drought-stressed sets (−H2O−EDU and −H2O+EDU) instead form a unique group at the lower scores of Factor 1.
Finally, the last cluster (cluster 3) groups R4 for the −H2O+EDU set and all the recovery dates of the −H2O−EDU set (R4, R14, R20, R27), thus confirming the different behavior of the EDU-treated set during recovery from drought. Interestingly, cluster 3 and cluster 2 are located in the same region of Factor 2 (i.e., ozone).
4. Discussion
During the 1990s, many studies applied EDU to prevent O3-induced leaf injury and early senescence in several species, as the use of this chemical was also prescribed in the UNECE/ICP Crops (now ICP Vegetation) biomonitoring protocol [16,21,27,48,49,50]. Lately, EDU has been gradually abandoned due to its high production cost and potential toxicity, which has prevented its commercial, large-scale use [18], as well as criticism raised by uncertainties regarding its mechanism of action. More recently, EDU has been rediscovered, and, although Agathokleous et al. [19] underline the need to better elucidate its mechanism of action by excluding possible confounding factors, many studies have proposed EDU as a research tool per se, to be applied for investigating O3 effects under field conditions [18], and in developing countries [51,52,53]. The effectiveness of EDU for these applications, however, is entirely based on its specificity of action against O3. While it is known since the first experimental tests that EDU does not protect plants from other air pollutants, such as SO2 [54,55], only a few studies have considered the potential interaction between EDU and oxidative stresses naturally occurring under field conditions.
In this experiment, the possible confounding effect of drought stress when using EDU as an O3 protectant was investigated. Despite O3 levels higher than 40 ppb until the end of August, reaching peaks of 120 ppb in mid-July, no O3 effect was detected in well-watered F. ornus plants (both +H2O−EDU and +H2O+EDU), and O3 leaf injury, visually assessed weekly, was absent in both well-watered and water-stressed mesocosms (data not shown). A previous study investigating the O3 response of F. ornus reported that, under field conditions, AOT40 at the onset of injury was 16.7 ppm h [39], which is higher than the maximum value reached at the end of our study (12.7 ppm h). Moreover, although a deciduous species, F. ornus is adapted to the xeric conditions typical of the Mediterranean environment [56,57]; therefore, its O3 sensitivity is expected to be quite moderate, as observed in sclerophyllous species [58]. In the well-watered mesocosms (+H2O sets), PSII photochemistry also confirmed the absence of phytotoxic O3 effects, since chlorophyll fluorescence parameters did not show any O3-induced response [59,60] and did not differ between EDU and non-EDU treated plants. The only physiological difference between +H2O+EDU and +H2O−EDU consisted of a significant reduction of gs and Pn, which was evident in the EDU-treated plants at DOT 75 only, 8 days after the fourth EDU application. The effect of EDU on stomatal conductance is controversial: some studies have found that EDU reduced gs of treated plants, thus limiting stomatal O3 uptake [33,61]; other studies reported increased gs as a consequence of EDU applications [23,62]; finally, many experiments have highlighted that EDU has no effect on stomatal conductance [17]. In this regard, Agathokleous [25] highlighted the need to conduct measurements over narrow-spaced time intervals, in order to highlight potential EDU effects on gs. Our results seem to confirm that the protective mechanism of EDU is not based on the reduction of stomatal O3 uptake since, despite gas exchanges being sampled over time after EDU applications, no clear gs response to EDU was highlighted.
A significant effect of EDU was instead evident in the water-stressed mescosms. A higher photochemical efficiency (ΦPSII), photochemical quenching (qP) and, consequently, lower values of qNP, were in fact measured in −H2O+EDU with respect to −H2O−EDU, during the early phase of the water shortage (from DOT 24 until DOT 56), when O3 levels were also high. It is known that EDU affects chlorophyll fluorescence parameters in different ways: Yuan et al. [24] highlighted that EDU is able to protect the photosynthetic apparatus from phytotoxic O3 effects, maintaining high ΦPSII and qP, while other studies [19,25,63] showed that EDU per se can affect photosynthetic efficiency through a stimulatory effect, thus concluding that the EDU mode of action involves PSII response. In our case, we can argue that EDU was able to mitigate the synergic effects of drought and O3, possibly by reducing the oxidative pressure caused by the interaction of the two stresses. In fact, although drought is known to protect plants from O3 by inducing stomatal closure [11,59], recent studies have highlighted that, under certain conditions, drought can instead increase plant sensitivity to O3 [13], particularly if it occurs later in the season, after O3 uptake during spring [14]. It has frequently been reported that EDU is able to ameliorate oxidative stress through different mechanisms, involving the inhibition of Reactive Oxygen Species (ROS) production [64] or the enhancement of both enzymatic and non-enzymatic ROS-scavenging mechanisms [17,35,53]. In particular, EDU has been reported to support the ascorbate-glutathione cycle (or Halliwell-Asada cycle), which involves apoplastic ascorbate peroxidase (APX) and symplastic glutathione reductase (GR) [65]. This cycle constitutes the primary H2O2-detoxification mechanism, thus playing a fundamental role not only in the response to O3 but also to other oxidative stress factors, such as drought [66].
During the recovery from drought, i.e., after 14 days from the re-irrigation of the drought-stressed mesocosms (22 September), the amelioration effect of EDU was instead evident in the gas exchange of the −H2O+EDU set. The PCA, performed by pooling together the ecophysiological data, soil water content, AOT40 and maximum daily ozone concentrations, also highlighted that, at recovery, water-stressed, EDU-treated plants were included in the same cluster as the well-watered plants, whereas water-stressed non-EDU-treated plants formed a distinct cluster. Considering that O3 levels in September were low, it seems unlikely that EDU protected plants from the O3 absorbed after the partial re-opening of stomata that followed re-watering. Since it is known that the recovery of assimilation rate from severe drought is linked to plants’ ability to reverse the drought-induced accumulation of ROS, particularly H2O2 [67], we can attribute this effect to the previously described capacity of EDU to support different ROS-scavenging mechanisms in leaves, such as the Halliwell-Asada cycle. Therefore, although we cannot identify whether such oxidative burst was generated by the synergic effect of O3 and drought, or by severe drought alone, our results suggest the capability of EDU to interact with other oxidative stress factors besides O3. This supports the results obtained by Middleton et al. [68] and Albert et al. [37], who demonstrated that, in the absence of O3, EDU substantially ameliorated UV-B damage caused to foliage in soybean and birch, thus highlighting the need to better investigate the possible confounding effect of such abiotic stress factors, before using EDU as an O3 protectant in the field.
5. Conclusions
This study highlighted that: (1) The mode of action of EDU does not imply a decreased O3 uptake through a reduction of stomatal conductance and (2) EDU is able to ameliorate stress conditions in drought-stressed plants, possibly by regulating ROS production at cellular level through the enhancement of both enzymatic and non-enzymatic antioxidant mechanisms. Although in our experiment it was not possible to distinguish whether the oxidative pressure ameliorated by EDU was caused by severe drought alone or by the synergic effect of drought and ambient O3, our results suggest that caution should be taken when applying EDU in the estimation of O3 effects under field conditions. In the field, multiple oxidative stresses can simultaneously affect plant physiology and can have different interactive effects, synergic or antagonistic. Under such conditions, the specificity of a protective antioxidant such as EDU should be further evaluated by considering other naturally occurring oxidative stresses, such as, drought, in order to avoid possible overestimation of ambient O3 risk, particularly in drought-prone environments such as the Mediterranean area. Further research testing the effect of EDU on different species subjected to severe drought conditions, alone and in combination with O3, is therefore needed, before the reliable application of EDU as a research tool for O3 under natural field conditions.
Supplementary Materials
The following are available online at www.mdpi.com/1999-4907/8/9/320/s1, Figure S1: (a) Photosynthetic active radiation (PAR, mmol photons m−2 s−1); (b) relative air humidity (RH, %); (c) Vapour Pressure Difference between leaf and air (VPD, mbar); (d) cuvette air temperature (Tcuv, °C), simultaneously measured with leaf-level gas exchanges. Vertical red dashed bars indicate the dates in which the EDU treatments were applied. On the horizontal axis, the Day of Treatment is reported (0–75 = days from the last irrigation and R4, R14, R20, R27, days from rewatering of the water stressed mesocosms). For each measurement date, data are expressed as mean ± Standard Error (9 < N < 30, see Supplementary Table S1), Figure S2: (a) Net photosynthesis (Pn, mmol CO2 m−2 s−1); (b) stomatal conductance (gs, mmol H2O m−2 s−1); (c) Ci/Ca ratio (dimensionless); (d) leaf transpiration (E, mmol H2O m−2 s−1), measured during the experimental period. Vertical red dashed bars indicate the dates in which the EDU treatments were applied. On the horizontal axis, the Day of Treatment is reported (0–75 = days from the last irrigation and R4, R14, R20, R27, days from rewatering of the water stressed mesocosms). For each measurement date, data are expressed as mean ± Standard Error (9 < N < 30, see Supplementary Table S1), Table S1: Average ± SE values of gas exchanges (Figure 3, Figure S2) and chlorophyll fluorescence parameters (Figure 4). For each sampling date and experimental set, the number of observations (N) is also reported.
Acknowledgments
This research was funded by Sapienza Ateneo Grants, in 2015 and 2016.
Author Contributions
F.M. and E.S. conceived and designed the experiment; E.S. and L.F. performed the experiment; E.S. analyzed the data; E.S. wrote the paper, and F.M. and L.F. revised it critically for important intellectual content. All authors have read and approved the final manuscript after minor modifications.
Conflicts of Interest
The authors declare no conflict of interest.
References
- Ainsworth, E.A. Understanding and improving global crop response to ozone pollution. Plant J. 2017, 90, 886–897. [Google Scholar] [CrossRef] [PubMed]
- Simpson, D.; Arneth, A.; Mills, G.; Solberg, S.; Uddling, J. Ozone—The persistent menace: Interactions with the N cycle and climate change. Curr. Opin. Environ. Sustain. 2014, 9–10, 9–19. [Google Scholar] [CrossRef] [Green Version]
- Karnosky, D.F.; Skelly, J.M.; Percy, K.E.; Chappelka, A.H. Perspectives regarding 50 years of research on effects of tropospheric ozone air pollution on US forests. Environ. Pollut. 2007, 147, 489–506. [Google Scholar] [CrossRef] [PubMed]
- Ainsworth, E.A.; Yendrek, C.R.; Sitch, S.; Collins, W.J.; Emberson, L.D. The Effects of Tropospheric Ozone on Net Primary Productivity and Implications for Climate Change. Annu. Rev. Plant Biol. 2012, 63, 637–661. [Google Scholar] [CrossRef] [PubMed]
- Ferretti, M.; Fagnano, M.; Amoriello, T.; Badiani, M.; Ballarin-Denti, A.; Buffoni, A.; Bussotti, F.; Castagna, A.; Cieslik, S.; Costantini, A.; et al. Measuring, modelling and testing ozone exposure, flux and effects on vegetation in southern European conditions—What does not work? A review from Italy. Environ. Pollut. 2007, 146, 648–658. [Google Scholar] [CrossRef] [PubMed]
- Fares, S.; Savi, F.; Muller, J.; Matteucci, G.; Paoletti, E. Simultaneous measurements of above and below canopy ozone fluxes help partitioning ozone deposition between its various sinks in a Mediterranean Oak Forest. Agric. For. Meteorol. 2014, 198–199, 181–191. [Google Scholar] [CrossRef]
- Mereu, S.; Gerosa, G.; Marzuoli, R.; Fusaro, L.; Salvatori, E.; Finco, A.; Spano, D.; Manes, F. Gas exchange and JIP-test parameters of two Mediterranean maquis species are affected by sea spray and ozone interaction. Environ. Exp. Bot. 2011, 73, 80–88. [Google Scholar] [CrossRef]
- Bussotti, F.; Ferrini, F.; Pollastrini, M.; Fini, A. The challenge of Mediterranean sclerophyllous vegetation under climate change: From acclimation to adaptation. Environ. Exp. Bot. 2014, 103, 80–98. [Google Scholar] [CrossRef]
- Fusaro, L.; Salvatori, E.; Manes, F. Effects of nitrogen deposition, drought and their interaction, on functional and structural traits of Fraxinus ornus L. and Quercus ilex L. Plant Biosyst. Int. J. Deal. Asp. Plant Biol. 2017, 151, 174–189. [Google Scholar] [CrossRef]
- Salvatori, E.; Fusaro, L.; Manes, F. Chlorophyll fluorescence for phenotyping drought stressed trees in a mixed deciduous forest. Ann. Bot. 2016, 6, 39–49. [Google Scholar] [CrossRef]
- Manes, F.; Vitale, M.; Maria Fabi, A.; De Santis, F.; Zona, D. Estimates of potential ozone stomatal uptake in mature trees of Quercus ilex in a Mediterranean climate. Environ. Exp. Bot. 2007, 59, 235–241. [Google Scholar] [CrossRef]
- Kühn, A.R.; Grill, S.; Baumgarten, M.; Ankerst, D.P.; Matyssek, R. Daily growth of European beech (Fagus sylvatica L.) on moist sites is affected by short-term drought rather than ozone uptake. Trees 2015, 29, 1501–1519. [Google Scholar] [CrossRef]
- Alonso, R.; Elvira, S.; González-Fernández, I.; Calvete, H.; García-Gómez, H.; Bermejo, V. Drought stress does not protect Quercus ilex L. from ozone effects: Results from a comparative study of two subspecies differing in ozone sensitivity. Plant Biol. 2014, 16, 375–384. [Google Scholar] [CrossRef] [PubMed]
- Pollastrini, M.; Desotgiu, R.; Camin, F.; Ziller, L.; Gerosa, G.; Marzuoli, R.; Bussotti, F. Severe drought events increase the sensitivity to ozone on poplar clones. Environ. Exp. Bot. 2014, 100, 94–104. [Google Scholar] [CrossRef]
- Cotrozzi, L.; Remorini, D.; Pellegrini, E.; Landi, M.; Massai, R.; Nali, C.; Guidi, L.; Lorenzini, G. Variations in physiological and biochemical traits of oak seedlings grown under drought and ozone stress. Physiol. Plant. 2016, 157, 69–84. [Google Scholar] [CrossRef] [PubMed]
- Paoletti, E.; Contran, N.; Manning, W.J.; Ferrara, A.M. Use of the antiozonant ethylenediurea (EDU) in Italy: Verification of the effects of ambient ozone on crop plants and trees and investigation of EDU′s mode of action. Environ. Pollut. 2009, 157, 1453–1460. [Google Scholar] [CrossRef] [PubMed]
- Feng, Z.; Wang, S.; Szantoi, Z.; Chen, S.; Wang, X. Protection of plants from ambient ozone by applications of ethylenediurea (EDU): A meta-analytic review. Environ. Pollut. 2010, 158, 3236–3242. [Google Scholar] [CrossRef] [PubMed]
- Manning, W.J.; Paoletti, E.; Sandermann, H., Jr.; Ernst, D. Ethylenediurea (EDU): A research tool for assessment and verification of the effects of ground level ozone on plants under natural conditions. Environ. Pollut. 2011, 159, 3283–3293. [Google Scholar] [CrossRef] [PubMed]
- Agathokleous, E.; Koike, T.; Watanabe, M.; Hoshika, Y.; Saitanis, C.J. Ethylene-di-urea (EDU), an effective phytoproctectant against O3 deleterious effects and a valuable research tool. J. Agric. Meteorol. 2015, 71, 185–195. [Google Scholar] [CrossRef]
- Carnhan, J.E.; Jenner, E.L.; Wat, E.K.W. Prevention of Ozone Injury to Plants by a New Protectant Chemical. Phytopathology 1978, 68, 1225–1229. [Google Scholar] [CrossRef]
- Manes, F.; Altieri, A.; Tripodo, P.; Booth, C.E.; Unsworth, M.H. Bioindication study of effects of ambient ozone on tobacco and radish plants using a protectant chemical (EDU). Ann. Bot. 1990, 48, 133–149. [Google Scholar]
- Astorino, G.; Margani, I.; Tripodo, P.; Manes, F. The response of Phaseolus vulgaris L. cv. Lit. to different dosages of the anti-ozonant ethylenediurea (EDU) in relation to chronic treatment with ozone. Plant Sci. 1995, 111, 237–248. [Google Scholar] [CrossRef]
- Tiwari, S.; Agrawal, M. Effectiveness of different EDU concentrations in ameliorating ozone stress in carrot plants. Ecotoxicol. Environ. Saf. 2010, 73, 1018–1027. [Google Scholar] [CrossRef] [PubMed]
- Yuan, X.; Calatayud, V.; Jiang, L.; Manning, W.J.; Hayes, F.; Tian, Y.; Feng, Z. Assessing the effects of ambient ozone in China on snap bean genotypes by using ethylenediurea (EDU). Environ. Pollut. 2015, 205, 199–208. [Google Scholar] [CrossRef] [PubMed]
- Agathokleous, E. Perspectives for elucidating the ethylenediurea (EDU) mode of action for protection against O3 phytotoxicity. Ecotoxicol. Environ. Saf. 2017, 142, 530–537. [Google Scholar] [CrossRef] [PubMed]
- Long, R.P.; Davis, D.D. Black cherry growth response to ambient ozone and EDU. Environ. Pollut. 1991, 70, 241–254. [Google Scholar] [CrossRef]
- Ainsworth, N.; Ashmore, M.R. Assessment of ozone effects on beech (Fagus sylvatica) by injection of a protectant chemical. For. Ecol. Manag. 1992, 51, 129–136. [Google Scholar] [CrossRef]
- Contran, N.; Poletti, E.; Manning, W.J.; Tagliaferro, F. Ozone sensitivity and ethylenediurea protection in ash trees assessed by JIP chlorophyll a fluorescence transient analysis. Photosynthetica 2009, 47, 68–78. [Google Scholar] [CrossRef]
- Basahi, J.M.; Ismail, I.M.; Haiba, N.S.; Hassan, I.A.; Lorenzini, G. Assessing ambient ozone injury in olive (Olea europaea L.) plants by using the antioxidant ethylenediurea (EDU) in Saudi Arabia. Environ. Monit. Assess. 2016, 188, 371. [Google Scholar] [CrossRef] [PubMed]
- Agathokleous, E.; Paoletti, E.; Saitanis, C.J.; Manning, W.J.; Sugai, T.; Koike, T. Impacts of ethylenediurea (EDU) soil drench and foliar spray in Salix sachalinensis protection against O3-induced injury. Sci. Total Environ. 2016, 573, 1053–1062. [Google Scholar] [CrossRef] [PubMed]
- Agathokleous, E.; Paoletti, E.; Saitanis, C.J.; Manning, W.J.; Shi, C.; Koike, T. High doses of ethylene diurea (EDU) are not toxic to willow and act as nitrogen fertilizer. Sci. Total Environ. 2016, 566–567, 841–850. [Google Scholar] [CrossRef] [PubMed]
- Gatta, L.; Mancino, L.; Federico, R. Translocation and persistence of EDU (ethylenediurea) in plants: The relationship with its role in ozone damage. Environ. Pollut. 1997, 96, 445–448. [Google Scholar] [CrossRef]
- Paoletti, E.; Contran, N.; Manning, W.J.; Castagna, A.; Ranieri, A.; Tagliaferro, F. Protection of ash (Fraxinus excelsior) trees from ozone injury by ethylenediurea (EDU): Roles of biochemical changes and decreased stomatal conductance in enhancement of growth. Environ. Pollut. 2008, 155, 464–472. [Google Scholar] [CrossRef] [PubMed]
- Hassan, I.A. Physiological and biochemical response of potato (Solanum tuberosum L. cv. Kara) to O3 and antioxidant chemicals: Possible roles of antioxidant enzymes. Ann. Appl. Biol. 2006, 148, 197–206. [Google Scholar] [CrossRef]
- Pandey, A.K.; Majumder, B.; Keski-Saari, S.; Kontunen-Soppela, S.; Pandey, V.; Oksanen, E. Differences in responses of two mustard cultivars to ethylenediurea (EDU) at high ambient ozone concentrations in India. Agric. Ecosyst. Environ. 2014, 196, 158–166. [Google Scholar] [CrossRef]
- Pandey, A.K.; Majumder, B.; Keski-Saari, S.; Kontunen-Soppela, S.; Mishra, A.; Sahu, N.; Pandey, V.; Oksanen, E. Searching for common responsive parameters for ozone tolerance in 18 rice cultivars in India: Results from ethylenediurea studies. Sci. Total Environ. 2015, 532, 230–238. [Google Scholar] [CrossRef] [PubMed]
- Albert, K.R.; Mikkelsen, T.N.; Ro-Poulsen, H.; Arndal, M.F.; Boesgaard, K.; Michelsen, A.; Bruhn, D.; Schmidt, N.M. Solar UV-B effects on PSII performance in Betula nana are influenced by PAR level and reduced by EDU: Results of a 3-year experiment in the High Arctic. Physiol. Plant. 2012, 145, 485–500. [Google Scholar] [CrossRef] [PubMed]
- Xin, Y.; Yuan, X.; Shang, B.; Manning, W.J.; Yang, A.; Wang, Y.; Feng, Z. Moderate drought did not affect the effectiveness of ethylenediurea (EDU) in protecting Populus cathayana from ambient ozone. Sci. Total Environ. 2016, 569–570, 1536–1544. [Google Scholar] [CrossRef] [PubMed]
- Paoletti, E.; Contran, N.; Bernasconi, P.; Günthardt-Goerg, M.S.; Vollenweider, P. Erratum to “Structural and physiological responses to ozone in Manna ash (Fraxinus ornus L.) leaves of seedlings and mature trees under controlled and ambient conditions”. Sci. Total Environ. 2010, 408, 2014–2024. [Google Scholar] [CrossRef] [PubMed]
- Fini, A.; Guidi, L.; Ferrini, F.; Brunetti, C.; Di Ferdinando, M.; Biricolti, S.; Pollastri, S.; Calamai, L.; Tattini, M. Drought stress has contrasting effects on antioxidant enzymes activity and phenylpropanoid biosynthesis in Fraxinus ornus leaves: An excess light stress affair? J. Plant Physiol. 2012, 169, 929–939. [Google Scholar] [CrossRef] [PubMed]
- Tretiach, M. Photosynthesis and transpiration of evergreen Mediterranean and deciduous trees in an ecotone during a growing season. Acta Oecol. 1993, 14, 341–360. [Google Scholar]
- Mills, G.; Hayes, F.; Simpson, D.; Emberson, L.; Norris, D.; Harmens, H.; Büker, P. Evidence of widespread effects of ozone on crops and (semi-)natural vegetation in Europe (1990–2006) in relation to AOT40- and flux-based risk maps. Glob. Change Biol. 2011, 17, 592–613. [Google Scholar] [CrossRef] [Green Version]
- Jones, H.G. Monitoring plant and soil water status: Established and novel methods revisited and their relevance to studies of drought tolerance. J. Exp. Bot. 2007, 58, 119–130. [Google Scholar] [CrossRef] [PubMed]
- Carriero, G.; Emiliani, G.; Giovannelli, A.; Hoshika, Y.; Manning, W.J.; Traversi, M.L.; Paoletti, E. Effects of long-term ambient ozone exposure on biomass and wood traits in poplar treated with ethylenediurea (EDU). Environ. Pollut. 2015, 206, 575–581. [Google Scholar] [CrossRef] [PubMed]
- Hoshika, Y.; Pecori, F.; Conese, I.; Bardelli, T.; Marchi, E.; Manning, W.J.; Badea, O.; Paoletti, E. Effects of a three-year exposure to ambient ozone on biomass allocation in poplar using ethylenediurea. Environ. Pollut. 2013, 180, 299–303. [Google Scholar] [CrossRef] [PubMed]
- Genty, B.; Briantais, J.-M.; Baker, N.R. The relationship between the quantum yield of photosynthetic electron transport and quenching of chlorophyll fluorescence. Biochim. Biophys. Acta Gen. Subj. 1989, 990, 87–92. [Google Scholar] [CrossRef]
- ICP Vegetation. Chapter III: Mapping critical levels for vegetation. In Manual on Methodologies and Criteria for Modelling and Mapping Critical Loads and Levels and Air Pollution Effects, Risks and Trends; Umweltbundesamt: Dessau-Roßlau, Germany, 2017. [Google Scholar]
- Tonneijck, A.E.G.; Van Dijk, C.J. Effects of ambient ozone on injury and yield of Phaseolus vulgaris at four rural sites in the Netherlands as assessed by using ethylenediurea (EDU). New Phytol. 1997, 135, 93–100. [Google Scholar] [CrossRef]
- Kostka-Rick, R.; Manning, W.J. Dose-response studies with ethylenediurea (EDU) and radish. Environ. Pollut. 1993, 79, 249–260. [Google Scholar] [CrossRef]
- Mills, G.; Benton, J.; Skärby, L.; Fuhrer, J.; Gimeno, B. ICP Vegetation Experimental Protocol for the ICP-CROPS; ICP-CROPS Coordination Centre, The Nottingham Trent University: Nottingham, UK, 1997; p. 47. [Google Scholar]
- Oksanen, E.; Pandey, V.; Pandey, A.K.; Keski-Saari, S.; Kontunen-Soppela, S.; Sharma, C. Impacts of increasing ozone on Indian plants. Environ. Pollut. 2013, 177, 189–200. [Google Scholar] [CrossRef] [PubMed]
- Agathokleous, E.; Koike, T.; Saitanis, J.C.; Watanabe, M.; Satoh, F.; Hoshika, Y. Ethylenediurea (EDU) as a protectant of plants against O3. Eurasian J. For. Res. 2015, 18, 37–50. [Google Scholar]
- Tiwari, S. Ethylenediurea as a potential tool in evaluating ozone phytotoxicity: A review study on physiological, biochemical and morphological responses of plants. Environ. Sci. Pollut. Res. 2017, 24, 14019–14039. [Google Scholar] [CrossRef] [PubMed]
- Pandey, J.; Agrawal, M. Protection of Plants against Air Pollutants: Role of Chemical Protectants. J. Environ. Manag. 1993, 37, 163–174. [Google Scholar] [CrossRef]
- Lee, E.H.; Kramer, G.F.; Rowland, R.A.; Agrawal, M. Antioxidants and growth regulators counter the effects of O3 and SO2 in crop plants. Agric. Ecosyst. Environ. 1992, 38, 99–106. [Google Scholar] [CrossRef]
- Nardini, A.; Salleo, S.; Trifilò, P.; Gullo, M.A.L. Water relations and hydraulic characteristics of three woody species co-occurring in the same habitat. Ann. For. Sci. 2003, 60, 297–305. [Google Scholar] [CrossRef]
- Gortan, E.; Nardini, A.; Gascó, A.; Salleo, S. The hydraulic conductance of Fraxinus ornus leaves is constrained by soil water availability and coordinated with gas exchange rates. Tree Physiol. 2009, 29, 529–539. [Google Scholar] [CrossRef] [PubMed]
- Nali, C.; Paoletti, E.; Marabottini, R.; Della Rocca, G.; Lorenzini, G.; Paolacci, A.R.; Ciaffi, M.; Badiani, M. Ecophysiological and biochemical strategies of response to ozone in Mediterranean evergreen broadleaf species. Atmos. Environ. 2004, 38, 2247–2257. [Google Scholar] [CrossRef]
- Vitale, M.; Salvatori, E.; Loreto, F.; Fares, S.; Manes, F. Physiological responses of Quercus ilex Leaves to Water Stress and Acute Ozone Exposure under Controlled Conditions. Water Air Soil Pollut. 2008, 189, 113–125. [Google Scholar] [CrossRef]
- Pellegrini, E.; Francini, A.; Lorenzini, G.; Nali, C. PSII photochemistry and carboxylation efficiency in Liriodendron tulipifera under ozone exposure. Environ. Exp. Bot. 2011, 70, 217–226. [Google Scholar] [CrossRef]
- Agrawal, S.B.; Agrawal, M. Low-temperature scanning electron microscope studies of stomatal responses in snap bean plants treated with ozone and ethylenediurea. Biotronics. 1999, 28, 45–53. [Google Scholar]
- Singh, S.; Agrawal, S.B.; Agrawal, M. Differential protection of ethylenediurea (EDU) against ambient ozone for five cultivars of tropical wheat. Environ. Pollut. 2009, 157, 2359–2367. [Google Scholar] [CrossRef] [PubMed]
- Agathokleous, E.; Mouzaki-Paxinou, A.-C.; Saitanis, C.J.; Paoletti, E.; Manning, W.J. The first toxicological study of the antiozonant and research tool ethylene diurea (EDU) using a Lemna minor L. bioassay: Hints to its mode of action. Environ. Pollut. 2016, 213, 996–1006. [Google Scholar] [CrossRef] [PubMed]
- Paoletti, E.; Castagna, A.; Ederli, L.; Pasqualini, S.; Ranieri, A.; Manning, W.J. Gene expression in snapbeans exposed to ozone and protected by ethylenediurea. Environ. Pollut. 2014, 193, 1–5. [Google Scholar] [CrossRef] [PubMed]
- Foyer, C.H.; Halliwell, B. The presence of glutathione and glutathione reductase in chloroplasts: A proposed role in ascorbic acid metabolism. Planta 1976, 133, 21–25. [Google Scholar] [CrossRef] [PubMed]
- Miller, G.; Suzuki, N.; Ciftci-Yilmaz, S.; Mittler, R. Reactive oxygen species homeostasis and signalling during drought and salinity stresses. Plant Cell Environ. 2010, 33, 453–467. [Google Scholar] [CrossRef] [PubMed]
- Xu, Z.; Zhou, G.; Shimizu, H. Plant responses to drought and rewatering. Plant Signal. Behav. 2010, 5, 649–654. [Google Scholar] [CrossRef] [PubMed]
- Middleton, E.M.; Kim, M.S.; Krizek, D.T.; Bajwa, R.K.S. Evaluating UV-B Effects and EDU Protection in Soybean Leaves Using Fluorescence. Photochem. Photobiol. 2005, 81, 1075–1085. [Google Scholar] [CrossRef] [PubMed]
Figure 1.
Meteorological conditions and ozone levels during the experimental period (from 1 June to 5 October 2006). (a) Daily values of air temperature (mean, Tmean; maximum, Tmax, and minimum, Tmin, °C) and rainfall (P, mm); (b) Accumulated exposure Over the Threshold of 40 ppb (AOT40), accumulated over the experimental period (ppm h), and hourly O3 maximum (ppb) measured during daylight hours. Vertical red bars indicate the extent of the experimental drought period (from 16 June to 8 September).

Figure 2.
Soil water content (SWC, %), measured in the first 10 cm during the experimental period, in the irrigated (+H2O) and water-stressed (−H2O) mesocosms of Fraxinus ornus. On the horizontal axis, the Day of Treatment (DOT) is reported (0–84 = days from the last irrigation and R4, R20, R27, days from re-watering of the water-stressed mesocosms). Data are means ± S.D., N = 6.
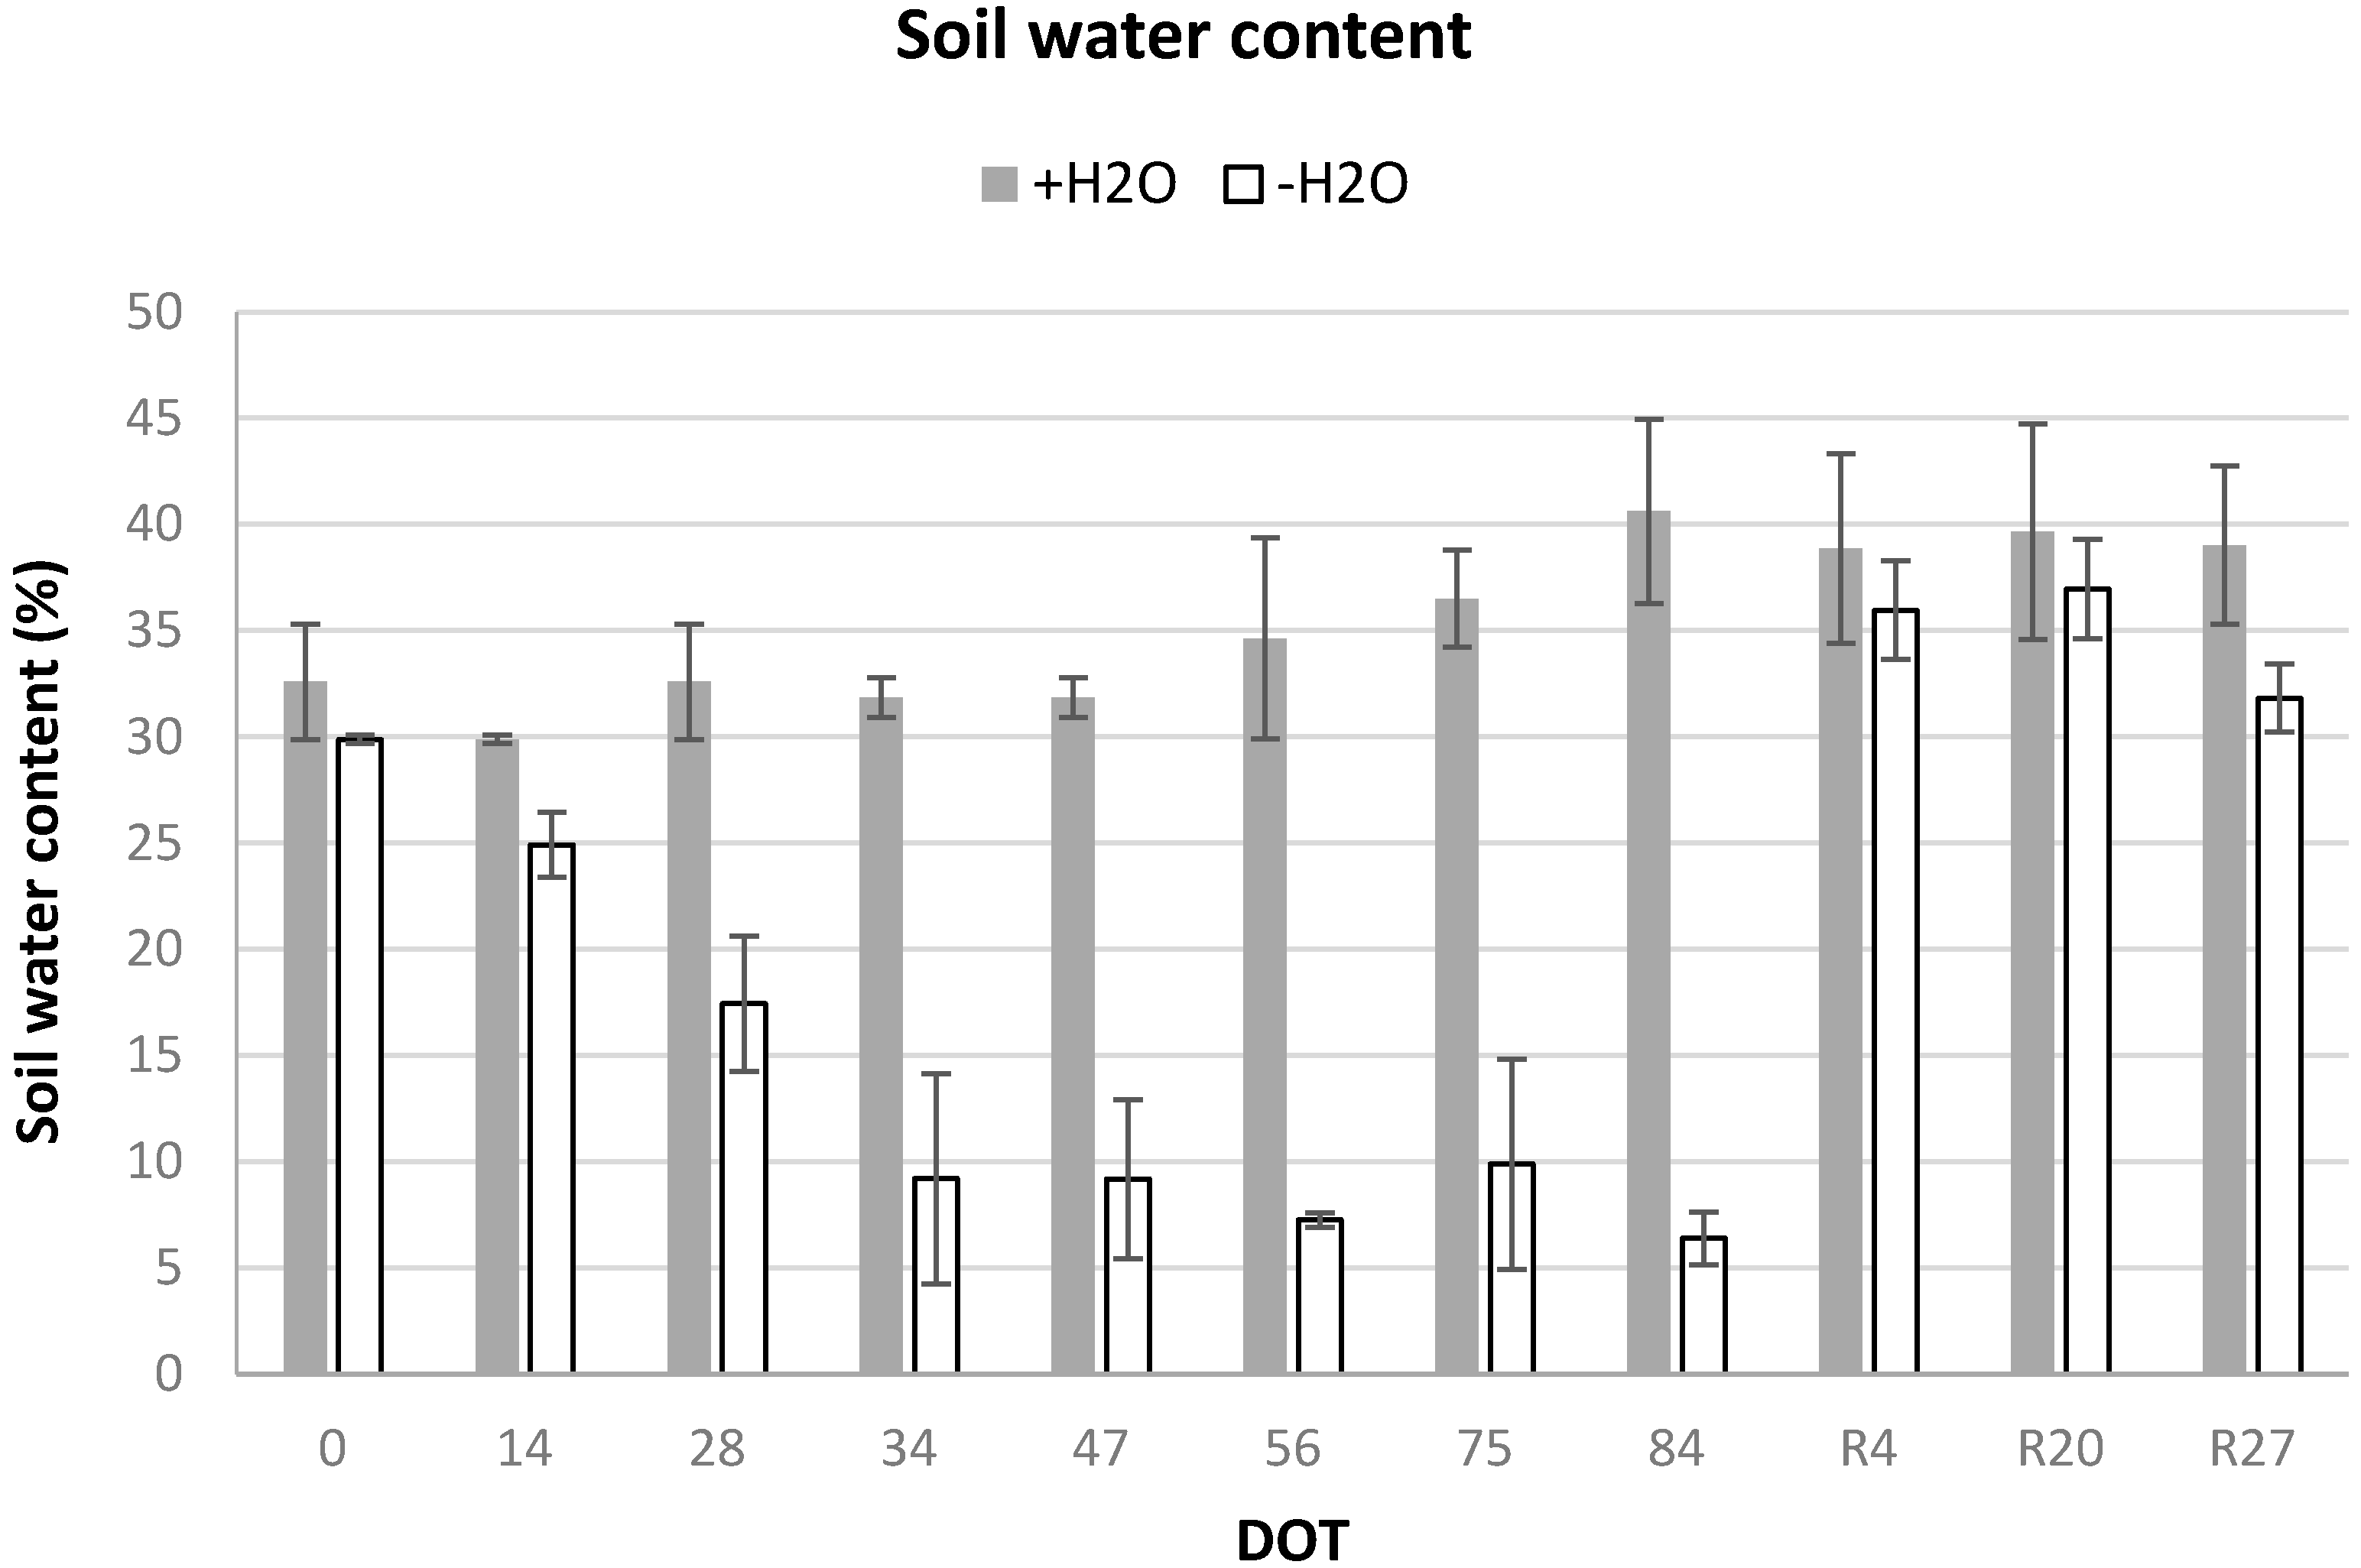
Figure 3.
(a) Net photosynthesis (Pn); (b) stomatal conductance (gs); (c) Ci/Ca ratio; and (d) leaf transpiration (E) measured during the experimental period. Vertical red dashed bars indicate the dates on which the EDU treatments were applied. On the horizontal axis, the Day of Treatment is reported (0–75 = days from the last irrigation and R4, R14, R20, R27, days from re-watering of the water-stressed mesocosms). For each measurement date, data are expressed as the relative difference with respect to the control set (+H2O−EDU), and different letters indicate statistically significant differences between means (9 < N < 30, see Supplementary Table S1).
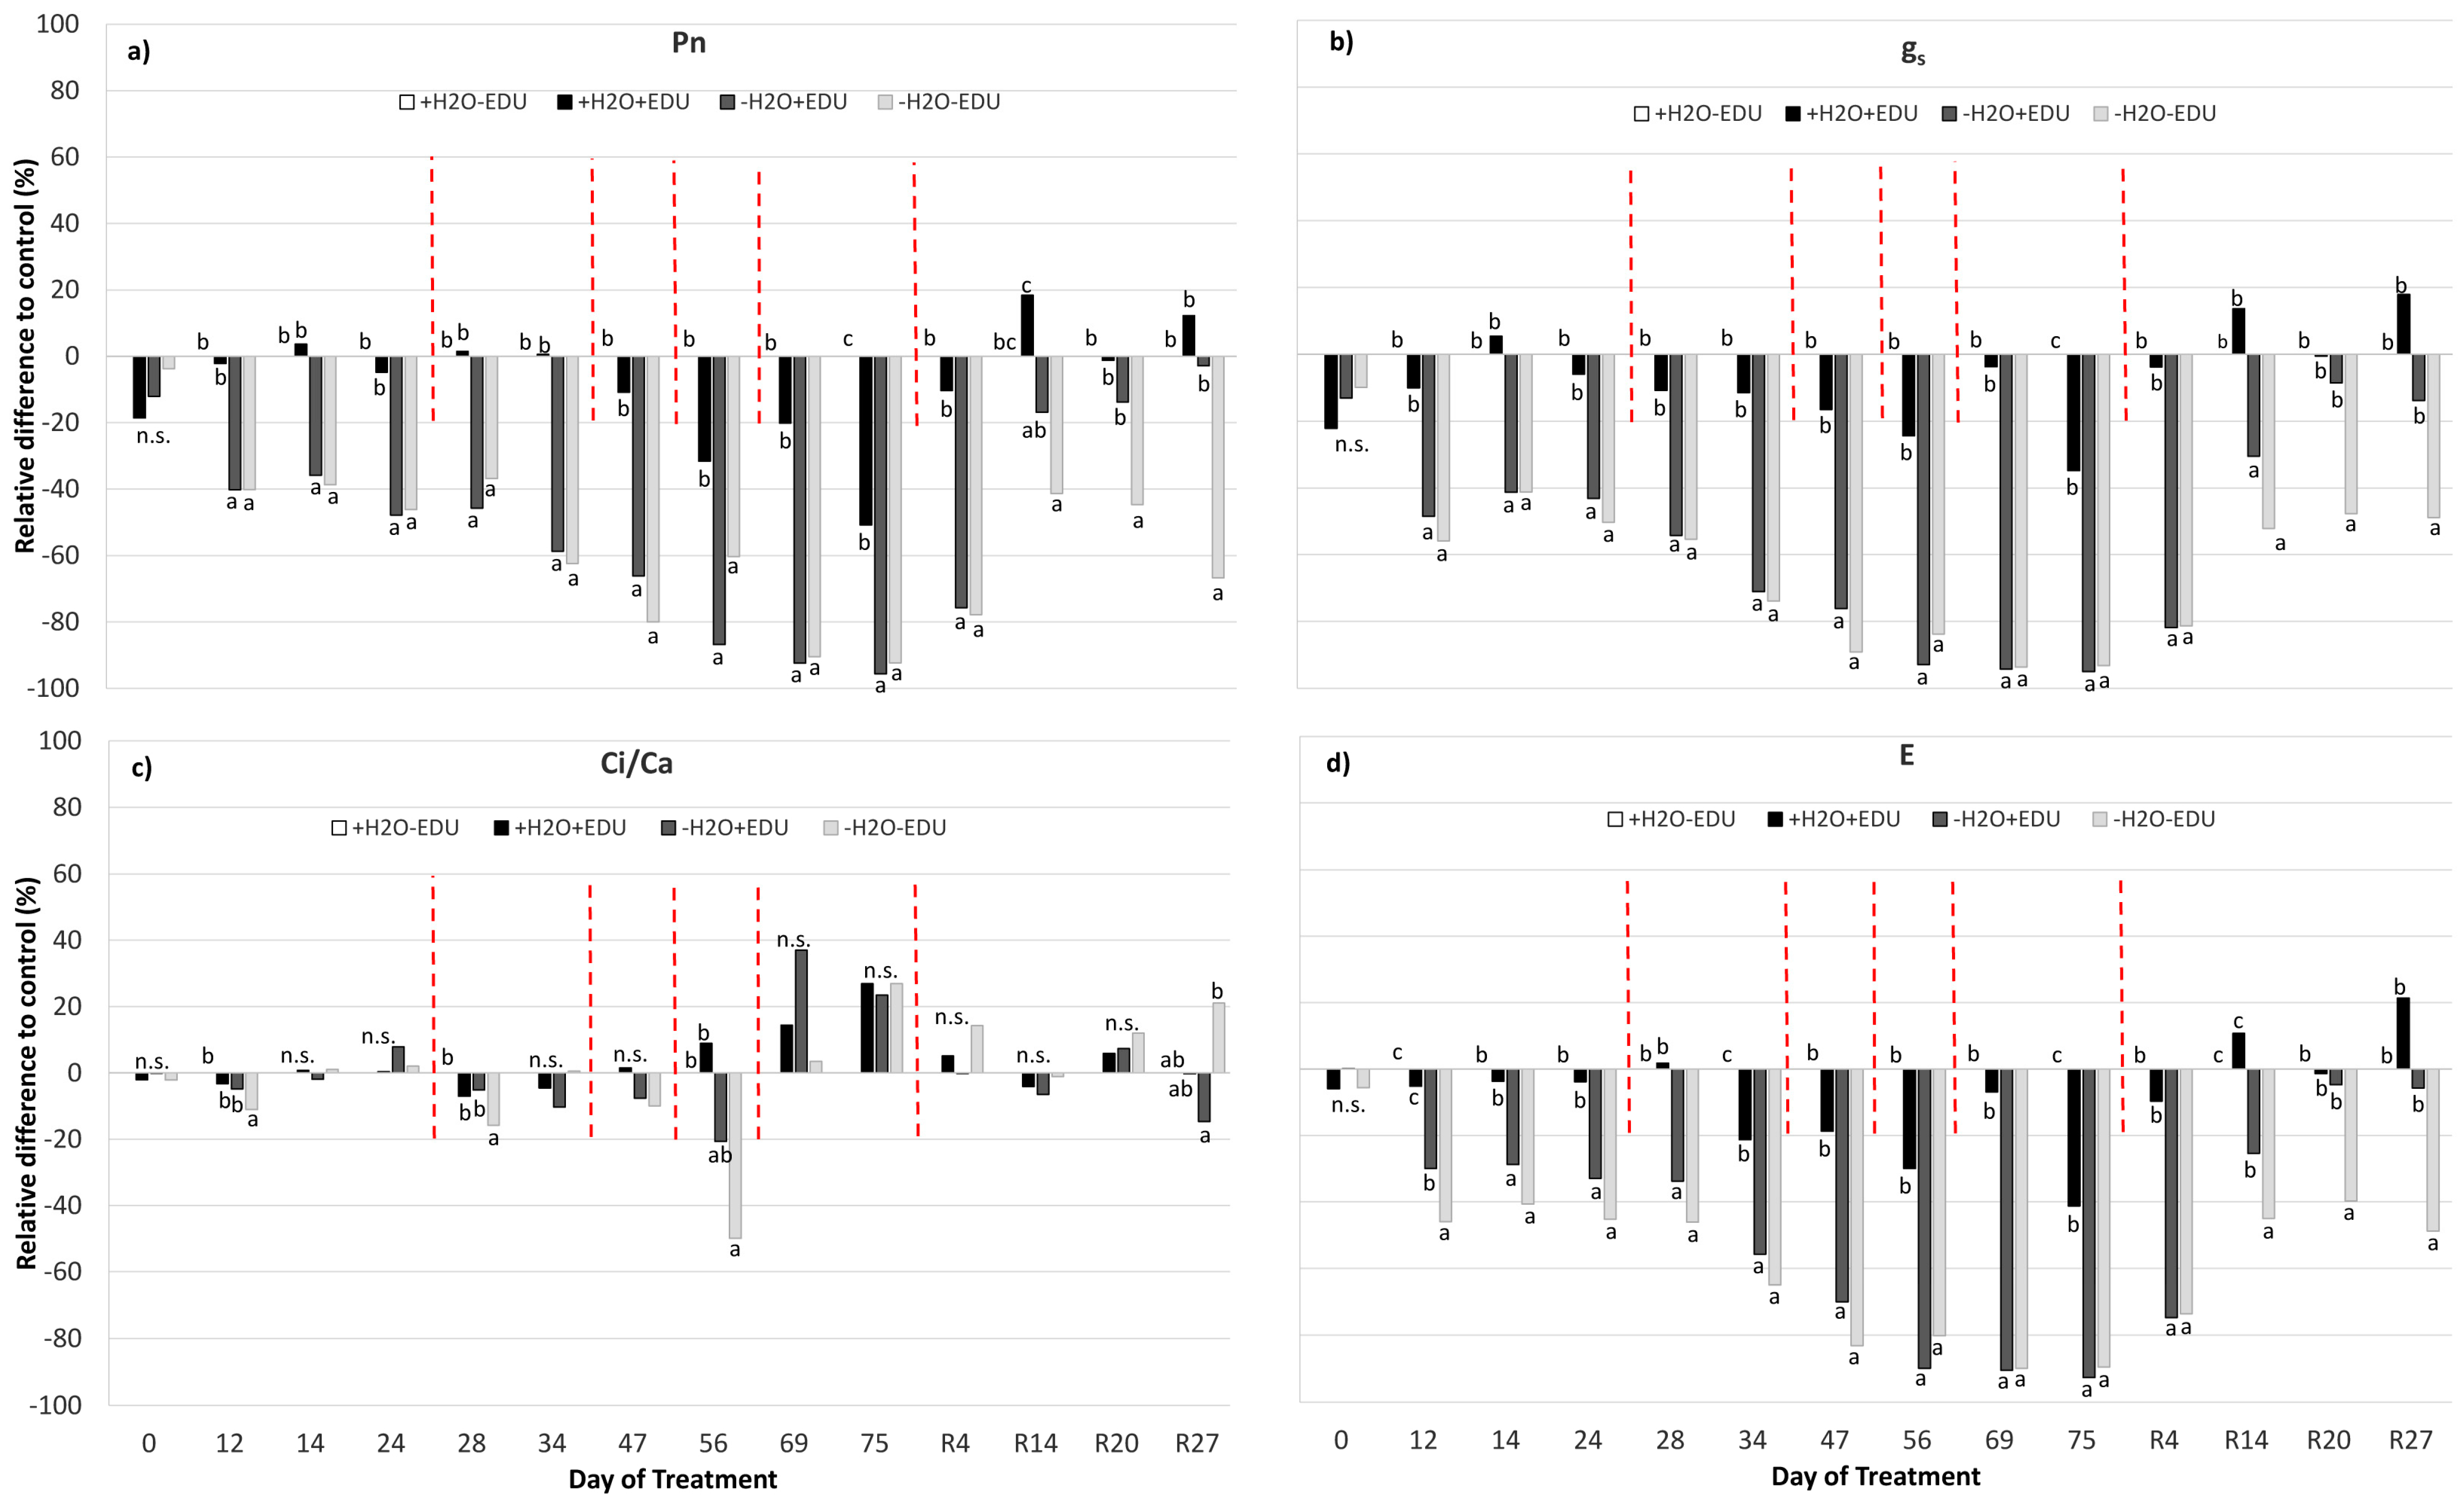
Figure 4.
(a) Maximum quantum yield of PSII (Fv/Fm); (b) effective quantum yield of PSII (ΦPSII); (c) photochemical quenching (qP); and (d) non-photochemical quenching (qNP), measured during the experimental period. On the horizontal axis, the Day of Treatment is reported (0–75 = days from the last irrigation and R4, R14, R20, R27, days from rewatering of the water-stressed mesocosms). Vertical red dashed bars indicate the dates on which the EDU treatment was applied. For each measurement date, data are expressed as the relative difference with respect to the control set (+H2O−EDU), and different letters indicate statistically significant differences between means (9 < N < 30, see Supplementary Table S1).

Figure 5.
Principal Component Analysis obtained by pooling together the ecophysiological data, soil water content, AOT40 and maximum daily ozone concentrations, measured from DOT 28, after the beginning of both water stress and EDU treatments, to R27. For each point, the Day of Treatment is reported. Cluster borders and numbers are marked in red (See text for further details).

Table 1.
Sampling scheme for ethylenediurea (EDU) treatment, soil water content (SWC) and ecophysiological measurements for Fraxinus ornus L. (Manna ash) plants in this study. The × symbol indicates the dates on which each treatment/measurement was carried out. On 10 July (DOT 24), gas exchange and chlorophyll fluorescence were measured before the EDU treatment.
| Type of Measurement | ||||||
|---|---|---|---|---|---|---|
| Date of Sampling (Year 2006) | Day of Treatment (DOT) | EDU Treatment | SWC | Gas Exchange | Chlorophyll Fluorescence | |
| 16 June | Days from the last irrigation (−H2O sets) | 0 | × | × | × | |
| 28 June | 12 | × | × | |||
| 30 June | 14 | × | × | × | ||
| 10 July | 24 | × | × | × | ||
| 14 July | 28 | × | × | × | ||
| 20 July | 34 | × | × | × | ||
| 24 July | 38 | × | ||||
| 2 August | 47 | × | × | × | ||
| 7 August | 52 | × | ||||
| 11 August | 56 | × | × | × | ||
| 22 August | 67 | × | ||||
| 24 August | 69 | × | × | |||
| 30 August | 75 | × | × | × | ||
| 5 September | 83 | × | ||||
| 6 September | 84 | × | ||||
| 12 September | Days from re-watering (−H2O sets) | R4 | × | × | × | |
| 22 September | R14 | × | × | |||
| 28 September | R20 | × | × | × | ||
| 5 October | R27 | × | × | × | ||
Table 2.
Analysis of Variance for the parameters derived from gas exchange and chlorophyll fluorescence measurements. Pn = net photosynthesis; gs = stomatal conductance; E = leaf transpiration; Ci/Ca = ratio between substomatal and ambient [CO2]; Fv/Fm = maximum quantum yield of PSII; ΦPSII = effective quantum yield of PSII; qP = photochemical quenching; qNP = non photochemical quenching; and DOT = Day of Treatment. Significant (p < 0.05) factors are marked in bold.
| DOT | Pn | gs | E | Ci/Ca | Fv/Fm | ΦPSII | qP | qNP | |
|---|---|---|---|---|---|---|---|---|---|
| 0 | Drought | 0.834 | 0.954 | 0.971 | 0.964 | 0.586 | 0.183 | 0.207 | 0.207 |
| EDU | 0.052 | 0.077 | 0.985 | 0.989 | 0.729 | 0.362 | 0.395 | 0.395 | |
| Drought × EDU | 0.431 | 0.186 | 0.338 | 0.373 | 0.180 | 0.575 | 0.550 | 0.550 | |
| 12 | Drought | 0.000 | 0.000 | 0.000 | 0.001 | 0.207 | 0.115 | 0.112 | 0.112 |
| EDU | 0.798 | 0.745 | 0.197 | 0.411 | 0.395 | 0.674 | 0.668 | 0.668 | |
| Drought × EDU | 0.808 | 0.039 | 0.012 | 0.008 | 0.550 | 0.088 | 0.075 | 0.075 | |
| 14 | Drought | 0.000 | 0.000 | 0.000 | 0.782 | 0.022 | 0.645 | 0.823 | 0.823 |
| EDU | 0.581 | 0.679 | 0.491 | 0.706 | 0.399 | 0.695 | 0.733 | 0.733 | |
| Drought × EDU | 0.946 | 0.672 | 0.191 | 0.526 | 0.575 | 0.036 | 0.048 | 0.048 | |
| 24 | Drought | 0.000 | 0.000 | 0.000 | 0.057 | 0.346 | 0.345 | 0.470 | 0.470 |
| EDU | 0.556 | 0.918 | 0.507 | 0.206 | 0.495 | 0.689 | 0.448 | 0.448 | |
| Drought × EDU | 0.774 | 0.269 | 0.205 | 0.267 | 0.265 | 0.043 | 0.033 | 0.033 | |
| 28 | Drought | 0.000 | 0.000 | 0.000 | 0.007 | 0.241 | 0.444 | 0.632 | 0.632 |
| EDU | 0.600 | 0.464 | 0.229 | 0.470 | 0.958 | 0.026 | 0.003 | 0.003 | |
| Drought × EDU | 0.461 | 0.371 | 0.364 | 0.001 | 0.146 | 0.115 | 0.084 | 0.084 | |
| 34 | Drought | 0.000 | 0.000 | 0.000 | 0.682 | 0.252 | 0.001 | 0.004 | 0.004 |
| EDU | 0.742 | 0.481 | 0.269 | 0.234 | 0.013 | 0.013 | 0.033 | 0.033 | |
| Drought × EDU | 0.811 | 0.241 | 0.006 | 0.622 | 0.988 | 0.307 | 0.425 | 0.425 | |
| 47 | Drought | 0.000 | 0.000 | 0.000 | 0.135 | 0.701 | 0.000 | 0.000 | 0.000 |
| EDU | 0.870 | 0.772 | 0.695 | 0.763 | 0.779 | 0.002 | 0.001 | 0.001 | |
| Drought × EDU | 0.177 | 0.017 | 0.028 | 0.944 | 0.927 | 0.041 | 0.020 | 0.020 | |
| 56 | Drought | 0.000 | 0.000 | 0.000 | 0.000 | 0.000 | 0.001 | 0.007 | 0.007 |
| EDU | 0.009 | 0.030 | 0.007 | 0.021 | 0.506 | 0.000 | 0.000 | 0.000 | |
| Drought × EDU | 0.814 | 0.316 | 0.164 | 0.213 | 0.699 | 0.282 | 0.132 | 0.132 | |
| 69 | Drought | 0.000 | 0.000 | 0.000 | 0.239 | 0.000 | 0.000 | 0.000 | 0.000 |
| EDU | 0.304 | 0.822 | 0.694 | 0.032 | 0.764 | 0.623 | 0.939 | 0.939 | |
| Drought × EDU | 0.397 | 0.868 | 0.741 | 0.386 | 0.718 | 0.026 | 0.153 | 0.153 | |
| 75 | Drought | 0.000 | 0.000 | 0.000 | 0.212 | 0.000 | 0.000 | 0.000 | 0.000 |
| EDU | 0.001 | 0.023 | 0.013 | 0.211 | 0.585 | 0.016 | 0.018 | 0.018 | |
| Drought × EDU | 0.003 | 0.039 | 0.032 | 0.108 | 0.981 | 0.489 | 0.361 | 0.361 | |
| R4 | Drought | 0.000 | 0.000 | 0.000 | 0.309 | 0.000 | 0.000 | 0.000 | 0.000 |
| EDU | 0.563 | 0.756 | 0.329 | 0.282 | 0.024 | 0.642 | 0.730 | 0.730 | |
| Drought × EDU | 0.383 | 0.818 | 0.434 | 0.028 | 0.238 | 0.550 | 0.611 | 0.611 | |
| R14 | Drought | 0.000 | 0.000 | 0.000 | 0.675 | 0.001 | 0.163 | 0.669 | 0.669 |
| EDU | 0.018 | 0.036 | 0.027 | 0.260 | 0.795 | 0.019 | 0.007 | 0.007 | |
| Drought × EDU | 0.731 | 0.631 | 0.509 | 0.881 | 0.094 | 0.273 | 0.085 | 0.085 | |
| R20 | Drought | 0.034 | 0.029 | 0.030 | 0.255 | 0.062 | 0.601 | 0.940 | 0.940 |
| EDU | 0.261 | 0.125 | 0.087 | 0.919 | 0.245 | 0.312 | 0.439 | 0.439 | |
| Drought × EDU | 0.224 | 0.115 | 0.065 | 0.376 | 0.548 | 0.299 | 0.579 | 0.579 | |
| R27 | Drought | 0.001 | 0.001 | 0.001 | 0.643 | 0.013 | 0.136 | 0.141 | 0.141 |
| EDU | 0.002 | 0.025 | 0.004 | 0.016 | 0.017 | 0.056 | 0.071 | 0.071 | |
| Drought × EDU | 0.029 | 0.453 | 0.300 | 0.018 | 0.677 | 0.167 | 0.148 | 0.148 |
Table 3.
Principal component analysis of the considered ecophysiological and environmental parameters, obtained from pooling together the data from DOT 28 to R27 after the beginning of both the water stress and EDU treatments. Component loadings > 0.7, which represent the correlation of the original variables with each of the new factors, are highlighted in bold. See text for further details.
| Factor 1 | Factor 2 | |
|---|---|---|
| E | 0.676808 | −0.652821 |
| gs | 0.855971 | −0.352427 |
| Pn | 0.812304 | −0.428020 |
| Ci/Ca | 0.014049 | 0.571931 |
| SWC | 0.829174 | 0.219180 |
| O3 Max | −0.108951 | −0.902128 |
| AOT40 | 0.118850 | 0.887376 |
| ΦPSII | 0.922908 | 0.103793 |
| qP | 0.897010 | 0.116943 |
| qNP | −0.897010 | −0.116943 |
| Fv/Fm | 0.838633 | 0.194126 |
| % Total variance | 52.24 | 25.16 |
| Cumulative % | 52.24 | 77.40 |
© 2017 by the authors. Licensee MDPI, Basel, Switzerland. This article is an open access article distributed under the terms and conditions of the Creative Commons Attribution (CC BY) license (http://creativecommons.org/licenses/by/4.0/).
Share and Cite
MDPI and ACS Style
Salvatori, E.; Fusaro, L.; Manes, F. Effects of the Antiozonant Ethylenediurea (EDU) on Fraxinus ornus L.: The Role of Drought. Forests 2017, 8, 320. https://doi.org/10.3390/f8090320
AMA Style
Salvatori E, Fusaro L, Manes F. Effects of the Antiozonant Ethylenediurea (EDU) on Fraxinus ornus L.: The Role of Drought. Forests. 2017; 8(9):320. https://doi.org/10.3390/f8090320
Chicago/Turabian StyleSalvatori, Elisabetta, Lina Fusaro, and Fausto Manes. 2017. "Effects of the Antiozonant Ethylenediurea (EDU) on Fraxinus ornus L.: The Role of Drought" Forests 8, no. 9: 320. https://doi.org/10.3390/f8090320
Note that from the first issue of 2016, this journal uses article numbers instead of page numbers. See further details here.