Article

Differential Responses in Non-structural Carbohydrates of Machilus ichangensis Rehd. et Wils. and Taxus wallichiana Zucc. Var. chinensis (Pilg.) Florin Seedlings to Elevated Ozone

Institute of Forest Ecology, Environment and Protection, Chinese Academy of Forestry, State Forestry Administration Key Laboratory of Forest Ecology and Environment, Beijing 100091, China
*
Author to whom correspondence should be addressed.
Forests 2017, 8(9), 323; https://doi.org/10.3390/f8090323
Submission received: 13 June 2017 / Revised: 24 August 2017 / Accepted: 28 August 2017 / Published: 31 August 2017
(This article belongs to the Special Issue Impact of Ozone on Forests)

Abstract

:
Tropospheric ozone (O3) enrichment could change the carbon (C) metabolism and decrease the C stock for tree species. To assess the differences in response of non-structural carbohydrates (NSCs) between Machilus ichangensis Rehd. et Wils. (M. ichangensis) and Taxus wallichiana Zucc. var. chinensis (Pilg.) Florin (T. wallichiana) with elevated O3, one-year-old container seedlings of the two species were grown with ambient air (AA), 100 ppb (elevated O3 treatment 1, E1-O3), and 150 ppb (elevated O3 treatment 2, E2-O3) treatments using open top chambers. During the experiment, net photosynthetic rate (Pn) of M. ichangensis and T. wallichiana were examined once each month from April to October. At the end of experiment, plants were harvested to examine the NSC concentrations and tissue C stocks. Results suggest elevated O3 significantly decreased Pn and total C stock for both M. ichangensis and T. wallichiana, while it also significantly decreased the NSC concentrations in the foliage of the two species, and the roots of T. wallichiana. However, the concentrations of NSCs and their components in other tissues did not change obviously. Significant increases in the ratio of soluble sugars to starch were observed in the foliage of M. ichangensis and the roots of T. wallichiana. For M. ichangensis, Pn was significantly and positively correlated with NSCs and their components only in foliage. In contrast, NSCs in both foliage and roots were significantly and positively correlated with Pn for T. wallichiana. Based on the results for Pn, total C stock, and NSC concentrations, M. ichangensis appeared more sensitive to elevated O3 than T. wallichiana. It is suggested that the strategies of C allocation in the two species are different with elevated O3.

1. Introduction

In many parts of the world tropospheric ozone (O3), which is harmful to human health and plant growth, is one of the most important secondary air pollutants [1,2]. The background levels of tropospheric O3 concentration in the Northern Hemisphere have increased by around 2–4.5 times since the pre-industrial age [3], and the peak value frequently exceeds 100 ppb (or about 200 μg m−3) in some cities of the USA and Latin America and in metropolitan areas of Asia [4]. Tropospheric O3 is mainly produced by catalytic reactions among oxidized nitrogen (NOx), carbon monoxide (CO), methane (CH4), and non-methane volatile organic compounds (NMVOCs) in the presence of sunlight [5,6]. Tropospheric O3 concentrations over 40 ppb are known to damage forest trees and agricultural crops [7]. As the largest emerging economy, China has experienced fast economic growth that has been accompanied by increasing concentrations of atmospheric pollutants [8,9]. In most parts of China, mean daily 8 h (9:00–17:00) O3 concentrations over 50–60 ppb have been documented [10]. To tackle air pollution, China has implemented the plan of emission reduction for NOx in recent years, however, the troposphere O3 concentrations may still increase in the future [11].
Elevated CO2 could increase the net CO2 assimilation and forest biomass accumulation [12], however, chronical enhancement of tropospheric O3 may offset these positive effects because atmospheric CO2 and O3 concentrations increase concomitantly under climate change scenarios [13]. Many studies showed that elevated O3 induced a wide range of detrimental impacts on forest trees including visible foliar symptoms, decreased foliar chlorophyll content, accelerated leaf senescence, decreased photosynthesis, increased respiration, decreased growth and productivity, and predisposed trees to attack by pests [14]. Ozone stress may also decrease the concentration of non-structural carbohydrates (NSCs) mainly including starch and soluble sugars (glucose, fructose, and sucrose) and alter the allocation of NSCs among different plant tissues; moreover, different tree species may show various responses in NSCs with elevated O3 due to differences in adaptive strategies [15,16,17]. Within plants, NSCs that could be transferred to stem and root for growth or storage are mainly produced by the photosynthesis in foliage, while mutual transformation between soluble sugars and starch could occur in the tissues [18]. Starch, which has a simple structure, could be quickly and inexpensively synthesized and degraded, making it an ideal compound for short- and medium-term carbon (C) storage [19]. Soluble sugars are the major driver of plant metabolism and growth, acting both as immediate substrates for metabolism and as building blocks for structural compounds [20,21]. The concentration of NSCs in tissues, which is considered a measure of the C source–sink balance [22], is crucial for determining growth/survivorship trade-off of trees and model tree C budget [23]. Thus, studies on the effects of elevated O3 on NSCs within plants will improve the understanding of the differences in response mechanisms of different species, and also provide a basis to estimate the global C cycle in the future.
Under subtropical monsoon climates, previous studies reported the responses of several deciduous broadleaved, evergreen broadleaved, and coniferous tree species to elevated O3, mainly from the aspects of injury symptom, gas exchange, antioxidative capability, element concentration, and biomass accumulation [24,25,26,27]. However, there is little information on the response of NSCs in Machilus ichangensis Rehd. et Wils. (M. ichangensis) and Taxus wallichiana Zucc. var. chinensis (Pilg.) Florin (T. wallichiana) to elevated O3. Both M. ichangensis and T. wallichiana are native and precious tree species in China [28,29]. M. ichangensis extract can be used to treat skin diseases and joint pains due to its anti-inflammatory effects [30], and taxol isolated from T. wallichiana has anticancer effects [31]. Moreover, M. ichangensis is an excellent species for landscape engineering [28]. Great attention has been paid to these two species for their medicinal and economic values in recent years. Increasing tropospheric O3 concentrations may damage the two species, decrease the production of anti-inflammatory compounds and taxol, and lead to serious economic losses. Gaining knowledge about the responses of these two species to O3 stress will contribute to a better understanding of the effects of environmental change induced by atmospheric pollutants on tree species with high economic values. The objectives of the present study are: (1) to determine the effects of elevated O3 on the NSCs in different tissues of M. ichangensis and T. wallichiana; (2) to compare the differences in NSCs, net photosynthetic rate (Pn), and biomass accumulation response of the two species to elevated O3; (3) to determine the relationships between the Pn, biomass, and NSC concentration in different tissues of the two species with elevated O3.

2. Materials and Methods

2.1. Site Description

The study was conducted in the Qianyanzhou experimental station (115°03′29.2″ E, 26°44′29.1″ N) of the Chinese Academy of Sciences, situated on the typical red earth hilly region in Taihe county, Jiangxi Province, China. The elevation of the study site is approximately 60 m. This region features a subtropical monsoon climate with an annual mean temperature of 17.8 °C. The annual active accumulated temperatures (above 0 and 10 °C) are 6543.8 and 5948.2 °C, respectively. The frost-free period is 290 days and global radiation is 4223 MJ/m2. The annual precipitation and evaporation are 1471.2 and 259.9 mm, respectively, with a mean relative humidity of 83% [32].

2.2. Ozone Fumigation Treatment

On 13 March 2015, 10 one-year-old container seedlings of similar height and basal diameter were selected for each species (M. ichangensis and T. wallichiana) and directly transplanted into the natural soil of each of nine open-top chambers (OTCs, octagonal base, 2 m in diameter, and 2.2 m in height). All OTCs were set in the flat and open-field in advance. To reduce possible impacts due to microenvironmental differences, as much as possible, different OTCs were set to avoid sheltering each other. Soil is very homogeneous within the whole experiment site. The water supply was adequate for seedlings. During the experiment, monthly mean temperature outside OTC varied within 18.8–27.9 °C, and the instant extreme values were 39.0 °C on 4 August and 3.0 °C on 14 April. Monthly mean relative humidity outside OTC varied within 82–90%, and total precipitation was 1161.3 mm.
It was reported that the tropospheric O3 concentration of several developed areas of China, such as Beijing–Tianjin–Bohai Area, Yangtze River Delta, and Pearl River Delta, could reach more than 150 ppb [33]. The study site also has the potential to suffer tropospheric O3 pollution in the future. Before the experiment was conducted, we observed the peak O3 concentrations of ambient air to be close to 100 ppb in the field of the study site. Although a critical AOT40 (accumulated exposure over a threshold of 40 ppb based on hourly averages) of 5 ppm h could induce injuries for some sensitive tree species [34], a previous study showed that annual AOT40 in parts of China and Europe could reach 60 ppm h for the whole year [35,36]. Furthermore, the tropospheric O3 pollution may be more serious in the future [3,11]. In order to simulate future O3 exposure levels, O3 fumigation treatments were set to three levels, including ambient air (AA), 100 ppb (elevated O3 treatments 1, E1-O3), and 150 ppb (elevated O3 treatments 2, E2-O3), with three replicated OTCs for each treatment. During the daytime (from 9:00 to 17:00), when there was no rain, thunderstorm, fog, or dew, an independent O3 pipeline and ventilation integrated device for each OTC continuously worked to achieve the target O3 concentration and make the CO2 concentration, temperature, and humidity between different OTCs remain relatively consistent. The average air velocity in the OTCs corresponded to approximately two complete air changes per minute. Ozone fumigation started on 21 March and lasted until 2 November 2015, with a daily maximum of 8 h (from 9:00 to 17:00). During the experiment, the 8 h mean O3 concentrations of the three treatments (AA, E1-O3, and E2-O3) were 27.26 ppb, 96.30 ppb, and 147.06 ppb, respectively, and corresponding AOT40 were 2.27 ppm h, 75.25 ppm h, and 145.04 ppm h, respectively. For further details on the experiments and O3 treatments, also see Yu et al. [27].

2.3. Measurements

Nine seedlings of each species, one from each OTC, were randomly selected for measuring Pn between 09:00 and 12:00 h using an LI-6400 portable photosynthesis system (Li-Cor, Lincoln, NE, USA) in the middle of each month from May to October in 2015. Measurements were performed on the youngest fully expanded leaves located at the top branches of every selected seedling. Each time, one leaf was measured for one seedling of M. ichangensis, and about ten leaves together were measured for one seedling of T. wallichiana. During the experiment, leaves were illuminated at 1000 μmol m−2 s−1 using the 6400-2B red/blue light-emitting diode (LED) light source. The block temperature was set to the ambient average (25–35 °C) at each measurement. Relative humidity was controlled at 50–65%. CO2 was set at 380 μmol mol−1 with a supply from a pure CO2 gas cylinder.
Plants were harvested after the O3 fumigation experiment. In each OTC, two plants of each species were randomly collected, and then the foliage, stem, and roots were separately sampled. Roots were excavated manually. Due to the low amount of branch biomass, branches were not separated from stem. Samples of different seedling tissues of the two species were oven dried at 70 °C to constant weight for dry biomass determination. The C stocks were calculated by multiplying the biomass by C concentration of 0.47, which was suggested by the Intergovernmental Panel on Climate Change (IPCC) for subtropical tree species [37]. Oven dried samples of different tissues were ground by a laboratory grinder (Taisite FW100, Tianjin, China) and passed through a fine screen (0.15 mm) for NSC concentration analyses. Soluble sugars were extracted according to the following steps: (1) powdered material (0.5 g) was added to 50 mL distilled water, and then the mixture was high-pressure steamed for 2 h; (2) after chilling to room temperature, the mixture was filtrated and diluted to a constant volume. Starch was extracted according to the following steps: (1) powdered material (0.1 g) was added to 10 mL distilled water and 1 mL hydrochloric acid (2:1), and then the mixture was incubated at 100 °C in a water bath for 8 h; (2) after chilling to room temperature, the mixture was adjusted to neutral pH by adding NaOH solution (40%), and was finally filtrated and diluted to a constant volume. Both soluble sugars and starch were determined by a high-performance liquid chromatography (HPLC) system using a Sugar-Pak 1 chromatographic column and a refractive index detector (Waters HPLC 2695, Milford, MA, USA). The column temperature was 70 °C, and distilled water was used as mobile phase (flow rate 0.6 mL/min). Non-structural carbohydrates were defined as the sum of soluble sugars (glucose, fructose, and sucrose) and starch. Soluble Sugars, starch, and NSC concentrations were expressed as a % of dry matter.

2.4. Statistical Analysis

Statistical analysis was performed using the SPSS software package (ver. 17.0; SPSS, Chicago, IL, USA). For each species, the difference among the means of different treatments and variation of different seedling tissues within the same treatment was examined by one-way analysis of variance (ANOVA). After normality and homogeneity of variance was confirmed with the Shapiro–Wilk test and Levene’s test, the least significant difference was performed to test the differences at a significance level of 0.05. Pearson’s correlation coefficient was used to determine the strength of the relationships.

3. Results

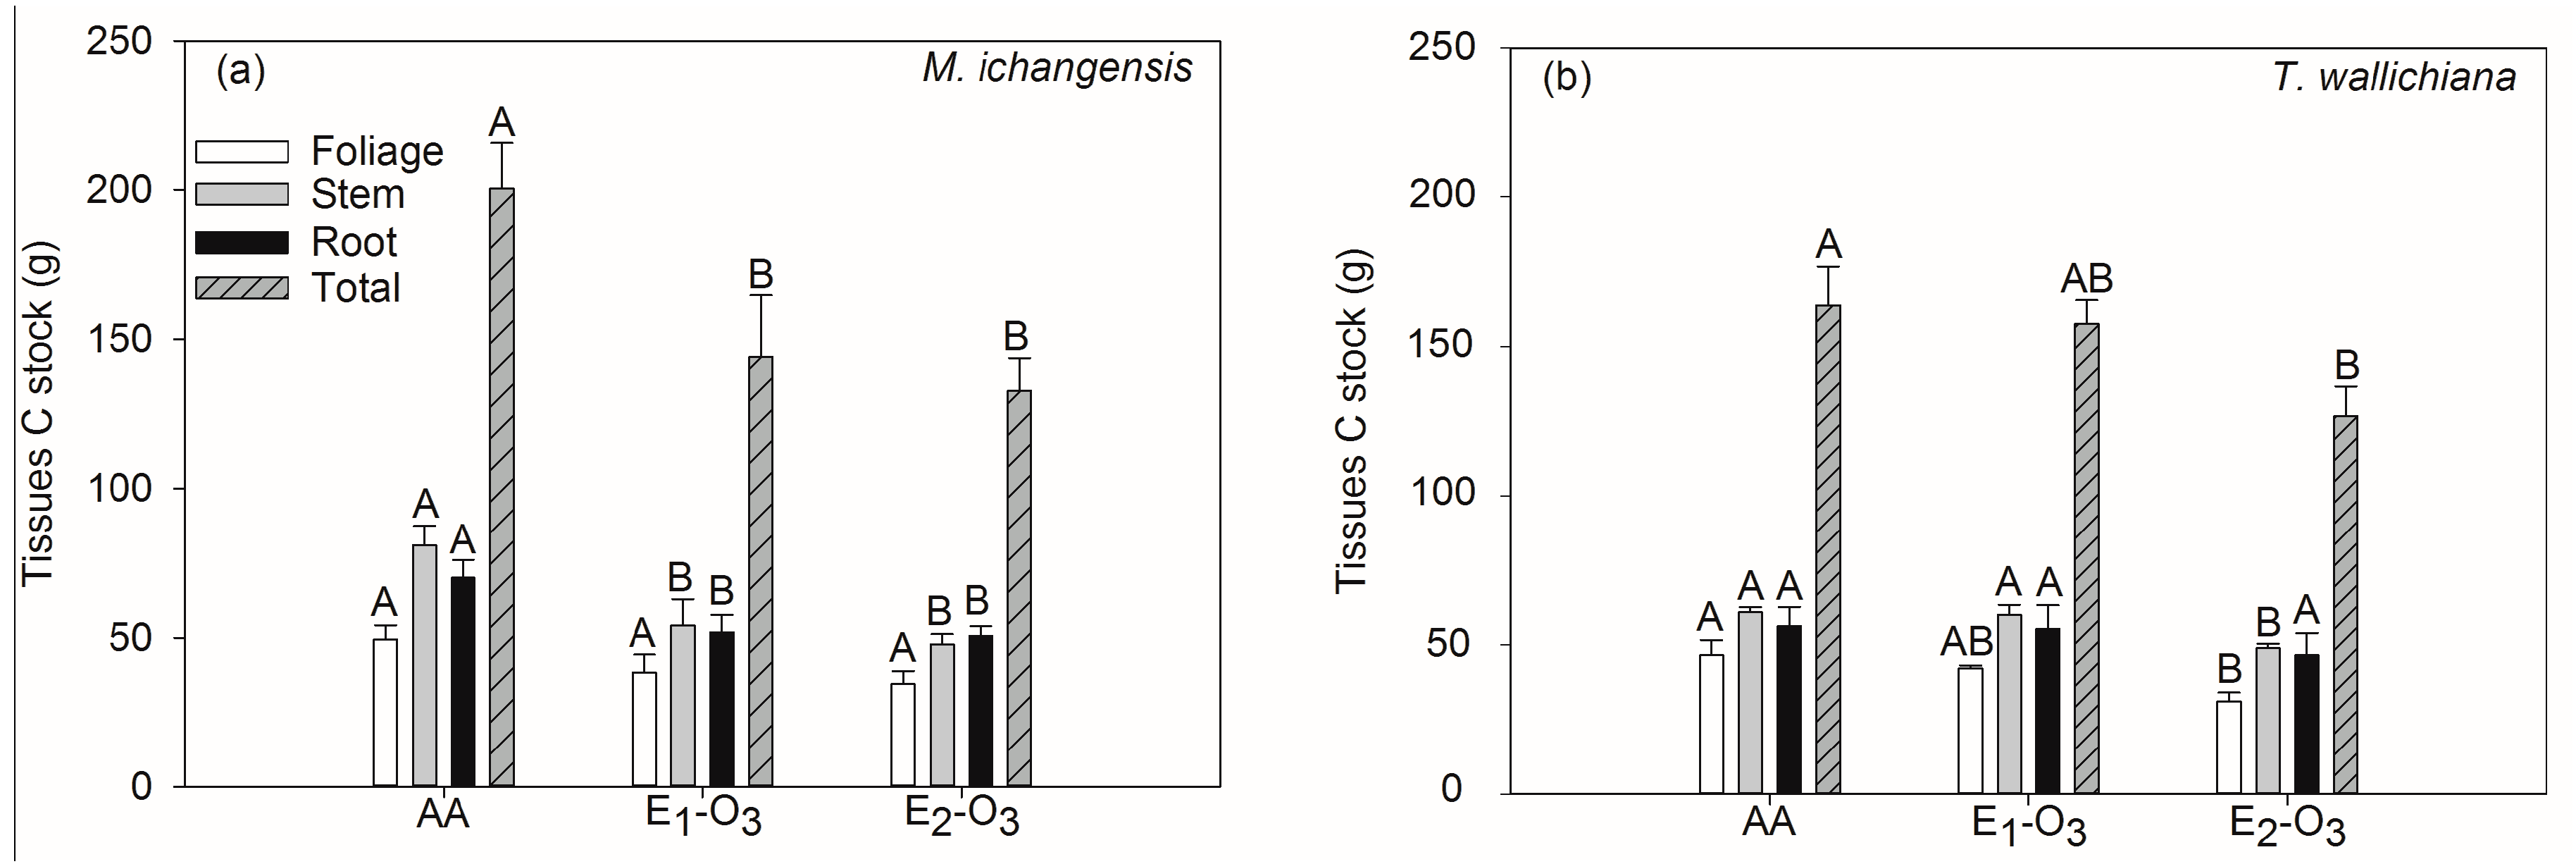
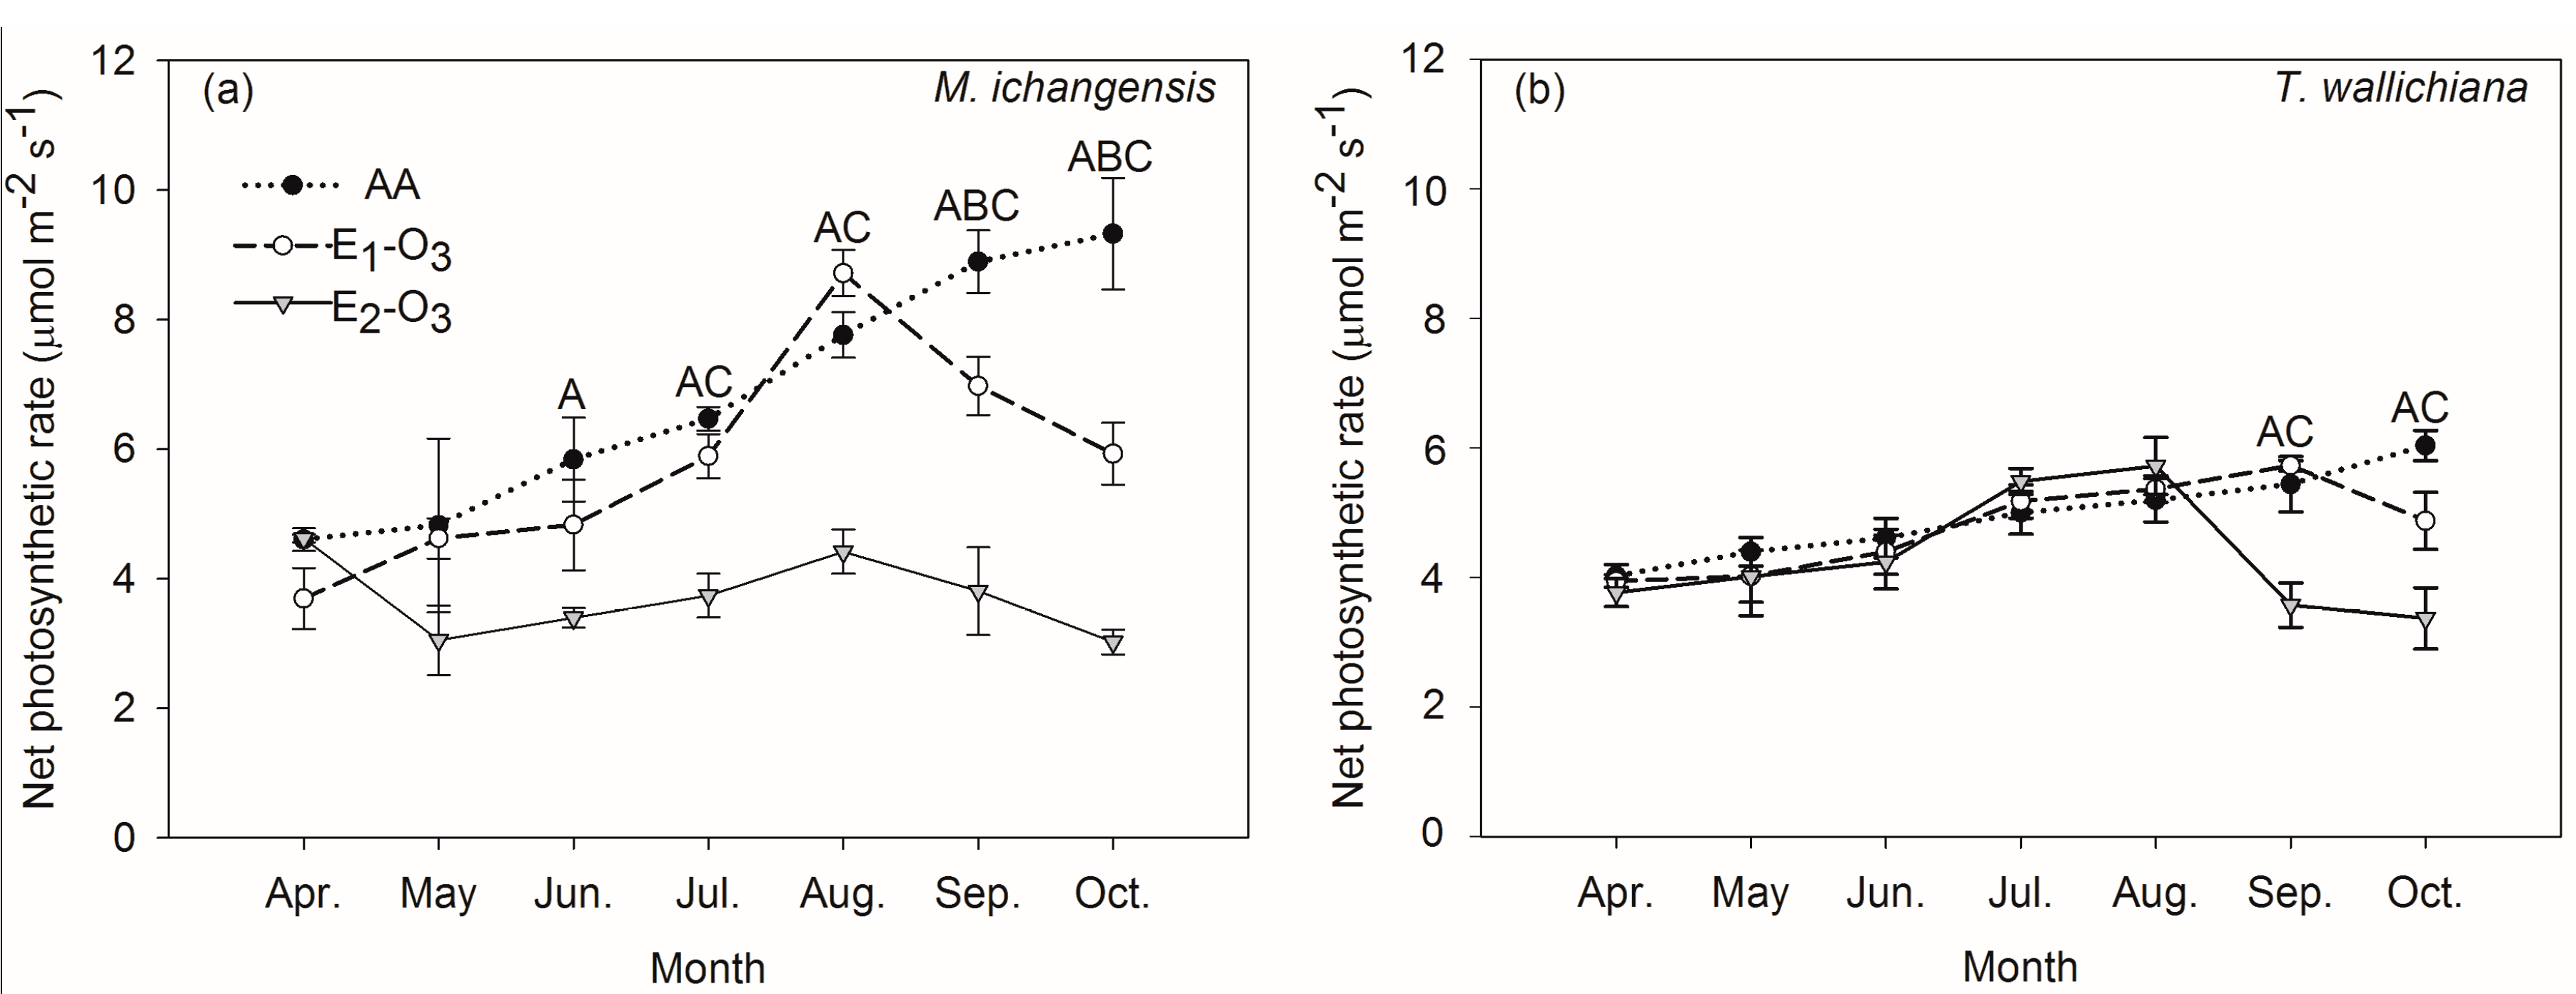
3.1. Effects of Elevated Ozone on Net Photosynthetic Rate and Carbon Stock

For both M. ichangensis and T. wallichiana, sustaining elevated O3 significantly decreased the Pn (Figure 1a,b). The Pn values of M. ichangensis under E2-O3 treatment were significantly lower than under the AA treatment during the period of mid-June to mid-October in 2015 (Figure 1a). From mid-September, the Pn of M. ichangensis under the E1-O3 treatment was also significantly lower than that under AA treatments (Figure 1a). The Pn of T. wallichiana did not differ significantly among the three O3 fumigation treatments before mid-August (Figure 1b). Thereafter, the Pn of T. wallichiana under the E2-O3 treatment decreased sharply and was significantly lower than that under the AA treatment (Figure 1b). In contrast, the Pn of T. wallichiana under the E1-O3 treatment was not significantly different with that under the AA treatment all the time from the beginning to end of experiment (Figure 1b).
Figure 2 shows the C stock of individual tissues in the two species with elevated O3. The E1-O3 and E2-O3 treatments significantly decreased stem, root, and total C stock for M. ichangensis (Figure 2a), and E2-O3 treatments significantly decreased foliage, stem, and total C stock for T. wallichiana (Figure 2b). The total C stock in M. ichangensis and T. wallichiana under the E2-O3 treatment decreased by 34 and 23%, respectively. In contrast, the foliage C stock of M. ichangensis and the root C stock of T. wallichiana appeared to be independent of elevated O3 (Figure 2).

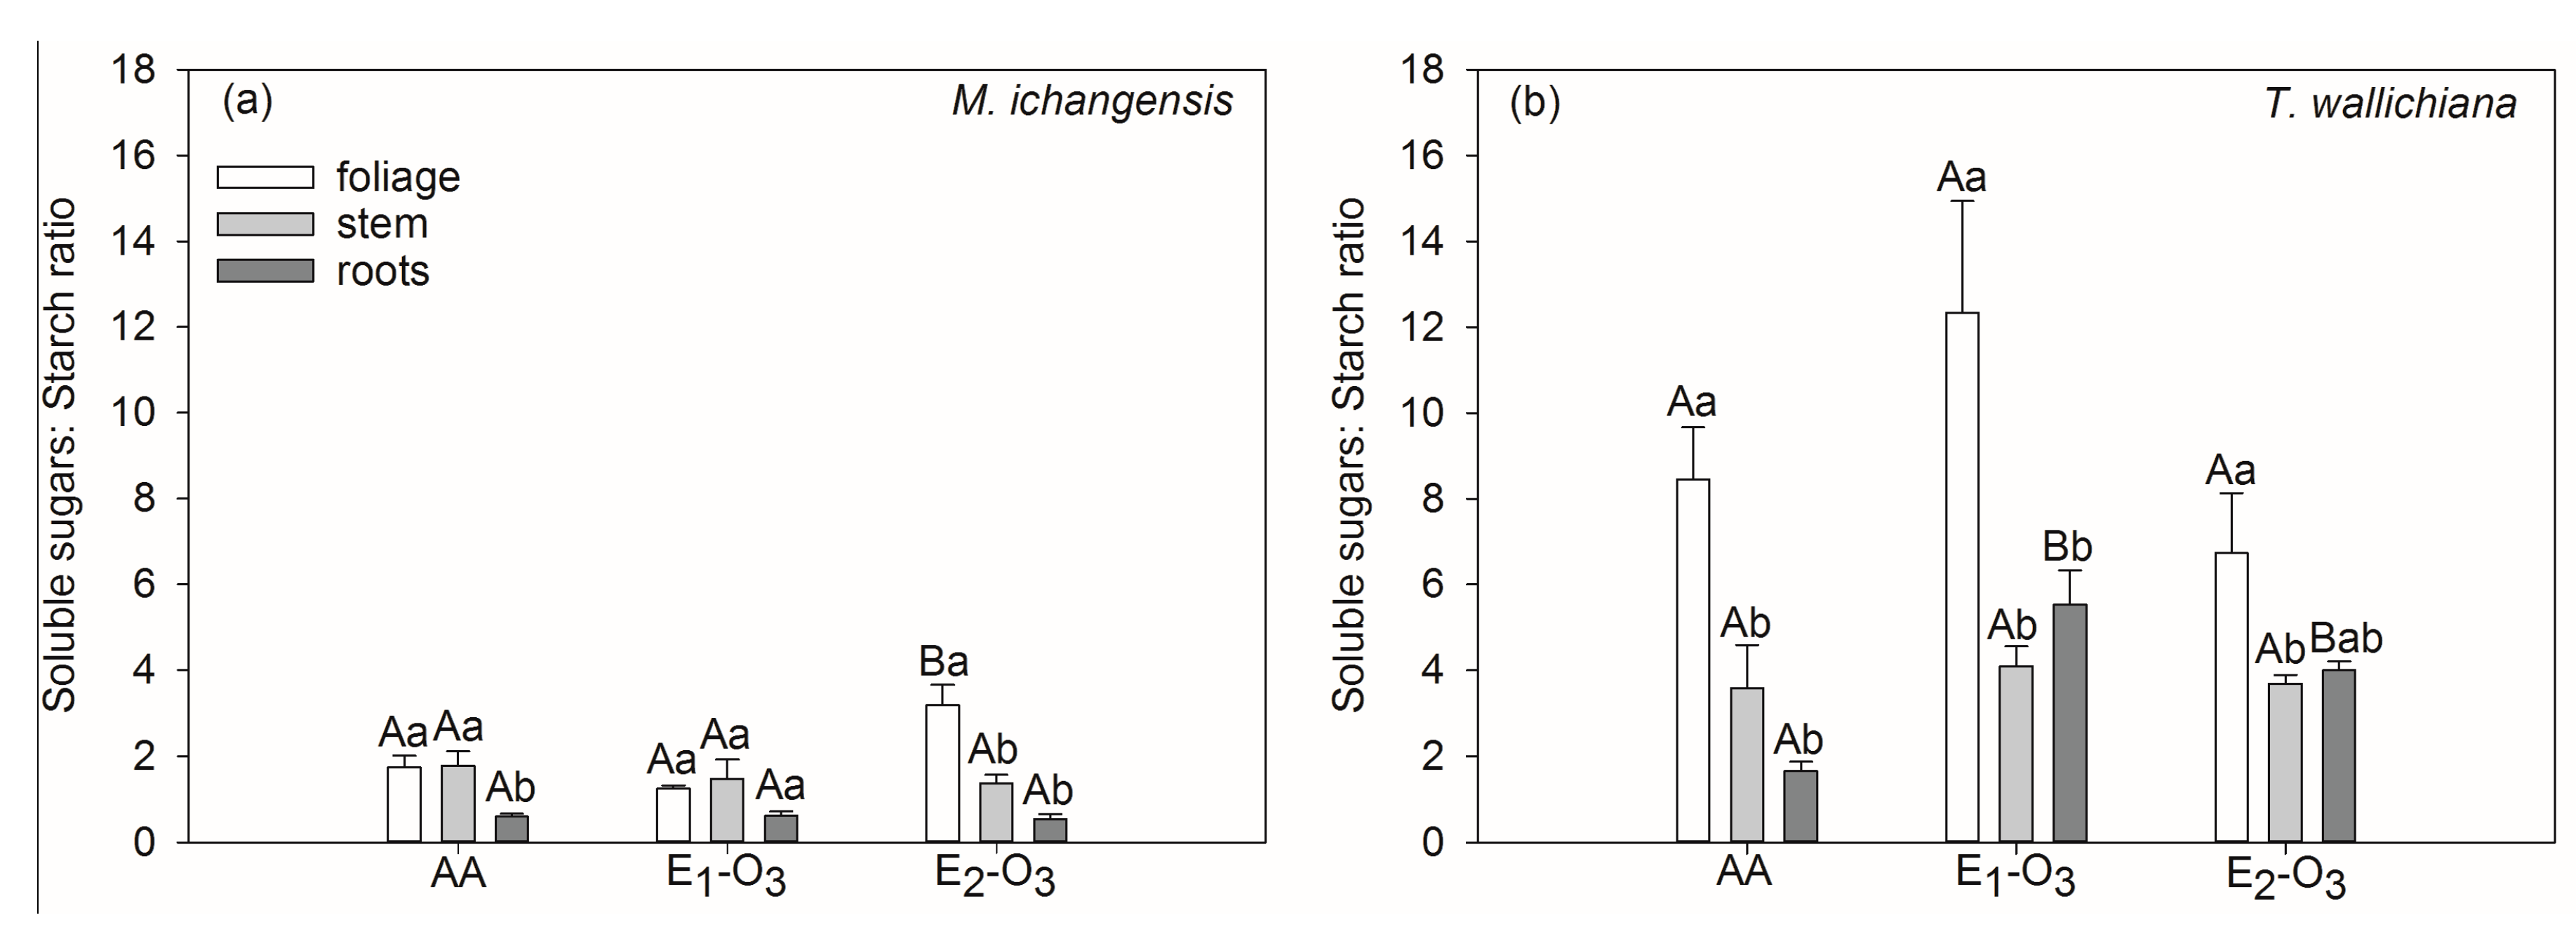
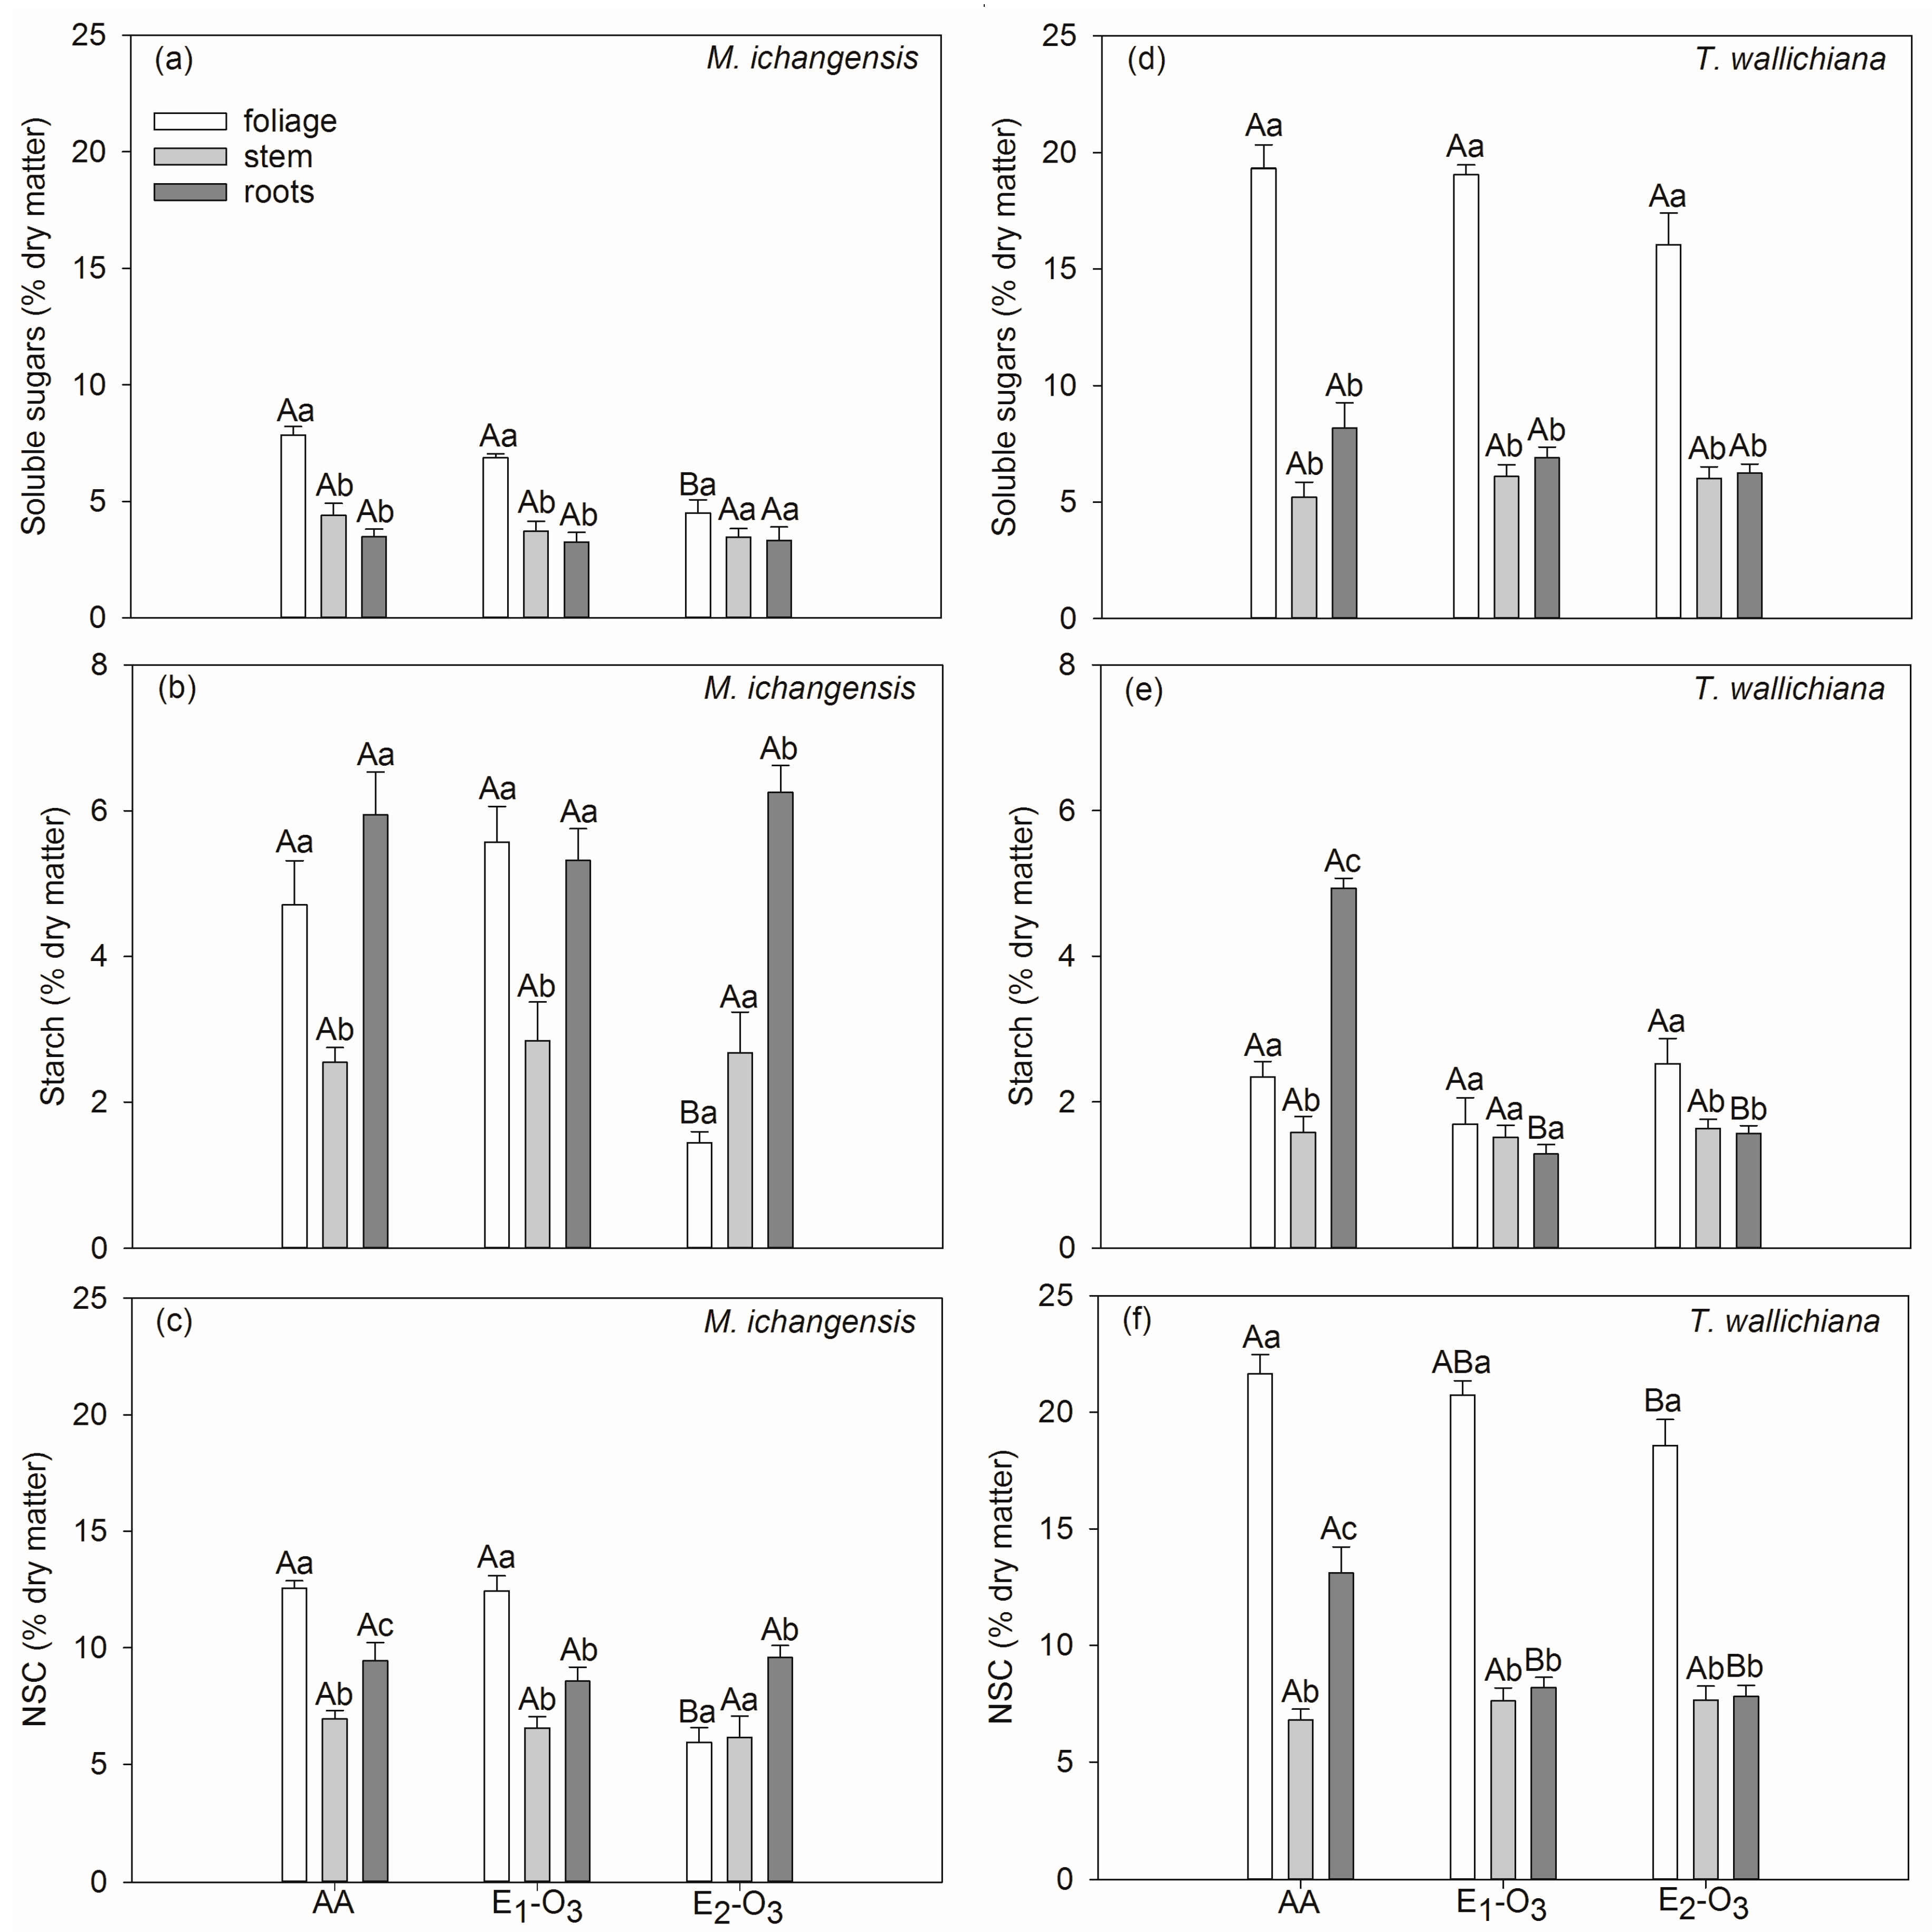
3.2. Effects of Elevated O3 on Non-Structural Carbohydrates of Different Seedling Tissues

The soluble sugars, starch, and NSC concentrations of individual tissues in the two species under three different O3 fumigation treatments are shown in Figure 3. The soluble sugars concentration in the foliage of M. ichangensis significantly decreased from 7.85% under the AA treatment to 4.51% under the E2-O3 treatment (Figure 3a). The starch concentration in the foliage of M. ichangensis under the E2-O3 treatment was significantly lower compared to that under the other two treatments; in contrast, the starch concentration in stem and roots of M. ichangensis did not obviously change with elevated O3 (Figure 3b). For T. wallichiana, elevated O3 only significantly decreased the starch concentration of roots (Figure 3e). The NSC concentrations of the foliage in the two species and NSC concentration of the roots in T. wallichiana decreased significantly with elevated O3 (Figure 3c,f). Compared to the AA treatment, the NSC concentration in the foliage of M. ichangensis and roots of T. wallichiana respectively decreased by 52.61% and 32.16% under the E2-O3 treatment. Except for M. ichangensis under the E2-O3 treatment, the NSC concentration of the foliage was much greater than that of other tissues in the two species under each of the O3 fumigation treatments. The ratio of soluble sugars to starch in the foliage of M. ichangensis under the E2-O3 treatment was significantly higher than that under the other two treatments (Figure 4a). For T. wallichiana, elevated O3 significantly increased the ratio of soluble sugars to starch in roots (Figure 4b). In contrast, no significant differences among the ratios under different treatments were observed in any other tissues in the two species (Figure 4a,b).
For M. ichangensis; Table 1 shows that the concentrations of NSCs and their components were only significantly and positively correlated with Pn in foliage, while the soluble sugar concentration in foliage was also significantly and positively correlated with total C stock. In contrast, the concentration of soluble sugars in foliage, starch concentration in roots, and NSC concentrations in both foliage and roots were all significantly and positively correlated with Pn in T. wallichiana (Table 1). In addition, both NSC and soluble sugars concentrations in foliage were significantly and positively correlated with total C stock in T. wallichiana (Table 1).

4. Discussion

The results showed a decreasing trend in the concentration of soluble sugars in the foliage of M. ichangensis with elevated O3, which is consistent with the results described by Riikonen et al. [38] and Kostiainen et al. [39]. In contrast, Chen et al. [17] found that the foliar soluble sugars concentration in Phoebe bournei (Hemsl.) Yang and Pinus massoniana Lamb did not respond clearly to O3 stress; furthermore, other studies reported that elevated O3 obviously enhanced the soluble sugars of foliage in other tree species [40,41]. These contradictory results may be due to differences in species and the experimental duration. A previous study suggested that chronic exposure to elevated O3 would result in the consumption of soluble sugars, and inhibit the production of soluble sugars for sensitive plants [42]. In our study, the E2-O3 treatment significantly decreased starch concentration in the foliage of M. ichangensis, which corroborates the findings of studies on other plant species [43,44,45]. This phenomenon may be induced by the fact that O3 stress depressed photosynthesis in the leaves of sensitive plants and resulted in a decrease in foliar starch concentrations [46]. The concentrations of NSCs and their components in the roots of M. ichangensis did not significantly change with elevated O3; in contrast, NSCs and starch concentrations in the roots decreased significantly, and were significantly and positively correlated with Pn for T. wallichiana. Previous studies also found that elevated O3 decreased starch concentrations in the roots of some conifer trees, such as ponderosa pine and spruce seedlings [45,47]. One possible explanation is that starch synthesis in the roots of T. wallichiana could be reduced by a reduction in the allocation of carbohydrates from leaves to roots due to decreased phloem loading, membrane repair, and antioxidant synthesis in leaves [48]. These results suggest that the two species set up different strategies of C allocation under elevated O3. The differences in responses of tree species to elevated O3 may be also due in part to differences in some other influencing factors, such as tree age, microclimate, nutrition, and other stresses [14]. Tingey et al. reported that O3 sensitivity increased with increasing precipitation and tended to decrease with increasing temperature for Pinus ponderosa Doug. ex Laws [49]. In addition, using different exposure regimes may lead to differences in results of O3 sensitivity for the same species. A previous study compared steady-state O3 exposure (square wave) with varying O3 exposure which mimicked the natural state, and suggested that chamber experiments using a steady-state O3 exposure may underestimate the harmful impacts of O3 stress on Brassica napus L. with the same mean O3 concentration and AOT40 [50].
In our study, the ratio of soluble sugars to starch in the foliage of M. ichangensis (1.74) was much lower than that of T. wallichiana (8.70) under the AA treatment, indicating that the two species are constitutively different in their metabolism. Previous studies showed that tree species that had higher levels of soluble sugars accumulation would be more tolerant to cold stress [51,52]. Due to sugars playing a key role in metabolism and the synthesis of compounds, we speculate that the tree species that initially accumulate more soluble sugars which are consumed at a lower rate would also be more tolerant to O3 stress, especially in foliage. Our results showed that the Pn of M. ichangensis under the E2-O3 treatment were significantly lower compared to the AA treatment during the period of mid-June to mid-October; in contrast, the net photosynthetic rate of T. wallichiana under the E2-O3 treatment was not significantly different from that under the AA treatment before mid-September. These results indicate that M. ichangensis would exhibit an earlier decrease in Pn with the same level of elevated O3. Furthermore, M. ichangensis showed a greater decrease in the NSC concentration of foliage and total C stock compared to T. wallichiana under the E2-O3 treatment in the present study. It was suggested that O3 stress induced the decrease in Pn for the two species mainly due to the non-stomatal factors [27], which include (1) an increase in diffusive resistance to CO2 in the mesophyll; (2) a reduction in photosystem II (PS II); and (3) a decrease in chlorophyll content and inhibition of electron transport [53]. The negative impacts of O3 on plants was also correlated with the antioxidative capability [24]. Yu et al. reported that elevated O3 significantly increased malondialdehyde (MDA) concentration, and reduced ascorbic acid (AsA) concentration and activity of superoxide dismutase (SOD) in the foliage of M. ichangensis; in contrast, elevated O3 only significantly increased the activity of SOD in the foliage of T. wallichiana [27]. In our case, we suggest that T. wallichiana was more tolerant to elevated O3 compared to M. ichangensis. In the present study, the soluble sugar concentration in foliage was significantly and positively correlated with Pn and total C stock for both of the two species. These correlations may indicate elevated O3 decreased foliar soluble sugar concentration by restricting the photosynthetic rate for the two species, and further reduced the transportation of soluble sugar to different C sink tissues, and finally depressed the accumulation of biomass C.

5. Conclusions

Chronically increasing tropospheric O3 concentration may lead to a serious adverse impact on the two high economic value species studied in this paper. In this study, we found that elevated O3 significantly decreased Pn and total C stock for both M. ichangensis and T. wallichiana, while it also significantly decreased the NSC concentrations in the foliage of the two species, and the roots of T. wallichiana. However, the concentrations of NSCs and their components did not change obviously in other tissues of the two species. The significant increases in the ratio of soluble sugars to starch were observed respectively in the foliage of M. ichangensis and the roots of T. wallichiana. The foliar soluble sugars concentrations in both species were significantly and positively correlated with total C stock. For M. ichangensis, Pn was significantly and positively correlated with NSCs and their components only in foliage; in contrast, the NSCs in both foliage and roots were significantly and positively correlated with Pn for T. wallichiana. M. ichangensis was more sensitive to elevated O3 in regard to its Pn, total C stock, and NSC concentration of foliage. The information provided by our study will improve the understanding of the differences in C allocation resulting from elevated O3 among the different tree species. Moreover, our results could be an important basis for the management of economic tree species in the scenario of elevated O3. Due to the limitation in the experiment duration and tree growth stage, further evidence for the responses of the two species to elevated O3 will be required.

Acknowledgments

This work was supported by the National Public Benefit Special Fund of China for Forestry Research (No. 201304313).

Author Contributions

He Shang, Jixin Cao, and Zhan Chen conceived and designed the experiments; He Shang, Zhan Chen, Jixin Cao, and Hao Yu performed the experiments; Jixin Cao analyzed data; Jixin Cao contributed reagents/materials/analysis tools; Jixin Cao wrote the manuscript.

Conflicts of Interest

The authors declare no conflict of interest.

References

  1. Feng, Z.; Pang, J.; Kobayashi, K.; Zhu, J.; Ort, D.R. Differential responses in two varieties of winter wheat to elevated ozone concentration under fully open-air field conditions. Glob. Chang. Biol. 2011, 17, 580–591. [Google Scholar] [CrossRef]
  2. Pacifico, F.; Folberth, G.A.; Sitch, S.; Haywood, J.M.; Rizzo, L.V.; Malavelle, F.F.; Artaxo, P. Biomass burning related ozone damage on vegetation over the Amazon forest: A model sensitivity study. Atmos. Chem. Phys. 2015, 15, 2791–2804. [Google Scholar] [CrossRef] [Green Version]
  3. Vingarzan, R. A review of surface O3 background levels and trends. Atmos. Environ. 2004, 38, 3431–3442. [Google Scholar] [CrossRef]
  4. Fowler, D.; Amann, M.; Anderson, R.; Ashmore, M.; Cox, P.; Depledge, M.; Derwent, D.; Grennfelt, P.; Hewitt, N.; Hov, O.; et al. Ground-Level Ozone in the 21st Century: Future Trends, Impacts and Policy Implications; Society Science Policy Report, 15/08; The Royal Society: London, UK, 2008; pp. 1–4. [Google Scholar]
  5. Stevenson, D.S.; Dentener, F.J.; Schultz, M.G.; Ellingsen, K.; van Noije, T.P.C.; Wild, O.; Zeng, G.; Amann, M.; Atherton, C.S.; Bell, N.; et al. Multimodel ensemble simulations of present-day and near-future tropospheric ozone. J. Geophys. Res. 2006, 111, D08301. [Google Scholar] [CrossRef]
  6. Avnery, S.; Mauzerall, D.L.; Liu, J.; Horowitz, L.W. Global crop yield reductions due to surface ozone exposure: 2. Year 2030 potential crop production losses and economic damage under two scenarios of O3 pollution. Atmos. Environ. 2011, 45, 2297–2309. [Google Scholar] [CrossRef]
  7. De Leeuw, F.A.A.M.; van Zantvoort, E.D.G. Mapping of exceedances of ozone critical levels for crops and forest trees in the Netherlands: Preliminary results. Environ. Pollut. 1997, 96, 89–98. [Google Scholar] [CrossRef]
  8. Zhang, Q.; He, K.; Huo, H. Cleaning China’s air. Nature 2012, 484, 161–162. [Google Scholar] [PubMed]
  9. Li, J.; Lu, K.; Lv, W.; Li, J.; Zhong, L.; Ou, Y.; Chen, D.; Huang, X.; Zhang, Y. Fast increasing of surface ozone concentrations in Pearl River Delta characterized by a regional air quality monitoring network during 2006–2011. J. Environ. Sci. 2014, 26, 23–36. [Google Scholar] [CrossRef]
  10. Yuan, X.; Calatayud, V.; Jiang, L.; Manning, W.J.; Hayes, F.; Tian, Y.; Feng, Z. Assessing the effects of ambient ozone in China on snap bean genotypes by using ethylenediurea (EDU). Environ. Pollut. 2015, 205, 199–208. [Google Scholar] [CrossRef] [PubMed]
  11. Anger, A.; Dessens, O.; Xi, F.; Barker, T.; Wu, R. China’s air pollution reduction efforts may result in an increase in surface ozone levels in highly polluted areas. Ambio 2016, 45, 254–265. [Google Scholar] [CrossRef] [PubMed]
  12. Curtis, P.S.; Wang, X. A meta-analysis of elevated CO2 effects on woody plant mass, form, and physiology. Oecologia 1998, 113, 299–313. [Google Scholar] [CrossRef] [PubMed]
  13. Zak, D.R.; Holmes, W.E.; Pregitzer, K.S. Atmospheric CO2 and O3 alter the flow of 15N in developing forest ecosystems. Ecology 2007, 88, 2630–2639. [Google Scholar] [CrossRef] [PubMed]
  14. Karnosky, D.F.; Skelly, J.M.; Percy, K.E.; Chappelka, A.H. Perspectives regarding 50 years of research on effects of tropospheric ozone air pollution on US forests. Environ. Pollut. 2007, 147, 489–506. [Google Scholar] [CrossRef] [PubMed]
  15. Coleman, M.D.; Dickson, R.E.; Isebrands, J.G.; Karnosky, D.F. Carbon allocation and partitioning in aspen clones varying in sensitivity to tropospheric ozone. Tree Physiol. 1995, 15, 593–604. [Google Scholar] [CrossRef] [PubMed]
  16. Battistelli, A.; Pasqualini, S.; Moscatello, S.; Ederli, L.; Proietti, S.; Antonielli, M. Effects of short-term ozone fumigation on carbohydrates in darkened tobacco leaves. Plant Physiol. Biochem. 2001, 39, 539–543. [Google Scholar] [CrossRef]
  17. Chen, Z.; Shang, H.; Cao, J.; Yu, H. Effects of ambient ozone concentrations on contents of nonstructural carbohydrates in Phoebe bournei and Pinus massoniana seedlings in subtropical China. Water Air Soil Pollut. 2015, 226, 1–8. [Google Scholar] [CrossRef]
  18. Xiao, L.; Wang, S. Plant Physiology, 1st ed.; China Agriculture Press: Beijing, China, 2004; pp. 167–187. [Google Scholar]
  19. Hoch, G. Cell wall hemicelluloses as mobile carbon stores in non-reproductive plant tissues. Funct. Ecol. 2007, 21, 823–834. [Google Scholar] [CrossRef]
  20. Rook, F.; Hadingham, S.A.; Li, Y.; Bevan, M.W. Sugar and ABA response pathways and the control of gene expression. Plant Cell Environ. 2006, 29, 426–434. [Google Scholar] [CrossRef] [PubMed]
  21. Smeekens, S.; Ma, J.; Hanson, J.; Rolland, F. Sugar signals and molecular networks controlling plant growth. Curr. Opin. Plant Biol. 2010, 13, 274–279. [Google Scholar] [CrossRef] [PubMed]
  22. Shi, P.; Körner, C.; Hoch, G. End of season carbon supply status of woody species near the treeline in western china. Basic Appl. Ecol. 2006, 7, 370–377. [Google Scholar] [CrossRef]
  23. Yu, L.; Wang, C.; Wang, X. Allocation of nonstructural carbohydrates for three temperate tree species in Northeast China. Chin. J. Plant Ecol. 2011, 35, 1245–1255. [Google Scholar] [CrossRef]
  24. Zhang, W. Effects of Elevated O3 Level on the Native Tree Species in Subtropical China. Ph.D. Thesis, Research Center for Eco-Environmental Sciences, Chinese Academy of Sciences, Beijing, China, 2011. [Google Scholar]
  25. Niu, J. Effects of Elevated Ozone and Nitrogen Deposition on the Growth and Physiology of Cinnamomum Camphora Seedlings. Ph.D. Thesis, Research Center for Eco-Environmental Sciences, Chinese Academy of Sciences, Beijing, China, 2012. [Google Scholar]
  26. Cao, J.; Shang, H.; Chen, Z.; Tian, Y.; Yu, H. Effects of elevated ozone on stoichiometry and nutrient pools of Phoebe bournei (Hemsl.) Yang and Phoebe zhennan S. Lee et F. N. Wei seedlings in subtropical China. Forests 2016, 7, 78. [Google Scholar] [CrossRef]
  27. Yu, H.; Chen, Z.; Shang, H.; Cao, J. Physiological and biochemical responses of Machilus ichangensis Rehd. et Wils and Taxus chinensis (Pilger) Rehd. to elevated O3 in subtropical China. Environ Sci. Pollut. Res. 2017. [Google Scholar] [CrossRef] [PubMed]
  28. Fei, Y.; Yu, X.; Yang, M.; Ke, L.; Liu, Y.; Lan, X. Effects of recommended fertilization on growth and photosynthetic physiology of Machilus ichangensis Rehd. et Wils seedlings. China For. Sci. Tech. 2009, 23, 46–49. [Google Scholar]
  29. Yang, B.; Ju, T.; Cao, C.; Li, B.; Zhang, S.; Ma, J. Dynamic analysis of Taxus wallichiana var. chinensis population in Xiaolong Mountain National Nature Reserve, Gansu Province. J. Gansu Agric. Univ. 2015, 50, 88–93. [Google Scholar]
  30. Zhang, X.; Fu, X.; Wang, G.; Cheng, F.; Chen, J. Anti-inflammatory activity in vitro of n-BuOH extract from Machilus ichangensis. J. China Three Gorges Univ. 2013, 35, 98–102. [Google Scholar]
  31. Bao, W.; Chen, Q. Present status, problems, and further development strategies on natural Taxus resource and their exploitation in China. J. Nat. Resour. 1998, 13, 375–380. [Google Scholar]
  32. Dong, W.; Zhang, X.; Wang, H.; Dai, X.; Sun, X.; Qiu, W.; Yang, F. Effect of different fertilizer application on the soil fertility of paddy soils in red soil region of southern China. PLoS ONE 2012, 7, e44504. [Google Scholar] [CrossRef] [PubMed]
  33. Shao, M.; Tang, X.; Zhang, Y.; Li, W. City clusters in China: Air and surface water pollution. Front. Ecol. Environ. 2006, 4, 353–361. [Google Scholar] [CrossRef]
  34. Manual on Methodologies and Criteria for Modelling and Mapping Critical Loads and Levels and Air Pollution Effects, Risks and Trends. Available online: http://www.icpmapping.org./Latest_update_Mapping_ Manual (accessed on 15 July 2017).
  35. Ma, Z.; Wang, Y.; Zhang, X.; Xu, J. Comparison of ozone between Beijing and downstream Area. Environ. Sci. 2011, 32, 924–929. [Google Scholar]
  36. Anav, A.; De Marco, A.; Proietti, C.; Alessandri, A.; Dell’Aquila, A.; Cionni, I.; Friedlingstein, P.; Khvorostyanov, D.; Menut, L.; Paoletti, E.; et al. Comparing concentration-based (AOT40) and stomatal uptake (PODY) metrics for ozone risk assessment to European forests. Glob. Chang. Biol. 2015, 22, 1608–1627. [Google Scholar] [CrossRef] [PubMed]
  37. Eggleston, H.S.; Buendia, L.; Miwa, K.; Ngara, T.; Tanabe, K. 2006 IPCC Guidelines for National Greenhouse Gas Inventories (Volume 4) Agriculture, Forestry and Other Land Use, 1st ed.; Institute for Global Environmental Strategies: Hayama, Japan, 2006; p. 48. [Google Scholar]
  38. Riikonen, J.; Kontunen-Soppela, S.; Ossipov, V.; Tervahauta, A.; Tuomainen, M.; Oksanen, E.; Vapaavuori, E.; Heinonen, E.; Kivimäenpää, M. Needle metabolome, freezing tolerance and gas exchange in Norway spruce seedlings exposed to elevated temperature and ozone concentration. Tree Physiol. 2012, 32, 1102–1112. [Google Scholar] [CrossRef] [PubMed]
  39. Kostiainen, K.; Kaakinen, S.; Warsta, E.; Kubiske, M.E.; Nelson, N.D.; Sober, J.; Karnosky, D.; Saranpaa, P.; Vapaavuori, E. Wood properties of trembling aspen and paper birch after 5 years of exposure to elevated concentrations of CO2 and O3. Tree Physiol. 2008, 28, 805–813. [Google Scholar] [CrossRef] [PubMed]
  40. Barnes, R.L. Effects of chronic exposure to ozone on soluble sugar and ascorbic acid contents of pine seedlings. Can. J. Bot. 1972, 50, 215–219. [Google Scholar] [CrossRef]
  41. Landolt, W.; Günthardt-Goerg, M.; Pfenninger, I.; Scheidegger, C. Ozone-induced microscopical changes and quantitative carbohydrate contents of hybrid poplar (Populus × euramericana). Trees 1994, 8, 183–190. [Google Scholar] [CrossRef]
  42. Zhang, Y.; Dong, X.G.; Xue, L.; Chen, H.Y.; Liang, Z.Y. Effects of ozone stress on physiological characteristics of Elaeocarpus sylvestris seedlings. J. Cent. South Univ. Technol. 2015, 35, 97–103. [Google Scholar]
  43. Meier, S.; Grand, L.F.; Schoeneberger, M.M.; Reinert, R.A.; Bruck, R.I. Growth, ectomycorrhizae and nonstructural carbohydrates of loblolly pine seedlings exposed to ozone and soil water deficit. Environ. Pollut. 1990, 64, 11–17. [Google Scholar] [CrossRef]
  44. Paynter, V.A.; Reardon, J.C.; Shelburne, V.B. Carbohydrate changes in shortleaf pine (Pinus echinata) needles exposed to acid rain and ozone. Can. J. Res. 1991, 21, 666–671. [Google Scholar] [CrossRef]
  45. Braun, S.; Zugmaier, U.; Thomas, V.; Flückiger, W. Carbohydrate concentrations in different plant parts of young beech and spruce along a gradient of ozone pollution. Atmos. Environ. 2004, 38, 2399–2407. [Google Scholar] [CrossRef]
  46. Neufeld, H.S.; Peoples, S.J.; Davison, A.W.; Chappelka, A.H.; Somers, G.L.; Thomley, J.E.; Booker, F.L. Ambient ozone effects on gas exchange and total non-structural carbohydrate levels in cutleaf coneflower (Rudbeckia laciniata L.) growing in Great Smoky Mountains National Park. Environ. Pollut. 2012, 160, 74–81. [Google Scholar] [CrossRef] [PubMed]
  47. Andersen, C.P.; Scagel, C.F. Nutrient availability alters below-ground respiratory responses of Ponderosa Pine to ozone. Tree Physiol. 1997, 17, 377–387. [Google Scholar] [CrossRef] [PubMed]
  48. Andersen, C.P. Source-sink balance and carbon allocation below ground in plants exposed to ozone. New Phytol. 2003, 157, 213–218. [Google Scholar] [CrossRef]
  49. Tingey, D.T.; Laurence, J.A.; Weber, J.A.; Greene, J.; Hogsett, W.E.; Brown, S.; Lee, E.H. Elevated CO2 and temperature alter the response of Pinus ponderosa to ozone: A simulation analysis. Ecol. Appl. 2001, 11, 1412–1424. [Google Scholar]
  50. Wang, X.; Zheng, Q.; Feng, Z.; Xie, J.; Feng, Z.; Ouyang, Z.; Manning, W.J. Comparison of a diurnal vs steady-state ozone exposure profile on growth and yield of oilseed rape (Brassica napus L.) in open-top chambers in the Yangtze Delta, China. Environ. Pollut. 2008, 156, 449–453. [Google Scholar] [CrossRef] [PubMed]
  51. Ögren, E.; Nilsson, T.; Sunfblad, L.G. Relationship between respiratory depletion of sugars and loss of cold hardiness in coniferous seedlings over-wintering at raised temperatures: Indications of different sensitivities of spruce and pine. Plant Cell Environ. 1997, 20, 247–253. [Google Scholar] [CrossRef]
  52. Morin, X.; Améglio, T.; Ahas, R.; Kurz-besson, C.; Lanta, V.; Lebourgeois, F.; Miglietta, F.; Chuine, I. Variation in cold hardiness and carbohydrate concentration from dormancy induction to bud burst among provenances of three European oak species. Tree Physiol. 2007, 27, 817–825. [Google Scholar] [CrossRef] [PubMed]
  53. Ismail, I.M.; Basahi, J.M.; Hassan, I.A. Gas exchange and chlorophyll fluorescence of pea (Pisum sativum L.) plants in response to ambient ozone at a rural site in Egypt. Sci. Total Environ. 2014, 498, 585–593. [Google Scholar] [CrossRef] [PubMed]
Figure 1. Variations in the net photosynthetic rate (Pn) of Machilus ichangensis Rehd. et Wils. (M. ichangensis) (a) and Taxus wallichiana Zucc. var. chinensis (Pilg.) Florin (T. wallichiana) (b) under the different O3 fumigation treatments . Bars indicate standard error of the mean (n = 3). The capital letter “A” indicates a significant difference between the ambient air (AA) treatment and the elevated O3 treatments 2 (E2-O3), the capital letter “B” indicates a significant difference between the AA treatment and the elevated O3 treatments 1 (E1-O3), and the capital letter “C” indicates a significant difference between the E1-O3 and the E2-O3 treatments for the same species (p < 0.05).
Forests 08 00323 g001
Figure 2. Effects of elevated O3 on individual tissues C stock of M. ichangensis (a) and T. wallichiana (b). Bars indicate standard error of the mean (n = 3). Different capital letters indicate a significant difference between O3 fumigation treatments for the same tree tissues (p < 0.05).
Forests 08 00323 g002
Figure 3. Soluble sugars (a,d), starch (b,e), and non-structural carbohydrate (NSC) concentrations (c,f) in individual tissues of M. ichangensis (ac) and T. wallichiana (df) under different O3 fumigation treatments. Different capital letters indicate a significant difference between O3 fumigation treatments for the same tree tissues (p < 0.05), and different lower-case letters indicate a significant difference between different tissues within the same species under the same O3 fumigation treatments (p < 0.05). Bars indicate standard error of the mean (n = 3).
Forests 08 00323 g003
Figure 4. Ratios of soluble sugars to starch in individual tissues of M. ichangensis (a) and T. wallichiana (b) under different O3 fumigation treatments. Different capital letters indicate a significant difference between O3 fumigation treatments for the same tree tissues (p < 0.05), and different lower-case letters indicate a significant difference between different tissues within the same species under the same O3 fumigation treatments (p < 0.05). Bars indicate standard error of the mean (n = 3).
Forests 08 00323 g004
Table 1. Correlation coefficients between NSC/soluble sugars/starch concentration and Pn/total C stock for each of the tissues of the two species.
TissuesNSC ComponentsPnTotal C Stock
M. ichangensisFoliageNSC0.807 **0.610
 Soluble sugars0.848 **0.721 *
 Starch0.680 *0.518
StemNSC0.3950.389
 Soluble sugars0.5780.435
 Starch−0.0720.077
RootNSC−0.0310.133
 Soluble sugars0.2210.175
 Starch−0.2250.030
T. wallichianaFoliageNSC0.858 **0.729 *
 Soluble sugars0.871 **0.745 *
 Starch−0.121−0.099
StemNSC−0.449−0.079
 Soluble sugars−0.3580.034
 Starch−0.294−0.386
RootNSC0.720 *0.420
 Soluble sugars0.5800.365
 Starch0.685 *0.379
During the experiment, the last measured data of Pn were used for analyzing. * Significances are indicated at p < 0.05. ** Significances are indicated at p < 0.01.

