Article

Updating Bark Proportions for the Estimation of Tropical Timber Volumes by Indigenous Community-Based Forest Enterprises in Quintana Roo, Mexico

by
Julieta A. Rosell
1,*,
Christian Wehenkel
2,
Abraham Pérez-Martínez
1,
José Antonio Arreola Palacios
3,
Sandra P. García-Jácome
1 and
Marcela Olguín
4
1
Laboratorio Nacional de Ciencias de la Sostenibilidad, Instituto de Ecología, Universidad Nacional Autónoma de México, Mexico City CP 04510, Mexico
2
Instituto de Silvicultura e Industria de la Madera, Universidad Juárez del Estado de Durango, Km. 5.5 Carretera Mazatlán, Durango CP 34120, Mexico
3
U’ Yool’ Che A.C., Calle 69, Centro, Felipe Carrillo Puerto CP 77220, Mexico
4
Consultant to the Commission for Environmental Cooperation, 393 St-Jacques Street West, Suite 200, Montreal, QC H2Y 1N9, Canada
*
Author to whom correspondence should be addressed.
Forests 2017, 8(9), 338; https://doi.org/10.3390/f8090338
Submission received: 30 June 2017 / Revised: 4 September 2017 / Accepted: 6 September 2017 / Published: 10 September 2017

Abstract

:
Sustainable management of tropical forests is essential for conserving the ecosystem services they provide and protecting the livelihoods of the millions of people who depend on these forests. Community-based forest management in Quintana Roo, Mexico, has shown that conserving forests while generating economic benefits is achievable in the tropics. However, this management is carried out with technical gaps that jeopardize sustainable use of these resources. Crucial among these gaps is a lack of equations for precise calculations of logged timber volumes. Current equations employ a proportion of bark volume (PBV) of 0.14 for mahogany and a flat 0.10 for species with dense woods, despite their wide variation in bark thickness. Here, using Meyer’s method, we calculated species-specific PBVs for the most commercially-important species in the Felipe Carrillo Puerto community-based logging operation. For most species, the new PBVs were smaller, indicating that wood volumes are currently underestimated. However, for two species, PBVs were higher. New values could influence the profits of the local enterprise and on the management of some of the most commercially-important species of Mexico’s tropical forests through changes in the numbers of individuals felled.

1. Introduction

Sustainable management of tropical forests is essential for the conservation of the ecosystem services these forests provide [1,2]. Tropical forests are crucial in maintaining global biogeochemical cycles, conserving biodiversity [3,4], and mitigating climate change [5,6,7]. Moreover, tropical forests worldwide provide a livelihood for millions of people, many of them belonging to marginalized indigenous populations [8].
With its diverse indigenous populations and its 31 million hectares of wet and dry tropical forests, Mexico ranks sixth among countries with the largest tropical forest areas [9,10]. Approximately 60% of Mexico’s forested area (including both temperate and tropical forests) is managed by local communities [11]. This depth of experience has made Mexico a leading example of community-based forest management [12]. Among Mexican wet tropical forests, those in the state of Quintana Roo in the Yucatan Peninsula stand out because of their great extent (4.4 Mha; [13,14]) and their high degree of conservation, which has been attributed to their three decades under community-based management [15,16,17]. As a result, communal management of the forests of Quintana Roo has become a paradigm of management that fosters both conservation and economic benefits [12,18,19,20]. However, this management is carried out with crucial technical gaps that jeopardize the sustainable management of the tropical rainforests in this area.
One of the main knowledge gaps regarding management practices is the lack of equations for precise calculations of logged timber volumes for the tropical species of Quintana Roo. Most of the forest management guidelines used in Quintana Roo are derived from the Pilot Forestry Plan [21,22]. Dating from the early 1980s, this plan was created after the replacement of timber concessions in Quintana Roo with a policy giving communities direct control of forest management and harvesting rights [16]. As part of this plan, permanent forest areas for timber harvesting were established within ejidos Mexican government-sponsored rural collectives), with technical training and financial support being provided to create community-based forest enterprises [23]. Equations used by these enterprises to calculate logged timber volumes originate from this plan and are imprecise in most cases. The current equations likely over- or under-estimate wood volumes. To the extent that such underestimations lead to profit loss, and to overharvest of high-value species, updated equations are urgently needed for commercial tree species.
Following the expression of interest by members of the Ejido Felipe Carrillo Puerto (FCP) in Quintana Roo (Figure 1), we updated volume equations for the most important species commercialized by the ejido enterprise. Logging of its semi-evergreen tropical forest is one of the main economic activities in the community. For the past three decades, the ejido and others in Quintana Roo have used general (i.e., not species-specific) equations in their logging activities. The wood volume (WV) for a log is calculated using Equation (1), where Dmp is the diameter at the midpoint of a log, L is the length of the log and PBV is the proportion of log volume accounted for by bark.
W V = 0.785 · D m p 2   · L · ( 1 P B V )
Three PBV values are used, 0.14 for mahogany (Swietenia macrophylla King), 0.21 for the amapola tree (Pseudobombax ellipticum (Kunth) Dugand), and 0.10 for a group of species with dense woods. However, given that a fixed value of 0.10 is used for the proportion of bark volume in species with remarkably different bark thicknesses (Figure 2), differences in calculated and actual wood and bark volumes could potentially be large, particularly for the species with dense wood and thin bark.
Although the semi-evergreen tropical forest in the area is highly diverse [24] and around 50 species have been identified in the FCP ejido with potential for sawn lumber [25], six species make up the core of the logging activity in the forest enterprise. These six species, which have markedly varied bark proportions and characteristics, represented 82–97% of total sales from 2010–2016 (data from the ejido’s administration). Furthermore, these six species are widely distributed in Quintana Roo and are commercialized by other community-based enterprises in the state. Here, we updated the PBV values for these six species. From all species at the site, the big-leaf mahogany (Swietenia macrophylla King) has been the most valued species by far for its fine timber [26]. As a result, forest management plans in Quintana Roo have been traditionally designed around this species [27]. Highly valued for its gummy latex, the sapodilla or chicozapote tree (Manilkara zapota (L.) P. Royen) sustained the chewing gum industry that peaked in the 1940s [20]. After the decline of this activity in the ejido, the chicozapote became an important source of construction lumber, given that it is one of the dominant species in the forest. Two other species, the tzalam (Lysiloma latisiliquum (L.) Benth.) and the poisonwood or chechén (Metopium brownei (Jacq.) Urb.), are also abundant and have experienced an increase in use in recent years [28], especially for flooring and furniture. The attractive wood of the katalosh (Swartzia cubensis (Britton and Wilson)) and the siricote (Cordia dodecandra A.DC.) have made these species important resources for export. Although not currently protected under Mexican law, the siricote has become rarer in the forest and has been considered vulnerable to extinction [29].
In this study, we calculated the PBV of these six species following Wehenkel et al. [30] and determined bark volume through the non-destructive Meyer method [31]. We also examined the correlation between PBV and log diameter, between bark volume and total volume, and between wood volume and total volume to examine how bark amount varied with tree size and whether this change had to be taken into account in the calculations of commercialized timber volumes. The updated equations presented here could have a significant effect not only on the profits of the ejido enterprise, but also on the number of individuals felled, and thus on the management of some of the most commercially-harvested species in the tropical forests of Mexico [32,33]. The new equations generated here aim to improve the forest management of ejidos in Quintana Roo, Mexico and therefore contribute to the long-term use of forest resources and conservation of ecosystem services provided by the forest.

2. Materials and Methods
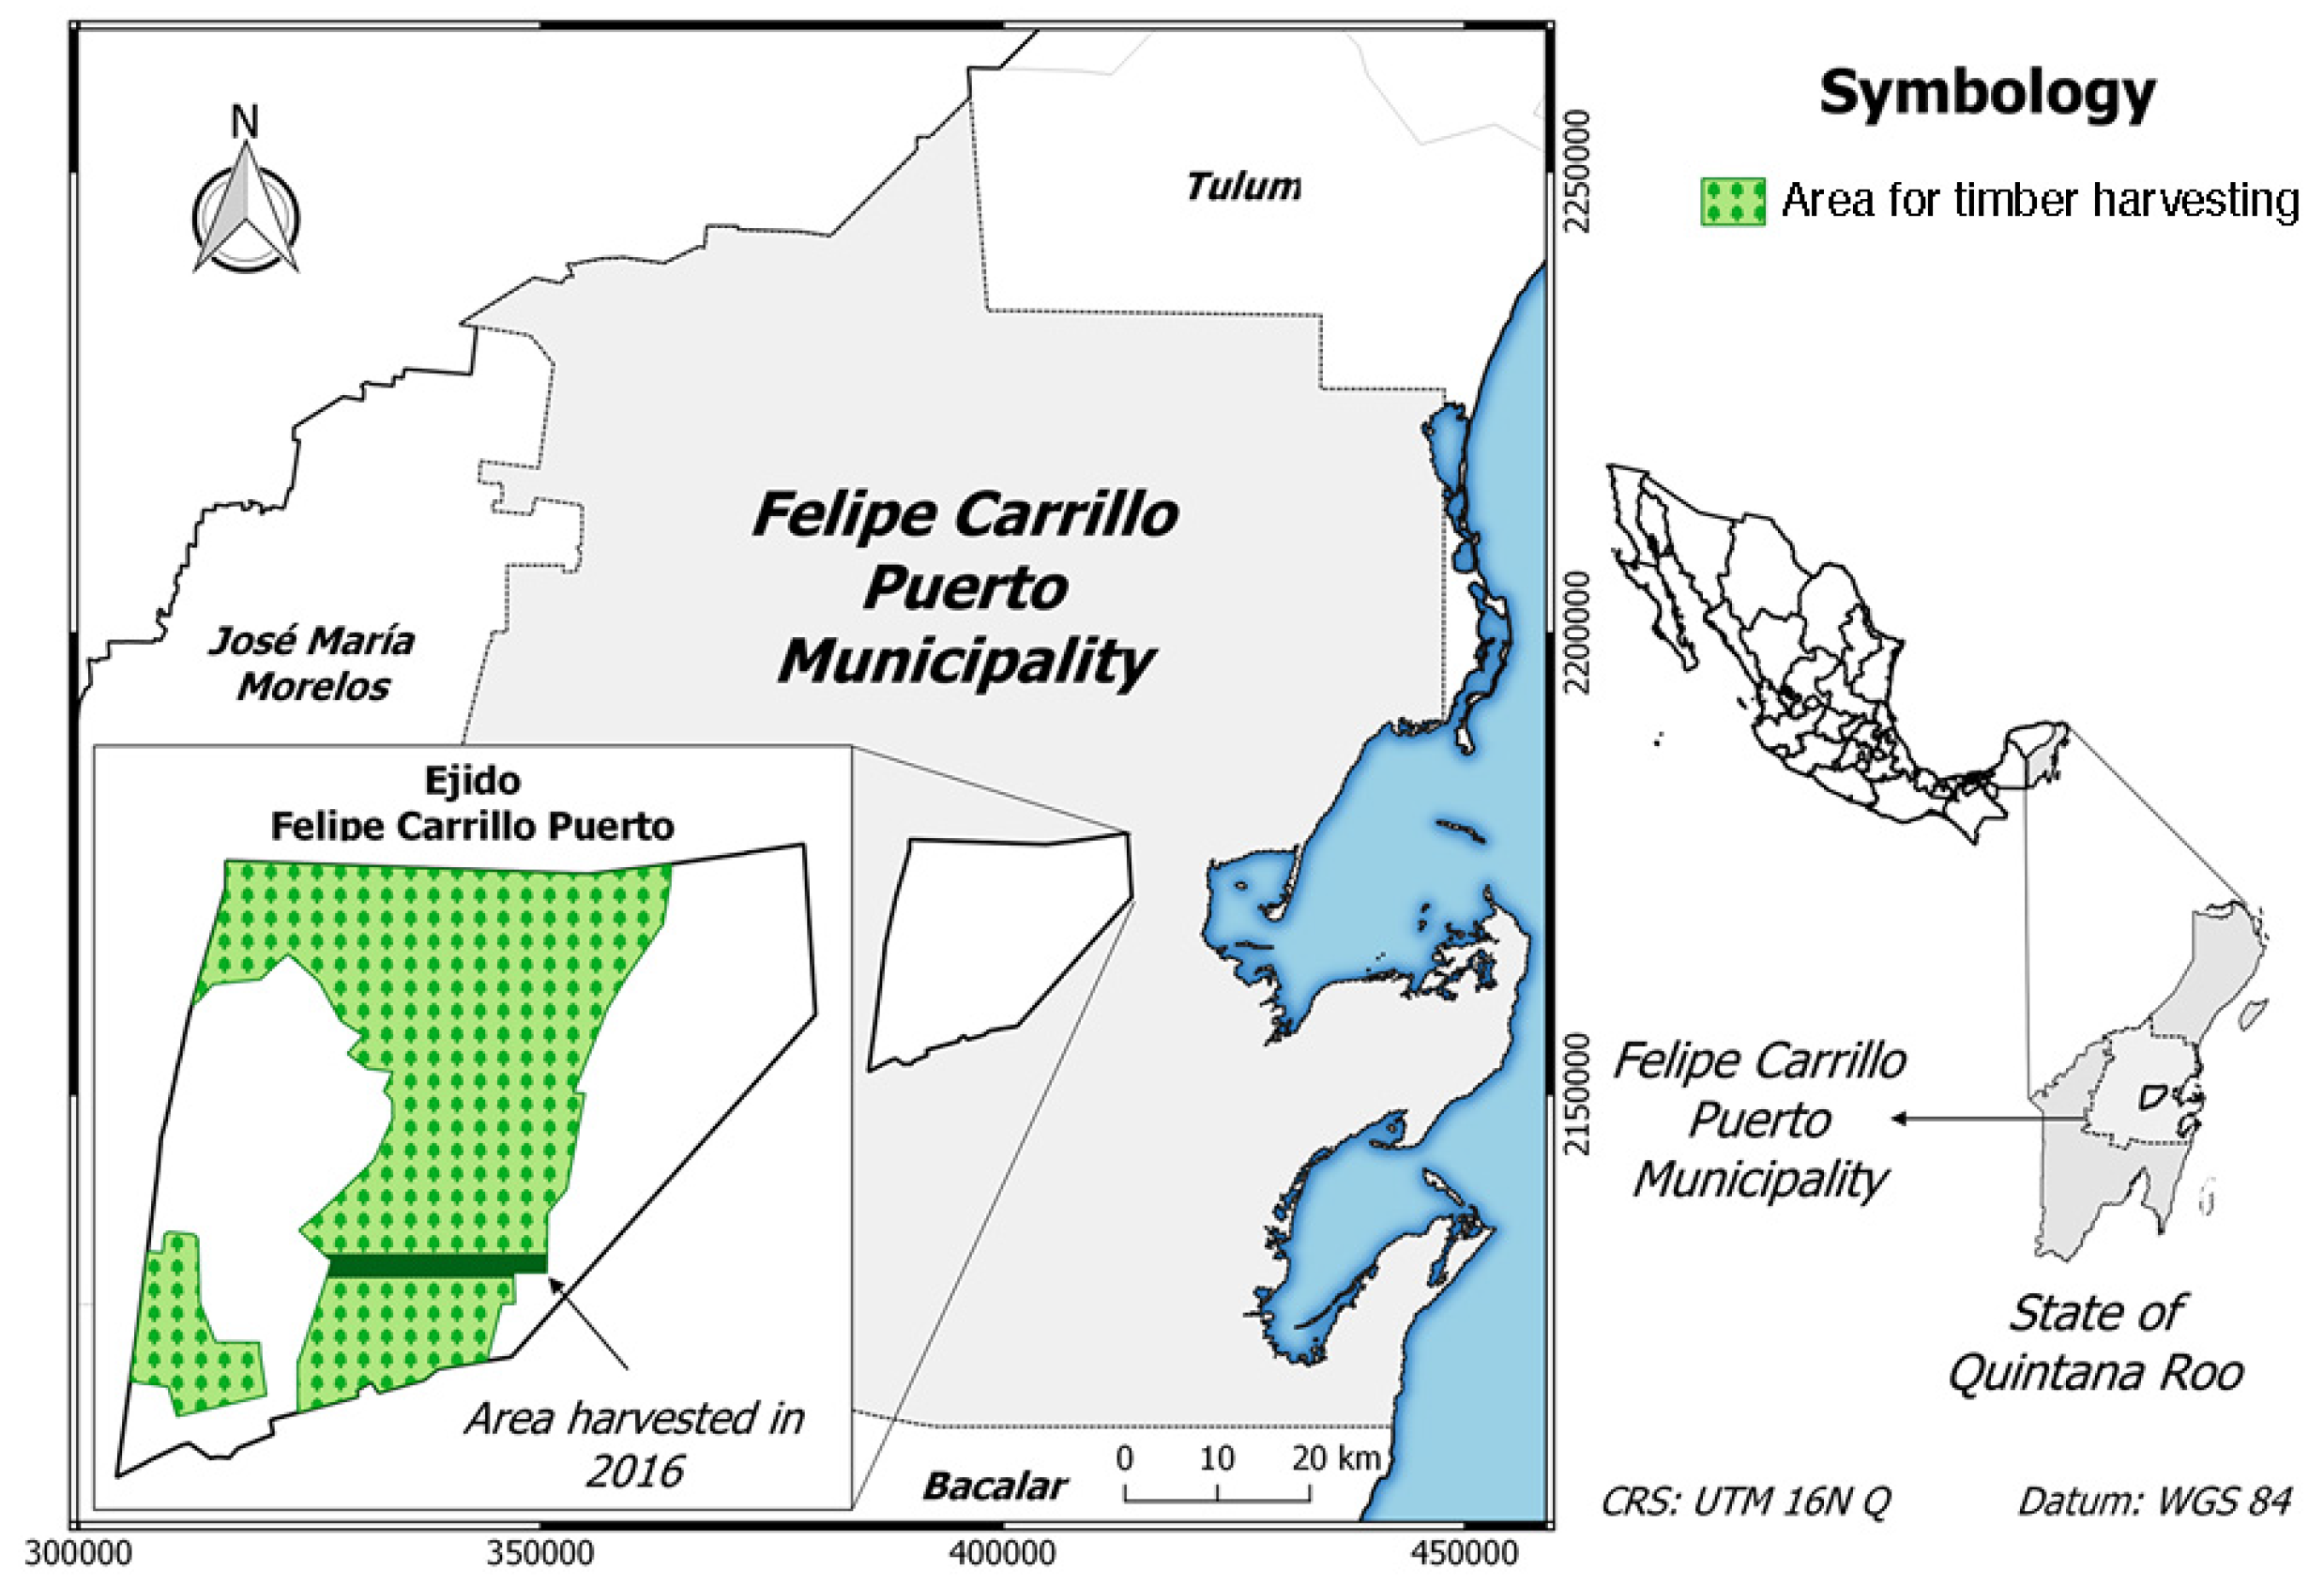
2.1. Study Area

The study site is on communal land in Felipe Carrillo Puerto in the state of Quintana Roo, Yucatan Peninsula, Mexico (Figure 1). The 24,780 ha used for harvesting in the ejido have primary and secondary semi-evergreen tropical forest. Patches within this area are logged in cycles of 25 years. The area harvested in 2016 is shown in Figure 1. With around 1500 species, semi-evergreen tropical forests in Quintana Roo are highly diverse [34]. At the site, the tree canopy reaches more than 15 meters and is dominated by Manilkara zapota, Bursera simaruba, Metopium brownei, Pseudobombax ellipticum, Lysiloma latisiliquum, Caesalpinia gaumeri, Piscidia piscipula, Swartzia cubensis, and Caesalpinia platyloba, among others [25].
The climate at the site is lowland tropical monsoonal, with an annual precipitation of 1158 mm concentrated from May to October. The dry season occurs in winter-spring, when 25–50% of the species in the forest drop their leaves [35]. Mean annual temperature is 23.7 °C, and monthly low temperature never falls below 22 °C. The soils in the area are derived from limestone and the topography is rolling with a maximum elevation of 30 m asl [25]. The forests in FCP, and in Quintana Roo in general, have been historically disturbed by hurricanes and fire [36,37] and also by humans, which have inhabited the area since well before the onset of the Mayan civilization that transformed the peninsula into a network of urban, agricultural, and forest areas starting about 3000 years ago [38,39].

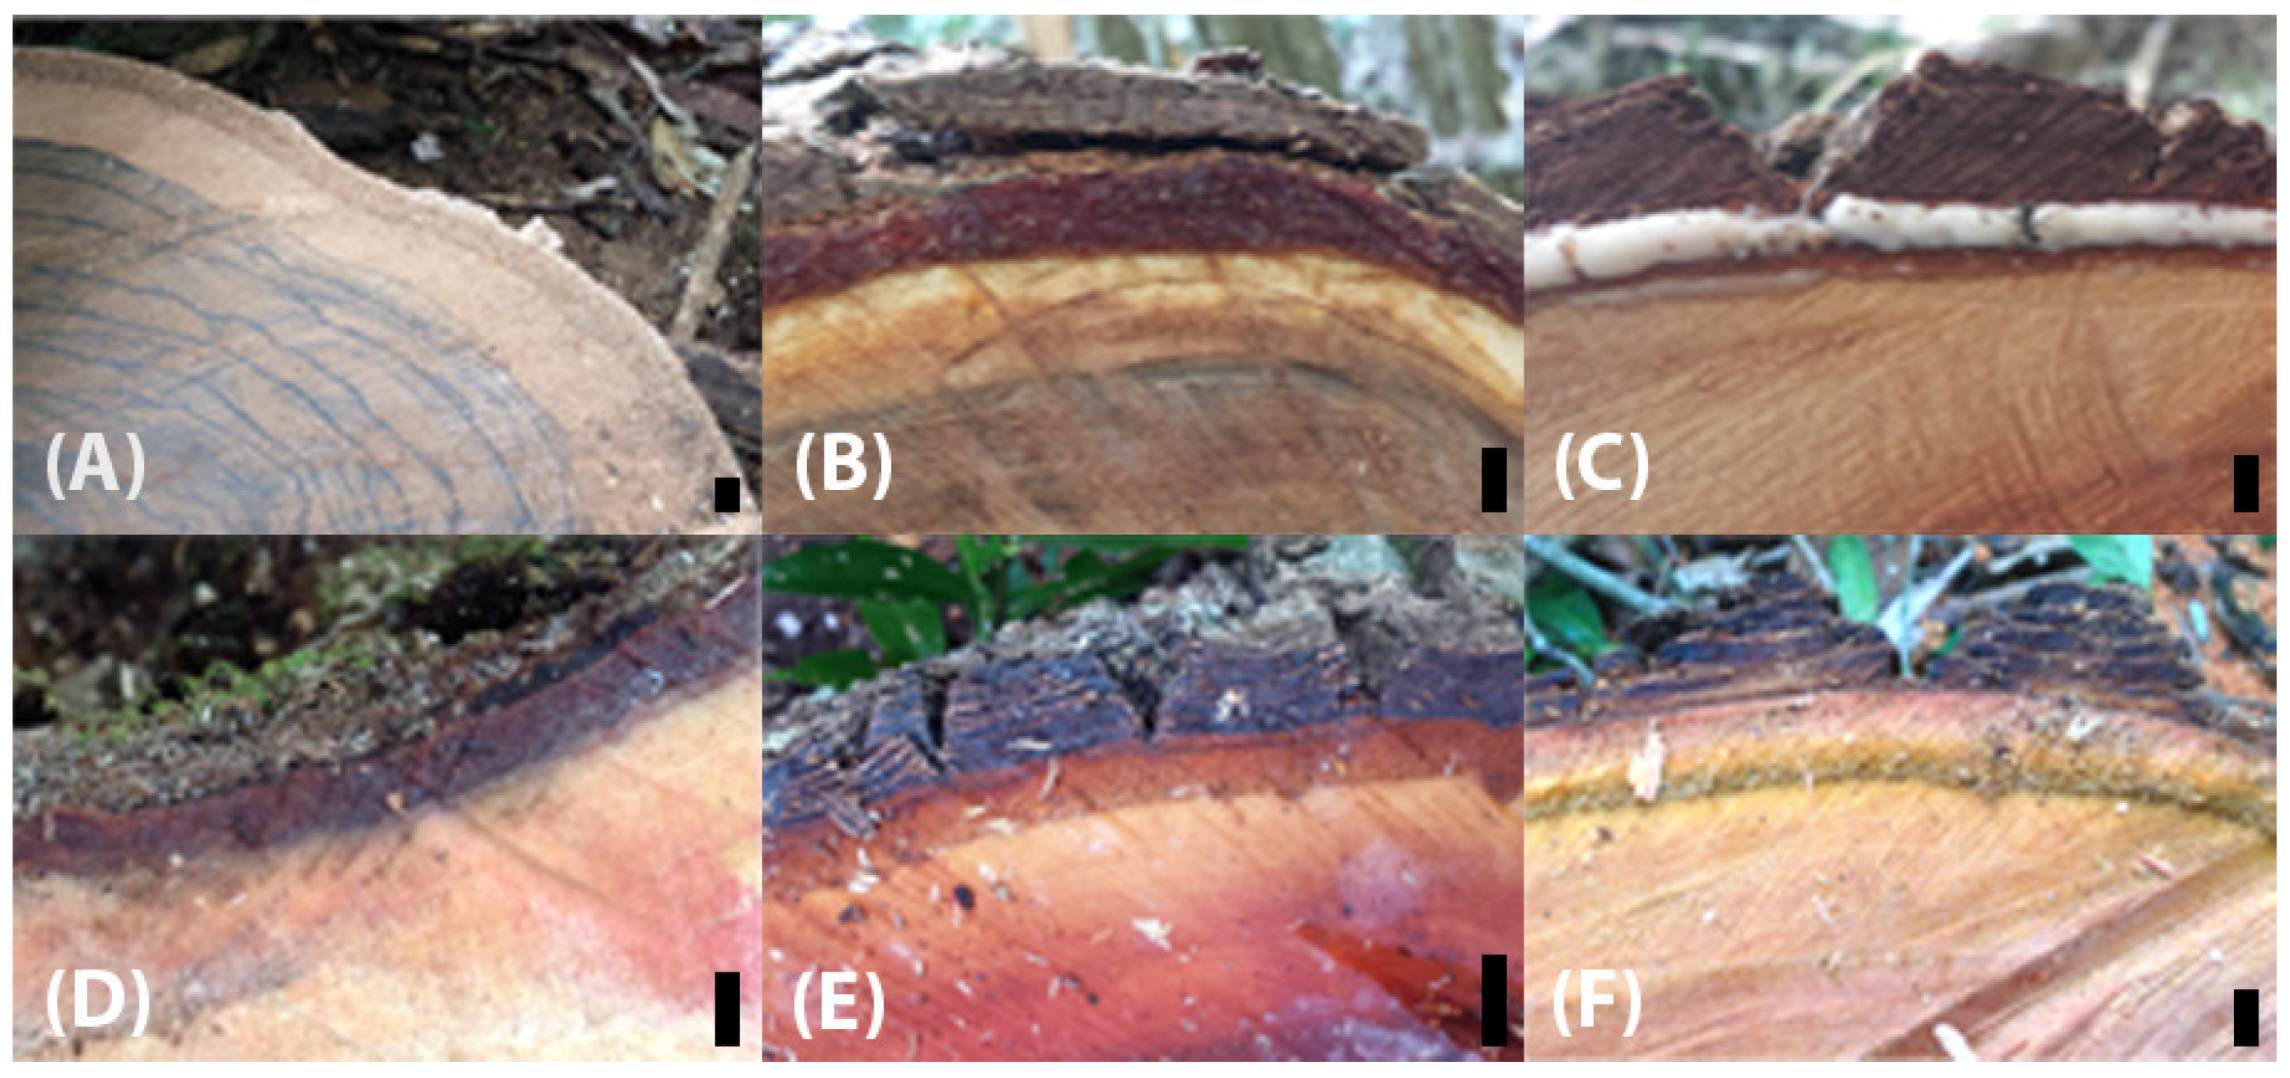
2.2. Measurements and Calculations

The six species in this analysis include the most commercially important species in the ejido forest enterprise (Table 1). Measurements were taken from 20 harvested individuals per species that had been cut for timber sale in February 2016 by the ejido. Only 16 individuals were available for measurement for C. dodecandra. Although this species is uncommon in the forest, it is highly valuable to the local enterprise given its very high current timber price, motivating its inclusion in our study. The rainforest management program specifies a minimum size of 55 cm of diameter at breast height (DBH) for big-leaf mahogany, and 35 cm for the other studied species. As a result, felled trees had a relatively narrow range in diameter (Table 2). Using a measuring tape, we made marks at 0.3 m, 0.6 m, 1.3 m, and each meter along the bole from the point at which the bole had been separated from the stump (distance = 0 m) to the point at which the bole had been separated from the crown. We defined points that were closer to one another near the base of the log to better capture the neiloid taper that usually occurs near the base of a bole. We used a measuring tape to measure over-bark diameter at the base (di) and at at the apex (di+l) of each frustum defined by the marks. At the same point at which over-bark diameter was measured, we collected three 10 × 3 cm bark blocks reaching to the cambium. We measured bark thickness using a digital caliper and calculated a mean thickness value from the three samples. Then we calculated the under-bark diameter as the difference between the over-bark diameter and two times the mean bark thickness. The over-bark diameter measured at 1.3 m from the base of the log (hereafter Db) was only slightly smaller than the DBH of the studied trees and was used as a variable to reflect log size.
We used over- and under-bark diameters to calculate over-bark and under-bark volume (V) of each frustum using Equation (2), where l is the length of the frustum, i.e., the distance between di and di+l.
V = l π 3 ( ( d i 2 ) 2 + ( d i d i + l 4 ) +   ( d i + l 2 ) 2 )
We summed the over-bark volume of all frustums to calculate the total over-bark volume of the whole bole (total volume, TV). Likewise, we summed the under-bark volume of all frustums to calculate the total under-bark volume of the whole bole (wood volume, WV). The difference between TV and WV was the bark volume (BV). Finally, we calculated the proportion of total volume occupied by bark (PBV) in each bole as the ratio (1WV)/TV.

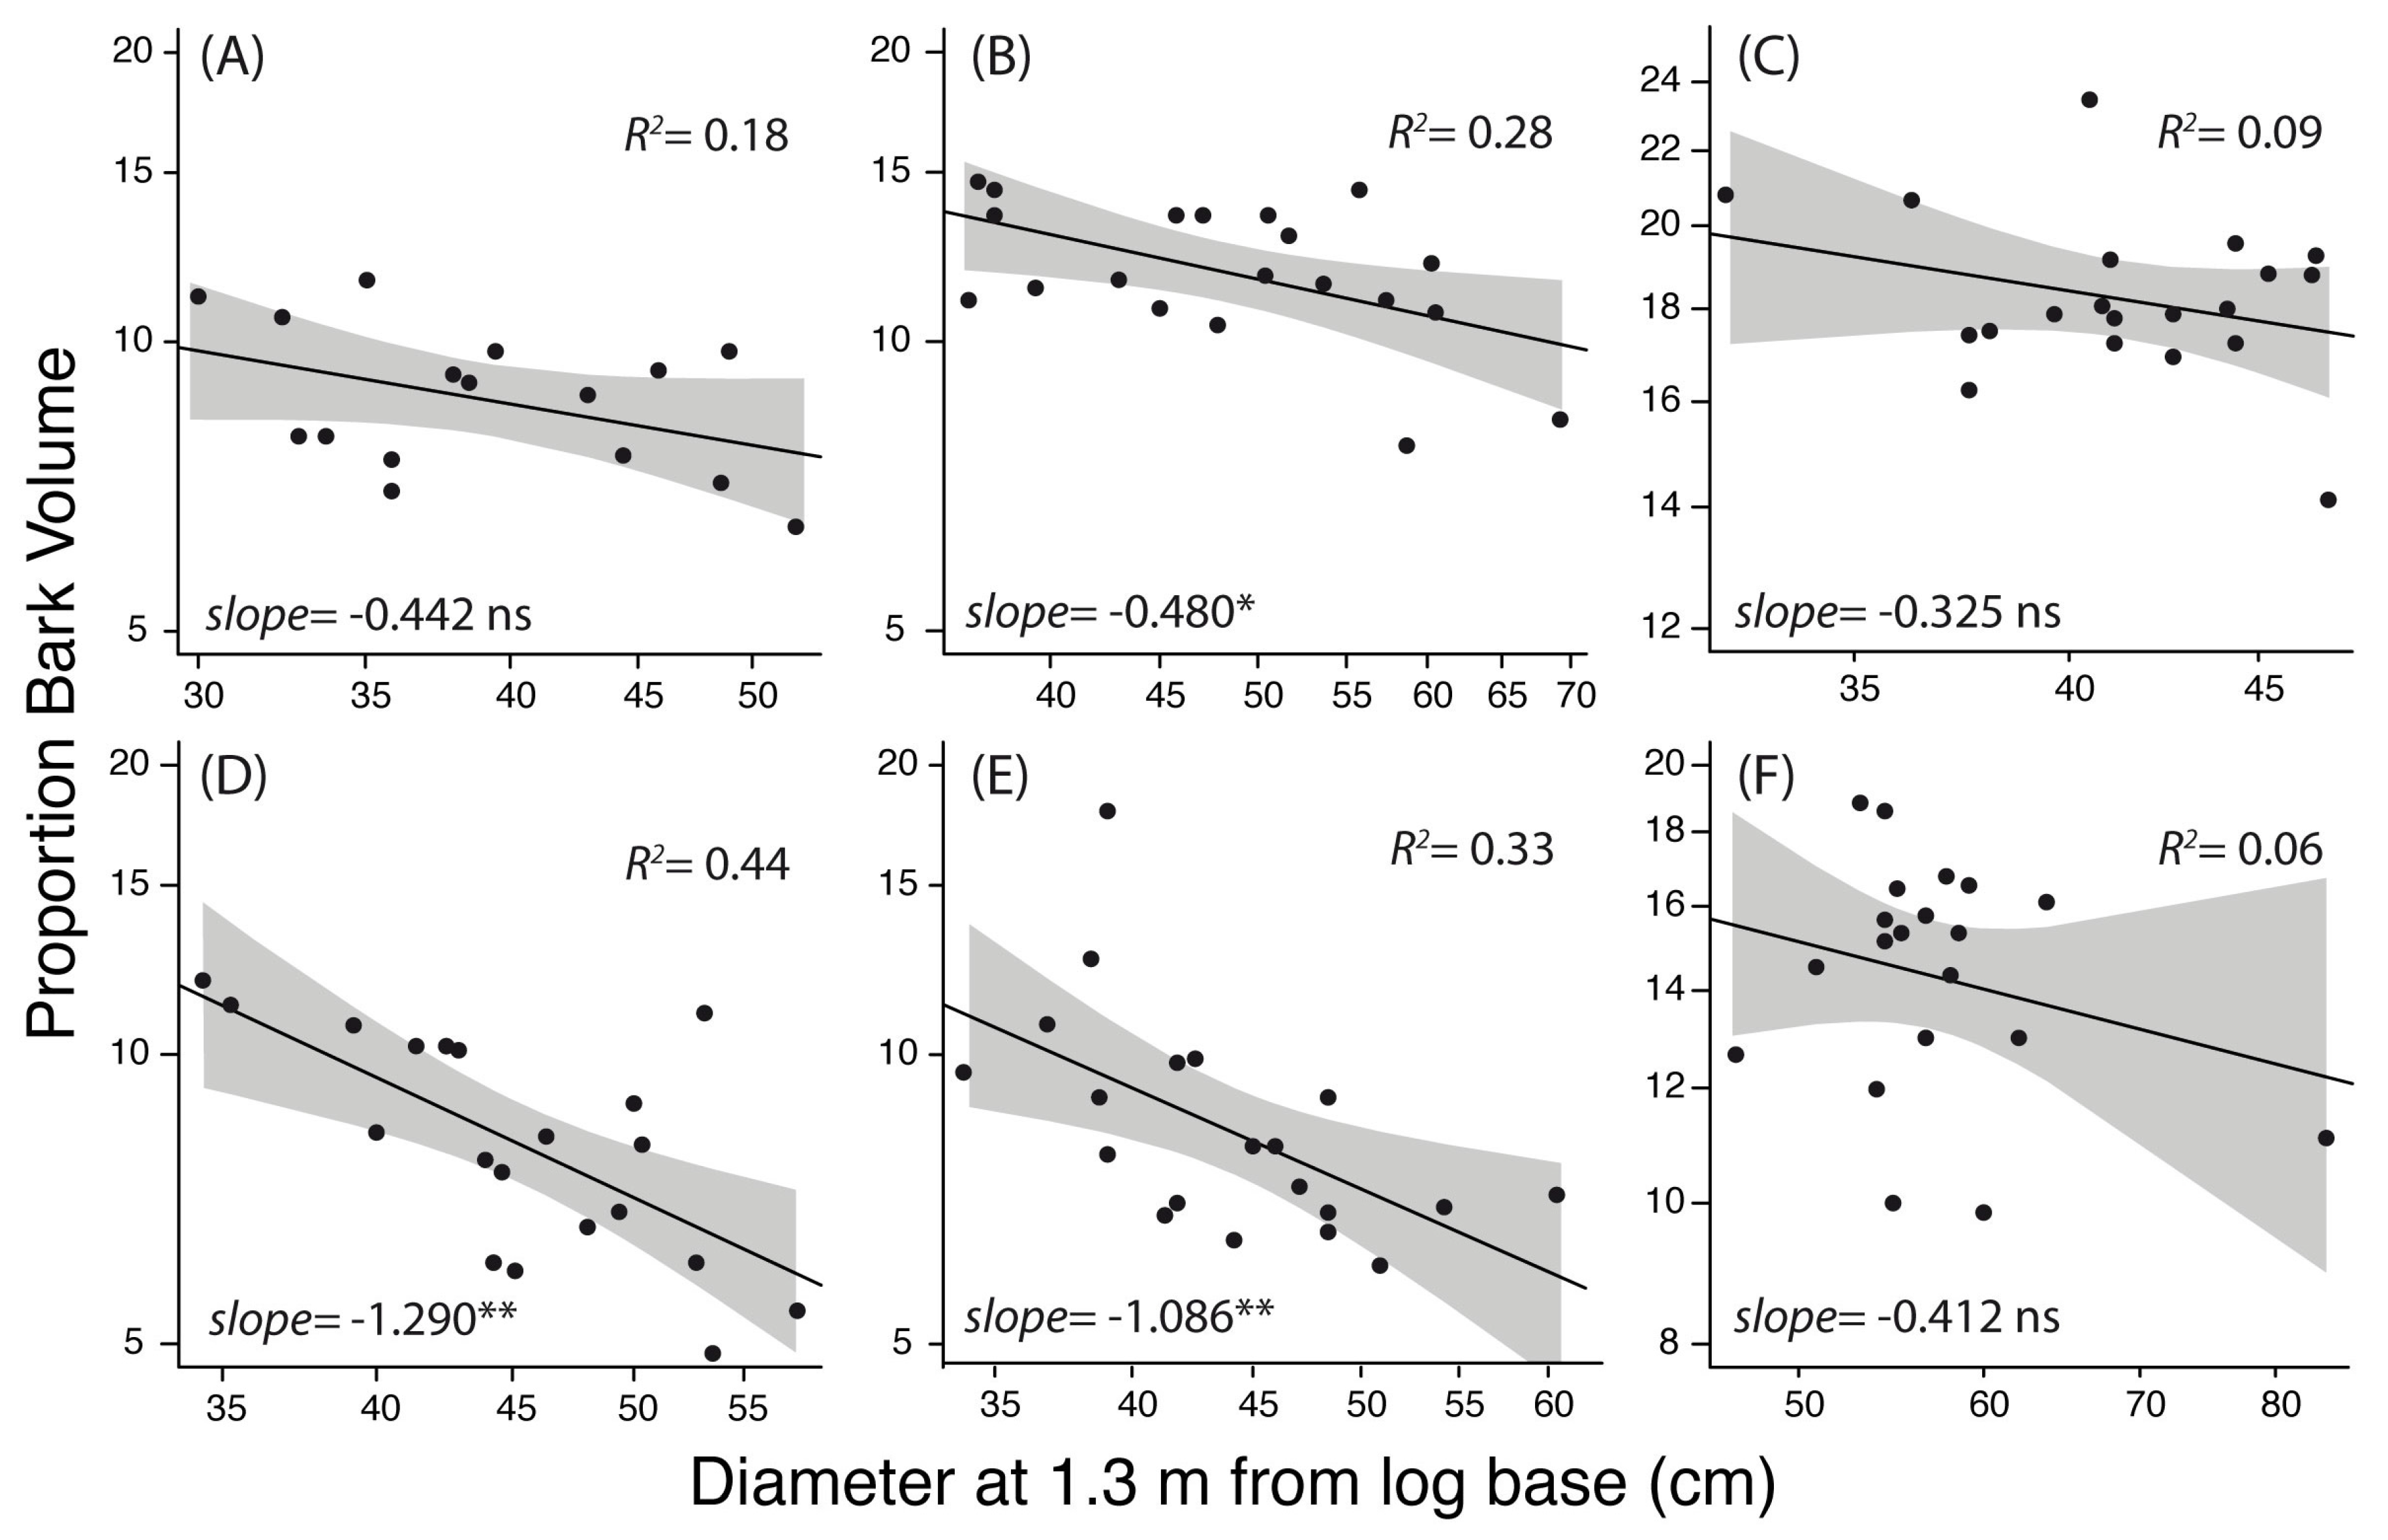
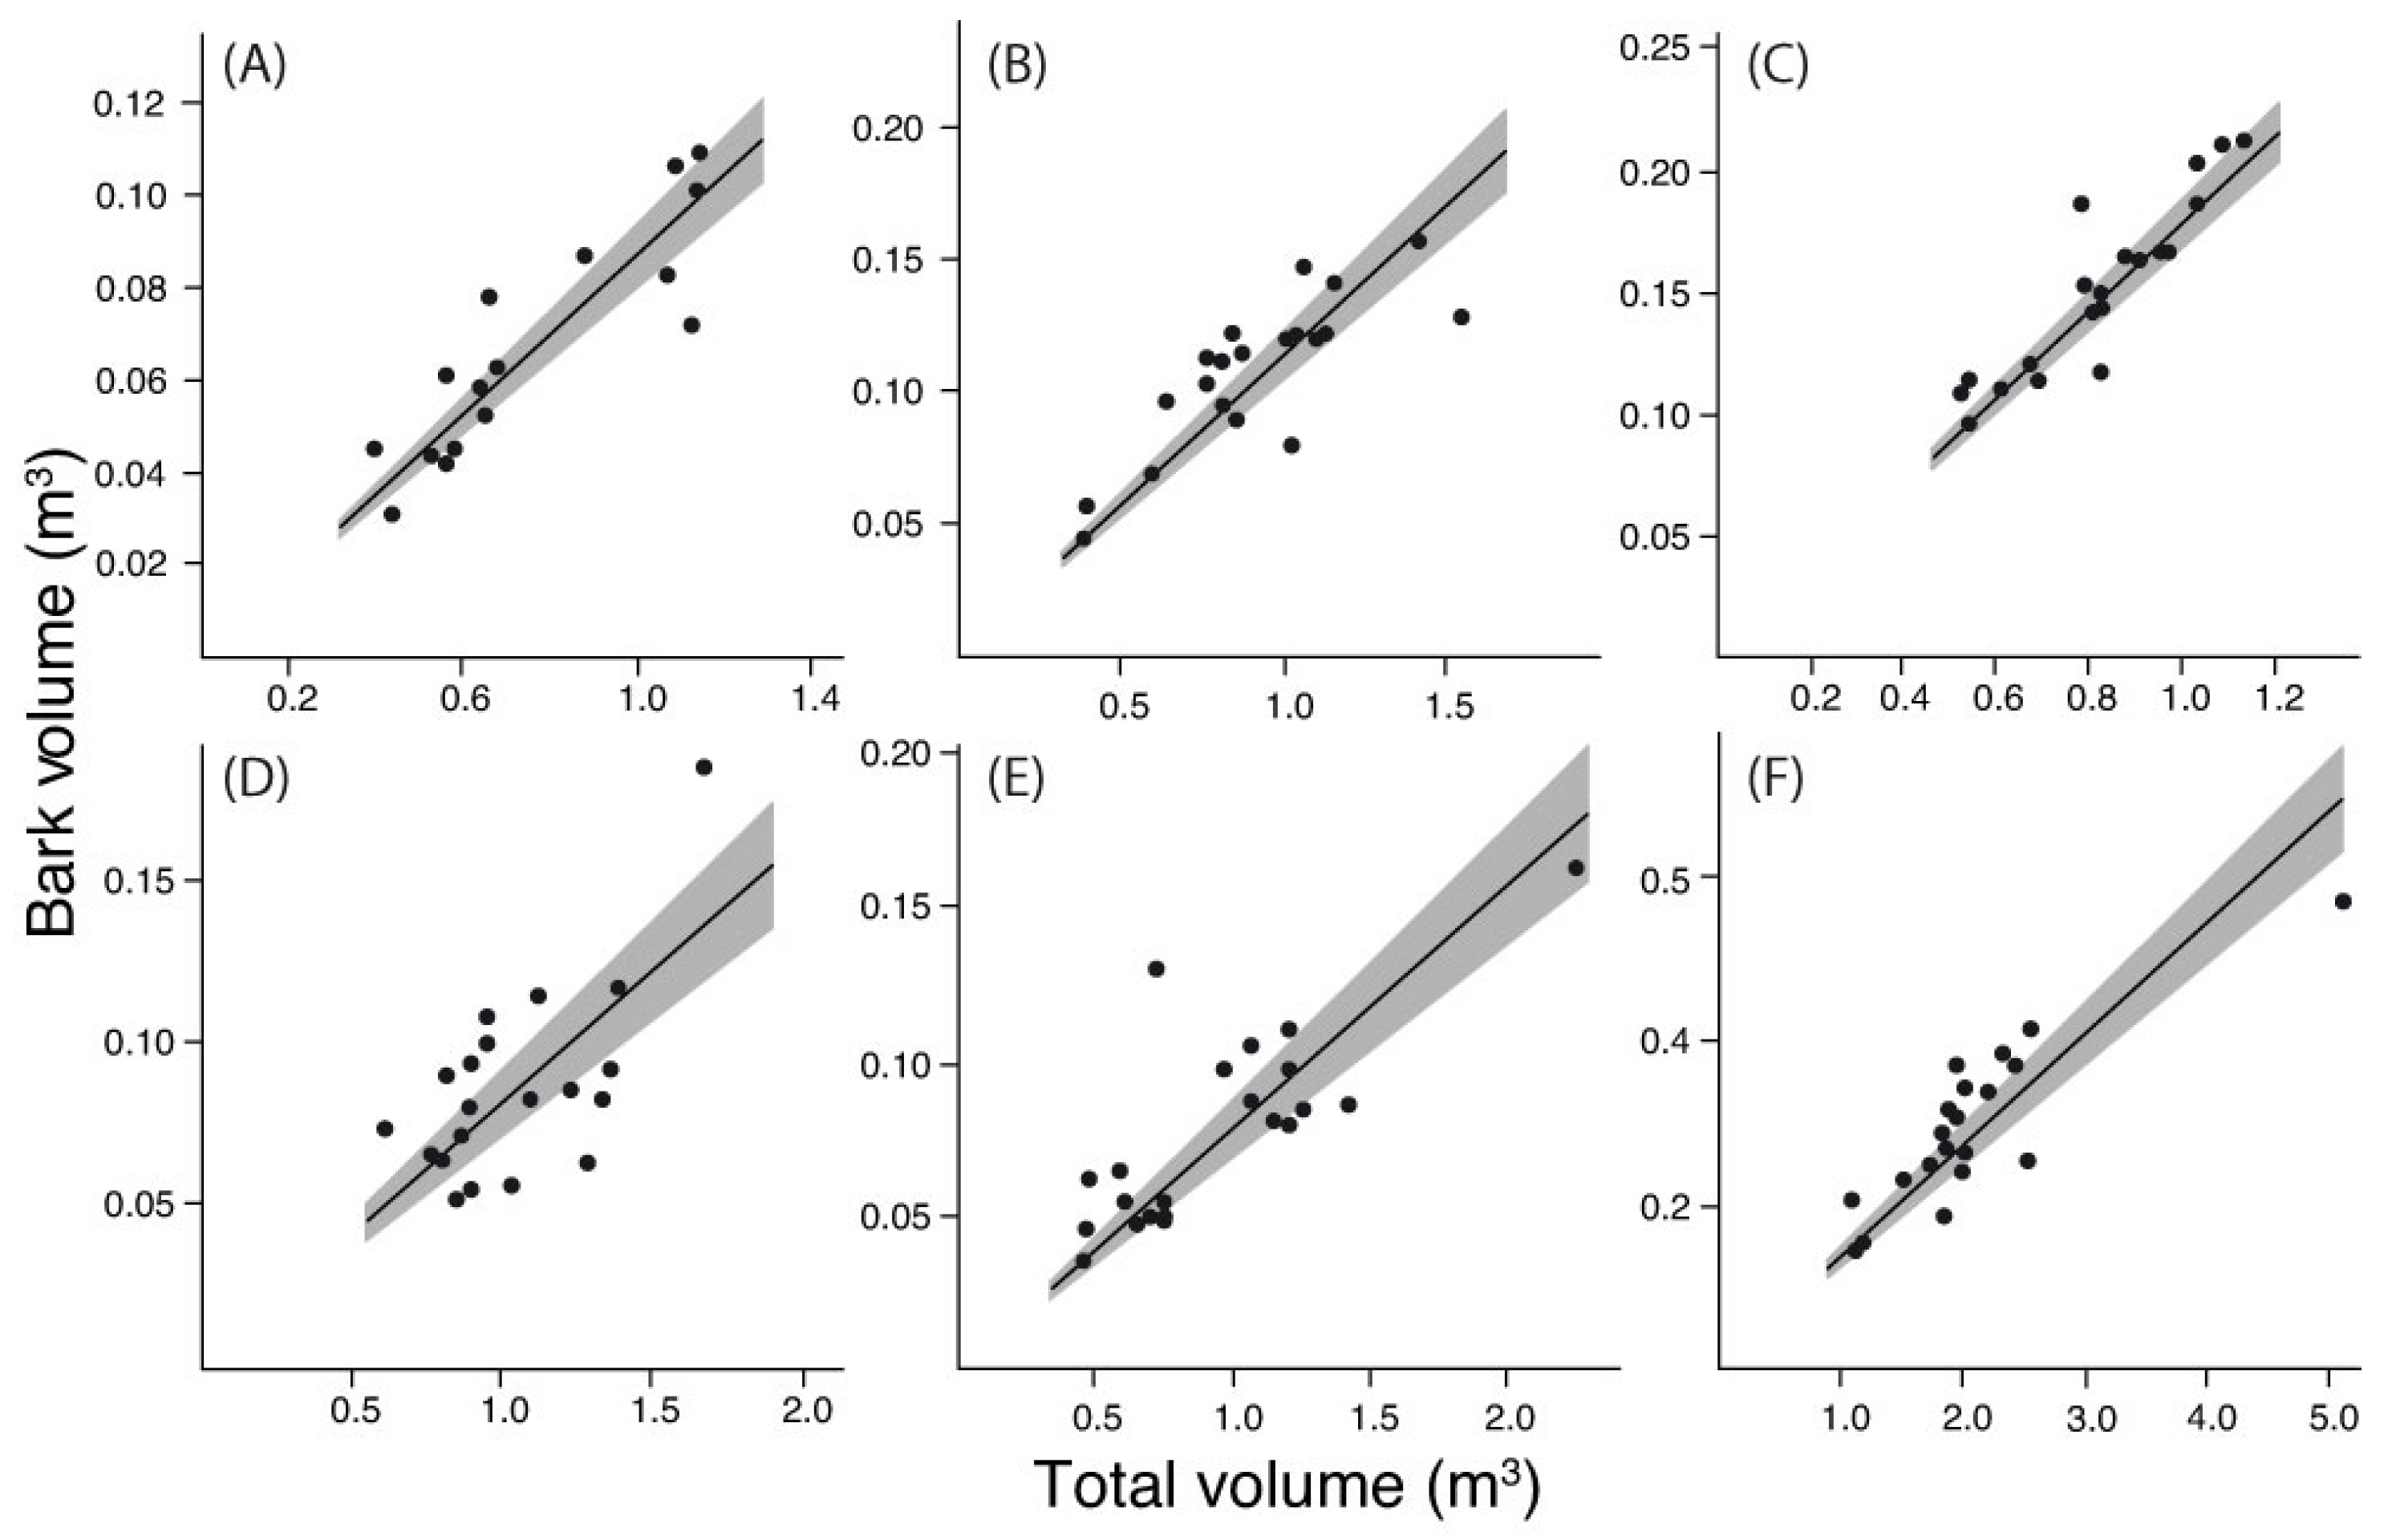
2.3. Statistical Analyses

We used the data for Db, TV, WV, BV, and PBV per bole to fit various models following Wehenkel et al. [30]. First, we examined variations in PBV with log size as reflected by Db using the allometric Equation (3), where β1 is the allometric coefficient and β2 is the allometric exponent between PBV and Db. We fit a simple linear regression per species log10 transforming data and checking normality and homoscedasticity assumptions [30]. Goodness of fit was assessed using the coefficient of determination (R2) and the root mean square error (RMSE).
P B V = β 1 · D b β 2
We examined the relationship between WV and TV by fitting a nonlinear regression per species based on Equation (4), where β3 is the model coefficient estimated by the fitting process. We also used nonlinear regression to examine the relationship between BV and TV based on Equation (5), and to estimate F, the so-called bark factor [43]. The bark factor is assumed to be constant along the bole and can be interpreted as the ratio of under-bark diameter to over-bark diameter [44]. More importantly, F is the basis for the calculation of the species PBV. We checked assumptions of nonlinear models and assessed their goodness of fit through the correlation of the observed and predicted values (Rpred-obs) and the RMSE.
W V = T V · β 3 2
B V = T V · ( 1 F 2 )
In addition to the PBV values calculated per bole, we estimated a PBV per species based on all individuals measured. This PBV value describes what proportion of a bole is represented by bark in a species and is the updated value to be used in Equation (1). To calculate the species PBV, we used F and the lower and upper bounds of its 95% confidence interval. We used these values and Equation (6) to calculate mean, upper, and lower bounds for the PBV of each species. All analyses were performed in R v.3.2.1 [45] using the R packages nlstools [46] and investr [47].
P B V = 1 F 2
To estimate the potential effect of the updated PBVs on the management of the local forest, we calculated the number of trees needed to fulfill the timber demand of the ejido enterprise from 2010 to 2016 (excluding 2011, when no wood was sold) using the current PBV values from the Pilot Forest Plan and the PBV values that we generated here. To this end, we calculated the mean total volume per log for each species using the individuals measured here. We then computed the wood volume per log based on the current PBV and the new PBV values. Subsequently, we divided the volumes sold by the mean wood volume per log calculated with both the current and new PBV values. Finally, we compared the number of trees that would have been felled using the current and new PBV values.

3. Results

Species varied in the sizes of logged individuals, as reflected by Db. However, the minimum Db values per species were similar, reflecting the minimum DBH of 35 cm harvesting requirement for most species (Table 2). Bole length also varied widely within species, reflecting that crowns started at different levels of the bole or that logs had defects and, in some cases, rotten inner wood that caused the final log to be shortened. Bark thickness varied widely across species as well, ranging from a mean of 8.0 mm in Cordia dodecandra to 18.7 mm in Manilkara zapota and 19.0 mm in Swietenia macrophylla, both species characterized by very thick outer bark (Table 2). This variation in bark thickness resulted in large differences in the proportion of bark volume per bole.
The proportion of bark volume per bole significantly varied with log size (Db) only in Lysiloma latisiliquum, Metopium brownei, and Swartzia cubensis (Equation (3)). In the case of M. brownei, Db explained 44% of the variation in PBV, whereas for the other two species, these percentages were between 28% and 33% (Figure 3). PBV tended to decrease with increasing Db in all cases.
The models predicting wood volume (WV) based on total volume (TV, Equation (4)) fit the data very well. In addition to very low RMSE values, the R2 between observed and predicted values was above 0.99 in all cases (Table 3). Additionally, the models predicting bark volume (BV) based on TV (Equation (5)) fit very well. These models had very small RMSE values as in the models for WV, and the R2 ranged from 0.64 to 0.91 (Table 4). Very good fits were observed in C. dodecandra, L. latisiliquum, M. zapota, and S. macrophylla (Figure 4), less so in M. brownei (Figure 4D). These fits were the basis for the estimation of F and PBV (Equation (6)). PBV estimates per species are shown in Table 4, along with their 95% confidence intervals. These estimates ranged from 0.0786 in S. cubensis to 0.1826 in M. zapota, differing conspicuously from the estimated PBV currently used in the community enterprise.
Estimated PBV values differed from the current values for most species. In four of the six species, estimated PBV values were smaller, although they were larger in L. latisiliquum and considerably larger in M. zapota, a species with very thick bark (Table 2 and Table 5). These differences in PBV using the updated PBV calculated here translated into a change in the number of individuals that could have been left standing or that would have been cut to fulfill the 2010–2016 timber sales (Table 5).

4. Discussion

The models used to estimate PBV values fit the data well and were based on a range of tree sizes covering the DBH of projected harvest sizes. Although increasing sample size would likely produce an even better fit, we were able to generate good models for the calculation of PBV measuring 20 individuals per species. Only in the case of M. brownei was the correlation between the predicted and observed values <0.80 (R = 0.638). Measuring additional individuals for this species would be desirable to strengthen the estimation of its PBV. In addition to fitting the data well, models were based on trees that will overlap in DBHs with those of future harvests. The forest stands of the ejido are cut in 25-year cycles. The area cut in 2016 is on its second cutting cycle since the establishment of the Pilot Forestry Plan [25]. This means that the areas to harvest in the following years will be in their second cutting cycle as well and will include trees overlapping in size with the individuals measured here. As a result, our updated PBVs will apply to the estimations of wood volumes for harvest seasons well into the future.
Updated PBVs varied considerably across the studied species, but were within the range of other temperate and tropical species. Bark proportions varied from 0.0786 in S. cubensis to 0.1826 in M. zapota. These values are similar to PBVs of other tropical species, such as Bombacaceae (0.094–0.23) [48], Fabaceae (0.038–0.161) [49], and Magnoliaceae (0.162) [50]. Additionally, diverse temperate angiosperm species have similar values, such as representatives of Aceraceae (0.131) [51], Betulaceae (0.124) [52], and Salicaceae (0.161) [52]. Although rainforest species tend to have relatively thin bark for their stem size [53,54], M. zapota and S. macrophylla had thick bark that represented 14–18% of the bole volume. Although within the range reported for other tree species, updated PBVs showed significant differences with the values currently used by the ejido enterprise.
As predicted, updated PBV values for species with dense woods differed from the flat 0.10 used. Updated PBVs were smaller than 0.10 in S. cubensis (0.0786), M. brownei (0.0815), and C. dodecandra (0.0870). The updated PBV of S. macrophylla (0.1370) was also slightly below the current value of 0.14. A more dramatic change was expected for mahogany, given that sizes of individuals have been significantly reduced over time [26], and larger PBVs would be expected for logs derived from smaller individuals [30]. However, the calculated PBV was very close to the value that has been used for more than 30 years. In contrast, the remaining two species had higher PBVs than the value currently used (0.10). In one of these species, L. latisiliquum, the value was slightly larger (0.1134), but in the case of M. zapota, the difference was very large (0.1826). This considerable difference is explained by the very thick bark of this species relative to the diameter of its trunk [55] (Figure 2). Using the updated PBVs could affect the economy of the local enterprise and the management of the ejido forest land.
In species in which the updated PBV is lower than the current one, the wood volume calculated per log will increase, and, as a result, in future harvest seasons, fewer individuals will need to be felled. For example, if updated values had been used, one less individual of C. dodecandra (1.5% less), two fewer of S. cubensis (2.3%) and 31 fewer of M. brownei (2.0%) would have been cut in the entire 2010–2016 harvest period (Table 5) to meet volume targets. Felling fewer individuals would have a positive effect on the maintenance of populations in all cases, but would be particularly important for C. dodecandra. This species has been judged as vulnerable because of its low frequency in the forest and poor past management [29,56]. At the same time, timber from this species is one of the most valuable in the forest [55], with a price per cubic meter six times that of mahogany (pers. obs.). In addition to its ecological rarity, C. dodecandra grows at slow rates (0.08 cm/year) [55]. This situation also applies to S. cubensis, a species that is more common than C. dodecandra [57], but also has a slow growth rate (0.09–0.19 cm/year) [55,58]. This finding is important because precise calculation of wood volume in species with high commercial importance, but low population numbers or slow growth rates, is crucial to improve their management [56].
Two species had higher updated vs. current PBVs, including the species with the highest wood volume sales in recent years. In the case of L. latisiliquum, the updated PBV was slightly higher than the one currently used (0.1134 vs. 0.1000). This is a seemingly small difference that, nevertheless, would have translated into the need to cut 16 additional individuals (1.5% more) if the updated PBVs had been used to meet the wood volume target of the last six years (2010–2016). These numbers were higher still in the case of M. zapota, for which 216 more individuals would have been needed (10.1%, Table 5). Fortunately, despite this large number of additional trees that would have been felled using the updated PBVs, this species is dominant in the ejido forest and still abundant [57]. It is important to note that even with these adjusted numbers for the most heavily harvested species, the volumes logged by the local enterprise are still below the volumes authorized in the management plan [25]. The same is true for L. latisiliquum, which is also the species with the fastest growth rate in the group (0.46 cm/year) [55]. Thus, our data exemplify the way that precise PBV equations can inform improved forest management.
The size of the individual and the degree of bark damage are factors that need to be considered for the implementation of updated PBVs. For L. latisiliquum, M. brownei, and S. cubensis, we observed a decrease in PBV with increasing log size (Db) (Figure 3), i.e., larger logs had a lower proportion of bark. As was suggested by Wehenkel et al. [30] in a similar situation, when calculating the wood volume in these species, we would recommend setting the lower bound of the 95% confidence interval of the PBV for the largest individuals, the mean PBV for medium-sized individuals, and the upper bound for the smallest trees (Table 4). Another recommendation is to examine the degree of bark damage at the point on the log at which diameter is measured when calculating wood volume. During the dragging of logs to the landing, logs tend to lose significant portions of bark. Given that we derived PBVs measuring logs with intact bark, applying these values to logs with significantly abraded bark or no bark would result in an underestimation of wood volume. A possibility in these cases would be to use the bark factor (F) to calculate the over-bark diameter, given that F is the ratio of the diameters under and over bark and is assumed to be constant [44]. These recommendations will allow more precise estimation of timber volume.
Estimating timber volume by the local forestry enterprise could be carried out through more complex estimations than the ones currently used (Equation (1)). Although estimations could be made through tables, these tables are not yet available for these commercial species. Moreover, the use of more complex methods would need to be discussed with the ejido and the forestry advisor, given that their use would imply further training. By the same token, PBVs could be calculated through other methods [59,60]. However, it has been shown that the non-destructive Meyer method used here is as effective as more complicated and destructive approaches [59,61]. The updated PBV values promise higher precision without significant changes to the way that wood volumes are currently calculated by ejido members.
Although based on forests in the ejido FCP, the PBVs presented here could be used by other forest enterprises in the area. The species commercialized by FCP are usually the same species harvested in other enterprises in central Quintana Roo [28,55], a state with more than 500,000 ha of managed forests [62] and including the most commonly-commercialized species in Mexican tropical forests [33]. Examining the applicability of equations across sites would be ideal, because, although the vegetation is similar in composition and structure to that in FCP [63,64], differences in soil fertility could affect the maximum tree height [65] and, thus, PBVs. Likewise, the method implemented here could be used to calculate PBVs of the 25 species listed by the ejido with potential for sawn lumber [25]. It could also be implemented in other tropical areas where wood volume calculation is carried out based on bark proportions.

5. Conclusions

Community-based forest management in Quintana Roo has shown that conserving biodiversity while generating economic benefits for forest owners is achievable [12,20]. Current national and international conservation initiatives aimed at fostering sustainable use of local forests (e.g., for climate change mitigation) build on the experience of community-based management [18,66,67]. However, even when communities are committed to responsible management of their resources, as is the case of FCP [68,69], the sustainable use of their forests can be hindered by a shortage of tools for a proper management, as was shown here with the lack of precise proportions of bark volume for the species commercialized by the ejido. Several other gaps jeopardize the successful management of rainforests in Central Quintana Roo, including the limited information on growth rates of the main timber species [58]. Filling these gaps with close collaboration between scientists and the traditional owners and managers of these forests will underpin the on-going efforts of these communities to preserve and utilize the forest resources long into the future.

Acknowledgments

This project was supported by the Consejo Nacional de Ciencia y Tecnología (#237061), the UNAM-DGAPA-PAPIIT program (#IA201415), and a Young Scientist Award from the MAB-UNESCO program. We would like to thank the members and authorities of Ejido Felipe Carrillo Puerto, especially Elías Be Cituk, Julián Koyoc, and Milton Montalvo, for granting access to their forest, for kind help with field work and data sharing, as well as Mark Olson, Gonzalo Sánchez, Vanessa Maldonado, David López, and Matiss Castorena for kind assistance with field work and helpful discussions. We thank Craig Wayson, two anonymous reviewers, and the editor for helpful suggestions. This study benefitted from access to data from the Mexican Network of Intensive Carbon Monitoring Sites (Red MEX-SMIC).

Author Contributions

J.A.R., C.W., J.A.A.P. and M.O. conceived and designed the study; J.A.R., A.P.-M. and S.P.G.J. collected the data; J.A.R., C.W., A.P.-M., and S.P.G.-J. analyzed the data; and J.A.R., C.W., and M.O. wrote the paper.

Conflicts of Interest

The authors declare no conflict of interest. The founding sponsors had no role in the design of the study; in the collection, analyses, or interpretation of data; in the writing of the manuscript, and in the decision to publish the results.

References

  1. Nasi, R.; Wunder, S.; Campos, A.J.J. Forest Ecosystem Services: Can They Pay Our Way out of Deforestation? Forestry Roundtable; CIFOR: UNFFⅡ, San José, Costa Rica, 2002. [Google Scholar]
  2. Mukul, S.A.; Sohel, M.S.I.; Herbohn, J.; Inostroza, L.; König, H. Integrating ecosystem services supply potential from future land-use scenarios in protected area management: A Bangladesh case study. Ecosyst. Serv. 2017, 26, 355–364. [Google Scholar] [CrossRef]
  3. Ellis, E.A.; Porter-Bolland, L. Is community-based forest management more effective than protected areas?: A comparison of land use/land cover change in two neighboring study areas of the Central Yucatan Peninsula, Mexico. For. Ecol. Manag. 2008, 256, 1971–1983. [Google Scholar] [CrossRef]
  4. Burivalova, Z.; Şekercioğlu, Ç.H.; Koh, L.P. Thresholds of logging intensity to maintain tropical forest biodiversity. Curr. Biol. 2014, 24, 1893–1898. [Google Scholar] [CrossRef] [PubMed]
  5. Bonan, G.B. Forests and Climate Change: Forcings, Feedbacks, and the Climate Benefits of Forests. Science 2008, 320, 1444–1449. [Google Scholar] [CrossRef] [PubMed]
  6. Houghton, R.A.; Byers, B.; Nassikas, A.A. A role for tropical forests in stabilizing atmospheric CO2. Nat. Clim. Chang. 2015, 5, 1022–1023. [Google Scholar] [CrossRef]
  7. Chazdon, R.L.; Broadbent, E.N.; Rozendaal, D.M.A.; Bongers, F.; Zambrano, A.M.A.; Aide, T.M.; Balvanera, P.; Becknell, J.M.; Boukili, V.; Brancalion, P.H.S.; et al. Carbon sequestration potential of second-growth forest regeneration in the Latin American tropics. Sci. Adv. 2016, 2, e1501639. [Google Scholar] [CrossRef] [PubMed]
  8. Vira, B.; Agarwal, B.; Jamnadass, R.H.; Kleinschmit, D.; McMullin, S.; Mansourian, S.; Neufeldt, H.; Parrotta, J.A.; Sunderland, T.C.H.; Wildburger, C. Forests, trees and landscapes for food security and nutrition. In Forests and Food: Addressing Hunger and Nutrition Across Sustainable Landscapes; Open Book Publishers: Cambridge, UK, 2015. [Google Scholar]
  9. Palacio-Prieto, J.L.; Bocco, G.; Velázquez, A.; François, J.; Takaki, F.; Victoria, A.; Luna, L.; Gómez, G.; García, J.L.; Palma, M.; et al. La condición actual de los recursos forestales en México: Resultados del Inventario Forestal Nacional 2000. Investig. Geogr. 2000, 43, 183–203. [Google Scholar] [CrossRef]
  10. Food and Agriculture Organization (FAO). Global Forest Resources Assessment 2015; UN Food and Agriculture Organization: Rome, Italy, 2016. [Google Scholar]
  11. Pacheco, P.; Barry, D.; Cronkleton, P.; Larson, A.M. The recognition of forest rights in Latin America: Progress and shortcomings of forest tenure reforms. Soc. Nat. Resour. 2012, 25, 556–571. [Google Scholar] [CrossRef]
  12. Bray, D.B.; Merino-Pérez, L.; Negreros-Castillo, P.; Segura-Warnholtz, G.; Torres-Rojo, J.M.; Vester, H.F. Mexico’s community-managed forests as a global model for sustainable landscapes. Conserv. Biol. 2003, 17, 672–677. [Google Scholar] [CrossRef]
  13. INEGI. Conjunto de Datos Vectoriales de la Carta de Uso del Suelo y Vegetación, Escala 1:250,000; Serie V (Continuo Nacional); Instituto Nacional de Estadística y Geografía (INEGI): Aguascalientes, México, 2011.
  14. Urquiza-Haas, T.; Dolman, P.M.; Peres, C.A. Regional scale variation in forest structure and biomass in the Yucatan Peninsula, Mexico: Effects of forest disturbance. For. Ecol. Manag. 2007, 247, 80–90. [Google Scholar] [CrossRef]
  15. Ellis, E.A.; Romero Montero, J.A.; Hernández Gómez, I.U. Deforestation Processes in the State of Quintana Roo, Mexico. Trop. Conserv. Sci. 2017, 10. [Google Scholar] [CrossRef]
  16. Ellis, E.A.; Kainer, K.A.; Sierra-Huelsz, J.A.; Negreros-Castillo, P.; Rodriguez-Ward, D.; DiGiano, M. Endurance and Adaptation of Community Forest Management in Quintana Roo, Mexico. Forests 2015, 6, 4295–4327. [Google Scholar] [CrossRef]
  17. Porter-Bolland, L.; Ellis, E.A.; Guariguata, M.R.; Ruiz-Mallén, I.; Negrete-Yankelevich, S.; Reyes-García, V. Community managed forests and forest protected areas: An assessment of their conservation effectiveness across the tropics. For. Ecol. Manag. 2012, 268, 6–17. [Google Scholar] [CrossRef]
  18. Olguín-Álvarez, M.; Wayson, C.; Fellows, M.; Birdsey, R.; Smyth, C.; Magnan, M.; Dugan, A.; Mascorro, V.; Alanis, A.; Serrano, E.; et al. Applying a systems approach to assess carbon emission reductions from climate change mitigation in Mexico’s forest sector. Environ. Res. Lett. Under review.
  19. López Pérez, L.; Keenan, R. Ecosystem Services and Community Forest Management: The Case of Quintana Roo. Master’s Thesis, Master of Forest Ecosystem Science, University of Melbourne, Melbourne, Australia, 2015. [Google Scholar]
  20. Galletti, H.A. La selva maya en Quintana Roo (1983–1996) trece años de conservación y desarrollo comunal. In La Selva Maya, Conservación y Desarrollo; Primack, R.B., Ed.; Siglo XXI Editores: Mexico City, Mexico, 1999; pp. 53–73. [Google Scholar]
  21. Kiernan, M.J.; Freese, C.H. Mexico’s Plan Piloto Forestal: The search for balance between socioeconomic and ecological sustainability. In Harvesting Wild Species: Implications for Biodiversity Conservation; Freese, C.H., Ed.; The John Hopkins University Press: Baltimore, MD, USA, 1997; pp. 93–131. [Google Scholar]
  22. Godas, M.D.; Valenzuela, E.; Cisneros, H.; de los Ángeles Mejía, J.; Terrón, I. Sustentabilidad y Ecoturismo en Tres Garantías, Quintana Roo; Universidad Nacional Autónoma de México: Ciudad de México, México, 2005; ISBN 978-9-70-321838-7. [Google Scholar]
  23. Flachsenberg, H.; Galletti, H. El manejo forestal de la selva en Quintana Roo, México. In La Selva Maya, Conservación y Desarrollo; Primack, R.B., Bray, D., Galletti, H.A., Ponciano, I., Eds.; Siglo XXI Editores: Mexico City, Mexico, 1999; pp. 74–97. [Google Scholar]
  24. Rzedowski, J. Vegetación de México; 1a Edición Digital; Comisión Nacional para el Conocimiento y Uso de la Biodiversidad: Ciudad de México, México, 2006.
  25. Arreola, J.A.; Be Cituk, E.; Argüelles, L.F.; García, Z.H.M.; García, F.; Palafox, C.; Sánchez, E.F. Plan de Manejo, Ejido Felipe Carrillo Puerto, Quintana Roo 2012–2023; Ejido Felipe Carrillo Puerto, CONAFOR-PROCYMAF-II, PNUD-COMPACT, Maya Natura Tropical AC, Tropica Rural Latinoamericana AC; U’Yo’ol Che AC: Felipe Carrillo Puerto, Quintana Roo, Mexico, 2011; p. 146.
  26. Snook, L.K.; Negreros-Castillo, P. Regenerating mahogany (Swietenia macrophylla King) on clearings in Mexico’s Maya forest: The effects of clearing method and cleaning on seedling survival and growth. For. Ecol. Manag. 2004, 189, 143–160. [Google Scholar] [CrossRef]
  27. Racelis, A.E.; Barsimantov, J.A. The management of small diameter, lesser-known hardwood species as polewood in forest communities of central Quintana Roo, Mexico. J. Sustain. For. 2008, 27, 122–144. [Google Scholar] [CrossRef]
  28. Forster, R.; Albrecht, H.; Belisle, M.; Caballero, A.; Galletti, H.; Lacayo, O.; Ortiz, S.; Robinson, D. Forest Communities and the Marketing of Lesser-Used Tropical Hardwoods in Mesoamerica; Editorial Ducere: Mexico City, Mexico, 2003; ISBN 968-7864-47-8. [Google Scholar]
  29. Vovides, A.P.; Luna, V.; Medina, G. Relación de algunas plantas y hongos mexicanos raros, amenazados o en peligro de extinción y sugerencias para su conservación. Acta Bot. Mex. 1997, 1–42. [Google Scholar] [CrossRef]
  30. Wehenkel, C.; Cruz-Cobos, F.; Carrillo, A.; Lujan-Soto, J.E. Estimating bark volumes for 16 native tree species on the Sierra Madre Occidental, Mexico. Scand. J. For. Res. 2012, 27, 578–585. [Google Scholar] [CrossRef]
  31. Meyer, H.A. Bark volume determination in trees. J. For. 1946, 44, 1067–1070. [Google Scholar]
  32. Cubbage, F.W.; Davis, R.R.; Paredes, D.R.; Mollenhauer, R.; Elsin, Y.K.; Frey, G.E.; Hernández, I.A.G.; Hurtado, H.A.; Cruz, A.M.S.; Salas, D.N.C. Community Forestry Enterprises in Mexico: Sustainability and Competitiveness. J. Sustain. For. 2015, 34, 623–650. [Google Scholar] [CrossRef]
  33. Secretaría de Medio Ambiente y Recursos Naturales (SEMARNAT). Anuario Estadístico de la Producción Forestal 2013; SEMARNAT: Mexico City, Mexico, 2014.
  34. Sánchez-Sánchez, O.; Islebe, G.A. Tropical forest communities in southeastern Mexico. Plant Ecol. 2002, 158, 183–200. [Google Scholar] [CrossRef]
  35. Márdero, S.; Nickl, E.; Schmook, B.; Schneider, L.; Rogan, J.; Christman, Z.; Lawrence, D. Sequías en el sur de la península de Yucatán: Análisis de la variabilidad anual y estacional de la precipitación. Investig. Geogr. 2012, 78, 19–33. [Google Scholar] [CrossRef]
  36. Navarro-Martínez, A.; Durán-García, R.; Méndez-González, M. El impacto del huracán Dean sobre la estructura y composición arbórea de un bosque manejado en Quintana Roo, México. Madera Bosques 2012, 18, 57–76. [Google Scholar] [CrossRef]
  37. Mascorro, V.S.; Coops, N.C.; Kurz, W.A.; Olguín, M. Attributing changes in land cover using independent disturbance datasets: A case study of the Yucatan Peninsula, Mexico. Reg. Environ. Chang. 2016, 16, 213–228. [Google Scholar] [CrossRef]
  38. Ford, A.; Nigh, R. Origins of the Maya Forest Garden: Maya Resource Management. J. Ethnobiol. 2009, 29, 213–236. [Google Scholar] [CrossRef]
  39. Chatters, J.C.; Kennett, D.J.; Asmerom, Y.; Kemp, B.M.; Polyak, V.; Blank, A.N.; Beddows, P.A.; Reinhardt, E.; Arroyo-Cabrales, J.; Bolnick, D.A.; et al. Late Pleistocene Human Skeleton and mtDNA Link Paleoamericans and Modern Native Americans. Science 2014, 344, 750–754. [Google Scholar] [CrossRef] [PubMed]
  40. Pennington, T.; Sarukhán, J. Árboles Tropicales de México. Manual para la Identificación de las Principales Especies; Universidad Nacional Autónoma de México, Fondo de Cultura Económica: Ciudad de México, México, 2005. [Google Scholar]
  41. Vozzo, J.A. Tropical Tree Seed Manual; Agriculture Handbook 721; USDA Forest Service: Washington, DC, USA, 2002.
  42. Missouri Botanical Garden Tropicos. Available online: http://www.tropicos.org/ (accessed on 12 November 2016).
  43. Huet, S.; Bouvier, A.; Poursat, M.-A.; Jolivet, E. Statistical Tools for Nonlinear Regression: A Practical Guide with S-PLUS and R Examples; Springer: New York, NY, USA, 2006. [Google Scholar]
  44. Husch, B.; Beers, T.W.; Kershaw, J.A. Forest Mensuration; John Wiley & Sons: Hoboken, NJ, USA, 2002; ISBN 978-0-47-101850-6. [Google Scholar]
  45. R Development Core Team. R: A Language and Environment for Statistical Computing; R Foundation for Statistical Computing v. 3.3.1: Vienna, Austria, 2016. [Google Scholar]
  46. Baty, F.; Ritz, C.; Charles, S.; Brutsche, M.; Flandrois, J.-P.; Delignette-Muller, M.-L. A toolbox for nonlinear regression in R: The package nlstools. J. Stat. Softw. 2015, 66, 1–21. [Google Scholar] [CrossRef]
  47. Greenwell, B.M. Schubert Kabban investr: An R package for inverse estimation. R J. 2014, 6, 90–100. [Google Scholar]
  48. Perez, D.; Kanninen, M.; Matamoros, F.; Fonseca, W.; Chaves, E. Heartwood, sapwood and bark contents of Bombacopsis quinata in Costa Rica. J. Trop. For. Sci. 2004, 318–327. [Google Scholar]
  49. Ogunwusi, A.A. Heartwood, Sapwood and Bark Proportions in Five Lesser Used Tropical Hardwood Species Growing in Nigeria. J. Biol. Agric. Healthc. 2013, 3, 80–83. [Google Scholar]
  50. Su, Y.; Fu, Y.; Liao, K.; Wei, A.; Xu, T.; Feng, Y.; Deng, H. Bark and Heartwood Percentage and Density of Paramichelia baillonii. J. Northwest For. Univ. 2012, 2, 51. [Google Scholar]
  51. Stayton, C.L.; Hoffman, M. Estimating Sugar Maple Bark Thickness and Volume; Research Paper NC-38; U.S. Deptartment of Agriculture, Forest Service, North Central Forest Experiment Station: St. Paul, MN, USA, 1970; Volume 8.
  52. Kozak, A.; Yang, R.C. Equations for estimating bark volume and thickness of commercial trees in British Columbia. For. Chron. 1981, 57, 112–115. [Google Scholar] [CrossRef]
  53. Rosell, J.A. Bark thickness across the angiosperms: More than just fire. New Phytol. 2016, 211, 90–102. [Google Scholar] [CrossRef] [PubMed]
  54. Richardson, S.J.; Laughlin, D.C.; Lawes, M.J.; Holdaway, R.J.; Wilmshurst, J.M.; Wright, M.; Curran, T.J.; Bellingham, P.J.; McGlone, M.S. Functional and environmental determinants of bark thickness in fire-free temperate rain forest communities. Am. J. Bot. 2015, 102, 1590–1598. [Google Scholar] [CrossRef] [PubMed]
  55. Vester, H.F.; Navarro, M.A. Fichas Ecologicas: Arboles Maderables de Quintana Roo; Fondo Mixto de Fomento a la Investigación Científica y Tecnológica CONACYT-Gobierno del Estado de Quintana Roo: Chetumal, Quintana Roo, México, 2007.
  56. Campos, B.; Simei, M.; Jose Jimenez-Osornio, J.; Barrientos, M. Dasometric analysis of siricote (Cordia dodecandra A. DC.) plantations under three types of management at Xmatkuil Yucatan. Madera Bosques 2015, 21, 47–54. [Google Scholar]
  57. Sánchez, G.; Arreola, J.A.; López, D.; Maldonado, V.; Olguín, M.; Wayson, C.; Carrillo, O.; Puc, R. Sitio de Monitoreo Intensivo del Carbono en Quintana Roo. Available online: pmcarbono.org/pmc/descargas/proyectos/Documentos_Red_Mex-SMIC/Estudio_de_caso_SMIC_Quintana_Roo.pdf (accessed on 10 September 2017).
  58. Mize, C.; Negreros-Castillo, P. Stand and species growth of a tropical forest in Quintana Roo, Mexico. J. Sustain. For. 2007, 23, 83–95. [Google Scholar] [CrossRef]
  59. Atha, D.E.; Romero, L.; Forrest, T. Bark volume determination of Bursera simaruba in Belize. Caribb. J. Sci. 2005, 41, 843–848. [Google Scholar]
  60. Bonyad, A.E.; Sima, A.; Bakhshandeh, A.; Dadras, H. Evaluation of non-destructive Meyer method for determination of bark volume of beech (Fagus orientalis Lipsky) in different geographical aspects. Casp. J. Environ. Sci. 2012, 10, 67–73. [Google Scholar]
  61. Marshall, H.D.; Murphy, G.E.; Lachenbruch, B. Effects of bark thickness estimates on optimal log merchandising. For. Prod. J. 2006, 56, 87–92. [Google Scholar]
  62. Comisión Nacional Forestal (CONAFOR). Sistema Nacional de Información Forestal; CONAFOR: Jalisco, Méico, 2016.
  63. Bautista-Hernández, J.; Torres-Pérez, J. Valoración económica del almacenamiento de carbono del bosque tropical del ejido Noh Bec, Quintana Roo, México. Rev. Chapingo Ser. Cienc. For. Ambiente 2003, 9, 69–75. [Google Scholar]
  64. Bray, D.B.; Ellis, E.A.; Armijo-Canto, N.; Beck, C.T. The institutional drivers of sustainable landscapes: A case study of the “Mayan Zone”in Quintana Roo, Mexico. Land Use Policy 2004, 21, 333–346. [Google Scholar] [CrossRef]
  65. Givnish, T.J.; Wong, S.C.; Stuart-Williams, H.; Holloway-Phillips, M.; Farquhar, G.D. Determinants of maximum tree height in Eucalyptus species along a rainfall gradient in Victoria, Australia. Ecology 2014, 95, 2991–3007. [Google Scholar] [CrossRef]
  66. Negreros-Castillo, P.; Cámara-Cabrales, L.; Devall, M.; Fajvan, M.A.; Mendoza Briseño, M.A.; Mize, C.W.; Navarro-Martínez, A. Silvicultura de las Selvas de Caoba en Quintana Roo, México. Criterios y Recomendaciones; CFAN, CONAFOR: Felipe Carrillo Puerto, México, 2014.
  67. Secretaría de Medio Ambiente y Recursos Naturales & Instituto Nacional de Ecología y Cambio Climático (SEMARNAT-INECC). Mexico’s Climate Change Mid-Century Strategy; S SEMARNAT-INECC: Mexico City, Mexico, 2016.
  68. Tolentino, O.; García-Frapolli, E.; Porter-Bolland, L.; Ruíz-Mallén, I.; Reyes-Garcia, V.; Sánchez-Gonzalez, M.-C.; López-Méndez, M.-E. Triggering community conservation through the trade of carbon offsets: The case of the ejido Felipe Carrillo Puerto, Mexico. J. Environ. Dev. 2015, 24, 187–210. [Google Scholar] [CrossRef]
  69. Sánchez, G.; Arreola, J.A.; López, D.; Maldonado, C.V.; Olguín, M.; Wayson, O.; Carrillo, O.; Puc, R. Reporte Técnico para el Proyecto Fortalecimiento REDD+ y Cooperación Sur-Sur; CONAFOR: Felipe Carrillo Puerto, Quintana Roo, México, 2016; p. 133.
Figure 1. Map of the study area in Felipe Carrillo Puerto, Quintana Roo, Mexico, and of the area harvested in 2016. The area harvested is defined by the coordinates 19.5376 N, 87.9992 W; 119.5378 N, 87.9705 W; 19.5383 N, 87.9705 W; 19.5381 N, 87.9994 W.
Forests 08 00338 g001
Figure 2. Bark thickness at the level of the stump. (A) Cordia dodecandra, with thin bark for its diameter; (B) Lysiloma latisiliquum, with thick outer bark that is shed in plates; (C) Manilkara zapota, with very thick outer bark and inner bark with the white latex used as a chewing gum base; (D) Metopium brownei, with bark that produces a black irritating exudate; (E) Swartzia cubensis, with characteristic furrowed bark; and (F) Swietenia macrophylla, with very thick bark covering one of the most prized woods of the Mayan rainforests. Scale bar = 5 mm.
Forests 08 00338 g002
Figure 3. Change in the proportion of bark volume (PBV) with diameter at 1.3 m from the log base (Db). (A) Cordia dodecandra; (B) Lysiloma latisiliquum; (C) Manilkara zapota; (D) Metopium brownei; (E) Swartzia cubensis; and (F) Swietenia macrophylla. In L. latisiliquum, M. brownei, and S. cubensis a decrease in the proportion of bark volume was observed with log size. Axes are log10 transformed. In gray are the 95% confidence bands for linear fits. * p < 0.05, ** p < 0.01, ns non-significant.
Forests 08 00338 g003
Figure 4. Change in bark volume with total volume of the log. Bark factor (F) was calculated from these fits. (A) Cordia dodecandra; (B) Lysiloma latisiliquum; (C) Manilkara zapota; (D) Metopium brownei; (E) Swartzia cubensis; and (F) Swietenia macrophylla. In gray, 95% confidence bands for fits.
Forests 08 00338 g004
Table 1. Species studied, their common names, taxonomic families, distributions, and height (H) and diameter at breast height (DBH) reported in the literature.
SpeciesCommon NameFamilyDistributionSize 1
Cordia dodecandra A.DC.SiricoteBoraginaceaeMexico (Yucatan Peninsula, Chiapas, Veracruz), Guatemala, Belize, Honduras, Cuba 2H: up to 30 m, DBH: 70 cm
Lysiloma latisiliquum (L.) Benth.TzalamFabaceaeMexico (Yucatan Peninsula, Chiapas, Tabasco), Florida, Bahamas, Caribbean, Belize, Guatemala 3H: up to 20 m, DBH: 70 cm
Manilkara zapota (L.) P. RoyenChicozapoteSapotaceaeMexico (Yucatan Peninsula, Gulf of Mexico, Chiapas, Oaxaca), Central America to Costa Rica 2H: up to 40 m, DBH: 150 cm
Metopium brownei (Jacq.) Urb.ChechénAnacardiaceaeMexico (Yucatan Peninsula, Gulf of Mexico, Chiapas), Caribbean, Belize, Guatemala, Honduras 3H: up to 25 m, DBH: 60 cm
Swartzia cubensis (Britton and Wilson) Standl.KataloxFabaceaeMexico (Yucatan Peninsula, Chiapas, Tabasco), Central America to Costa Rica, Caribbean 3H: 40 m, DBH: 150 cm
Swietenia macrophylla KingCaoba, big-leaf mahoganyMeliaceaeMexico (Yucatan Peninsula, Gulf of Mexico, Chiapas), Central America to northern South America 2H: up to 70 m, DBH: up to 350 cm
1 From Pennington and Sarukhán [40]; 2 Vozzo [41]; 3 Tropicos [42].
Table 2. Sample sizes and descriptive statistics per species regarding diameter at 1.3 m from the log base (Db), log length, and bark thickness.
SpeciesnDb (cm) 1Log Length (m) 1Bark Thickness (mm) 1
Cordia dodecandra1639.7 ± 1.677.5 ± 0.518.0 ± 0.29
Lysiloma latisiliquum2049.3 ± 2.075.5 ± 0.4314.2 ± 0.58
Manilkara zapota2041.5 ± 0.866.8 ± 0.2218.7 ± 0.45
Metopium brownei2045.8 ± 1.387.3 ± 0.438.9 ± 0.41
Swartzia cubensis2044.4 ± 1.436.6 ± 0.429.0 ± 0.49
Swietenia macrophylla2057.6 ± 1.649.9 ± 0.5019.0 ± 0.72
1 Mean ± standard error.
Table 3. Nonlinear models predicting wood volume based on the total volume (Equation (4)).
Speciesβ3 (95% C.I.)Rpred-obsRMSE
Cordia dodecandra0.295 (0.282, 0.307) ***0.9990.0109
Lysiloma latisiliquum0.337 (0.323, 0.351) ***0.9980.0187
Manilkara zapota0.427 (0.417, 0.437) ***0.9950.0148
Metopium brownei0.285 (0.268, 0.303) ***0.9960.0227
Swartzia cubensis0.280 (0.263, 0.298) ***0.9990.0212
Swietenia macrophylla0.370 (0.353, 0.387) ***0.9980.0583
β3: coefficient in Equation (4); Rpred-obs: correlation between predicted and observed values; RMSE: residual mean square error; *** p < 0.005.
Table 4. Nonlinear models predicting bark volume based on the total volume and bark factor (Equation (5)) and proportion of bark volume (Equation (6)).
SpeciesF (95% C.I.)Rpred-obsRMSEPBV (95% C.I.)
Cordia dodecandra0.9556 (0.9517, 0.9594) ***0.8910.01090.0870 (0.0796, 0.0943)
Lysiloma latisiliquum0.9416 (0.9366, 0.9465) ***0.8220.01870.1134 (0.1041, 0.1228)
Manilkara zapota0.9041 (0.8995, 0.9088) ***0.9080.01480.1826 (0.1741, 0.1909)
Metopium brownei0.9584 (0.9532, 0.9637) ***0.6380.02270.0815 (0.0713, 0.0914)
Swartzia cubensis0.9599 (0.9549, 0.9650) ***0.7890.02120.0786 (0.0688, 0.0882)
Swietenia macrophylla0.9289 (0.9222, 0.9357) ***0.8590.05830.1372 (0.1245, 0.1496)
F: bark factor; Rpred-obs: correlation between predicted and observed values; RMSE: Residual mean square error; *** p < 0.005.
Table 5. Proportion of bark volume calculated here (updated PBV) and currently used by the Ejido Felipe Carrillo Puerto (current PBV), and the difference in the number of trees that would need to be felled using the current PBV vs. the updated PBV considering the wood volumes (WV) sold from 2010 to 2016 by the ejido. Mean total volume per log was calculated based on the data measured in this study.
SpeciesUpdated PBVCurrent PBVWV Difference (%)Logged Volume 2010–2016 (m3)Mean Total Volume per Log (m3)Number of Felled Trees
Updated PBVCurrent PBVDifference
Cordia dodecandra0.08700.1000−1.4233.1240.766247.348.0−0.7
Lysiloma latisiliquum0.11340.10001.51883.4290.91711086.51070.3+16.2
Manilkara zapota0.18260.100010.111597.7420.82842359.62143.0+216.6
Metopium brownei0.08150.1000−2.011465.8261.05461513.31544.4−31.1
Swartzia cubensis0.07860.1000−2.3268.4810.958277.679.4−1.8
Swietenia macrophylla0.13720.1400−0.33443.6042.0702248.4249.2−0.8

