Forest Structure Estimation from a UAV-Based Photogrammetric Point Cloud in Managed Temperate Coniferous Forests

1
Institute of Decision Science for a Sustainable Society, Kyushu University, 6-10-1 Hakozaki, Fukuoka 812-8581, Japan
2
Graduate School of Bioresource and Bioenvironmental Sciences, Kyushu University, 6-10-1 Hakozaki, Higashi-ku, Fukuoka 812-8581, Japan
3
Faculty of Agriculture, Kyushu University, 6-10-1 Hakozaki, Fukuoka 812-8581, Japan
*
Author to whom correspondence should be addressed.
Forests 2017, 8(9), 343; https://doi.org/10.3390/f8090343
Submission received: 18 August 2017
/
Revised: 4 September 2017
/
Accepted: 6 September 2017
/
Published: 13 September 2017
(This article belongs to the Special Issue Remote Sensing of Leaf Area Index (LAI) and Other Vegetation Parameters)
Abstract
:Here, we investigated the capabilities of a lightweight unmanned aerial vehicle (UAV) photogrammetric point cloud for estimating forest biophysical properties in managed temperate coniferous forests in Japan, and the importance of spectral information for the estimation. We estimated four biophysical properties: stand volume (V), Lorey’s mean height (HL), mean height (HA), and max height (HM). We developed three independent variable sets, which included a height variable, a spectral variable, and a combined height and spectral variable. The addition of a dominant tree type to the above data sets was also tested. The model including a height variable and dominant tree type was the best for all biophysical property estimations. The root-mean-square errors (RMSEs) for the best model for V, HL, HA, and HM, were 118.30, 1.13, 1.24, and 1.24, respectively. The model including a height variable alone yielded the second highest accuracy. The respective RMSEs were 131.74, 1.21, 1.31, and 1.32. The model including a spectral variable alone yielded much lower estimation accuracy than that including a height variable. Thus, a lightweight UAV photogrammetric point cloud could accurately estimate forest biophysical properties, and a spectral variable was not necessarily required for the estimation. The dominant tree type improved estimation accuracy.
1. Introduction
Up-to-date and spatially detailed information on forest biophysical properties is fundamental to allowing managers to ensure sustainable forest management [1]. Thus, a methodology that captures the spatial and periodic information of forest biophysical properties is required. Remote sensing is an important option for capturing the spatio-temporal information of forest biophysical properties. Measuring three-dimensional (3D) forest structure as a point cloud is an established way to capture the information.
Airborne light detection and ranging (Lidar) is an active remote sensing system that directly measures 3D structures by emitting laser pulses from an aircraft-borne sensor. Because the emitted laser pulses can reach the ground by penetrating a dense forest canopy, airborne Lidar can provide terrain height, as well as a point cloud. The relative height between the point cloud and the local terrain height is well suited for measuring stand-level forest biophysical properties, including stand volume [2,3], and tree height [2,4]. Currently, airborne Lidar is the most accurate remote sensing system for obtaining specific stand-level forest biophysical properties [1,5]. However, because of cost limitations, repeat surveys using airborne Lidar data are often difficult [6]. Therefore, we need alternative approaches to obtain forest biophysical properties.
Digital aerial photographs are an alternative option to generate a point cloud. Recent advances in computer science make it possible to generate a point cloud semi-automatically using the Structure from Motion (SfM) approach [7,8]. Unlike airborne Lidar, digital aerial photographs cannot provide terrain height information, but they can provide the point cloud of the upper canopy surface [9], especially under dense forest canopy conditions. However, the relative height between the point cloud derived from digital aerial photographs and the terrain height provided by another data source, such as airborne Lidar, can be used to estimate forest biophysical properties [10,11,12,13]. Thus, periodic acquisitions of digital aerial photographs may be a practical option in areas where accurate terrain height information is available (e.g., a digital terrain model (DTM) derived from an existing Airborne Lidar dataset).
Lightweight unmanned aerial vehicles (UAVs) may be a suitable platform for acquiring digital aerial photographs for small areas at low cost [14,15]. Because the material and operational cost of lightweight UAVs is low [16], they can acquire digital photographs at a lower cost than a manned aerial vehicle with increased spatial and temporal resolution. If we can estimate forest biophysical properties from the lightweight UAV photogrammetric point cloud as accurately as a point cloud derived from digital aerial photographs acquired by a manned aerial vehicle, the former may become an alternative option to measure forest biophysical properties. At present, the digital images derived from lightweight UAVs may differ from those derived from manned airborne vehicles. In particular, lightweight UAVs are sometimes equipped with consumer-grade digital cameras and inexpensive global navigation satellite system (GNSS), which may lead to distortions or positioning errors, respectively [17,18].
Several studies have assessed the value of UAV photogrammetric point clouds in predicting biophysical properties [19,20,21,22,23,24]. However, these focused mainly on dominant tree heights (e.g., [25]) or individual tree height (e.g., [19,20,21]). Relatively few studies have evaluated the accuracy of predicting other stand-level forest biophysical properties, such as stand volume. In a limited study, Puliti et al. [17] demonstrated that the use of a UAV can provide accurate forest characteristics in boreal coniferous forests. Thus, more experiments should be conducted in a variety of forest types to determine the validity of the defined parameters and the accuracy of the reported data [17].
Compared with airborne Lidar, digital aerial photography has the advantage that multispectral information is automatically captured, but digital aerial photographs have a disadvantage that terrain height cannot be acquired under dense forest canopy conditions. The spectral information data provide detailed information on the 3D structural change of the forest canopy [22], and previous studies using airborne Lidar suggested that adding multispectral or hyperspectral data improved the estimation of biophysical properties [26,27,28]. Thus, spectral information can improve the accuracy of biophysical property estimations when both point cloud and spectral information derived from a UAV are used. However, Puliti et al. [17] showed that adding spectral information into a biophysical property estimation using a UAV photogrammetric point cloud resulted in a limited improvement. One reason for this limited improvement was that the UAV photographs in the study were acquired in late fall, which may result in a low spectral response from vegetation [17]. Thus, further research is needed to evaluate the importance of spectral information when using a lightweight UAV equipped with a consumer-grade digital camera.
In this study, we investigated the capabilities of the lightweight UAV photogrammetric point cloud using the SfM approach to estimate forest biophysical properties in managed temperate coniferous forests. We estimated four biophysical properties—stand volume (V), Lorey’s mean height (HL), mean height (HA), and max height (HM)—using variables derived from a UAV photogrammetric point cloud. For the estimation, six independent variable sets, which included height variables alone, spectral variables alone, and a combination of height and spectral variables, were compared. Finally, we investigated the capability of the UAV photogrammetric point cloud and the importance of spectral information for estimating biophysical properties.
2. Materials and Methods
2.1. Study Area
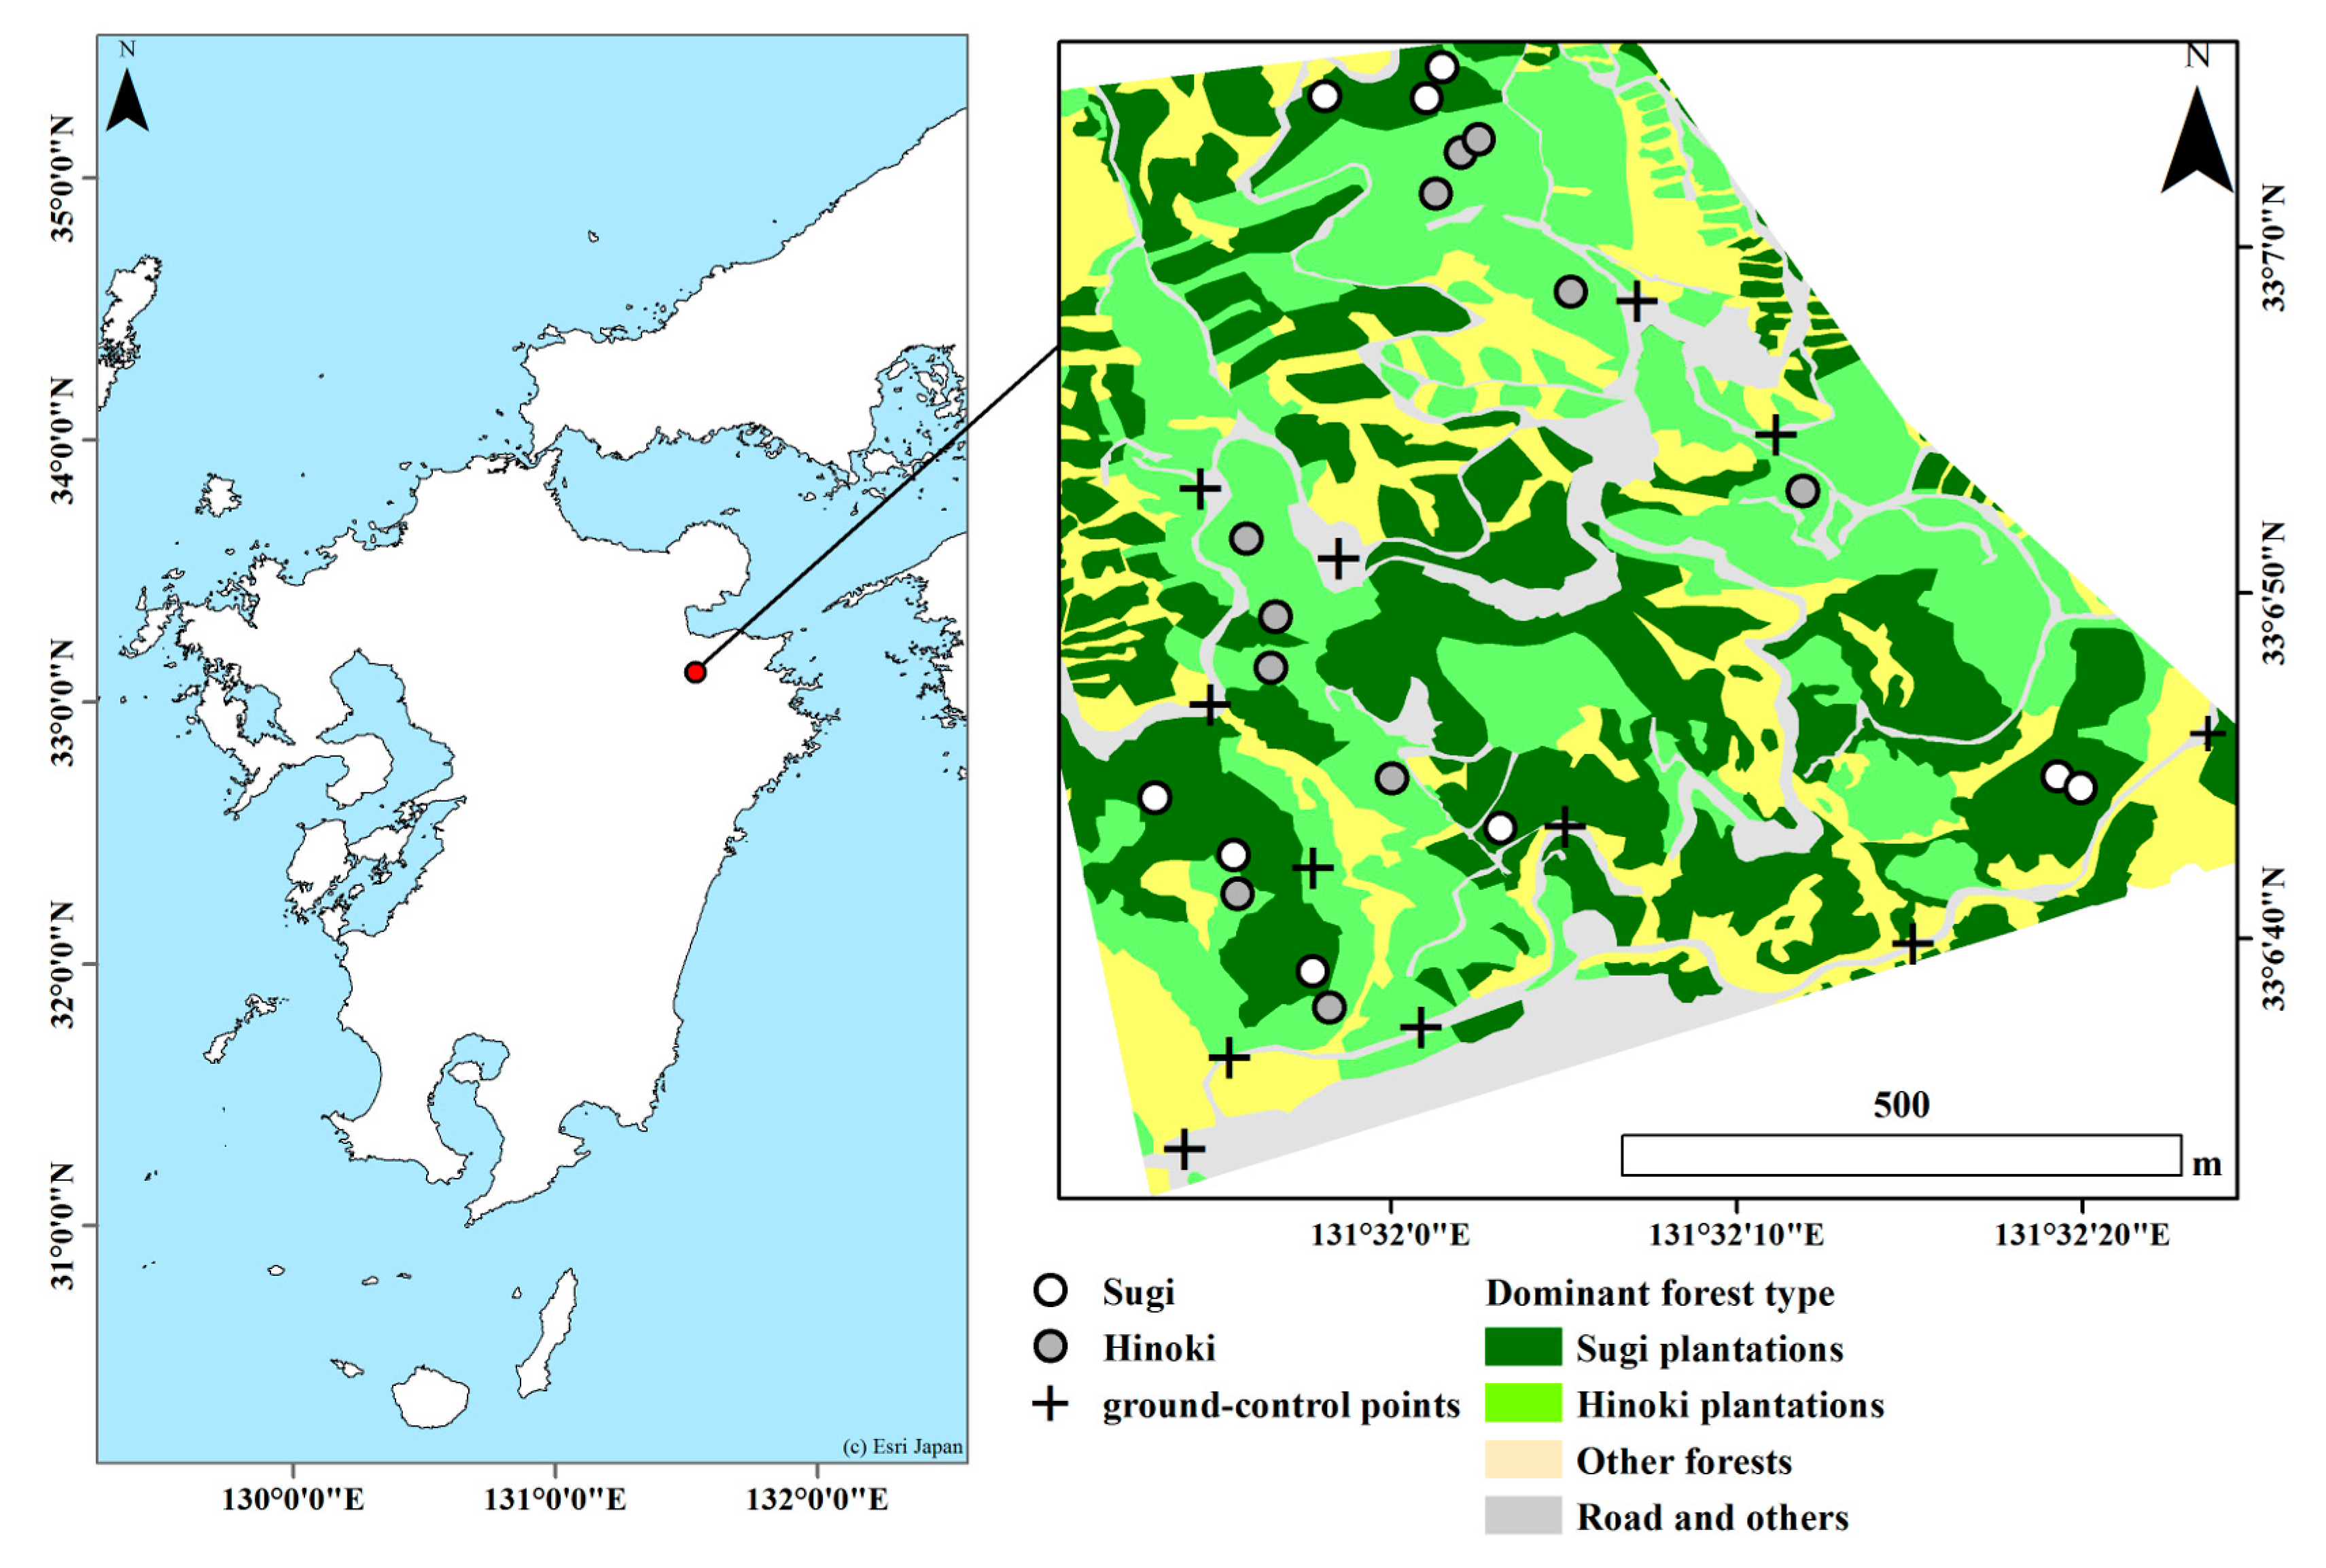
The study was conducted in a temperate forest area (131°32′3″ E, 33°6′51″ N) in Oita prefecture located in southwestern Japan (Figure 1). The area is dominated by plantations of evergreen conifers trees, including Sugi (Cryptomeria japonica) and Hinoki (Chamaecyparis obtusa). The stand age of the coniferous forests ranges from eight to 62 years. The elevation ranges from 520 to 775 m above sea level.
2.2. Field Measurements
Field measurements in Sugi-dominated stands and Hinoki-dominated stands were conducted at previously established permanent plots as a part of different ongoing field studies. Since we used already established plots, there were two sizes of rectangular permanent plots: 400 m2 (20 m × 20 m) and 225 m2 (15 m × 15 m). The two Hinoki plots were 225 m2, and others were 400 m2. There were 9 and 11 plots in the Sugi and Hinoki stands, respectively. Field data were collected between September 2016 and October 2016. Within each plot, diameter at breast height (DBH) and tree height for all trees with DBH >5 cm were measured. In total, 1197 trees were measured. The plot locations were recorded with a GNSS (MobileMapper 120, Spectra Precision, Westminster, CO, USA). It should be noted that we could not measure the heights of 12 trees because they were inclined from the perpendicular. For trees without a height measurement, we estimated their heights using the Näslund equation [29].
For the UAV photograph survey, 11 SfM ground-control points (GCPs) were distributed across the survey area prior to the acquisition of UAV photographs (Figure 1). Each GCP was approximately 55 × 65 cm with a red cross marked on a white sheet. The GCP locations were also acquired by MobileMapper 120, which is a differential GNSS providing sub-meter accuracy after post-processing.
We calculated the stem volume for each measured tree using tree volume equations developed by the Forest Agency, Japan [30]. Then, V for each plot was calculated by summing the volume of each tree and dividing by the plot size. We also derived HL, HA, and HM for each plot from field data (Table 1).
The plot and GCP location data were post-processed using the nearest GNSS-based control stations constructed by the Geospatial Information Authority of Japan (GSI) with MobileMapper Office 4.6 (Spectra Precision, Westminster, CO, USA).
2.3. Remote Sensing Data
UAV photographs were acquired under leaf-on canopy conditions between September and October 2016, which corresponded to late summer and early fall. A Phantom 4 UAV was used to acquire the photographs. The UAV has an integrated camera, with a 1/2.3 CMOS sensor that can capture red–green–blue (RGB) spectral information. The UAV was operated manually with visual confirmation in accordance with Japanese laws. The flying altitude was between 70 and 110 m above ground level, and the flying speed was approximately 2.5 m/s. The average ground sampling distance was 4.3 cm. The aerial photographs were captured at 5-s intervals to achieve an overlap of more than 80%. It should be noted that an additional UAV photograph acquisition flight was conducted in January 2017, which corresponded to winter conditions, to add the rightmost GCP in Figure 1. Since there were overlaps between the first and additional acquisition, we concurrently created a photogrammetric point cloud. While the acquisition was conducted during the winter season, the acquired photographs did not include any plots. Thus, the photographs were not used for the biophysical parameters estimation but used just for adding a GCP.
2.4. Remote Sensing Data
2.4.1. Processing of the UAV Photographs
The UAV photographs were processed using PhotoScan Professional version 1.2.6 ([31]; Petersburg, Russia) to generate a photogrammetric point cloud that includes both height and spectral information (i.e., red, green, and blue). PhotoScan Professional is a commercial software that uses the SfM approach to generate a 3D reconstruction from a collection of overlapping photographs, which can provide a dense and accurate 3D point cloud [17]. Briefly, the workflow composed of the “Align photos” stage and the “Build a dense point cloud” stage. “Align photos” is the stage at which camera location and orientation, and internal parameters are determined [32]. We selected “High accuracy” and “Reference” as settings for “Accuracy” and “Pair preselection”, respectively. Eleven GCPs were used to improve the accuracy of the “Align photos” stage. We imported the post-processed GCP location data into PhotoScan Professional and manually identified each GCP within the UAV photographs. The overall RMSE of GCP matching process was 2.94 m (Table 2). The “Build a dense point cloud” stage generates dense 3D, point cloud data based on the camera location and orientation, and internal parameters determined by the “Align photos” stage. We selected “Medium quality” and “Mild” as settings for “Quality” and “Depth filtering”, respectively, following previous studies [17].
We constructed a 1-m resolution grid of a digital surface model (DSM) and for the spectral data from the generated 3D point cloud data. The DSM was created by assigning the highest value of the 3D point cloud for each grid cell. The 1-m resolution grid of the spectral data of each band (i.e., red, green, and blue) was created by assigning the average value of the 3D point cloud. Then, the three band values of each grid were normalized radiometrically by dividing each band value in the grid by the sum of the values of all bands in the corresponding grid, as described in previous studies [17,33,34].
2.4.2. Calculation of a Canopy Height Model (CHM) and Variable Extractions
A CHM was calculated as the relative height by subtracting the terrain height from each grid value of the DSM. We used a digital terrain model (DTM) developed by the Geospatial Information Authority of Japan as the terrain height. The DTM consists of 5-m spatial resolution data derived from airborne Lidar. The vertical accuracy is expressed as the standard deviation within 2 m (GSI, 2014). Because the spatial resolution of the DTM was 5 m, we interpolated the 5-m resolution data into 1-m data using the inverse distance weighted interpolation method.
Then, 13 variables derived from the CHM were calculated within each field plot, including mean canopy height (hmean, the average value of the relative height), deciles of the height percentiles (h10, h20, …, h100), and standard deviation (hsd). In addition to the height variables, we calculated the means (RGBR, mean, RGBG, mean, and RGBR, mean) and standard deviations (RGBR, sd, RGBG, sd, and RGBR, sd) of the spectral values.
2.4.3. Statistical Analysis
A regression model approach was applied to develop the biophysical properties estimation model following previous studies [10,35]:
where F is the biophysical property calculated from the field data; β0, β1, and β2 are the regression coefficients; h is the height variable (i.e., Hmean, h10, …, h100, hsd); RGB is the spectral variable; b is the regression coefficient of a dummy variable; and z is the dummy variable. The dummy variable was used to assess the influence of dominant tree type (dtype) on the regression. The dummy variable (i.e., z) has a value of 1 for Hinoki-dominated stands. For the Sugi-dominated stands, the dummy variable has a value of 0. To avoid problems of collinearity, we did not include more than one variable for each height and spectral variable, while we calculated 13 variables (i.e., Hmean, h10, …, h100, hsd) and six variables (i.e., RGBR, mean, RGBB, mean, …, RGBR, sd) for the height and spectral properties, respectively. Equation (1) was log transformed to solve the equation as a linear regression using Equation (2):
To evaluate the importance of each height and spectral variable for estimating forest biophysical properties, we initially regressed the biophysical properties against a height variable alone and a spectral variable alone. Then, we regressed the biophysical properties against a combination of a height variable and a spectral variable. Finally, we evaluated the importance of dominant tree type by adding dominant tree type as an independent variable, resulting in a combination of a height variable and dominant tree type, a spectral variable and dominant tree type, and a height variable, a spectral variable, and dominant tree type.
The accuracies of the estimates of the best model were validated using a coefficient of determination (R2), the root-mean-square error (RMSE), a Bayesian information criterion (BIC), and the relative RMSE expressed as a percentage. The relative RMSE was defined as the RMSE divided by the mean value of the field data. Because the number of field plots was limited (i.e., 20), R2 and RMSE were calculated using a leave-one-out cross-validation. R2 was calculated using linear regression of the observed versus estimated values. The number of independent variables was the same within each dataset. Thus, for each independent variable dataset, we selected the best model using R2. For comparisons between different independent variable datasets, we used the BIC. The statistical analysis was conducted using R ver. 3.12 [36].
3. Results
For each biophysical property, the variables derived from the UAV photogrammetric point cloud were regressed using six independent variable sets, and the selected models were summarized (Table 3). When the biophysical properties were regressed against a height variable alone, h90 was selected for the models. The R2 values of the selected models for V, HL, HA, and HM were 0.71, 0.93, 0.91 and 0.93, respectively. The respective RMSEs were 131.74, 1.21, 1.31, and 1.32, respectively. The model that included a spectral variable alone yielded lower estimation accuracy than the one including a height variable, and the R2 of the selected models for V, HL, HA, and HM, were 0.26, 0.23, 0.21, and 0.26, respectively. The selected model including both a height variable and a spectral variable yielded almost the same R2 as the model including a height variable. When the biophysical properties were regressed with the addition of the dominant tree type information, in terms of R2, adjR2, RMSE, and relative RMSE, the accuracies of the estimation were comparable to those obtained using the respective independent variable sets without the dominant tree type information.
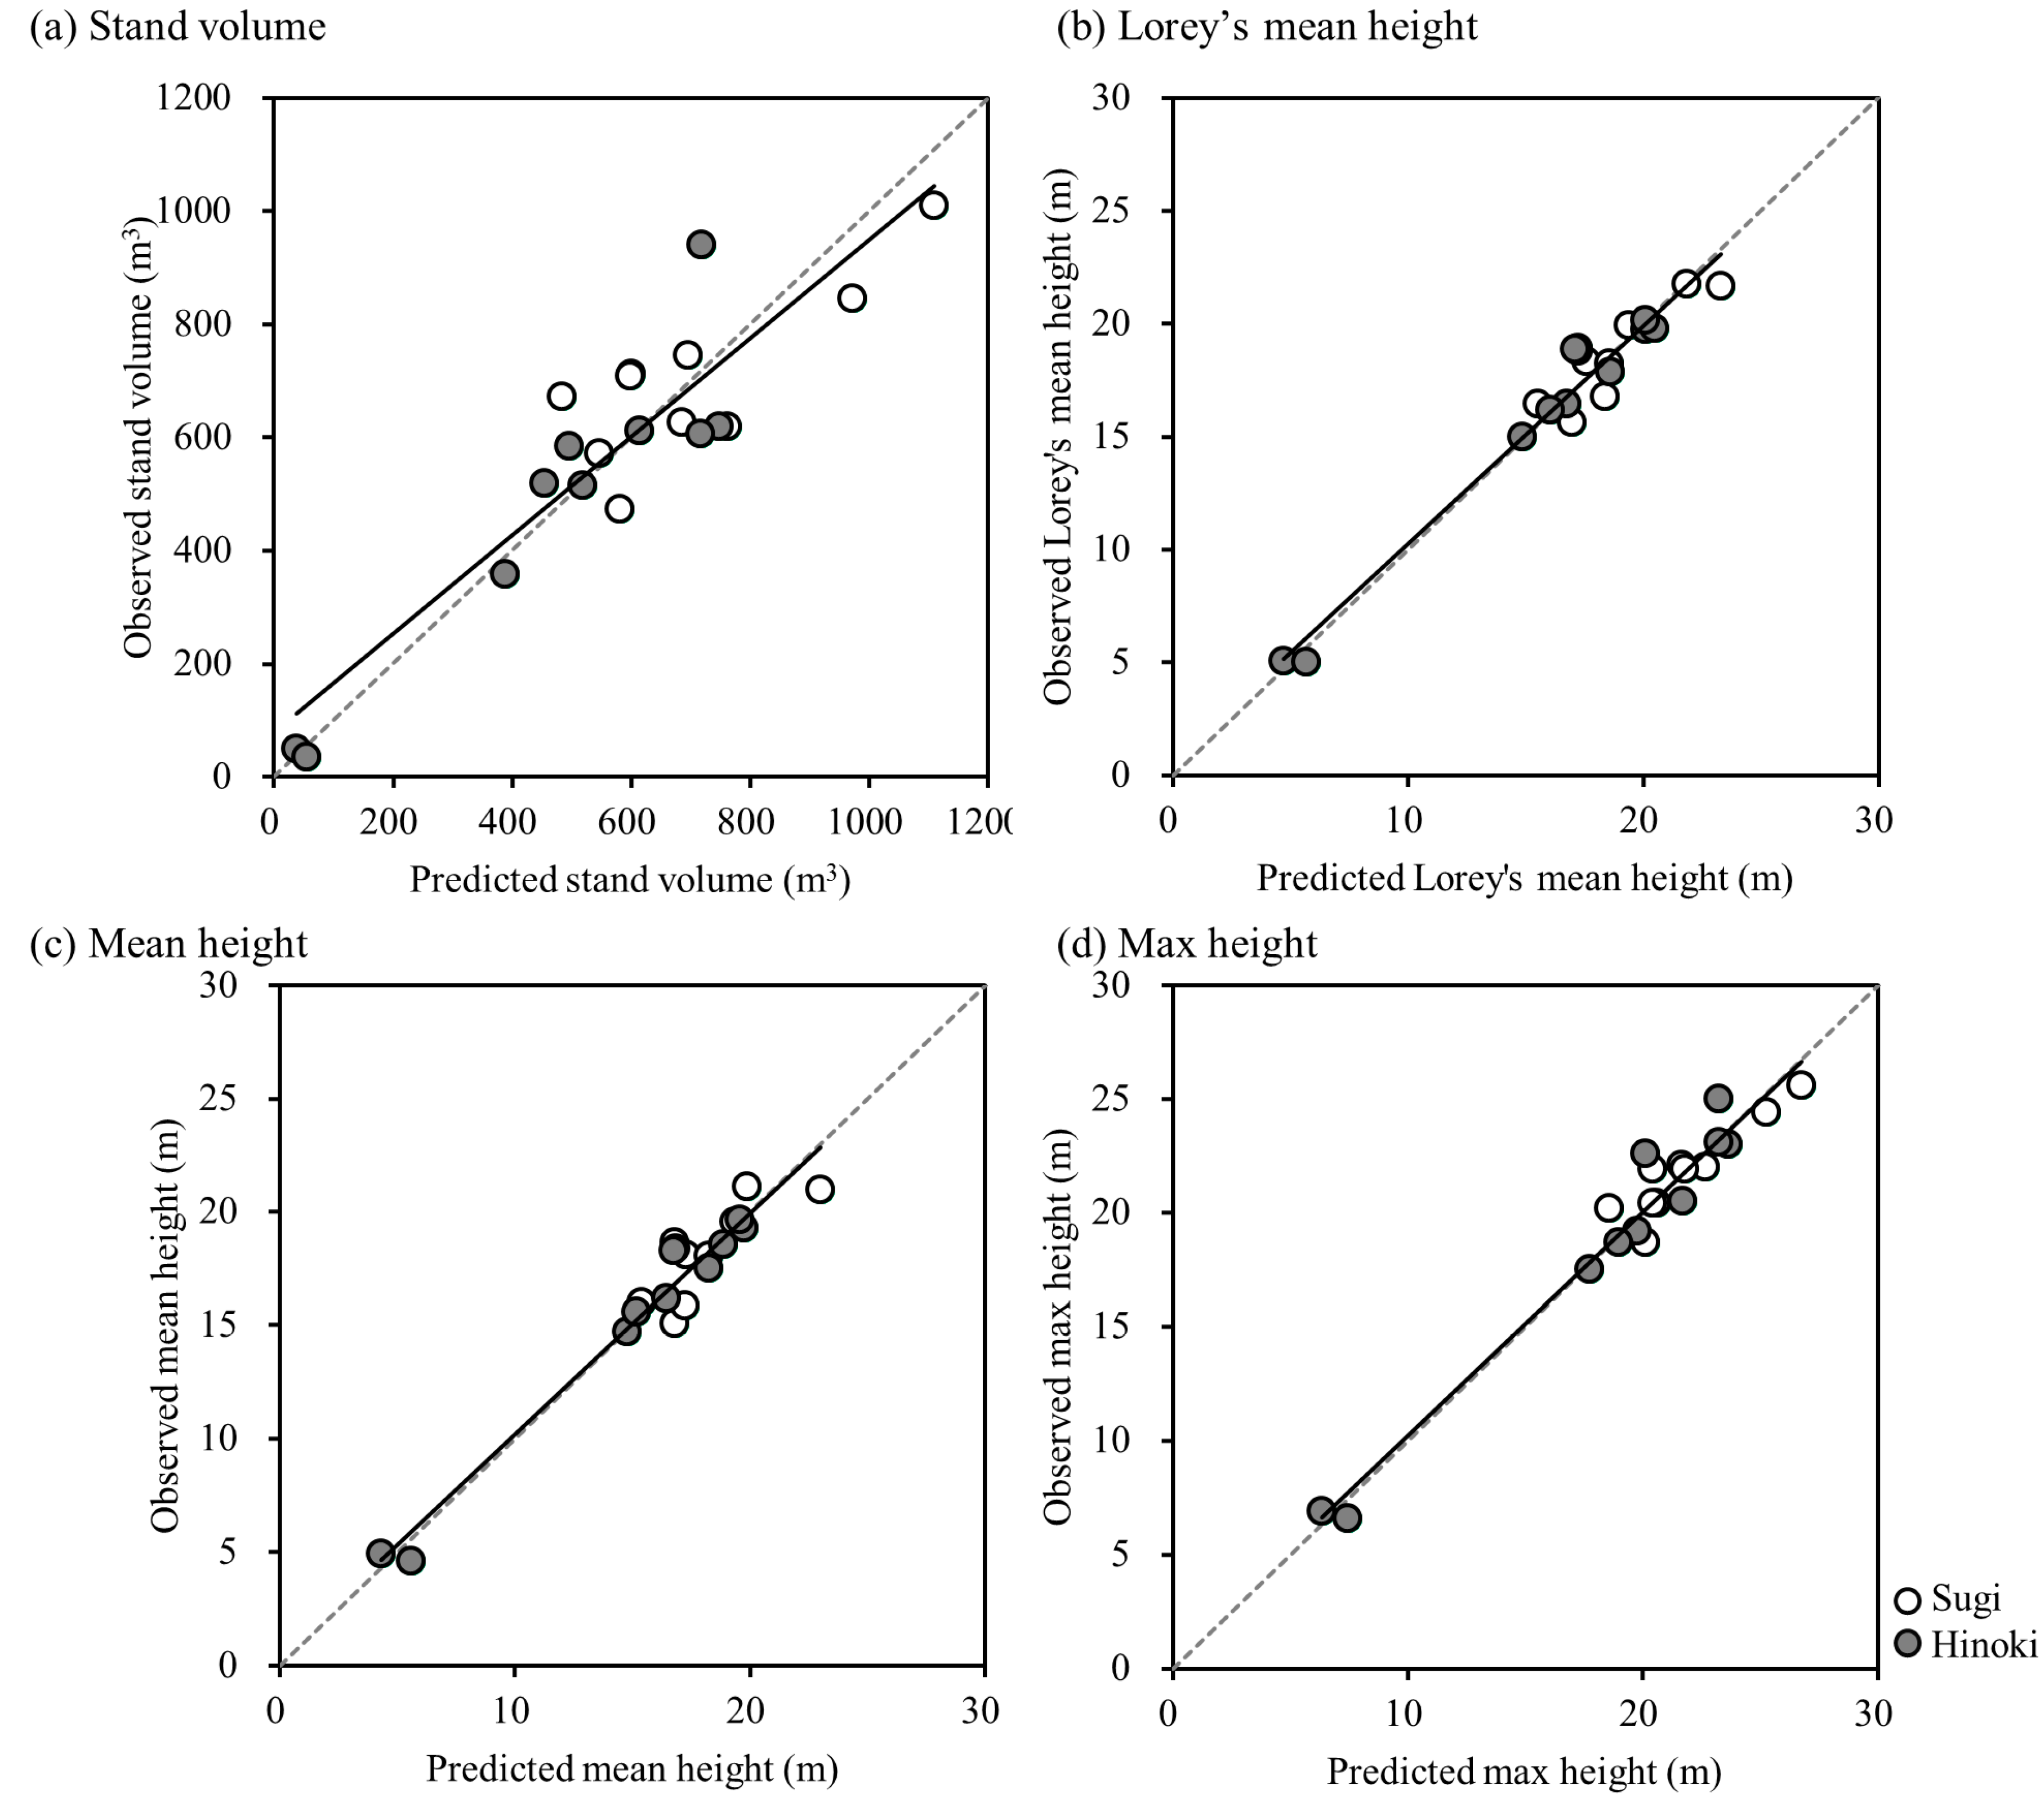
In terms of the BIC, the model that included a height variable with the addition of dominant tree type information was the best model for all the biophysical property estimations within the six independent variable sets. The selected models used h90 and dominant tree type for all the biophysical property estimations. The RMSEs for V, HL, HA, and HM were 118.30, 1.13, 1.24, and 1.24, respectively. The relative RMSEs of the selected models for HL, HA, and HM were between 6.17 and 7.50. The relative RMSE of V, which was 20.02%, was larger than that of the other biophysical properties. Figure 2 shows a scatterplot of the observed versus predicted values for each biophysical property using the best models. The regression lines for HL, HA, and HM were almost in line with the 1:1 line.
4. Discussion
In this study, we assessed the accuracy of forest biophysical property estimation using a lightweight UAV photogrammetric point cloud in managed temperate coniferous forests. Previous studies assessed the accuracy of the estimation in temperate broadleaved forests and conifer-dominated boreal forests. These studies focused especially on tree heights such as dominant tree height and Lorey’s mean height (e.g., [17,25]). They showed relative RMSEs of 8.4% in temperate broadleaved forests [25] and 13.3% in conifer-dominated boreal forests [17]. Studies focusing on stand volume or aboveground biomass estimation are rare. Puliti et al. [17] fitted variables derived from a UAV photogrammetric point cloud for V and HL in conifer-dominated boreal forests in Norway. The study showed a relative RMSE of 15.0%. Kachamba et al. [37] similarly evaluated the aboveground biomass estimation accuracy using a UAV photogrammetric point cloud. They showed a relative RMSE of 46.7%. In the present study, R2 values were between 0.72 and 0.93, and the relative RMSEs were between 6.92% and 22.84% in managed temperate coniferous forests. Thus, we conclude that the estimation results in managed temperate coniferous forests are comparable to those of conifer-dominated boreal forests and superior to those of dry tropical forests. One reason why our results are superior to those of dry tropical forests is that Kachamba et al. [37] did not use the terrain height data derived from airborne Lidar, but data generated by filtering a UAV photogrammetric point cloud.
The models including a spectral variable alone yielded a lower model accuracy than the models including a height variable alone for all the biophysical properties. The accuracy of the models including both a height variable and a spectral variable also yielded lower accuracy than that of the model including a height variable alone. Thus, we conclude that the spectral information did not improve the forest biophysical property estimations. Spectral information is often used for tree species recognition in forest inventory applications using 3D point clouds, since height information alone typically does not identify different tree species [38]. However, previous studies, which used a point cloud derived from airborne Lidar or digital aerial photographs, suggested that spectral information helped to refine the biophysical property estimation [17,26,27,28]. In contrast, the present study showed that adding spectral information did not improve forest biophysical property estimations using a lightweight UAV photogrammetric point cloud. One possible reason is that we used the consumer-grade digital cameras and, therefore, spectral variables from only the visible range were used. It is important to note that, in our study, a spectral variable can estimate forest biophysical properties, but the R2 was approximately 0.2. One advantage of using a spectral variable is that terrain height information is not required for forest biophysical property estimations. Because we need accurate terrain height information to use height variables for forest biophysical property estimations, using a height variable may be difficult in areas, such as tropical forests, where accurate terrain height information cannot be obtained [37]. Thus, spectral information may become an important estimator. Further research is required to explore the importance of spectral information in these regions.
The model that includes a height variable and dominant tree type yielded the lowest BIC for all the biophysical property estimations. Thus, we conclude that adding dominant tree type improved the accuracy of forest biophysical property estimations. However, it should be noted that the improvement was limited in terms of R2 and RMSE, compared with the model that included a height variable alone. Thus, we also conclude that the dominant tree type is not necessarily required because of the limited improvement, although this information did improve model accuracy. The importance of adding forest or dominant tree type information has been examined previously, especially for estimating aboveground biomass using airborne Lidar. These studies showed that adding forest or dominant tree type information has a limited effect on improving the estimation accuracy in boreal coniferous [39] and tropical forests [35]. While studies that examined the importance of adding forest or dominant tree type information using a photogrammetric point cloud are limited, Ota et al. [10] also obtained similar results using a manned aircraft-derived, photogrammetric point cloud in tropical forests. We confirmed that the UAV photogrammetric point cloud can also estimate forest biophysical properties independently of dominant tree type in managed coniferous forests. This becomes a strong advantage when using point cloud-based forest biophysical property estimations in areas where several forest types occur in mixed communities because of the simplified calibration process and forest inventory [10].
5. Conclusions
The main conclusion of this study is that a UAV photogrammetric point cloud can accurately estimate forest biophysical properties, including V, HL, HA, and HM, in managed temperate coniferous forests. For the estimations, a height variable alone is required, while a spectral variable is not necessarily required. The dominant tree type, if it is available, improves the estimation accuracy. While a spectral variable yielded lower estimation accuracy, it may be informative in areas where accurate terrain height is not available. Thus, further study is required to explore the importance of spectral information in these areas.
Acknowledgments
This study was supported by JSPS KAKENHI (grant number 16K18721) and grants from the Project of the NARO Bio-oriented Technology Research Advancement Institution (the special scheme project on regional developing strategy). We thank Leonie Seabrook, from Edanz Group (www.edanzediting.com/ac) for editing the revised draft of this manuscript.
Author Contributions
All authors contributed extensively to the work. Tetsuji Ota and Miyuki Ogawa performed the processing and wrote the manuscript. Nobuya Mizoue, Keiko Fukumoto, and Shigejiro Yoshida supervised the research work, reviewed the manuscript, and provided comments and suggestions to improve the manuscript.
Conflicts of Interest
The authors declare no conflict of interest.
References
- White, J.C.; Coops, N.C.; Wulder, M.A.; Vastaranta, M.; Hilker, T.; Tompalski, P. Remote Sensing Technologies for Enhancing Forest Inventories: A Review. Can. J. Remote Sens. 2016, 42, 619–641. [Google Scholar] [CrossRef]
- Næsset, E. Airborne laser scanning as a method in operational forest inventory: Status of accuracy assessments accomplished in Scandinavia. Scand. J. For. Res. 2007, 22, 433–442. [Google Scholar] [CrossRef]
- Ioki, K.; Imanishi, J.; Sasaki, T.; Morimoto, Y.; Kitada, K. Estimating stand volume in broad-leaved forest using discrete-return LiDAR: Plot-based approach. Landsc. Ecol. Eng. 2010, 6, 29–36. [Google Scholar] [CrossRef] [Green Version]
- Næsset, E.; Økland, T. Estimating tree height and tree crown properties using airborne scanning laser in a boreal nature reserve. Remote Sens. Environ. 2002, 79, 105–115. [Google Scholar] [CrossRef]
- Wulder, M.A.; Bater, C.W.; Coops, N.C.; Hilker, T.; White, J.C. The role of LiDAR in sustainable forest management. For. Chron. 2008, 84. [Google Scholar] [CrossRef]
- Hird, N.J.; Montaghi, A.; McDermid, J.G.; Kariyeva, J.; Moorman, J.B.; Nielsen, E.S.; McIntosh, C.A. Use of Unmanned Aerial Vehicles for Monitoring Recovery of Forest Vegetation on Petroleum Well Sites. Remote Sens. 2017, 9. [Google Scholar] [CrossRef]
- Fonstad, M.A.; Dietrich, J.T.; Courville, B.C.; Jensen, J.L.; Carbonneau, P.E. Topographic structure from motion: A new development in photogrammetric measurement. Earth Surf. Process. Landf. 2013, 38, 421–430. [Google Scholar] [CrossRef]
- Snavely, N.; Seitz, S.M.; Szeliski, R. Modeling the world from Internet photo collections. Int. J. Comput. Vis. 2008, 80, 189–210. [Google Scholar] [CrossRef]
- White, J.C.; Wulder, M.A.; Vastaranta, M.; Coops, N.C.; Pitt, D.; Woods, M. The utility of image-based point clouds for forest inventory: A comparison with airborne laser scanning. Forests 2013, 4, 518–536. [Google Scholar] [CrossRef]
- Ota, T.; Ogawa, M.; Shimizu, K.; Kajisa, T.; Mizoue, N.; Yoshida, S.; Takao, G.; Hirata, Y.; Furuya, N.; Sano, T.; et al. Aboveground Biomass Estimation Using Structure from Motion Approach with Aerial Photographs in a Seasonal Tropical Forest. Forests 2015, 6, 3882–3898. [Google Scholar] [CrossRef]
- Bohlin, J.; Wallerman, J.; Fransson, J.E.S. Forest variable estimation using photogrammetric matching of digital aerial images in combination with a high-resolution DEM. Scand. J. For. Res. 2012, 27, 692–699. [Google Scholar] [CrossRef]
- Balenović, I.; Simic Milas, A.; Marjanović, H. A Comparison of Stand-Level Volume Estimates from Image-Based Canopy Height Models of Different Spatial Resolutions. Remote Sens. 2017, 9, 205. [Google Scholar] [CrossRef]
- Vastaranta, M.; Wulder, M.A.; White, J.C.; Pekkarinen, A.; Tuominen, S.; Ginzler, C.; Kankare, V.; Holopainen, M.; Hyyppä, J.; Hyyppä, H. Airborne laser scanning and digital stereo imagery measures of forest structure: Comparative results and implications to forest mapping and inventory update. Can. J. Remote Sens. 2013, 39, 382–395. [Google Scholar] [CrossRef]
- Matese, A.; Toscano, P.; Di Gennaro, S.F.; Genesio, L.; Vaccari, F.P.; Primicerio, J.; Belli, C.; Zaldei, A.; Bianconi, R.; Gioli, B. Intercomparison of UAV, Aircraft and Satellite Remote Sensing Platforms for Precision Viticulture. Remote Sens. 2015, 7, 2971–2990. [Google Scholar] [CrossRef]
- Salamí, E.; Barrado, C.; Pastor, E. UAV Flight Experiments Applied to the Remote Sensing of Vegetated Areas. Remote Sens. 2014, 6, 11051–11081. [Google Scholar] [CrossRef] [Green Version]
- Tang, L.; Shao, G. Drone remote sensing for forestry research and practices. J. For. Res. 2015, 26, 791–797. [Google Scholar] [CrossRef]
- Puliti, S.; Ørka, H.O.; Gobakken, T.; Næsset, E. Inventory of small forest areas using an unmanned aerial system. Remote Sens. 2015, 7, 9632–9654. [Google Scholar] [CrossRef] [Green Version]
- Torresan, C.; Berton, A.; Carotenuto, F.; Di Gennaro, S.F.; Gioli, B.; Matese, A.; Miglietta, F.; Vagnoli, C.; Zaldei, A.; Wallace, L. Forestry applications of UAVs in Europe: A review. Int. J. Remote Sens. 2016, 38, 2427–2447. [Google Scholar]
- Goodbody, T.R.H.; Coops, N.C.; Marshall, P.L.; Tompalski, P.; Crawford, P. Unmanned aerial systems for precision forest inventory purposes: A review and case study. For. Chron. 2017, 93, 71–81. [Google Scholar] [CrossRef]
- Wallace, L.; Lucieer, A.; Malenovský, Z.; Turner, D.; Vopěnka, P. Assessment of Forest Structure Using Two UAV Techniques: A Comparison of Airborne Laser Scanning and Structure from Motion (SfM) Point Clouds. Forests 2016, 7, 62. [Google Scholar] [CrossRef]
- Birdal, A.C.; Avdan, U.; Türk, T. Estimating tree heights with images from an unmanned aerial vehicle. Geomat. Nat. Hazards Risk 2017, 1–13. [Google Scholar] [CrossRef]
- Dandois, J.P.; Ellis, E.C. High spatial resolution three-dimensional mapping of vegetation spectral dynamics using computer vision. Remote Sens. Environ. 2013, 136, 259–276. [Google Scholar] [CrossRef]
- Zarco-Tejada, P.J.; Diaz-Varela, R.; Angileri, V.; Loudjani, P. Tree height quantification using very high resolution imagery acquired from an unmanned aerial vehicle (UAV) and automatic 3D photo-reconstruction methods. Eur. J. Agron. 2014, 55, 89–99. [Google Scholar] [CrossRef]
- Dandois, J.; Olano, M.; Ellis, E. Optimal Altitude, Overlap, and Weather Conditions for Computer Vision UAV Estimates of Forest Structure. Remote Sens. 2015, 7, 13895–13920. [Google Scholar] [CrossRef]
- Lisein, J.; Pierrot-Deseilligny, M.; Bonnet, S.; Lejeune, P. A photogrammetric workflow for the creation of a forest canopy height model from small unmanned aerial system imagery. Forests 2013, 4, 922–944. [Google Scholar] [CrossRef]
- Tonolli, S.; Dalponte, M.; Neteler, M.; Rodeghiero, M.; Vescovo, L.; Gianelle, D. Fusion of airborne LiDAR and satellite multispectral data for the estimation of timber volume in the Southern Alps. Remote Sens. Environ. 2011, 115, 2486–2498. [Google Scholar] [CrossRef]
- Popescu, S.C.; Wynne, R.H.; Scrivani, J.A. Fusion of small-footprint lidar and multispectral data to estimate plot-level volume and biomass in deciduous and pine forests in Virginia, USA. For. Sci. 2004, 50, 551–565. [Google Scholar]
- Luo, S.; Wang, C.; Xi, X.; Pan, F.; Peng, D.; Zou, J.; Nie, S.; Qin, H. Fusion of airborne LiDAR data and hyperspectral imagery for aboveground and belowground forest biomass estimation. Ecol. Indic. 2017, 73, 378–387. [Google Scholar] [CrossRef]
- Näslund, M. Skogsforsöksastaltens gallringsforsök i tallskog. Medd. Statens Skogsforsöksanstalt 1936, 29, 1–169. [Google Scholar]
- Forest Agency of Japan Timber volume table (Western Japan). Forestry Investigation Committee: Tokyo, Japan, 1970.
- Agisoft PhotoScan. Available online: http://www.agisoft.com (accessed on 22 May 2017).
- Agisoft, L.L.C. Agisoft Photoscan User Manual; Professional Edition, Version 1.2; Agisoft: St. Petersburg, Russia, 2016; Available online: http://www.agisoft.com/pdf/photoscan-pro_1_2_en.pdf (accessed on 6 July 2017).
- Dalponte, M.; Ørka, H.O.; Ene, L.T.; Gobakken, T.; Næsset, E. Tree crown delineation and tree species classification in boreal forests using hyperspectral and ALS data. Remote Sens. Environ. 2014, 140, 306–317. [Google Scholar] [CrossRef]
- Näsi, R.; Honkavaara, E.; Lyytikäinen-Saarenmaa, P.; Blomqvist, M.; Litkey, P.; Hakala, T.; Viljanen, N.; Kantola, T.; Tanhuanpää, T.; Holopainen, M. Using UAV-based photogrammetry and hyperspectral imaging for mapping bark beetle damage at tree-level. Remote Sens. 2015, 7, 15467–15493. [Google Scholar] [CrossRef]
- Ota, T.; Kajisa, T.; Mizoue, N.; Yoshida, S.; Takao, G.; Hirata, Y.; Furuya, N.; Sano, T.; Ponce-Hernandez, R.; Ahmed, O.S.; et al. Estimating aboveground carbon using airborne LiDAR in Cambodian tropical seasonal forests for REDD+ implementation. J. For. Res. 2015, 20, 484–492. [Google Scholar] [CrossRef]
- R Core Team R: A Language and Environment for Statistical Computing. Available online: https://www.r-project.org/ (accessed on 26 May 2017).
- Kachamba, J.D.; Ørka, O.H.; Gobakken, T.; Eid, T.; Mwase, W. Biomass Estimation Using 3D Data from Unmanned Aerial Vehicle Imagery in a Tropical Woodland. Remote Sens. 2016, 8. [Google Scholar] [CrossRef]
- Dalponte, M.; Bruzzone, L.; Gianelle, D. Tree species classification in the Southern Alps based on the fusion of very high geometrical resolution multispectral/hyperspectral images and LiDAR data. Remote Sens. Environ. 2012, 123, 258–270. [Google Scholar] [CrossRef]
- Næsset, E. Estimation of above-and below-ground biomass in boreal forest ecosystems. In International Society of Photogrammetry and Remote Sensing. International Archives of Photogrammetry, Remote Sensing and Spatial Information Sciences; Thies, M., Kock, B., Spiecker, H., Weinacker, H., Eds.; International Society of Photogrammetry and Remote Sensing (ISPRS): Freiburg, Germany, 2004; pp. 145–148. [Google Scholar]
Figure 1.
Location of the study area. The municipal boundaries provided by ESRI Japan were used as the country border. The forest cover map was created by visual interpretation based on aerial photographs acquired by a lightweight unmanned aerial vehicle (UAV).
Figure 1.
Location of the study area. The municipal boundaries provided by ESRI Japan were used as the country border. The forest cover map was created by visual interpretation based on aerial photographs acquired by a lightweight unmanned aerial vehicle (UAV).

Figure 2.
Observed biophysical properties versus predicted biophysical properties from the best model of each of the canopy height models. A diagonal dotted line and a solid line indicate the 1:1 line and regression line between the predicted biophysical properties and observed biophysical properties, respectively.


Table 1.
Summary of the biophysical properties, which were stand volume (V), Lorey’s mean height (HL), mean height (HA), and max height (HM), calculated from field measurements (SD indicates the standard deviation).
Table 1.
Summary of the biophysical properties, which were stand volume (V), Lorey’s mean height (HL), mean height (HA), and max height (HM), calculated from field measurements (SD indicates the standard deviation).
| Dominant Tree Type | The Number of Plots | V (m3/ha) | HL (m) | HA (m) | HM (m) | ||||
|---|---|---|---|---|---|---|---|---|---|
| Mean | SD | Mean | SD | Mean | SD | Mean | SD | ||
| Sugi | 9 | 712.37 | 142.20 | 18.67 | 2.06 | 18.17 | 2.07 | 21.91 | 1.98 |
| Hinoki | 11 | 491.75 | 249.36 | 15.67 | 5.25 | 15.21 | 5.13 | 18.50 | 5.92 |
Table 2.
The errors of ground-control points.
| Ground-Control Points | X Error (m) | Y Error (m) | Z Error (m) | Total Error (m) |
|---|---|---|---|---|
| 1 | 1.15 | 5.19 | −1.42 | 5.50 |
| 2 | 0.48 | 0.26 | −0.07 | 0.55 |
| 3 | −3.26 | −1.08 | −3.87 | 5.17 |
| 4 | 0.92 | −0.15 | 0.44 | 1.03 |
| 5 | 2.19 | −0.54 | −0.26 | 2.27 |
| 6 | −1.01 | −0.81 | 0.15 | 1.30 |
| 7 | 0.81 | −1.89 | −0.85 | 2.23 |
| 8 | −0.48 | −0.63 | 0.90 | 1.20 |
| 9 | 1.16 | −0.30 | −0.01 | 1.20 |
| 10 | −1.53 | 1.68 | 1.87 | 2.94 |
| 11 | −0.49 | −1.77 | 3.14 | 3.64 |
| RMSE | 1.47 | 1.89 | 1.71 | 2.94 |
Table 3.
Summary of the selected estimation models for four forest biophysical properties: stand volume (V), Lorey’s mean height (HL), mean height (HA), and max height (HM) (bold indicates the best model for each biophysical property).
Table 3.
Summary of the selected estimation models for four forest biophysical properties: stand volume (V), Lorey’s mean height (HL), mean height (HA), and max height (HM) (bold indicates the best model for each biophysical property).
| Dependent Variables | Independent Variable | Selected Variables | R2 | AdjR2 | RMSE | Relative RMSE | BIC |
|---|---|---|---|---|---|---|---|
| V | h | h90 | 0.71 | 0.70 | 131.74 | 22.29 | 7.14 |
| RGB | RGBG, sd | 0.26 | 0.21 | 291.80 | 49.37 | 58.99 | |
| h + RGB | h90, RGBB, sd | 0.68 | 0.64 | 143.15 | 24.22 | 9.95 | |
| h + dtype | h90, dtype | 0.78 | 0.75 | 118.30 | 20.02 | 2.99 | |
| RGB + dtype | RGBB, sd, dtype | 0.20 | 0.11 | 303.16 | 51.29 | 53.01 | |
| h + RGB + dtype | h90, RGBR, sd, dtype | 0.80 | 0.76 | 112.97 | 19.11 | 3.83 | |
| HL | h | h90 | 0.93 | 0.92 | 1.21 | 7.08 | −41.14 |
| RGB | RGBB, sd | 0.23 | 0.19 | 4.31 | 25.29 | 19.73 | |
| h + RGB | h90, RGBB, mean | 0.94 | 0.92 | 1.19 | 7.00 | −39.41 | |
| h + dtype | h90, dtype | 0.92 | 0.93 | 1.13 | 6.65 | −42.56 | |
| RGB + dtype | RGBB, sd, dtype | 0.90 | 0.10 | 4.69 | 27.57 | 22.73 | |
| h + RGB + dtype | h90, RGBG, mean, dtype | 0.93 | 0.92 | 1.15 | 6.7 | −39.71 | |
| HA | h | h90 | 0.91 | 0.91 | 1.31 | 7.92 | −35.96 |
| RGB | RGBB, sd | 0.21 | 0.16 | 4.30 | 25.97 | 21.12 | |
| h + RGB | h90, RGBB, mean | 0.92 | 0.91 | 1.25 | 7.53 | −35.26 | |
| h + dtype | h70, dtype | 0.90 | 0.91 | 1.24 | 7.50 | −34.12 | |
| RGB + dtype | RGBB, sd, dtype | 0.89 | 0.08 | 4.62 | 27.96 | 24.11 | |
| h + RGB + dtype | h90, RGBB, mean, dtype | 0.92 | 0.91 | 1.24 | 7.51 | −34.29 | |
| HM | h | h90 | 0.93 | 0.92 | 1.32 | 6.61 | −42.74 |
| RGB | RGBB, sd | 0.26 | 0.22 | 4.62 | 23.05 | 14.92 | |
| h + RGB | h90, RGBR, mean | 0.94 | 0.92 | 1.32 | 6.57 | −40.37 | |
| h + dtype | h90, dtype | 0.92 | 0.93 | 1.24 | 6.17 | −44.89 | |
| RGB + dtype | RGBB, sd, dtype | 0.90 | 0.13 | 5.04 | 25.17 | 17.91 | |
| h + RGB + dtype | h90, RGBR, mean, dtype | 0.93 | 0.94 | 1.13 | 5.63 | −44.30 |
© 2017 by the authors. Licensee MDPI, Basel, Switzerland. This article is an open access article distributed under the terms and conditions of the Creative Commons Attribution (CC BY) license (http://creativecommons.org/licenses/by/4.0/).
Share and Cite
MDPI and ACS Style
Ota, T.; Ogawa, M.; Mizoue, N.; Fukumoto, K.; Yoshida, S. Forest Structure Estimation from a UAV-Based Photogrammetric Point Cloud in Managed Temperate Coniferous Forests. Forests 2017, 8, 343. https://doi.org/10.3390/f8090343
AMA Style
Ota T, Ogawa M, Mizoue N, Fukumoto K, Yoshida S. Forest Structure Estimation from a UAV-Based Photogrammetric Point Cloud in Managed Temperate Coniferous Forests. Forests. 2017; 8(9):343. https://doi.org/10.3390/f8090343
Chicago/Turabian StyleOta, Tetsuji, Miyuki Ogawa, Nobuya Mizoue, Keiko Fukumoto, and Shigejiro Yoshida. 2017. "Forest Structure Estimation from a UAV-Based Photogrammetric Point Cloud in Managed Temperate Coniferous Forests" Forests 8, no. 9: 343. https://doi.org/10.3390/f8090343
Note that from the first issue of 2016, this journal uses article numbers instead of page numbers. See further details here.