Ash Dieback on Sample Points of the National Forest Inventory in South-Western Germany

1
Institute for Plant Protection in Horticulture and Forests, Federal Research Centre for Cultivated Plants (Julius Kuehn Institute), Messeweg 11/12, Braunschweig 38104, Germany
2
Department of Forest Health, Forest Research Institute of Baden-Württemberg, Wonnhaldestr. 4, 79100 Freiburg, Germany
3
Biometrics and Informatics, Forest Research Institute of Baden-Württemberg, Wonnhaldestr. 4, 79100 Freiburg, Germany
*
Author to whom correspondence should be addressed.
Forests 2018, 9(1), 25; https://doi.org/10.3390/f9010025
Submission received: 27 November 2017
/
Revised: 8 January 2018
/
Accepted: 9 January 2018
/
Published: 12 January 2018
(This article belongs to the Special Issue Impacts of Climate Change—Selected Papers from FowiTa German Forest Sciences Conference (Sessions 1–5))
Abstract
:The alien invasive pathogen Hymenoscyphus fraxineus causes large-scale decline of European ash (Fraxinus excelsior). We assessed ash dieback in Germany and identified factors that were associated with this disease. Our assessment was based on a 2015 sampling of national forest inventory plots that represent a supra-regional area. In the time from 2012 to 2015, the number of regrown ash trees corresponded to only 42% of the number of trees that had been harvested or died. Severe defoliation was recorded for almost 40% of the living trees in 2015, and more than half of the crowns mainly consisted of epicormic shoots. Necroses were present in 24% of root collars. A total of 14% of the trees were in sound condition, which sum up to only 7% of the timber volume. On average, trees of a higher social status or with a larger diameter at breast height were healthier. Collar necroses were less prevalent at sites with a higher inclination of terrain, but there was no evidence for an influence of climatic variables on collar necroses. The disease was less severe at sites with smaller proportions of the basal area of ash compared to the total basal area of all trees and in the north-eastern part of the area of investigation. The regeneration of ash decreased drastically.
1. Introduction
Ash dieback is a severe disease of European ash trees (Fraxinus excelsior L.) in Europe. It is caused by Hymenoscyphus fraxineus (T. Kowalski) Baral, Queloz & Hosoya (syn. H. pseudoalbidus Queloz et al., anamorph: Chalara fraxinea T. Kowalski), a fungus that is probably native to East Asia [1,2]. The disease was first noticed in the early 1990s in Poland and since then has spread over vast parts of the continent [3,4]. Although ash accounts for less than one percent of the forest area of Europe [5,6], it is widely spread and of high importance in certain regions. It is a main tree species in floodplain forests, ravine forests, and dry calcareous soils [7]. Undoubtedly, the disease-induced large-scale decline of ash populations has far-reaching implications for silviculture, local economies, and ecosystems in Europe [5,8,9,10].
The disease causes a number of different symptoms. The fungus infects ash leaves with airborne ascospores and causes leaf necroses [1,11]. By spreading via petioles into woody tissues, it locally kills shoots and twigs [1,12,13]. Every year, numerous infections can occur on a single tree and lead to extensive crown decline. Diseased ash trees form epicormic shoots as a compensation for the loss of foliage, which slows the process of decline [14]. Necroses can also occur on ash root collars, which are often followed by extensive butt rot and which decisively drive mortality. H. fraxineus was frequently detected in such collar necroses and is probably the causal agent of this symptom [15,16,17,18,19,20,21]. However, there are other pathogenic fungi that frequently colonize ash collar necroses, especially species of honey fungus (Armillaria spp.). It is assumed that honey fungi act mainly as secondary pathogens in ash collar necroses but play an important aggravating role in this pathosystem [15,16,17,18,19,20,21]. Infections by these fungi are often followed by wood decay and a reduction of the stability of the trees, which can be a crucial risk for forest visitors, forestry staff, and adjacent infrastructure [5,21,22].
Partial genetic resistance against ash dieback has been demonstrated to be present in many ash populations throughout Europe [14,23]. Genotypes differ strongly in susceptibility, and some trees still remain healthy or almost healthy in otherwise heavily damaged stands. This unfolds the possibility of resistance traits being passed on to future ash generations. Thus, the management of ash dieback mainly focuses on the retention of sound-looking ash individuals and on the harvest of valuable timber before wood quality is compromised by the disease [5,22].
The severity and progress of ash dieback have been monitored in numerous local stands and experimental plots throughout Europe, but there is a lack of studies that cover a representative sample of large areas. Such research is necessary to assess future mortality, economic losses, and changes of ecosystems, knowledge that is important for decision-making in policy and forest management. Furthermore, studies that comprise large areas are suitable for the identification of factors that may influence disease severity. In the Czech Republic, data on ash dieback severity were collected in more than 1000 ash stands throughout the country, which allowed the identification of a number of environmental and stand characteristics that are connected to disease severity [24].
In Baden-Württemberg, which is a federal state in south-western Germany, the disease probably arrived in 2006 and became omnipresent in 2009 [25]. Here, ash is of special importance and accounts for 4.9% (about 65,000 ha) of the total forest area according to data of the national forest inventory (NFI) of 2012. The timber volume stock of ash is estimated to be 17.8 million m3.
In this study, the extent of crown damage and the prevalence of collar necroses were assessed in 2015 for randomly chosen sample points of the NFI in Baden-Württemberg. The aim was to collect data on ash dieback that are representative of the whole federal state. On the one hand, these data were used to assess the current situation and the development of ash and ash dieback in the federal state. On the other hand, the data were analysed to identify factors that may influence disease severity. Some preliminary results of this study have already been published in a local report on the forest condition in Baden-Württemberg [26].
2. Materials and Methods
2.1. Inventory Plots
The NFI in Baden-Württemberg is based on a systematic and permanent grid of 2 km × 2 km. The corners of a 150 m × 150 m square (tract) at every grid point form the sample points, if they are located in the forest (for further description of the NFI sample design, see [26]). The third NFI in Germany was conducted in 2011/2012 (reference year 2012). In Baden-Württemberg, it comprised 4580 tracts and 13,232 sample points in total. Ash trees (with diameter at breast height (DBH) ≥ 7 cm) were present at 1373 sample points in 1023 tracts. For this study, we randomly selected 529 sample points in 330 tracts where ash was present in 2012.
2.2. Data Collection
Data collection was carried out by three teams of experienced inventory contractors in July and the first week of August in 2015. Sample trees were selected by applying the method of the NFI in 2012. In every sample point, trees with a minimum DBH of 7 cm were selected by the angle-count method with a basal-area factor of 4 (m2 ha−1) (see [27]). The location and species was recorded for each sample tree, in addition to whether it was alive, felled, or standing dead.
The health condition with regard to ash dieback was examined for each selected ash tree. Crown defoliation and the portion of epicormic shoots of the living crown were assessed according to [14] and by applying the following percentage classes: 0% to 25%, 26% to 60%, and 61% to 99%. No assessment of crown symptoms was conducted if vegetation did not allow for an adequate view into the crown. Each ash tree was examined thoroughly for the presence or absence of collar necroses. If necessary, moss covers were removed. Injuries of other kinds at root collars, which may emerge, e.g., during timber logging, were not considered as collar necroses. The presence of necroses was considered as uncertain if it was not possible to infer the cause or nature of occurring bark irregularities. The DBH was measured on all selected ash trees, and the social status according to Kraft’s classification (pre-dominant, dominant, co-dominant, and dominated [28]) was recorded. Finally, the number of epicormic shoots on the trunks was counted.
In a distance of 5 m to each sample point, the regeneration of ash, i.e., ash trees taller than 50 cm but with a DBH smaller than 7 cm, was examined in a circular plot (r = 2 m). Regeneration trees had been examined in the same circular plots during the regular NFIs (see [27]). In the plots, the severity of ash dieback was assessed per ash tree by counting twigs that exhibited characteristic lesions. The following classes were applied: 0% (no infection), 1% to 50% of twigs infected, 51% to 99% of twigs infected, and 100% (all twigs infected or tree dead). Moreover, all ash trees were assigned to the two following size classes: 50 cm to 130 cm in height, and ≥131 cm in height and DBH < 7 cm.
Prior to data collection, the symptom assessment of the data collecting teams was synchronized during a joint excursion. The teams used a comprehensive guidebook with photos of differently diseased tree crowns and root collars as a reference during data collections. Each team worked in a certain region in order to minimize travel expenses. Data quality was verified by reassessments of 5% of the sample points.
2.3. Data Analyses
The field data were processed and stored in a relational database. Data were only analysed for trees with complete data records for both the recent NFI and the data collection in 2015. All analyses were conducted using the R software for statistical computing (R package version 3.4.0, Vienna, Austria) [29]. Descriptive frequency statistics regarding symptom variables (crown defoliation, epicormic shoots, collar necrosis) were calculated using ratio-estimators according to the statistical design of the German NFI, which uses angle-count (ACS) sampling for the selection of the tally trees. ACS selects sample trees with unequal inclusion probabilities, which have to be accounted for when estimating the means or totals of attributes of the population. Each observation has to be weighted by an individual factor depending on the tree’s basal area and the ACS-basal area factor applied: in the German NFI, the basal area factor BAF is 4 m2 ha−1 and the weight of the jth tree in the ith plot wij equals BAF/gij (ha−1), with gij as the sample tree’s basal area (m2). Weight wij equals the number of trees per hectare represented by the sample tree and may be interpreted as a per hectare blow-up factor. The number of trees per hectare is therefore estimated per plot i as the sum of the weights wij of the sample trees per plot (or a subset of them, e.g., the trees of a species of interest), and the volume per hectare is estimated by the sum of the tree volumes multiplied by the respective weights.
Percentage values are calculated by a ratio-estimator: the percentage of the number of trees per hectare in class k is estimated by:
with Ik = 1, if tree j in plot i is in class k, or else, Ik = 0; and n is the number of plots. The variance of pctk is estimated by:
The standard error is calculated by:
For explanations, see [30]. Quantitative values (occupying forest area, timber volume etc.) were calculated by using the NFI data, which means they rselate to the situation in 2011/2012.
In order to test potential climatic effects on the prevalence of collar necroses, we used the following climatic variables as means of the period 2006 (the assumed arrival of the pathogen in the region [24]) to 2013: Mean temperature and total precipitation from May to September, respectively; and number of days with daily maximum air temperature ≥28 °C (a threshold for the mycelial growth of H. fraxineus [31]) and ≥36 °C (which is likely to kill mycelia of H. fraxineus [31]), respectively. These climate variables were available as regionalized data [32,33] and assigned to each sample plot. Differences of crown symptoms between social classes were tested by means of the χ2-test. Regarding factors influencing the prevalence of collar necroses, we used semi-parametric regressions (generalized additive models GAM, R-package mgcv [34]) as flexible tools for explorative analyses. The presence of collar necrosis as a binomial response was fitted by means of a logistic model with DBH, climatic variables, slope of terrain (inclination), elevation, and inventory team as explorative variables.
3. Results
3.1. Change in the Number of Ash Trees over Time
A total of 1824 living ash trees with DBH ≥ 7 cm belonged to the sample at the time of the NFI in 2012. In 2015, 1627 of these trees (89.2%) were still alive. During these three years, 154 ash trees (8.4%) had been felled and 43 (2.4%) had died without being felled. Only 82 new ash trees entered into the sample by crossing the sampling threshold of 7 cm DBH in the same time. In 2012, the ash population had an average stem density of 378 trees ha−1, but decreased significantly to 311 ha−1 in 2015 (paired t-test with t = −6.141, df = 528, p < 0.001). Overall mortality of ash trees due to harvest or other reasons amounted to 10.8% of the initial sample; for other trees than ash, overall mortality accounted for only 6.9% and was significantly lower than the mortality of ash trees (x2-test, p < 0.001).
3.2. Proportions of Trees in Different Health Conditions
Percentages of crown symptoms and collar necrosis prevalence are given in Table 1. About a quarter of the trees showed little to no crown defoliation, whereas 44% of the trees were defoliated to more than 60%. In 32% of the trees, epicormic shoots accounted for less than 25% of the living crowns, but in almost half of the trees, the portion of epicormic shoots exceeded 60%. Collar necroses were unequivocally present at 24% and absent at 67% of the trees. A total of 14% of the trees were in sound condition (little to no crown defoliation and epicormic shoots and no collar necrosis). Percentages of occupying area and timber volume deviated considerably from the above mentioned percentages of trees (Table 1), as the severity or prevalence of symptoms depended on tree size (cf. Section 3.3).
3.3. Factors That May Influence Symptom Prevalence or Severity
3.3.1. Severity of Crown Symptoms
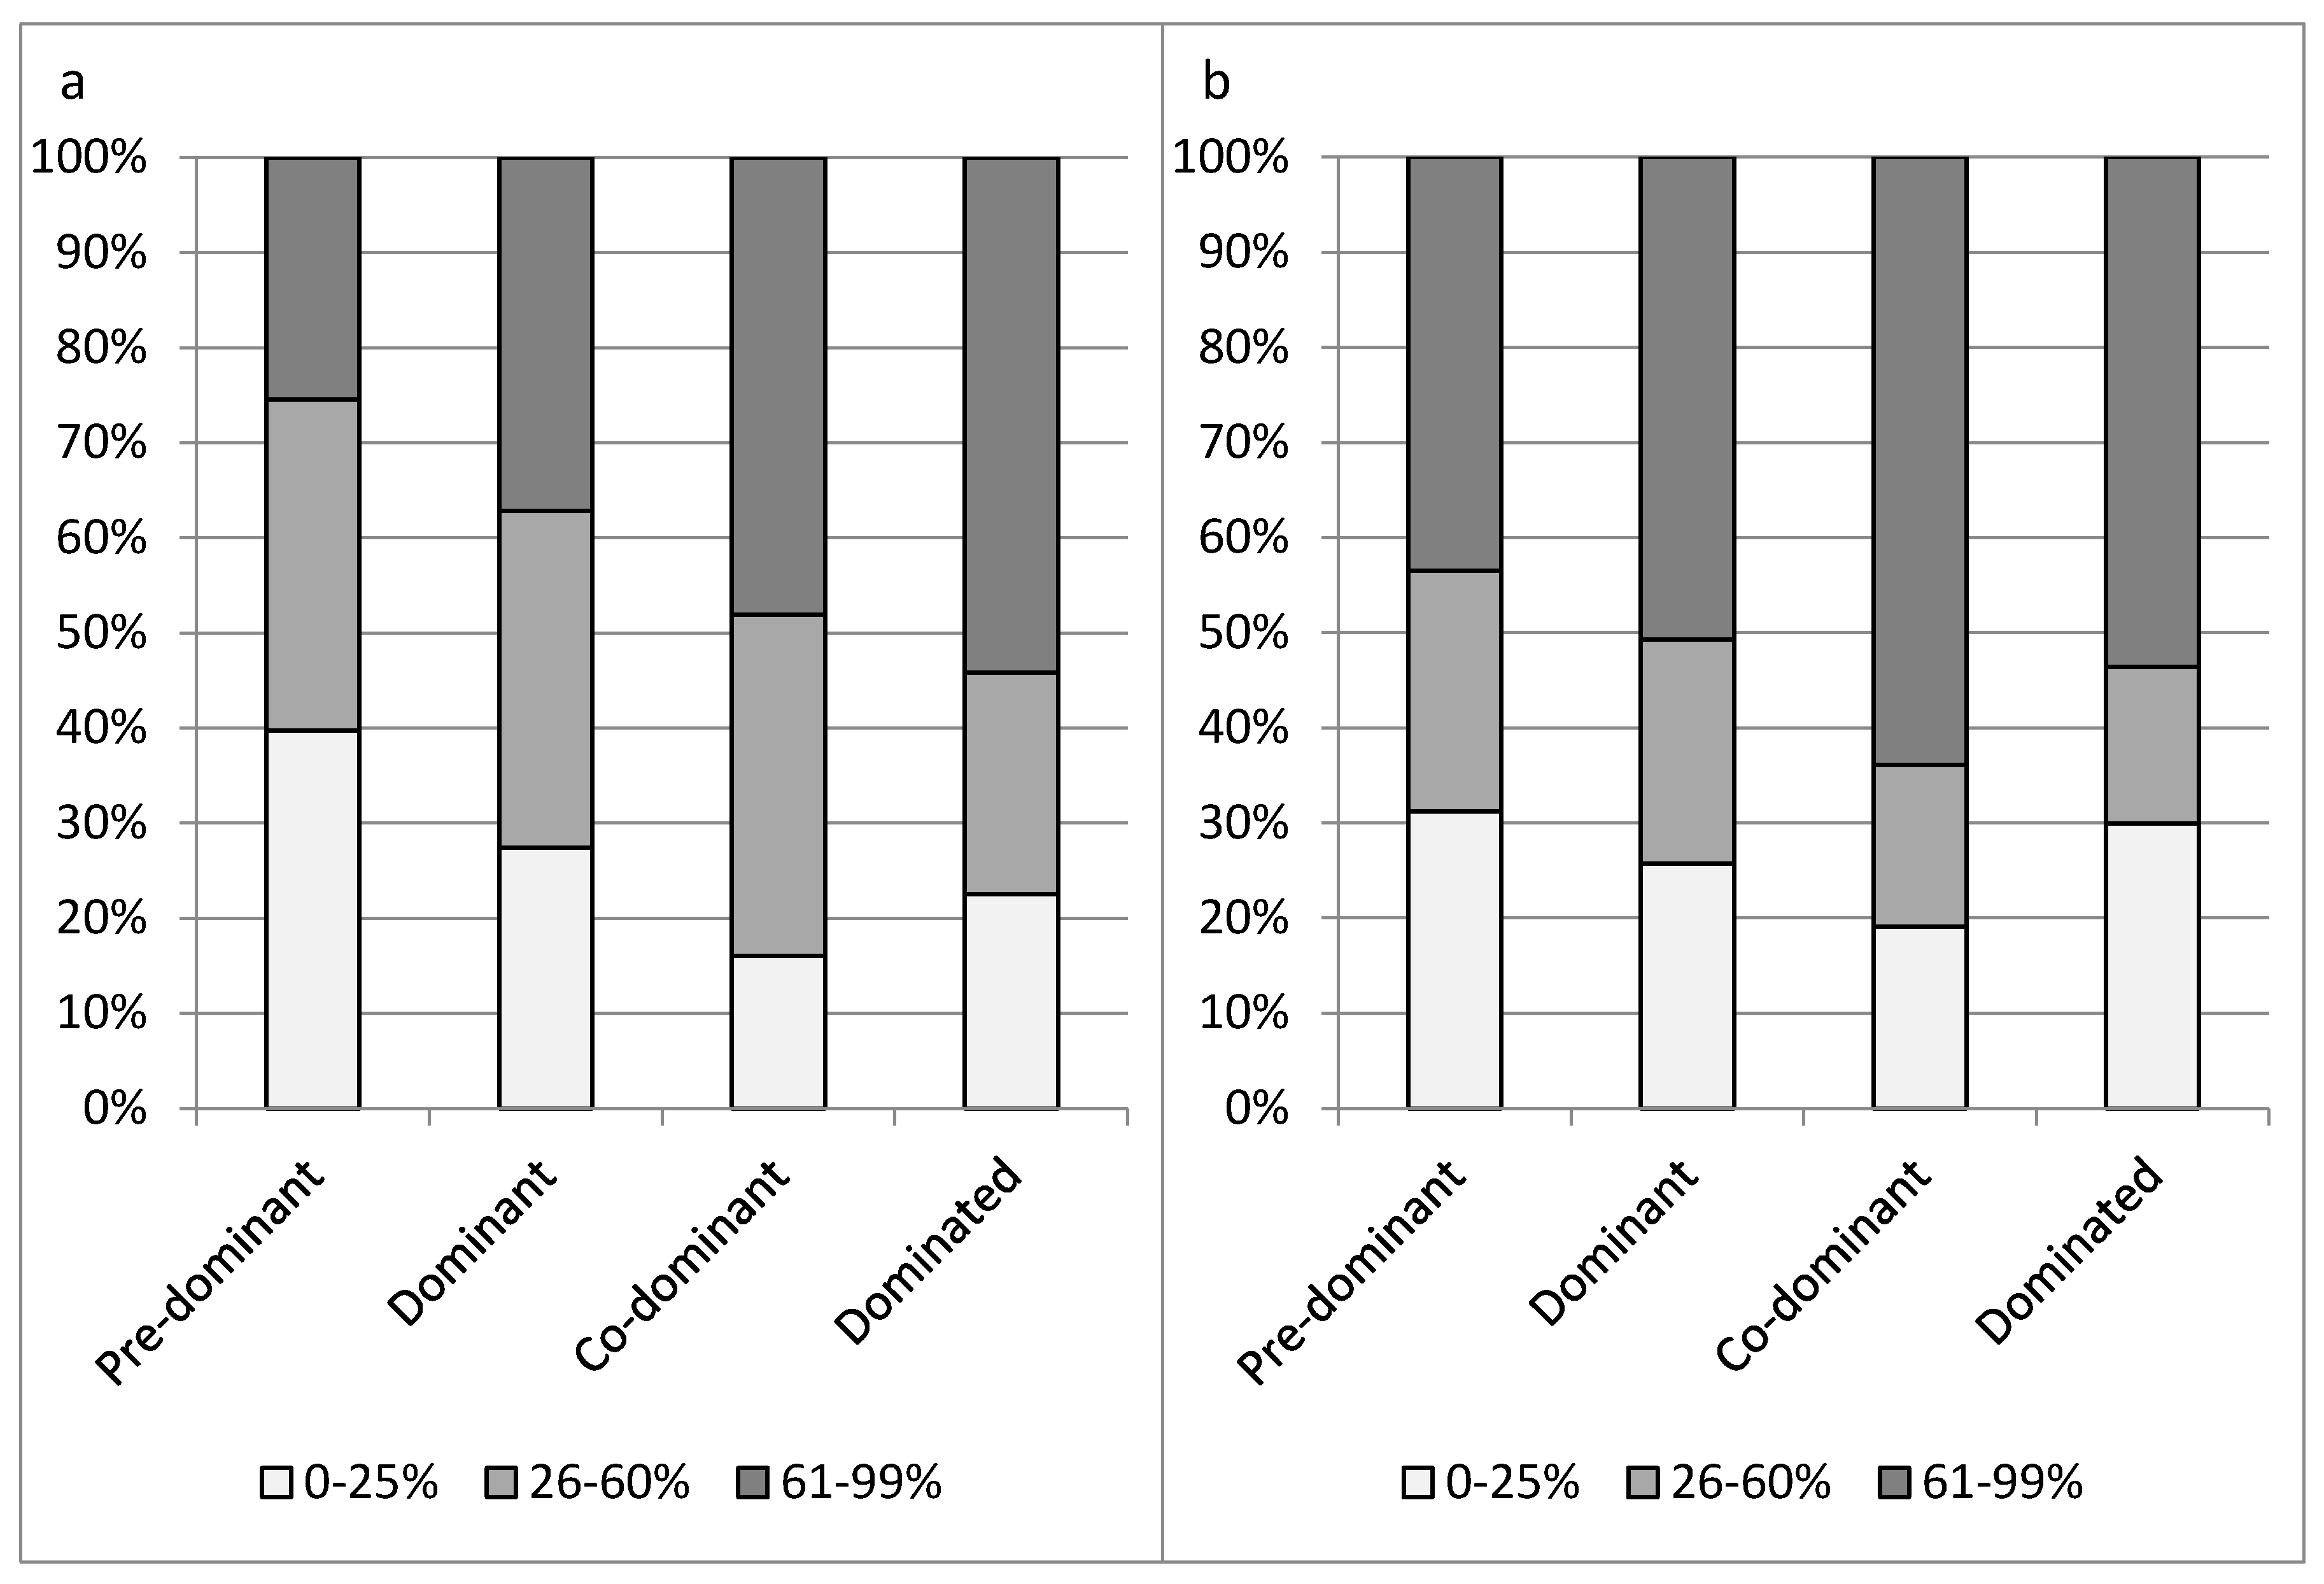
The severity of crown symptoms differed for classes of social status (x2-test, p = 0.002 for crown defoliation and p < 0.001 for portion of epicormic shoots). On average, crown symptoms were less severe in trees of a higher social status. Completely dominated trees, however, were more often healthy than co-dominant trees (Figure 1).
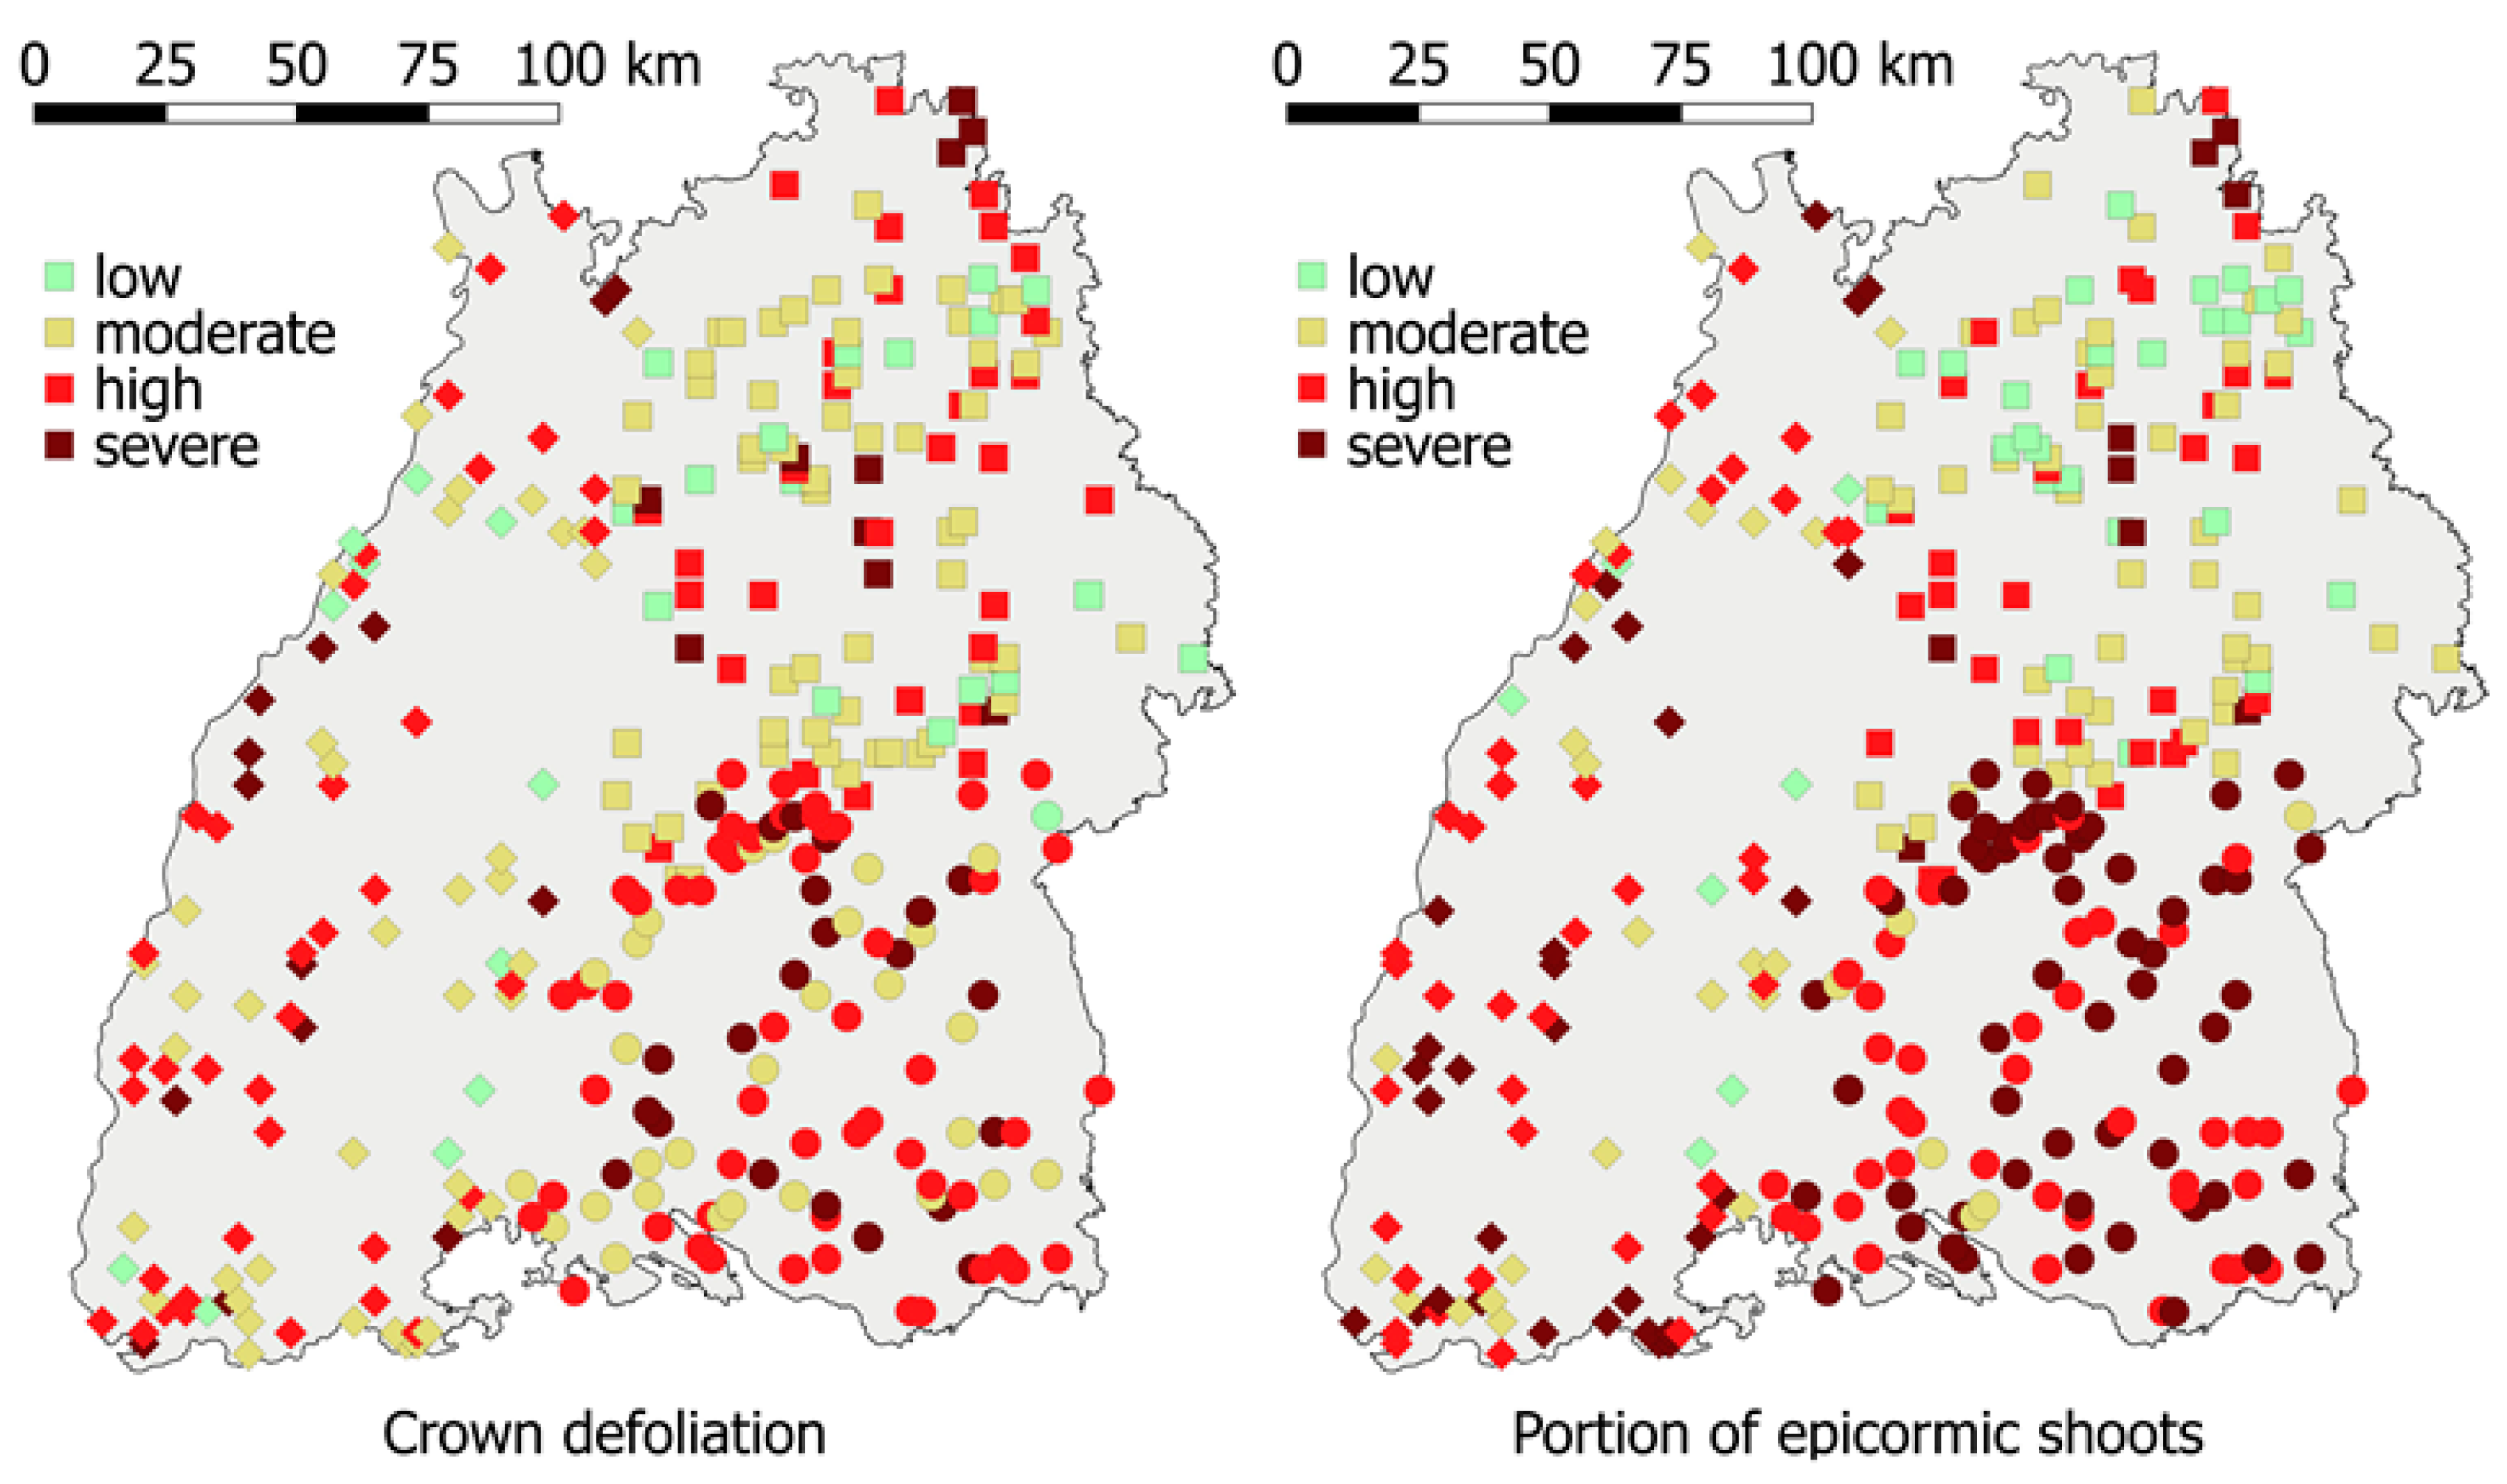
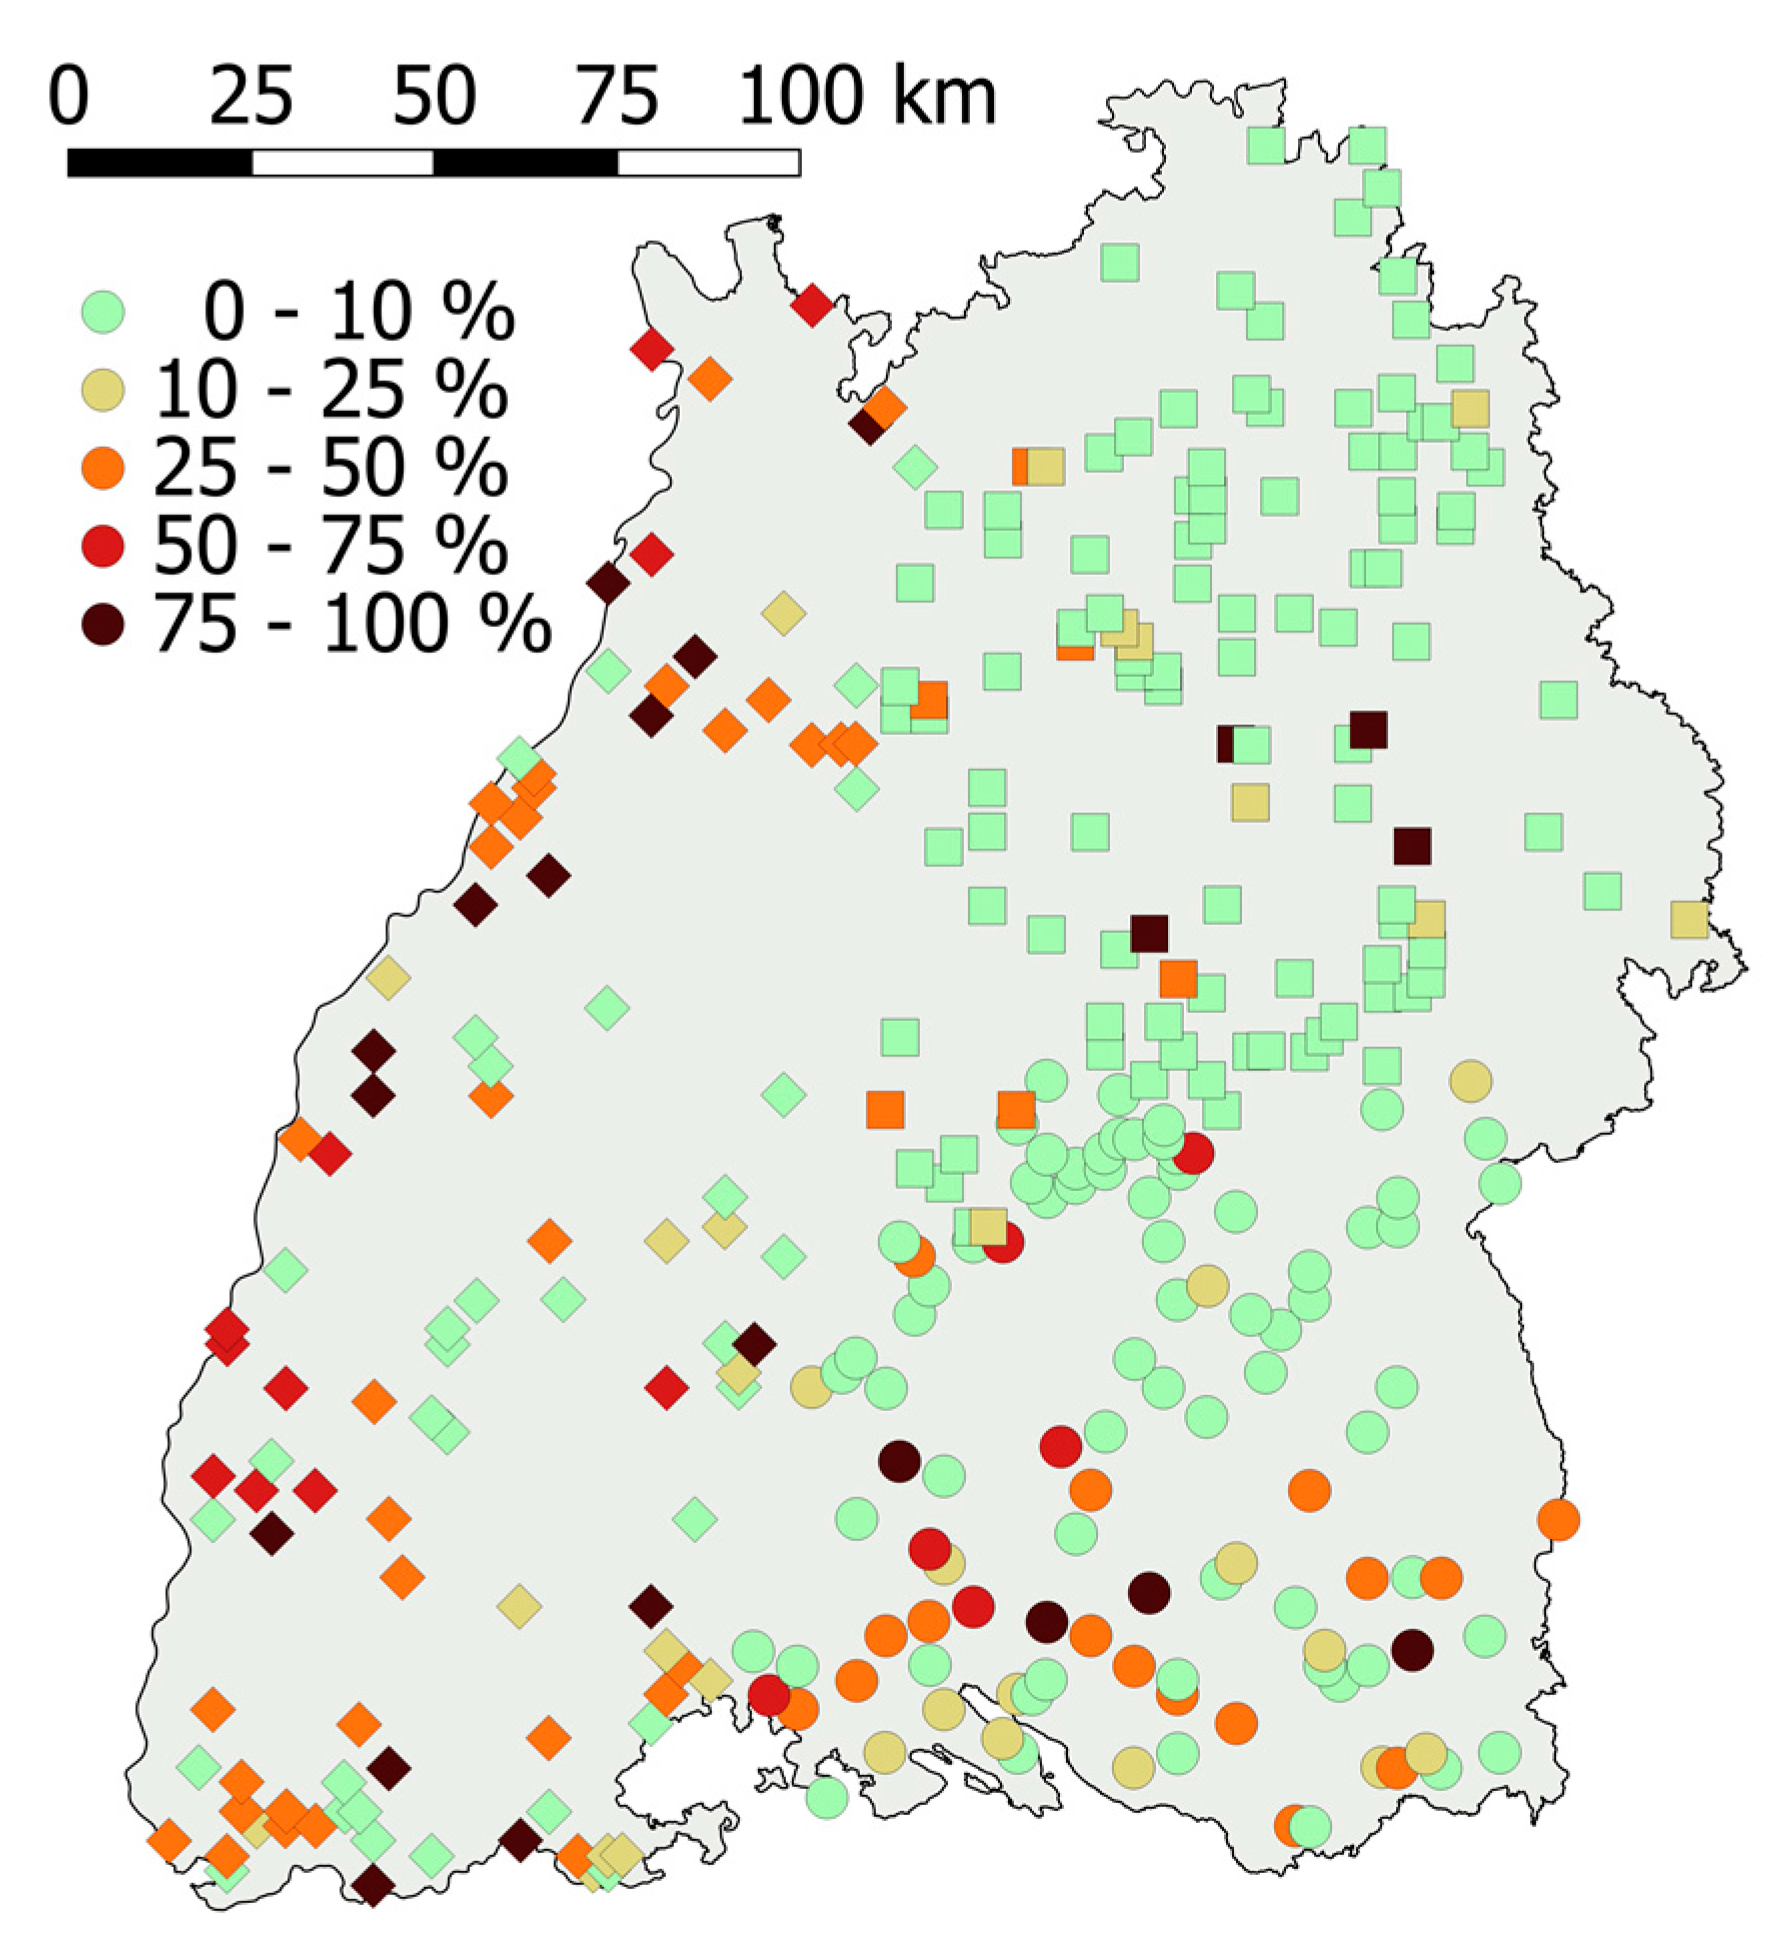
Moreover, there were regional patterns in the severity of crown symptoms. Ash trees that were located in the north-eastern part of the area of investigation were, on average, less defoliated and exhibited fewer epicormic shoots than ash trees at the western border or in the south-eastern part (Figure 2).
3.3.2. Prevalence of Collar Necroses
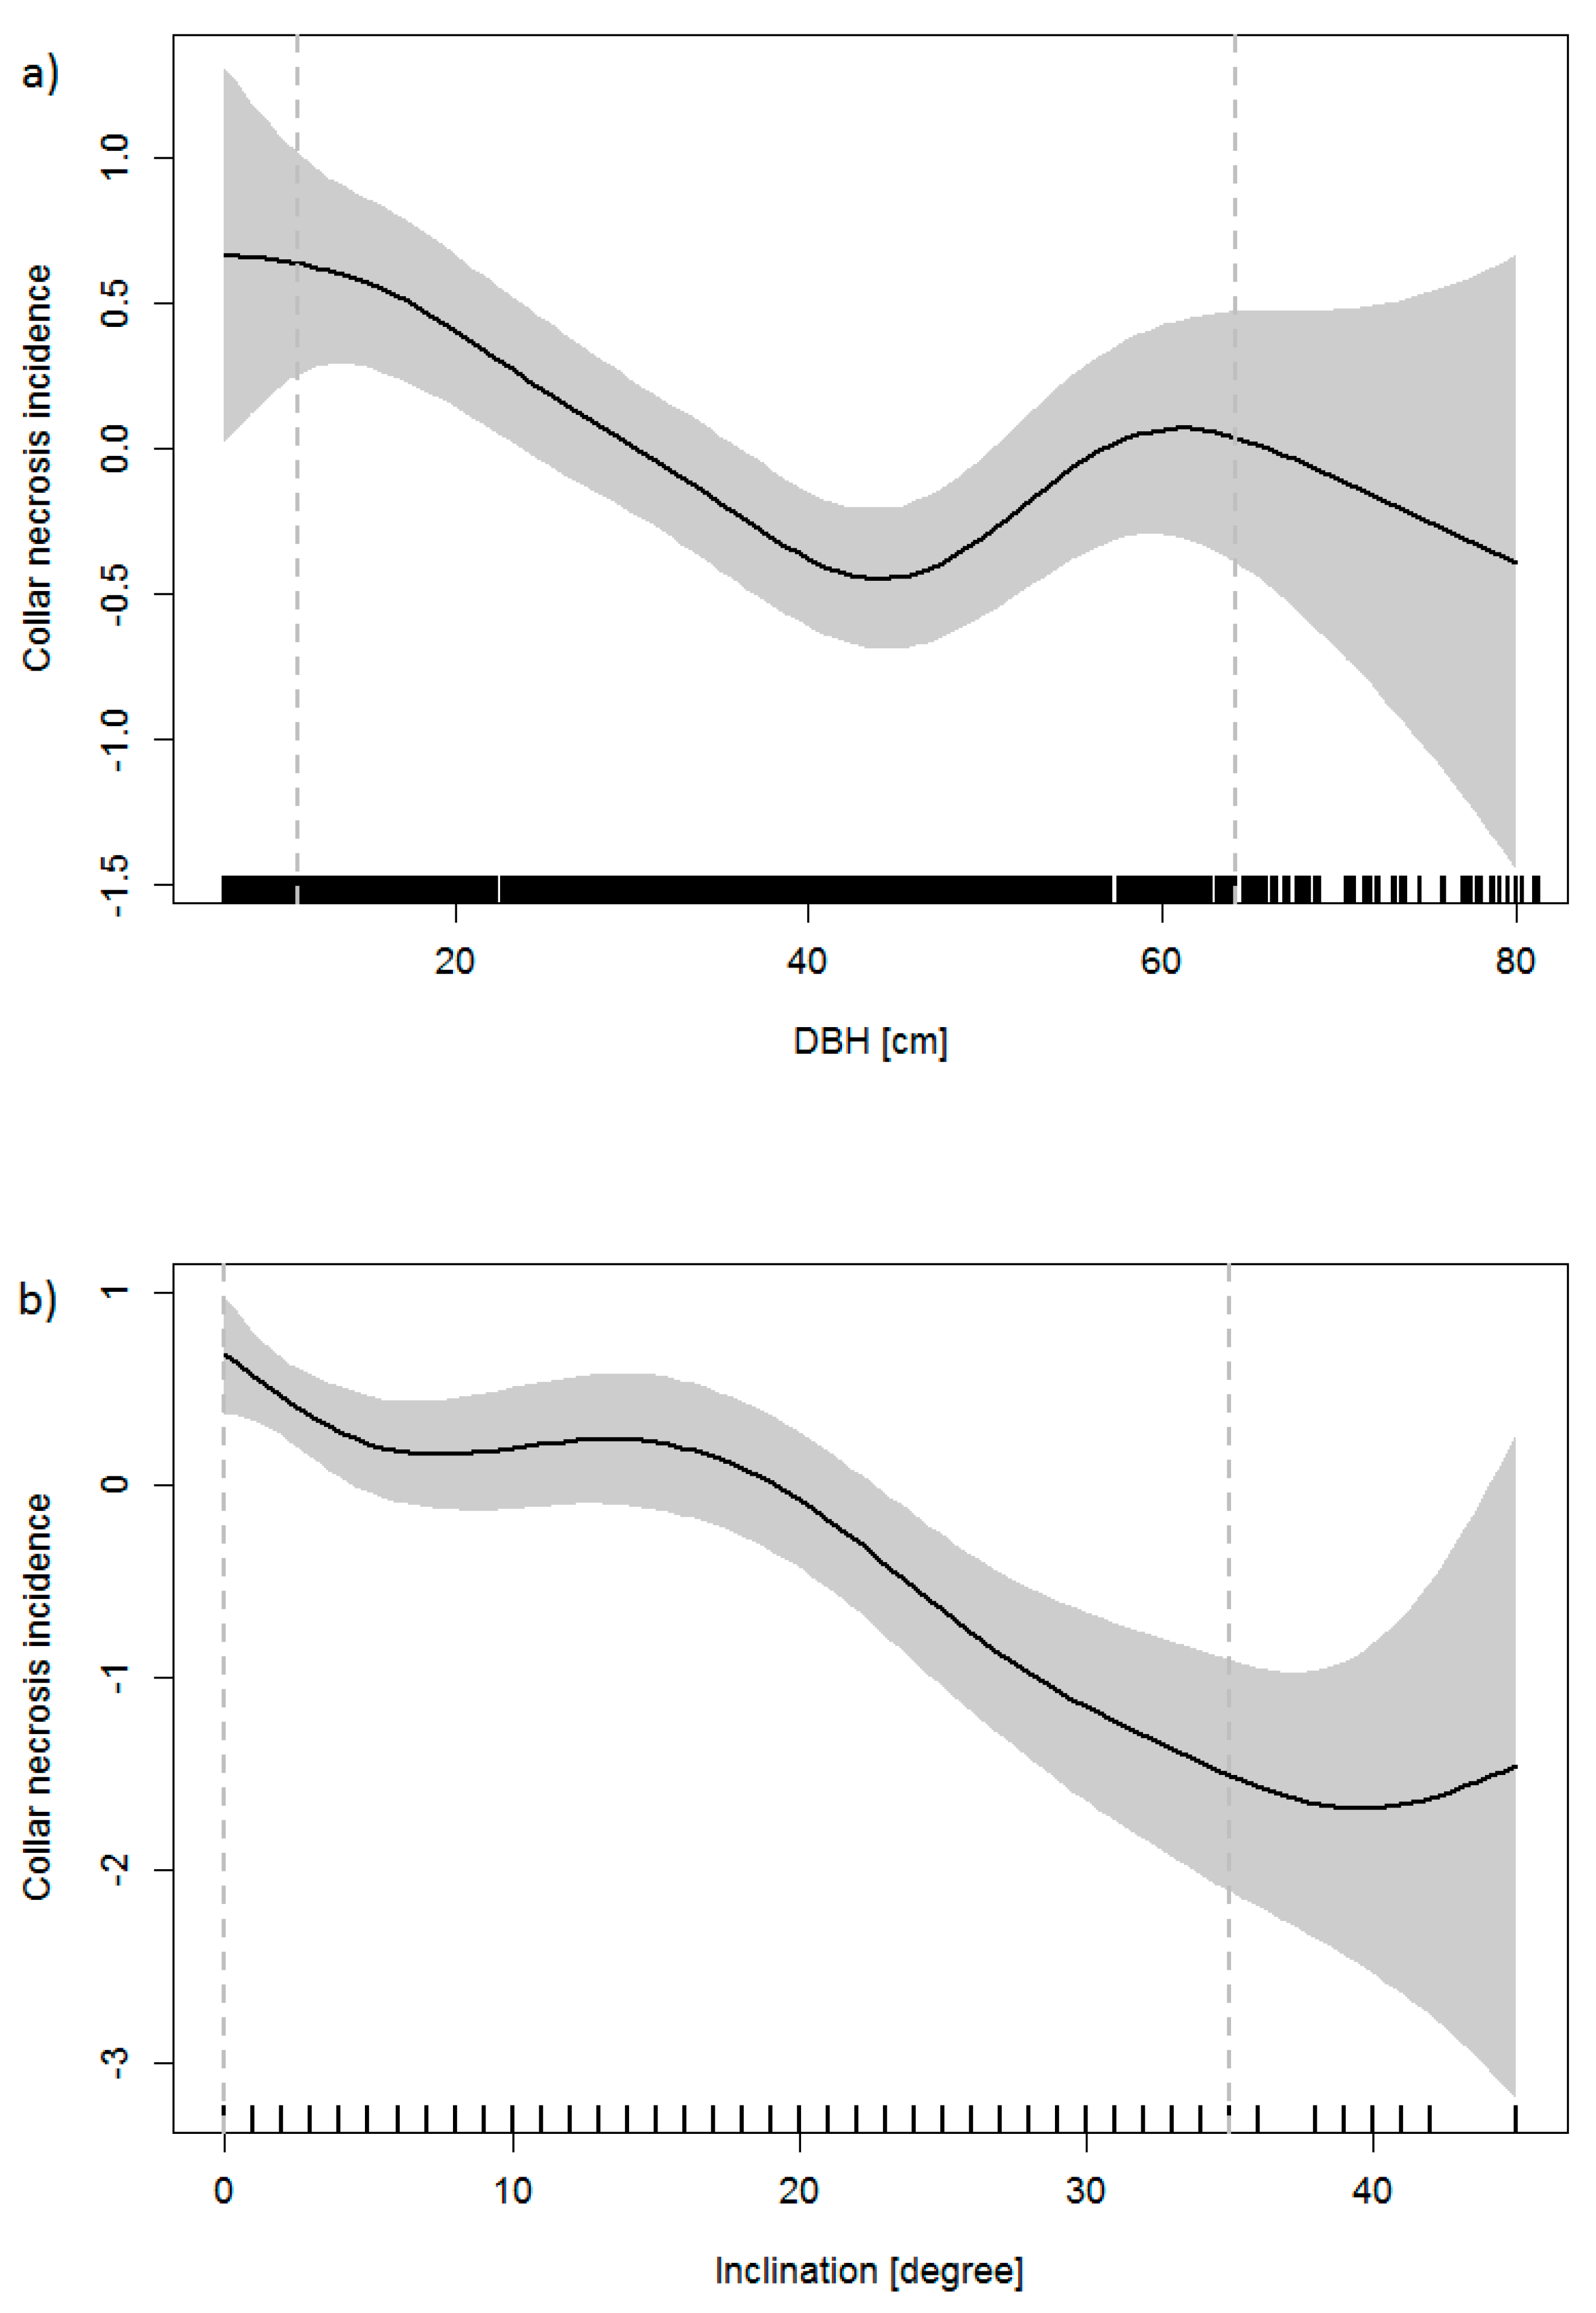
According to the GAM, the presence of collar necroses was significantly connected to the following variables: DBH, inclination of terrain, proportion of ash in the basal area and the highest class of crown defoliation (60–99%), the team that collected the data, and geographic latitude. DBH was negatively connected to the probability of collar necroses, with a minimum at about DBH = 42 cm; for larger trees, the probability of infection increased with DBH (Figure 3a). The probability of collar necroses decreased linearly with increasing inclination (Figure 3b) and with decreasing proportion of ash. The probability of collar necroses increased if trees were defoliated to more than 60%. Climatic variables (mean temperature and mean precipitation from May to September, respectively, number of days with daily maximum of air temperature ≥28 °C and ≥36° C, respectively) were included in the model, but did not prove significant (p-values 0.204, 0.106, 0.182, and 0.117).
The effect of the data collecting team may be of a spatial nature or due to a different assessment by the teams or both. Collar necroses occurred less frequently in plots with a higher geographic latitude and only rarely in the north-eastern part of the area of investigation (Figure 4). A high prevalence of collar necroses was found in the Upper Rhine Valley (along the western border) and the Lake Konstanz region (in the south).
3.4. Tree Growth
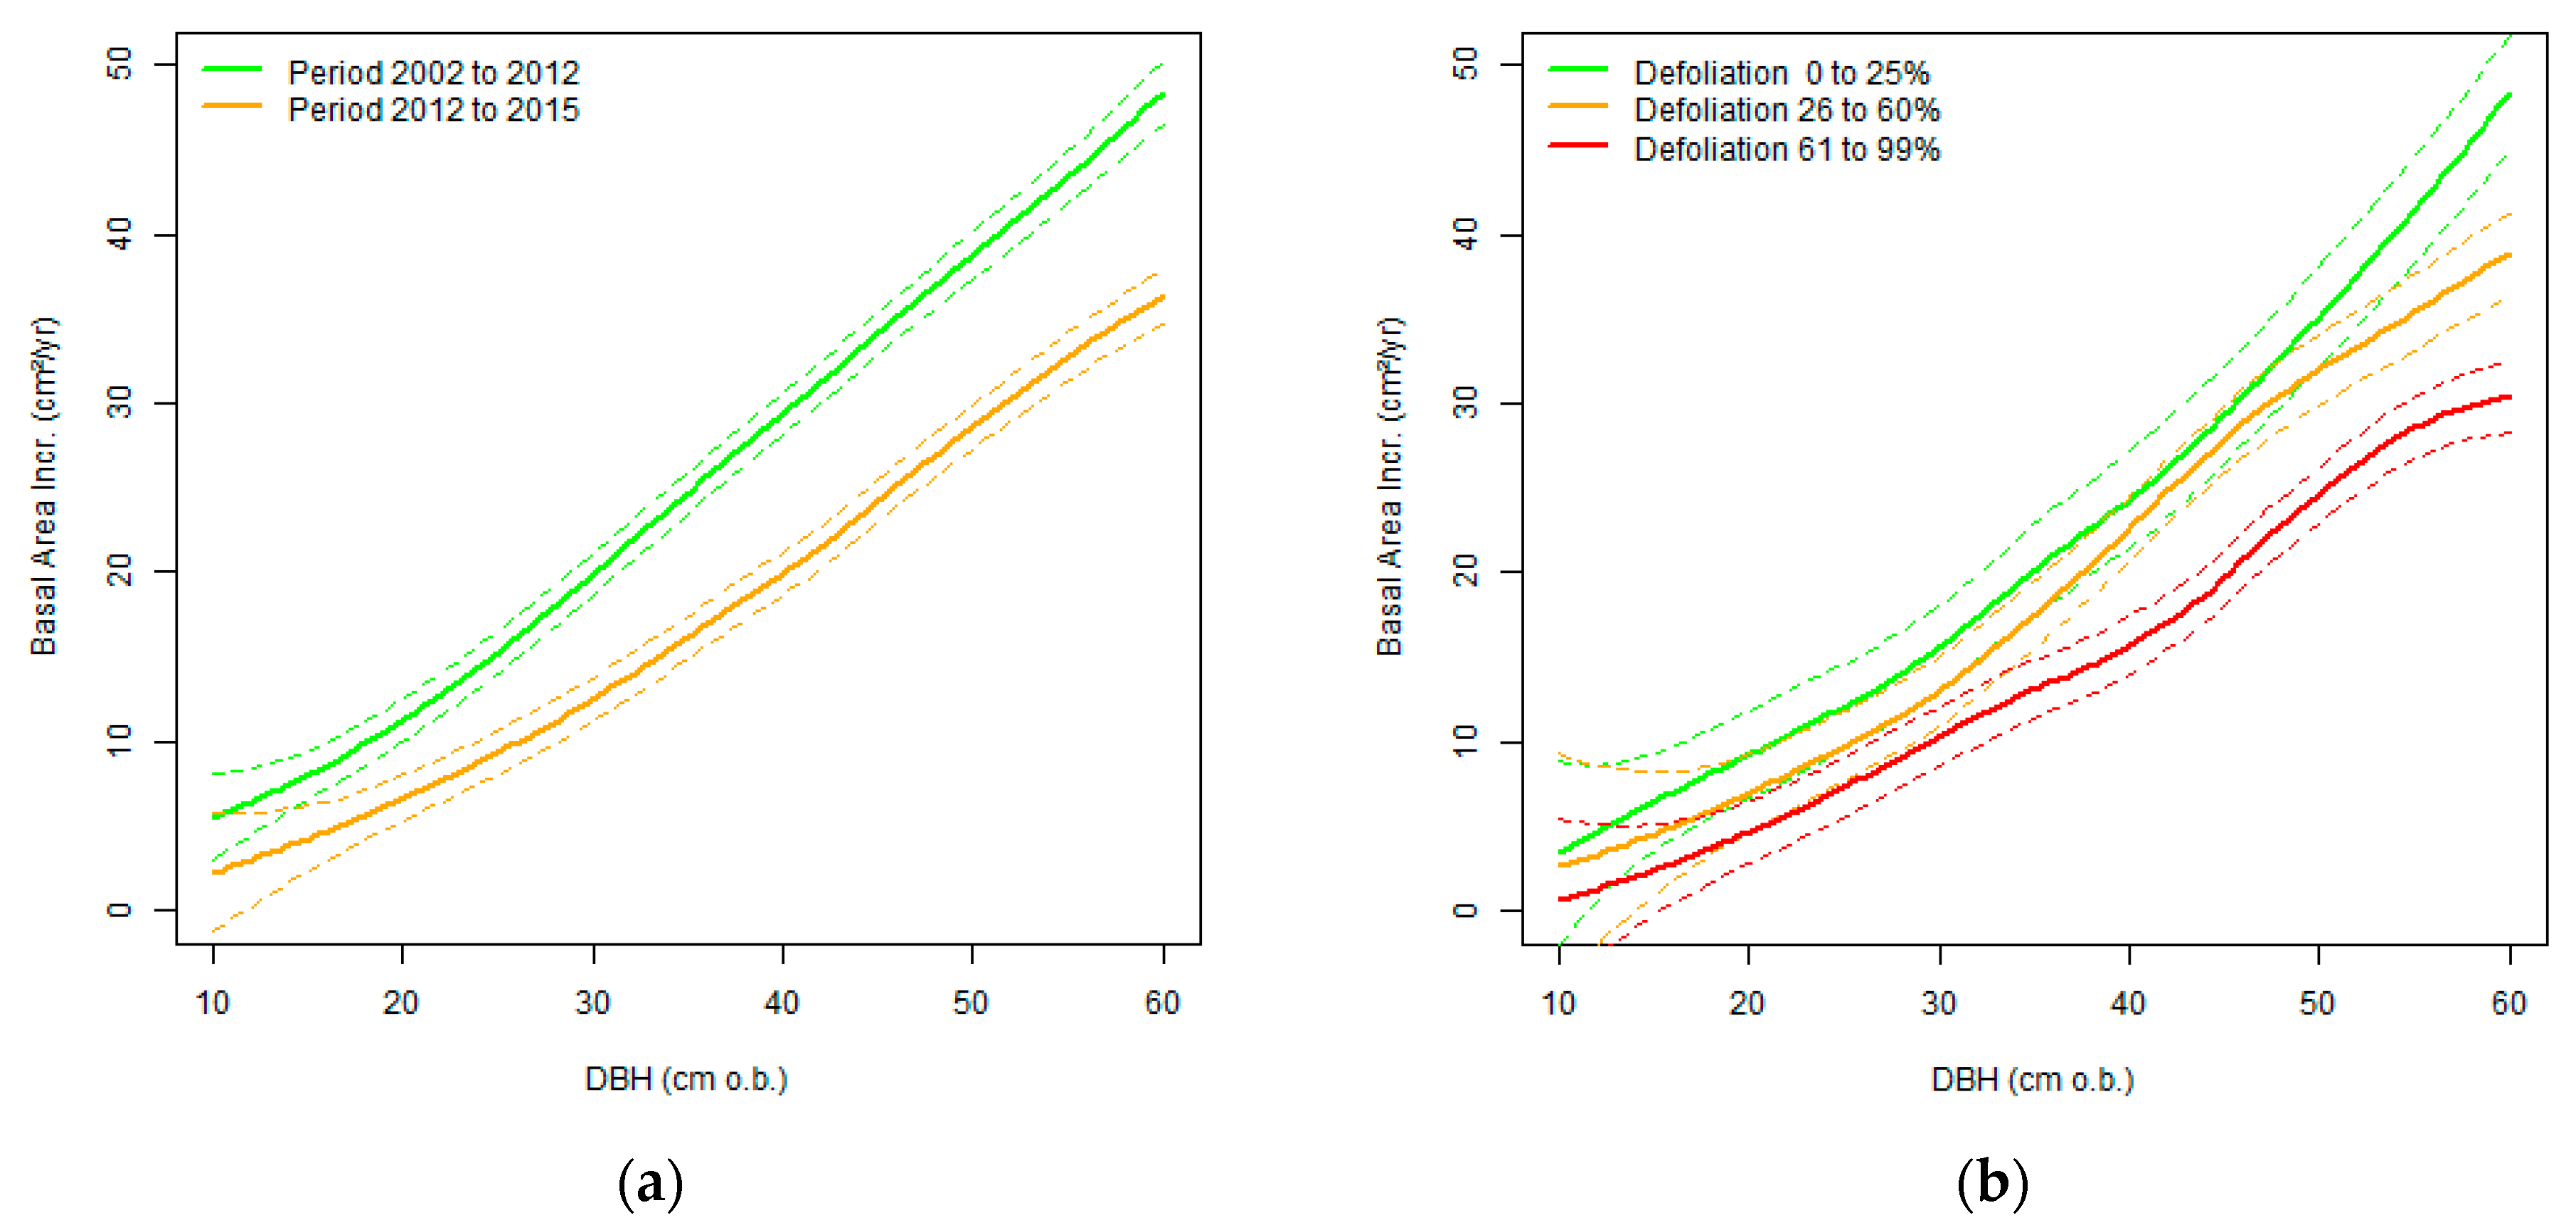
In the period between the last two NFIs (2002 to 2012), the mean DBH increment of ash trees was 4.1 mm a−1 (standard error: 0.07 mm a−1). In the subsequent period (2012 to 2015), the mean DBH increment of ash trees was significantly reduced to 3.0 mm a−1 (standard error: 0.09 mm a−1). Accordingly, there was a decrease in basal area increment, even when only compared to trees of less than 25% crown defoliation (Figure 5). Strongly defoliated trees of larger diameters exhibited the smallest basal area increment.
3.5. Epicormic Shoots at Trunks
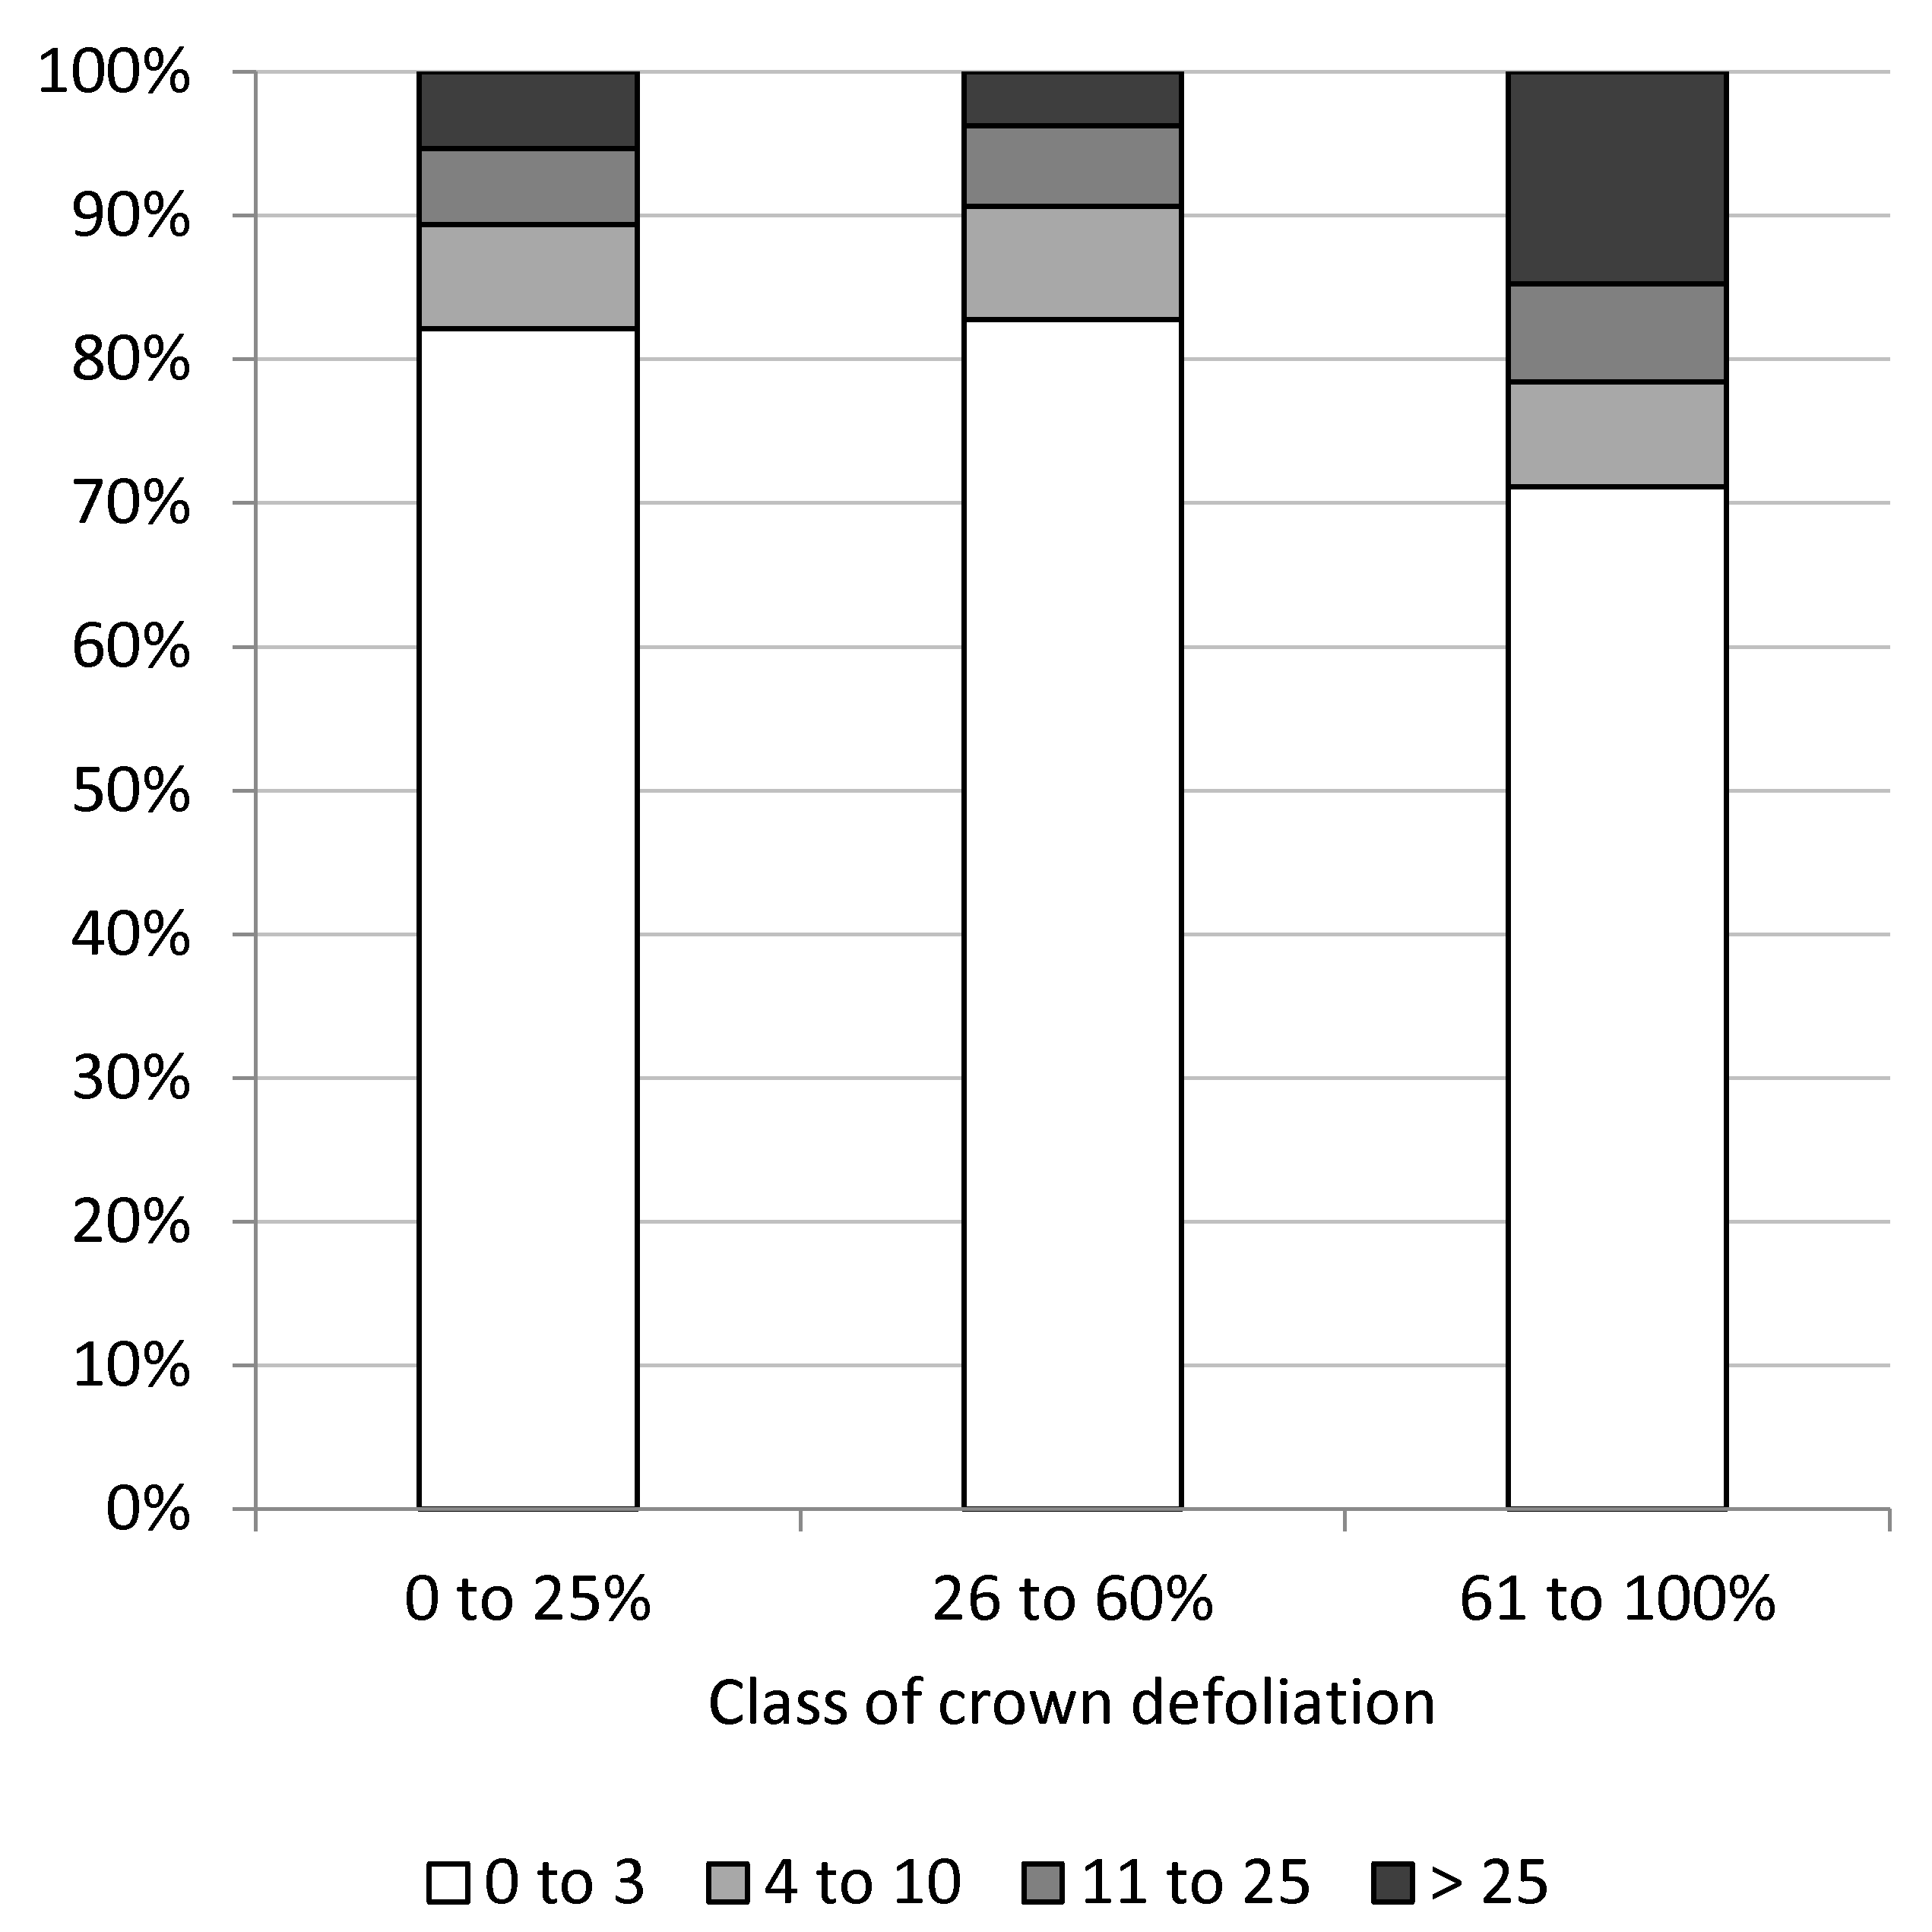
The number of epicormic shoots at trunks differed significantly between classes of crown defoliation (x2-test, p < 0.001), with nearly similar amounts of epicormic shoots on trees with little (0% to 25%) to moderate (26% to 60%) crown defoliation and clearly increased numbers of epicormic shoots on more defoliated trees (Figure 6). More than 25 epicormic shoots occurred on 14.8% of severely defoliated trees, whereas less than four epicormic shoots were counted on 71.1% of these trees.
3.6. Regeneration (DBH (Diameter at Breast Height) < 7 cm)
From the inventory data set of 2012, the number of living ash trees in Baden-Württemberg that were taller than 50 cm and smaller in DBH than 7 cm was estimated to be 965.8 ha−1. In 2015, a total of 698 ash individuals were present in the sample plots, which corresponds to 652.9 trees ha−1 and to a reduction of 32.0% (Table 2). Although the health status differed considerably for trees of different sizes, the proportionate loss in number of trees was similar in the two classes of tree size. Trees of a smaller size were clearly less likely to be infected than trees taller than 130 cm.
4. Discussion
The comprehensive survey of ash dieback symptoms on sample points of the NFI revealed representative data of the health condition of ash trees for a large area in Germany. The comparison of these data with data of the recent NFI in 2012 allowed gaining insights into the development of the disease. The results can serve as a basis for assessments of future mortality, economic losses, and changes of ecosystems, and may be helpful for decision-making in policy and forest management.
Almost half of the ash trees in the area of investigation were defoliated to more than 60% (Table 1). Valuable timber of such trees should be harvested soon, as the risk for a deterioration of wood quality increases drastically when crown defoliation exceeds 70% [5]. This is partly due to epicormic shoots, which occur more often on trunks of defoliated trees (cf. Figure 6) and which can be an entry point for H. fraxineus to the stem. Moreover, the tree growth of extensively defoliated trees is not satisfactory (cf. Figure 5). Small annual rings form wood of a low quality in ash, as it is a ring-porous tree species. We assume that the vast majority of the trees with more than 60% crown defoliation will die within the next decade, if they are not harvested. According to the presented data, this corresponds to about 7,000,000 m3 timber in Baden-Württemberg. The crowns of an even higher proportion of trees mainly consisted of epicormic shoots. This is an indication for high individual susceptibility [14]. Even if these trees were able to maintain much foliage, it is unlikely that they can withstand permanent debilitation by the disease in the long-term. Additionally, trees that are affected by collar necroses are at high risk and likely to die within several years [21].
Trees of intermediate crown defoliation or portion of epicormic shoots may either die or survive, but certainly will suffer from the disease and be in poor condition. We consider such trees as not suitable for economic timber production, but they may provide important ecological services for a longer time. On the other hand, the fraction of trees in sound condition (i.e., no or little crown defoliation, no or little portion of epicormic shoots and no collar necrosis) may still be suitable for economic timber production. Their good health condition may partly be due to disease escape or other factors, but we assume that most of these trees exhibit strong genetic resistance against the disease. Thus, although probably suitable for economic timber production, these trees should not be harvested, but be retained as a genetic base for future ash generations [5]. Still, it is possible that many of these trees will become infected at the root collar, but there is an indication that new collar infections will occur less frequently in the future [21].
The condition of ash regeneration was worse than in Latvia, where 75% of regeneration trees were found to be healthy [35] despite a longer disease history. This discrepancy may be due to already commenced processes of evolutionary adaption of ash in Latvia, where small trees that died early in the epidemic possibly were not found anymore. On the other hand, the health condition of ash regeneration was much better than in three experimental plots in Germany, which mainly consisted of regeneration that emerged before the outbreak of ash dieback [36]. As in Latvia [35], smaller regeneration trees were much healthier than taller trees. The remarkable decrease (32%) in abundance of young ash trees is alarming. A probable driver of this loss is not only the mortality of young saplings, but also a reduction of ash propagules as a result of mature tree mortality and increased harvest. This emphasises the importance of resistant individuals as seed trees and the need to retain such trees in the forests.
Overall, trees of a higher social status were in a better health condition, although the fraction of trees with little to no crown damage was the largest for dominated trees. This is contrary to observations in northern Italy, where ash dieback is still in a relatively early epidemical stage and where dominated trees were in the poorest condition [37]. We assume that the disease-induced decline occurs faster in dominated trees and many of these individuals already died, which may have led to the higher proportion of rather healthy or resistant individuals among the remaining population in this stratum.
The data indicate considerable spatial differences in the degree of tree damage. Trees were most healthy in the north-eastern part of the area of investigation. Here, ash trees occur frequently on dry, heavy, and clay-rich soils, whereas typical sites of ash stands in the other parts of the area of investigation are either floodplains or water influenced (e.g., Rhine valley or Lake Konstanz region) or calcareous but shallow soils with a lower content of clay (i.e., Swabian Alb). The tested climatic factors, however, did not have a significant influence in this study, although the fungus is considered to be sensitive to high temperature [4,31] and a positive effect of mean temperature on the degree of tree damage was reported from the Czech Republic [24]. However, the regionalised weather data that were available for our study hardly represent the variety of local micro climatic conditions and were only tested for collar necrosis prevalence, not for crown symptoms. The spatial differences may also be due to the different data collecting teams. Unfortunately, it is not possible to separate the possible influences of geographic location and of the data collecting teams from each other. However, we spent much effort in the minimisation of the team effect to ensure comparability of the data (see Section 2.2). Thus, we assume that the effect of different data collecting teams was small and on its own cannot explain the considerable spatial differences.
The prevalence of collar necroses was also connected to some other factors. Overall, collar necroses occurred more often on trees with smaller DBH (Figure 3a), which have thinner bark and thus may be infected more easily. However, the increase of the probability of collar necroses for trees that exhibit diameters larger than 42 cm is difficult to explain. For the larger trees, the effect of DBH may be masked by interdependencies with geographic location and necrosis prevalence. One may also speculate that the effect is connected to the transition from smooth to rough bark. Moreover, we cannot rule out the possibility of a bias that is due to the easier recognition of necroses on smaller trees with smooth bark.
The inclination of terrain can be an indicator for the water regime. On average, planar terrain is more humid than steep ground, as water takes much more time to drain off. Thus, the higher collar necroses prevalence at more planar sites is in agreement with other studies that indicated increased risks of collar necroses on wet or humid sites or sites that are periodically flooded [15,16,18,19]. Moreover, the prevalence was highest in the Upper Rhine Valley and Lake Konstanz region, where ash usually grows on humid or wet sites. Collar necroses occurred more frequently in plots with a higher proportion of ash on the total basal area of all tree species, which is related to increased amounts of inoculum. Moreover, the probability for root collar infection was significantly greater for heavily defoliated trees, which is in agreement with other studies that demonstrated a relationship between collar necroses prevalence and crown symptoms [15,16].
5. Conclusions
This study depicts the immense implications of ash dieback in a large area of central Europe. It can be assumed that about 7,000,000 m3 of timber will very likely die in the near future. Only 13.8% of the ash trees, which correspond to only 6.8% of the ash timber volume, were found in sound condition. Salvage cuttings and mortality exceeded ash tree recruitment by far. The number of regeneration trees decreased drastically by almost one third within three years. However, the remaining regeneration was relatively healthy. There were clear regional patterns in the severity of the disease and the results indicate that trees on water influenced sites are more at risk. The probability of wood quality deterioration due to the formation of epicormic shoots at trunks increases significantly when defoliation exceeds 60%.
Acknowledgments
The authors would like to thank the data collecting teams for their good cooperation. We acknowledge the support in data management by Jürgen Kayser and would like to thank Thilo Wolf, who kindly provided climate data for the sample points. The study was funded by ForstBW. We are grateful to Forests for publishing this article with open access and free of charge as a reward for outstanding presentations of early-stage researchers at the Forstwissenschaftliche Tagung 2016 in Freiburg, Germany.
Author Contributions
G.K., B.M., and R.E. conceived and designed the study. U.R. and R.E. were responsible for data collection and data quality verification. G.K. analyzed the data. R.E. wrote the paper.
Conflicts of Interest
The authors declare no conflict of interest.
References
- Gross, A.; Holdenrieder, O.; Pautasso, M.; Queloz, V.; Sieber, T.N. Hymenoscyphus pseudoalbidus, the causal agent of European ash dieback. Mol. Plant Pathol. 2014, 15, 5–21. [Google Scholar] [CrossRef] [PubMed]
- Drenkhan, R.; Sander, H.; Hanso, M. Introduction of Mandshurian ash (Fraxinus mandshurica Rupr.) to Estonia: Is it related to the current epidemic on European ash (F. excelsior L.)? Eur. J. For. Res. 2014, 133, 769–781. [Google Scholar] [CrossRef]
- Timmermann, V.; Børja, I.; Hietala, A.M.; Kirisits, T.; Solheim, H. Ash dieback: Pathogen spread and diurnal patterns of ascospore dispersal, with special emphasis on Norway. EPPO Bull. 2011, 41, 14–20. [Google Scholar] [CrossRef]
- Dal Maso, E. Risk of natural spread of Hymenoscyphus fraxineus with environmental niche modelling and ensemble forecasting technique. For. Res 2014, 3. [Google Scholar] [CrossRef]
- Skovsgaard, J.P.; Wilhelm, G.J.; Thomsen, I.M.; Metzler, B.; Kirisits, T.; Havrdová, L.; Enderle, R.; Dobrowolska, D.; Cleary, M.; Clark, J. Silvicultural strategies for Fraxinus excelsior in response to dieback caused by Hymenoscyphus fraxineus. Forestry 2017, 90, 455–472. [Google Scholar] [CrossRef]
- Hemery, G.E. Forest management and silvicultural responses to projected climate change impacts on European broadleaved trees and forests. Int. For. Rev. 2008, 10, 591–607. [Google Scholar] [CrossRef]
- Dobrowolska, D.; Hein, S.; Oosterbaan, A.; Wagner, S.; Clark, J.; Skovsgaard, J.P. A review of European ash (Fraxinus excelsior L.): Implications for silviculture. Forestry 2011, 84, 133–148. [Google Scholar] [CrossRef]
- Pautasso, M.; Aas, G.; Queloz, V.; Holdenrieder, O. European ash (Fraxinus excelsior) dieback—A conservation biology challenge. Biol. Conserv. 2013, 158, 37–49. [Google Scholar] [CrossRef]
- Mitchell, R.J.; Beaton, J.K.; Bellamy, P.E.; Broome, A.; Chetcuti, J.; Eaton, S.; Ellis, C.J.; Gimona, A.; Harmer, R.; Hester, A.J.; et al. Ash dieback in the UK: A review of the ecological and conservation implications and potential management options. Biol. Conserv. 2014, 175, 95–109. [Google Scholar] [CrossRef]
- Mitchell, R.J.; Hewison, R.L.; Hester, A.J.; Broome, A.; Kirby, K.J. Potential impacts of the loss of Fraxinus excelsior (Oleaceae) due to ash dieback on woodland vegetation in Great Britain. New J. Bot. 2016, 6, 2–15. [Google Scholar] [CrossRef]
- Cleary, M.R.; Daniel, G.; Stenlid, J. Light and scanning electron microscopy studies of the early infection stages of Hymenoscyphus pseudoalbidus on Fraxinus excelsior. Plant Pathol. 2013, 62, 1294–1301. [Google Scholar] [CrossRef]
- Schumacher, J. The general situation regarding ash dieback in Germany and investigations concerning the invasion and distribution strategies of Chalara fraxinea in woody tissue. EPPO Bull. 2011, 41, 7–10. [Google Scholar] [CrossRef]
- Haňáčková, Z.; Koukol, O.; Čmoková, A.; Zahradník, D.; Havrdová, L.; Cleary, M. Direct evidence of Hymenoscyphus fraxineus infection pathway through the petiole-shoot junction. For. Path. 2017, 7, e12370. [Google Scholar] [CrossRef]
- Enderle, R.; Nakou, A.; Thomas, K.; Metzler, B. Susceptibility of autochthonous German Fraxinus excelsior clones to Hymenoscyphus pseudoalbidus is genetically determined. Ann. For. Sci. 2015, 72, 183–193. [Google Scholar] [CrossRef]
- Husson, C.; Caël, O.; Grandjean, J.P.; Nageleisen, L.M.; Marçais, B. Occurrence of Hymenoscyphus pseudoalbidus on infected ash logs. Plant Pathol. 2012, 61, 889–895. [Google Scholar] [CrossRef]
- Enderle, R.; Peters, F.; Nakou, A.; Metzler, B. Temporal development of ash dieback symptoms and spatial distribution of collar rots in a provenance trial of Fraxinus excelsior. Eur. J. For. Res. 2013, 132, 865–876. [Google Scholar] [CrossRef]
- Chandelier, A.; Gerarts, F.; San Martin, G.; Herman, M.; Delahaye, L.; Hantula, J. Temporal evolution of collar lesions associated with ash dieback and the occurrence of Armillaria in Belgian forests. For. Path. 2016, 46, 289–297. [Google Scholar] [CrossRef]
- Muñoz, F.; Marçais, B.; Dufour, J.; Dowkiw, A. Rising out of the ashes: Additive genetic variation for crown and collar resistance to Hymenoscyphus fraxineus in Fraxinus excelsior. Phytopathology 2016, 106, 1535–1543. [Google Scholar] [CrossRef] [PubMed]
- Marçais, B.; Husson, C.; Godart, L.; Caël, O. Influence of site and stand factors on Hymenoscyphus fraxineus -induced basal lesions. Plant Pathol. 2016, 65, 1452–1461. [Google Scholar] [CrossRef]
- Langer, G. Collar rots in forests of Northwest Germany affected by ash dieback. Balt. For. 2017, 23, 4–19. [Google Scholar]
- Enderle, R.; Sander, F.; Metzler, B. Temporal development of collar necroses and butt rot in association with ash dieback. iForest 2017, 10, 529–536. [Google Scholar] [CrossRef]
- Metzler, B.; Baumann, M.; Baier, U.; Heydeck, P.; Bressem, U.; Lenz, H.D. Bundesweite Zusammenstellung: Handlungsempfehlungen beim Eschentriebsterben. AFZ-Der Wald 2013, 68, 17–20. [Google Scholar]
- McKinney, L.V.; Nielsen, L.R.; Collinge, D.B.; Thomsen, I.M.; Hansen, J.K.; Kjær, E.D. The ash dieback crisis: Genetic variation in resistance can prove a long-term solution. Plant Pathol. 2014, 63, 485–499. [Google Scholar] [CrossRef]
- Havrdová, L.; Zahradník, D.; Romportl, D.; Pešková, V.; Černý, K. Environmental and silvicultural characteristics influencing the extent of ash dieback in forest stands. Balt. For. 2017, 23, 168–182. [Google Scholar]
- Enderle, R.; Fussi, B.; Lenz, H.D.; Langer, G.; Nagel, R.; Metzler, B. Ash dieback in Germany: Research on disease development, resistance and management options. In Dieback of European Ash (Fraxinus spp.)—Consequences and Guidelines for Sustainable Management; Vasaitis, R., Enderle, R., Eds.; Swedish University of Agricultural Sciences: Uppsala, Sweden, 2017; pp. 89–105. [Google Scholar]
- Enderle, R.; Kändler, K.; Metzler, B. Eschentriebsterben. In Waldzustandsbericht 2015 für Baden-Württemberg; Forstliche Versuchs- und Forschungsantstalt Baden-Württemberg, Ed.; Forstliche Versuchs- und Forschungsantstalt Baden-Württemberg: Freiburg, Germany, 2015; pp. 46–54. [Google Scholar]
- Kändler, G. The design of the second German national forest inventory. In Proceedings of the Eighth Annual Forest Inventory and Analysis Symposium, Monterey, CA, USA, 16–19 October 2006; McRoberts, R.E., Reams, G.A., van Deusen, P.C., McWilliams, W.H., Eds.; U.S. Department of Agriculture: Washington, DC, USA, 2008; pp. 19–24. [Google Scholar]
- Kraft, G. Beiträge zur Lehre von den Durchforstungen, Schlagstellungen und Lichtungshieben; Klindworth: Hannover, Germany, 1884. [Google Scholar]
- R Core Team. R: A Language and Environment for Statistical Computing; R Foundation for Statistical Computing: Vienna, Austria, 2013. [Google Scholar]
- Cochran, W.G. Sampling Techniques, 3rd ed.; Wiley: New York, NY, USA, 2005. [Google Scholar]
- Hauptman, T.; Piškur, B.; Groot, M.; de Ogris, N.; Ferlan, M.; Jurc, D. Temperature effect on Chalara fraxinea: Heat treatment of saplings as a possible disease control method. For. Path. 2013, 58, 360–370. [Google Scholar] [CrossRef]
- Nothdurft, A.; Wolf, T.; Ringeler, A.; Böhner, J.; Saborowski, J. Spatio-temporal prediction of site index based on forest inventories and climate change scenarios. For. Ecol. Manag. 2012, 279, 97–111. [Google Scholar] [CrossRef]
- Dietrich, H.; Wolf, T.; Kawohl, T.; Wehberg, J.; Kändler, G.; Mette, T.; Röder, A.; Böhner, J. Temporal and spatial high-resolution climate data from 1961–2100 for the German National Forest Inventory (NFI). Ann. For. Sci. Under review.
- Wood, S. Generalized Additive Models: An Introduction with R; CRC Press: Hoboken, NY, USA, 2006. [Google Scholar]
- Pušpure, I.; Matisons, R.; Laiviņš, M.; Gaitnieks, T.; Jansons, J. Natural regeneration of common ash in young stands in Latvia. Balt. For. 2017, 23, 209–217. [Google Scholar]
- Enderle, R.; Bußkamp, J.; Metzler, B. Growth performance of dense natural regeneration of Fraxinus excelsior under attack of the ash dieback agent Hymenoscyphus fraxineus. Balt. For. 2017, 23, 218–228. [Google Scholar]
- Giongo, S.; Oliveira Longa, C.M.; Dal Maso, E.; Montecchio, L.; Maresi, G. Evaluating the impact of Hymenoscyphus fraxineus in Trentino (Alps, Northern Italy): First investigations. iForest 2017, 10, 871–878. [Google Scholar] [CrossRef]
Figure 1.
Proportion of sample ash trees in classes of crown defoliation (a) and portion of epicormic shoots (b). Horizontal axes separate classes of social status.
Figure 1.
Proportion of sample ash trees in classes of crown defoliation (a) and portion of epicormic shoots (b). Horizontal axes separate classes of social status.

Figure 2.
The severity of crown defoliation and the portion of epicormic shoots are presented per tract (classification according to the mean values of sample points: low < 25%; moderate = 25–50%; significant = 50–75% and severe > 75%). Squares, diamonds, and circles represent the three data collecting teams. The grey background shows the area of Baden-Wuerttemberg.

Figure 3.
Centred smoothed effect of (a) DBH and (b) of the inclination of terrain on the incidence of collar necrosis (the contribution made to the fitted value for the smooth function). The grey areas depict 95% confidence intervals (upper and lower margins are added at two standard errors above and below the estimate of the smooth). The frequency of the DBH and inclination, respectively, are shown by a rug plot (spikes at the base); the dashed vertical lines mark the 5%- and 95%-quantiles of the DBH and inclination distribution, respectively.

Figure 4.
The prevalence of collar necroses is presented per tract (classification according to the mean values of sample points). Squares, diamonds, and circles represent the three data collecting teams. The grey background shows the area of Baden-Wuerttemberg.
Figure 4.
The prevalence of collar necroses is presented per tract (classification according to the mean values of sample points). Squares, diamonds, and circles represent the three data collecting teams. The grey background shows the area of Baden-Wuerttemberg.

Figure 5.
Comparison of the mean basal area increment related to DBH at the beginning of the period in the two periods from 2002 to 2012 and 2012 to 2015 (a), and for differently defoliated trees in the time from 2012 to 2015 (b). Dotted lines represent 95% confidence intervals.
Figure 5.
Comparison of the mean basal area increment related to DBH at the beginning of the period in the two periods from 2002 to 2012 and 2012 to 2015 (a), and for differently defoliated trees in the time from 2012 to 2015 (b). Dotted lines represent 95% confidence intervals.

Figure 6.
Percentage of trees in classes of epicormic shoots at trunks as a function of classes of crown defoliation.
Figure 6.
Percentage of trees in classes of epicormic shoots at trunks as a function of classes of crown defoliation.

Table 1.
Estimated percentage values (%) ± standard error of classes of crown defoliation, portion of epicormic shoots, and collar necrosis prevalence in three different reference units: number of trees, occupying area, and volume (standing stock). The estimation is based on 529 sample points in 330 tracts and a total of 1627 ash trees.
| Symptom Severity | Number of Trees (%) | Occupying Area (%) | Volume (%) |
|---|---|---|---|
| Crown defoliation | |||
| 0–25% | 26.6 ± 2.7 | 21.6 ± 1.7 | 17.2 ± 1.3 |
| 26–60% | 34.0 ± 2.5 | 42.4 ± 1.6 | 44.3 ± 1.6 |
| 61–99% | 39.3 ± 3.0 | 36.0 ± 2.0 | 38.6 ± 2.0 |
| Portion of epicormic shoots | |||
| 0–25% | 25.2 ± 3.1 | 16.3 ± 1.7 | 12.9 ± 1.4 |
| 26–60% | 20.6 ± 1.9 | 23.9 ± 1.5 | 24.1 ± 1.6 |
| 61–99% | 54.1 ± 3.5 | 59.8 ± 2.3 | 63.0 ± 2.3 |
| Collar necrosis prevalence | |||
| Necrosis present | 23.6 ± 3.1 | 21.6 ± 1.9 | 17.1 ± 1.5 |
| Necrosis absent | 66.1 ± 3.3 | 70.0 ± 2.2 | 73.5 ± 2.1 |
| Unreliable | 5.1 ± 1.3 | 6.2 ± 0.9 | 7.2 ± 1.2 |
| Not available | 5.1 ± 1.4 | 2.2 ± 0.6 | 2.2 ± 0.8 |
| In sound condition 1 | 13.8 ± 2.1 | 8.6 ± 1.2 | 6.8 ± 1.0 |
1 Crown defoliation and portion of epicormic shoots ≤ 25% and no collar necrosis.
Table 2.
Mean number of ash trees ha−1 of DBH < 7 cm according to the inventories 2012 and 2015, separated by health status and tree size. Percentages are provided in parentheses.
Table 2.
Mean number of ash trees ha−1 of DBH < 7 cm according to the inventories 2012 and 2015, separated by health status and tree size. Percentages are provided in parentheses.
| NFI 2012 | Loss | Inventory 2015 | |||||
|---|---|---|---|---|---|---|---|
| Tree Size | Total | 2012–2015 | Total | Healthy | <50% of Crown | >50% of Crown | Dead |
| 50–130 cm | 965.8 | 312.9 (32.4) | 652.9 | 306.9 (47.0) | 79.7 (12.2) | 94.8 (14.5) | 171.5 (26.3) |
| >130 cm and DBH < 7 cm | 579.2 | 182.0 (31.4) | 397.1 | 28.6 (7.2) | 73.7 (18.6) | 90.3 (22.7) | 204.6 (51.5) |
| Sum | 1544.9 | 494.9 (32.0) | 1050.0 | 335.5 (31.9) | 153.4 (14.6) | 185.0 (17.6) | 376.1 (35.8) |
© 2018 by the authors. Licensee MDPI, Basel, Switzerland. This article is an open access article distributed under the terms and conditions of the Creative Commons Attribution (CC BY) license (http://creativecommons.org/licenses/by/4.0/).
Share and Cite
MDPI and ACS Style
Enderle, R.; Metzler, B.; Riemer, U.; Kändler, G. Ash Dieback on Sample Points of the National Forest Inventory in South-Western Germany. Forests 2018, 9, 25. https://doi.org/10.3390/f9010025
AMA Style
Enderle R, Metzler B, Riemer U, Kändler G. Ash Dieback on Sample Points of the National Forest Inventory in South-Western Germany. Forests. 2018; 9(1):25. https://doi.org/10.3390/f9010025
Chicago/Turabian StyleEnderle, Rasmus, Berthold Metzler, Uli Riemer, and Gerald Kändler. 2018. "Ash Dieback on Sample Points of the National Forest Inventory in South-Western Germany" Forests 9, no. 1: 25. https://doi.org/10.3390/f9010025
Note that from the first issue of 2016, this journal uses article numbers instead of page numbers. See further details here.