Projecting the Range Shifts in Climatically Suitable Habitat for Chinese Sea Buckthorn under Climate Change Scenarios


1
State Key Laboratory of Soil Erosion and Dryland Farming on the Loess Plateau, Northwest A&F University, Yangling 712100, China
2
College of Forestry, Northwest A&F University, Yangling 712100, China
3
College of Landscape Engineering, Heze University, Heze 274015, China
*
Author to whom correspondence should be addressed.
Forests 2018, 9(1), 9; https://doi.org/10.3390/f9010009
Submission received: 14 October 2017
/
Revised: 20 December 2017
/
Accepted: 21 December 2017
/
Published: 22 December 2017
(This article belongs to the Section Forest Ecology and Management)
Abstract
:Understanding the impact of climate change on range shifts in climatically suitable habitats of tree species is important for national afforestation planning, which can enhance the adaptation of tree plantation to climate change through movement of tree to follow suitable climatic conditions. Here, we overlap the current and future climate-related ranges of Chinese sea buckthorn (Hippophae rhamnoides subsp. sinensis), an important tree used for afforestation in China, to estimate the range shift in three geographic dimensions (latitude, longitude and elevation) between 2000 and 2070, which are projected by the maximum entropy algorithm (MaxEnt) under current climate conditions and four climate change scenarios (RCP2.6, RCP4.5, RCP6.0, and RCP8.5). Our results show that the performance of the MaxEnt is highly accurate, with test AUC (area under the receiver operating characteristic curve) value of 0.91, Kappa value of 0.83 and predicted accuracy of 92%. About 10.7% area of land in China is climatically suitable for Chinese sea buckthorn plantation. Low representative concentration paths will have more effect on loss of climatic range and less effect on expansion of climatic range for Chinese sea buckthorn, while the impacts of high representative concentration path is the opposite. The centroids of climatic ranges will shift westward or northwestward at the rate of 10.4–22 km per decade, and the centroids of altitude will shift upward at the rate of 43–128 m per decade. The expansion area of climatically suitable habitat, covering 2.6–5.2 × 10⁵ km2, is expected to be mainly located in parts of Qinghai, Ningxia, Gansu, Sichuan, Liaoning, and Jilin provinces; these areas should be monitored for planting of Chinese sea buckthorn in the future.
1. Introduction
The Chinese government has long been devoted to revegetation and ecological reconstruction [1]. Afforestation, as an effective method of quickly restoring forest landscape, can meet the increased demand for forest timber production related to population growth while also playing a significant role in controlling soil erosion and increasing biodiversity [2]. In the past, identifying planting for tree species in China was based on the current climatically suitable habitat of tree species, and it seldom considered the potential extent and location shift in climatic ranges of tree species under future climate change [3], which is very important to identify plantations that are potentially at significant risk of extinction in the future [4,5]. Climate-related ranges of species may shift, contract, expand, or fragment in response to the changing climate [6]. Therefore, comprehensive assessments of the potential range shift in climatically suitable habitat of specific tree species in response to climate change are urgently needed.
Species distribution modeling (SDM, also known as niche-based modeling) has been widely used to project the effects of climate change on species distribution pattern [7], which assumes that present and future distributions of species are dependent mostly on the climate requirement [8]. SDMs determine responses for a set of climatic variables where a species occurs currently, i.e., defining the Grinnellian niche of the species, and then identifying the regions predicted to fall within that Grinnellian niche under future climate scenarios [9]. Unlike mechanistic-model-based eco-physiological parameters, SDMs try to find statistical correlations between the occurrence of species and climate variables, and then apply these statistical correlations onto current and future scenarios [10]. In recent years, multiple algorithms have been developed to predict the impacts of climate change on species distribution [10]. MaxEnt, the most popular SDM based on the presence-only modelling method, uses maximum entropy concept, and has been used successfully to predict the geographical distribution of different species under current and future climate change scenarios [11,12,13,14].
Chinese sea buckthorn (Hippophae rhamnoides subsp. sinensis), an important economic and ecological tree species, has been widely used to control accelerated desertification under an initiative of the government and the cultivation of this species has been widely promoted in northwest China [15,16,17]. The planting area of Chinese sea buckthorn has expanded to approximately 14,667.4 km2 (22 million acres) in the past 20 years, and is expected to increase by more than 800 km2 annually [18,19], meaning the natural dispersal is not a limitation. Recently, the potential distributional ranges of this species and the climatic factors limiting its distribution have been simulated using SDM [17]. However, previous studies have paid little attention to the impact of climate change on the range shift in climatically suitable habitat for Chinese sea buckthorn. Policy makers urgently need such information for managing current and future afforestation and planting activities. With this research gap in mind, the main objective of this study was to assess the climate-related range (extent and centriod) shift in three geographic dimensions (latitude, longitude and elevation) between 2000 and 2070 for Chinese sea buckthorn under four climate change scenarios in China. It is expected that the results will help in developing scientific planting strategies to enhance the resilience of this species in response to future climate changes.
2. Materials and Methods
2.1. SDM Model, Occurrence Data and Climatic Variables
We aimed to investigate the impact of climate change on climatically suitable habitat of the target species with MaxEnt [20], which expresses the suitability of a grid cell as a function of the climatic variables at that grid cell in a landscape, together with a set of sample locations where the plant species was observed. The default setting of MaxEnt uses auto method to generate feature types, 500 as maximum number of iterations, and 10,000 as maximum number of background points. In this study, model performance is evaluated using 10-fold cross validation and characterized by AUC (area under the receiver operating characteristic curve), Kappa, and predicted accuracy [21]. The threshold value was determined by maximum sensitivity and specificity method for converting the prediction probability maps to binary maps.
MaxEnt needs only species occurrence data. The occurrence data of Chinese sea buckthorn was obtained from Chinese Virtual Herbarium [22] and existing literature [15,23,24]. We obtained occurrence data of 368 specimens, from which we removed the duplicate specimens and the specimens with no locational information or coordinates. Spatially clustered records can cause model overfitting and lead to predictions non-independent [14,25], so the occurrence data of those specimens were located on a map of China with a grid cell spacing of 10 arc min. We assumed that a grid cell was suitable for Chinese sea buckthorn survival, if one or more specimens were present in the grid cell. Then, a binary grid map (presence/absence map) with a 10 arc min spatial resolution was converted into points by using the “raster-to-point” function in ArcGIS 9.3 (ESRI, Redlands, CA, USA). Finally, we obtained 97 records, which were stored in an Excel database [17].
MaxEnt needs a set of climatic variables to characterize the niche of Chinese sea buckthorn. In this study, we used 13 hydrological-thermal variables, including the annual mean temperature (AMT), maximum temperature of the warmest month (MTWM), minimum temperature of the coldest month (MTCM), annual range of temperature (ART), annual precipitation (AP), precipitation of the wettest month (PWM), precipitation of the driest month (PDM), precipitation of seasonality (PSD = monthly coefficient of variation of precipitation), annual biotemperature [ABT = ∑(Ti/12), T is 0 °C < T < 30 °C mean monthly temperature, i = 1, 2, …, 12], warmth index [WI = ∑(Ti-5), T is >5 °C mean monthly temperature, i = 1, 2, …, 12], coldness index [CI = ∑(Ti-5), T is <5 °C mean monthly temperature, i = 1, 2, …, 12], potential evapotranspiration rate (PER = 58.93 × ABT/AP), and humidity index (HI = AP/WI). The first eight variables were initially used on the BIOCLIM package (the first SDM model) [7] and sourced from WorldClim [26], which are generally used in ecological or other studies to evaluate the effect of climate on species distribution such as plant, pathogens, insect, etc. The remaining five variables were used in Holdridge life zone system [27] and Kira index system [28], which are climate-vegetation models to describe the vegetation belts in the world and East Asia separately. These 13 variables have been successfully applied to the prediction of suitable habitat for black locust [29] and Chinese sea buckthorn [17].
2.2. Current and Future Climate Scenarios
The current and future climatic layers with spatial resolution of 10 arc min (grid cells of about 17 km × 13 km) with coordinate system of GCS_WGS_1984 were obtained directly or indirectly from the WorldClim database [26]. The current climate layers in the WorldClim database were generated based on thin-plate smoothing splines using latitude, longitude, altitude, monthly temperature, and precipitation data from the averages of 50-year climate station records (1950–2000) [30]. The future climate scenarios we selected were generated by combining seven general circulation models (also known as global climate models, GCMs), which is recommended by the Intergovernmental Panel on Climate Change (IPCC AR5) to deal with uncertainty among GCMs [31]. In this study, we used the basic climatic layers to calculate the above five indirect climatic variables (ABT, WI, CI, PER, and HI) that are not included in WorldClim database [e.g., T = (Tmax + Tmin)/2; T, Tmax, and Tmin represent mean monthly temperature, maximum monthly temperature and minimum monthly temperature]. Seven GCMs were selected as candidate models from seven modeler centers of six countries: BCC-CSM1-1, CCSM4, GISS-E2-R, HadGEM2-AO, IPSL-CM5A-LR, MIROC-ESM-CHEM, and NorESM1-M. Four representative concentration pathways (RCP2.6, RCP4.5, RCP6.0, and RCP8.5, the number represents the radiation forcing value of 2100 relative to 1750, and the unit is W/m2) were selected as future climate change scenarios. The time-period from 2061 to 2080 (represented by 2070s) was selected as the research object. In these four RCP (representative concentration pathways) scenarios, the atmospheric CO2 concentration will rise to 437.5, 524.3, 549.8, and 677.1 ppm (mg/L) in 2070 respectively to RCP2.6, RCP4.5, RCP6.0, and RCP8.5 (390.5 ppm in 2011). We then used simple arithmetic mean to integrate the results of these seven GCMs under each of the four RCP scenarios.
2.3. Simulation Process and Statistical Analysis
The simulation processes were divided into three steps: (1) goodness-of-fit test; (2) projection of current and future range maps; (3) statistical analysis of range shift in three geographic dimensions (latitude, longitude and elevation). We used 10-fold cross validation (also called rotation estimation) to evaluate the fit goodness of the MaxEnt model in simulating the current potential suitable habitat with occurrence data and 13 climatic variables (current climate). This method randomly partitioned the original occurrence records into 10 subsets of equal size. Of the 10 subsets, one subset was used as testing data, while the remaining nine subsets were used as training data. The cross-validation was then repeated 10 times with each subset for testing exactly once. In each validation of the cycle, we calculated the indicators of MaxEnt model: AUC, Kappa, prediction accuracy, and optimal threshold (based on criterion of maximum sensitivity and specificity). The mean value of each indicator in 10 validations was used to describe the MaxEnt model’s performance.
Actually, only partial occurrence data (9/10) were used to train the MaxEnt model rather than all occurrence data in the above model evaluation process. In order to make full use of the existing occurrence information, the MaxEnt model was run with all occurrence records again without any testing dataset, and then the model was projected onto the current and future climatic conditions. Five probability distribution maps were obtained. The optimal threshold obtained in the former step was used to convert the probability distribution map into a binary map with 1 representing suitable habitat and 0 representing unsuitable habitat. The future binary maps (fmap) and the current binary map (cmap) were combined following the formula fmap × 2 + cmap, which generated 4 distribution maps with grid values of 0, 1, 2, and 3. Zero represents unsuitable habitat under both current and future conditions, 1 represents loss of suitable habitat in the future, 2 represents expanded suitable habitat in the future, and 3 represents stable suitable habitat in the future.
Finally, we statistically analyzed the change in area of the suitable habitats under the four climate change scenarios based on four generated maps [coded by 0, 1, 2, and 3; Loss area = ∑S(grid==1), Expanded area = ∑S(grid==2), Stable area = ∑S(grid==3), S represents area size of a grid cell]. The centroids of species ranges under five climate change scenarios were also computed based on a current binary map and four future binary maps [coded by 0 and 1; Loncentroid = mean(∑Lon(gird==1)), Latcentroid = mean(∑Lat(gird==1)), which were accomplished by COGravity function in SDMTools package). The distance between the future and current centroids were calculated to represent the migration distance of Chinese sea buckthorn (using distance function in raster package). The shift centroids of elevation (the layer was also obtained from WorldClim database) were also calculated for the current and future climate change scenarios (four quartiles were used to describe the range of elevation with median value as centroid in species range). The migration rates of ranges or elevation along longitudinal, latitudinal, and vertical directions were calculated following the formula CentroidDistance/7 (7 represents the seven decades between 2000 and 2070). We also calculated the elevation changes along the longitudinal and latitudinal gradients (the range of the species was divided into bands with one degree width along the two gradients and the median value in each band represented the centroid of that band, which were accomplished by zonal function in raster package). All statistical analyses and plotting were performed on the R software with the raster [32], dismo [33], and SDMTools [34] packages.
3. Results
3.1. Model Performance
The 10-fold cross-validation method was used to evaluate the performance of the Maxen model. The final average value of test AUC obtained is 0.91, showing that the performance of the MaxEnt model is highly accurate (AUC value greater than 0.9). According to the criterion threshold of maximum sensitivity and specificity, the average of optimal threshold is at 0.3. Based on the threshold criterion, the average Kappa value is 0.83, and the average predicted accuracy is 92%.
3.2. Current and Future Potential Distribution
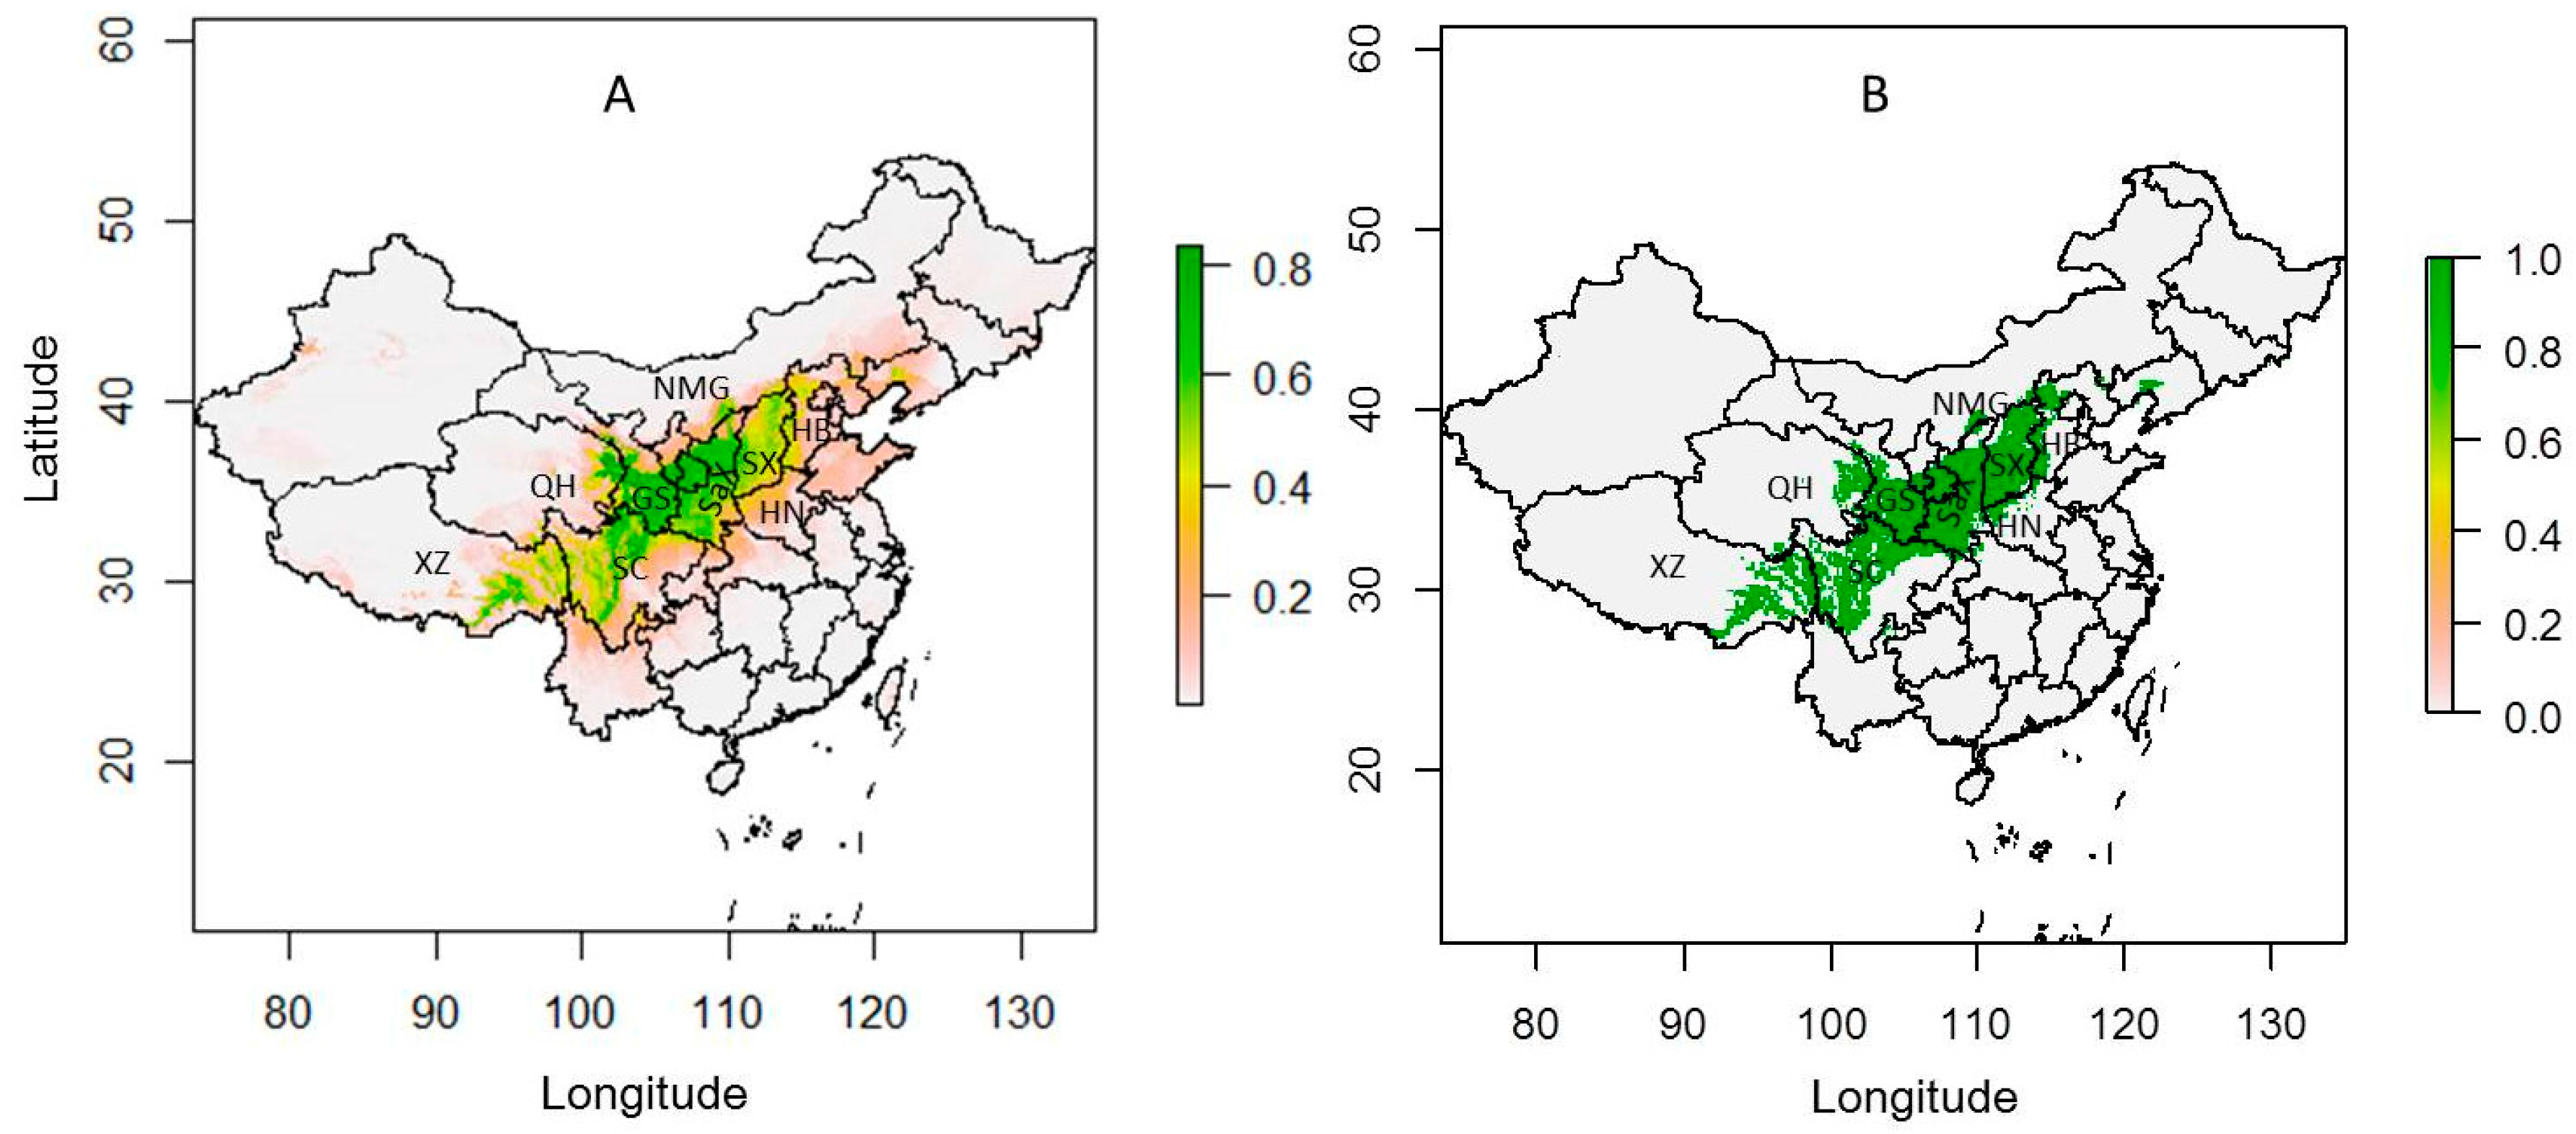
The current potential suitable and binary map based on all occurrence data is shown in Figure 1. Chinese sea buckthorn occurs in Xizang, Sichuan, Qinghai, Gansu, Ningxia, Shaanxi, and Shanxi provinces, which are mainly located in the semi-humid and semi-arid regions of China. The width of the range is about 558 km with an area of approximately 1.0 × 10⁶ km2, occupying 10.7% of the land area of China, spanning 12 provinces including Xizang, Yunan, Sichuan, Gansu, Qinghai, Ningxia, Shaanxi, Shanxi, Hebei, Inner Mongolia, Henan, and Liaoning. Its core climatically suitable areas are mainly located in Xizang, Sichuan, Gansu, Qinghai, Ningxia, and Shaanxi provinces.
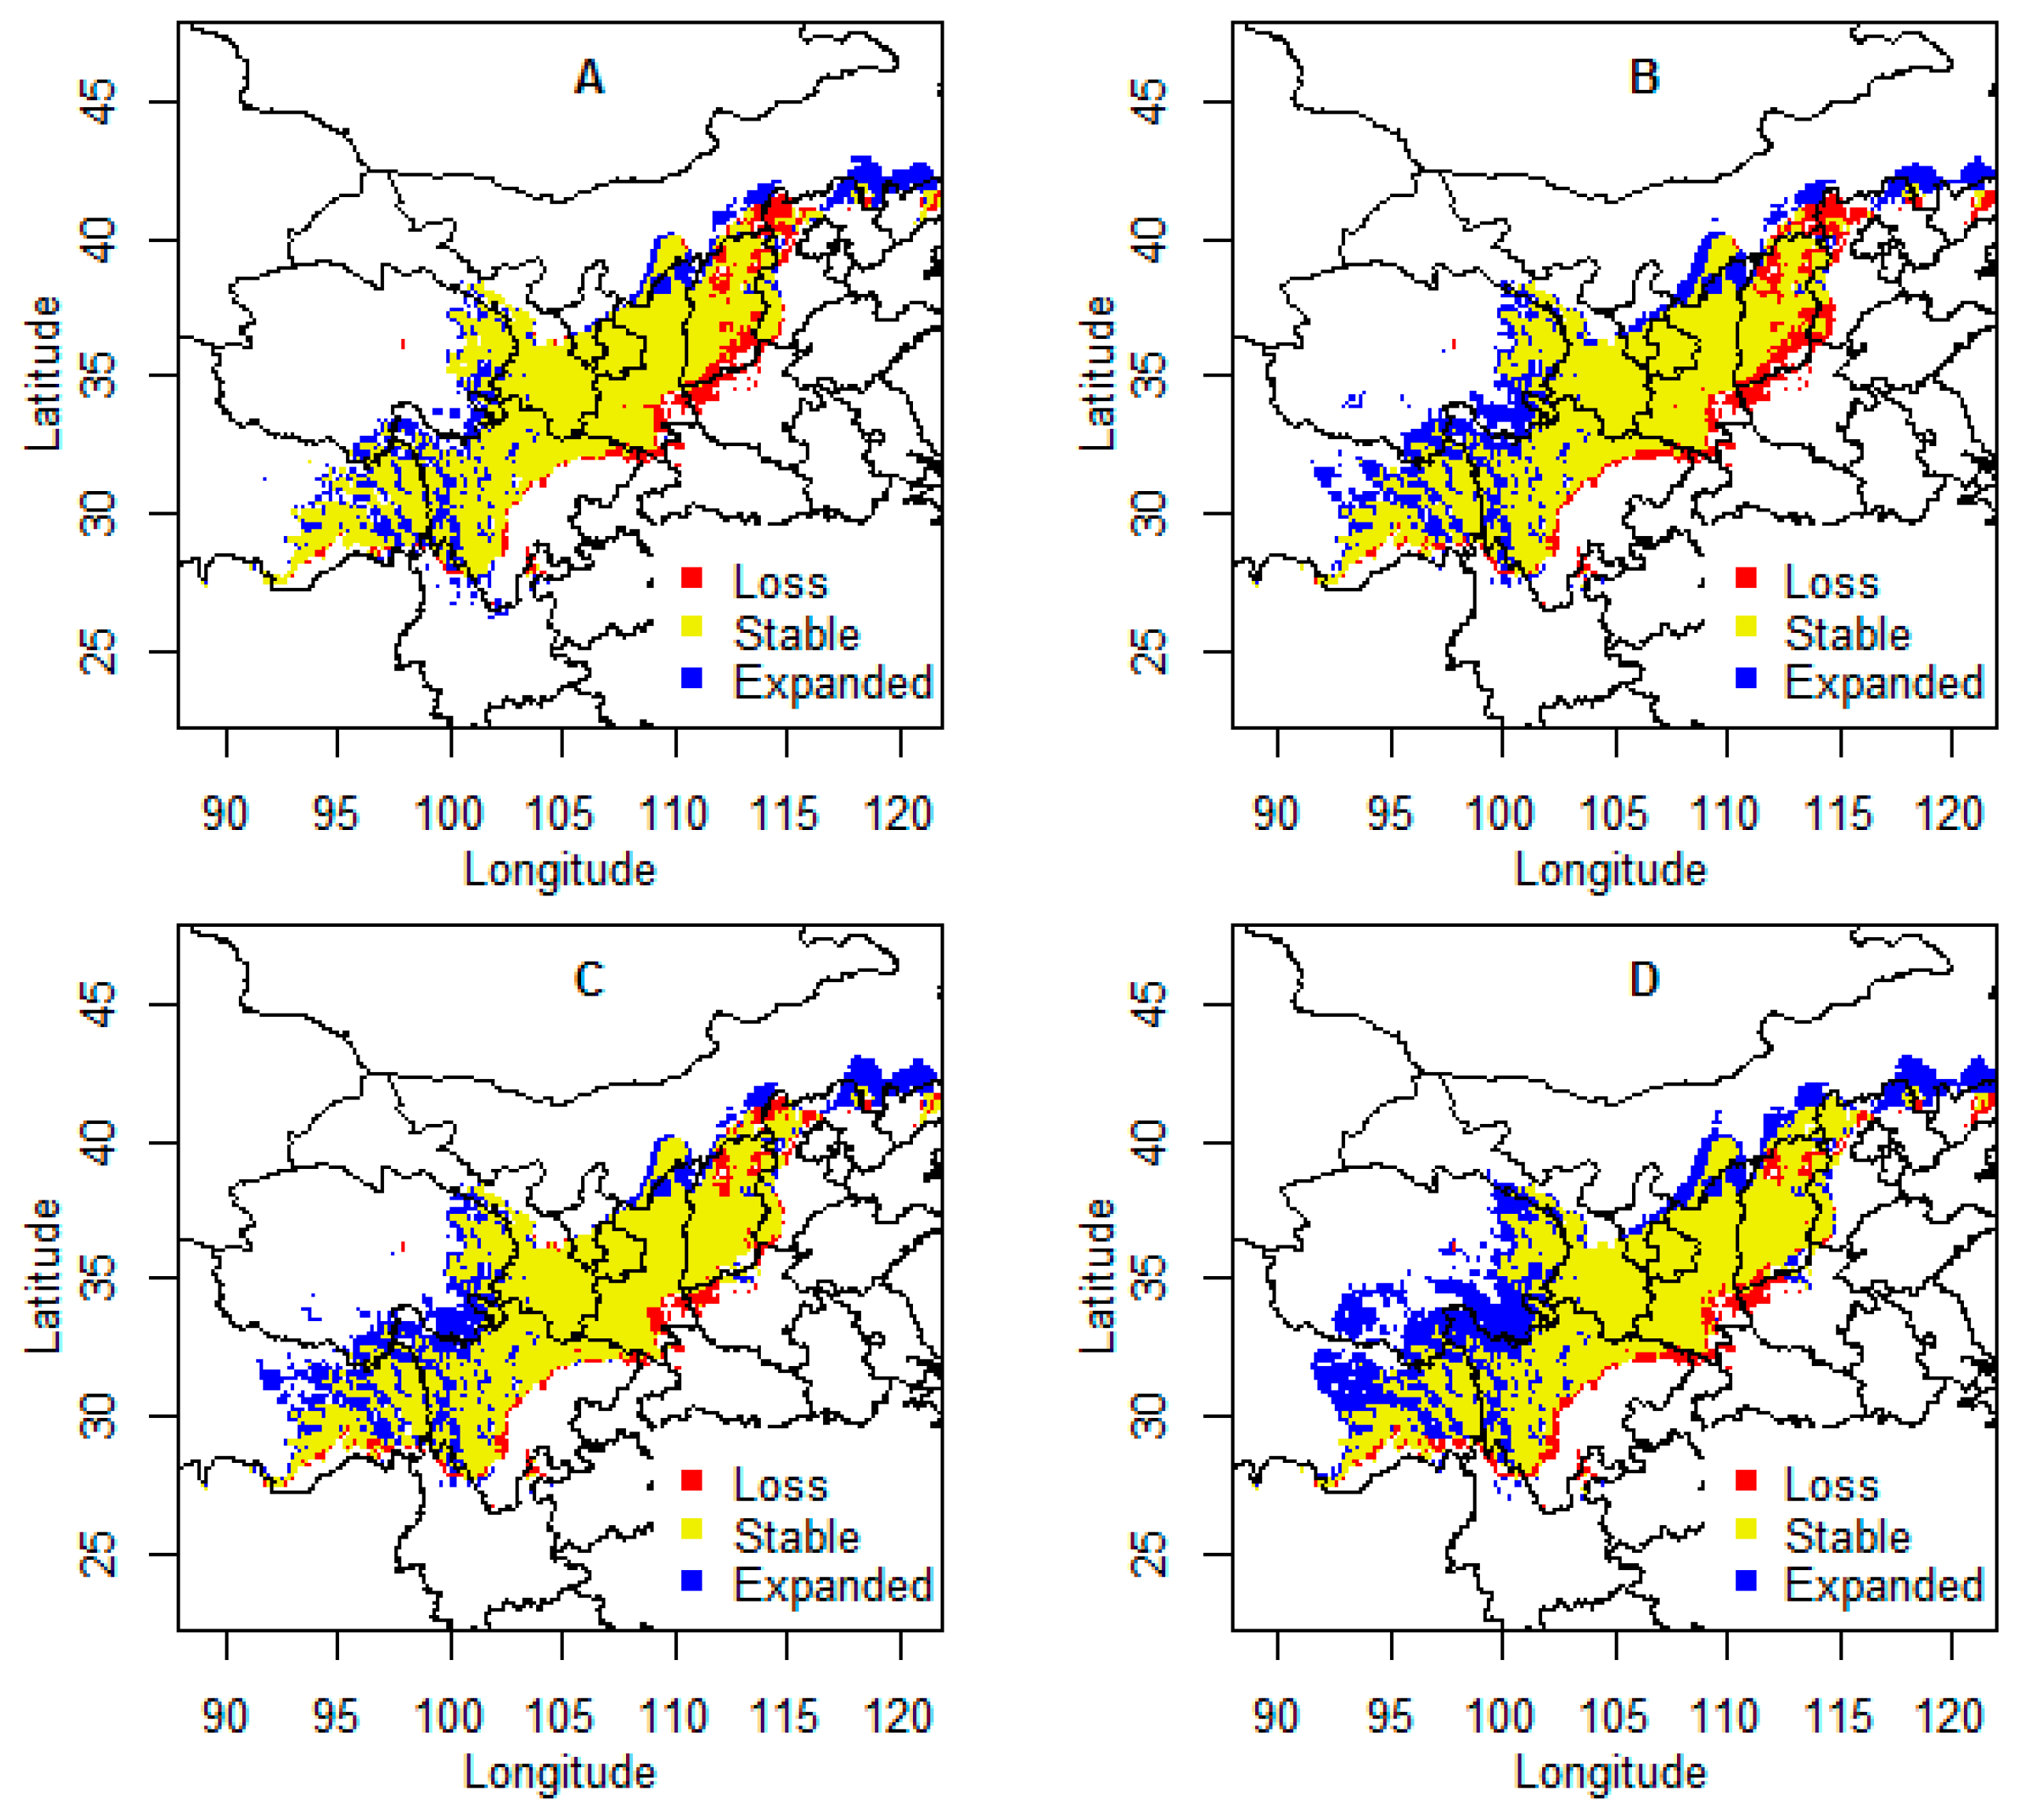
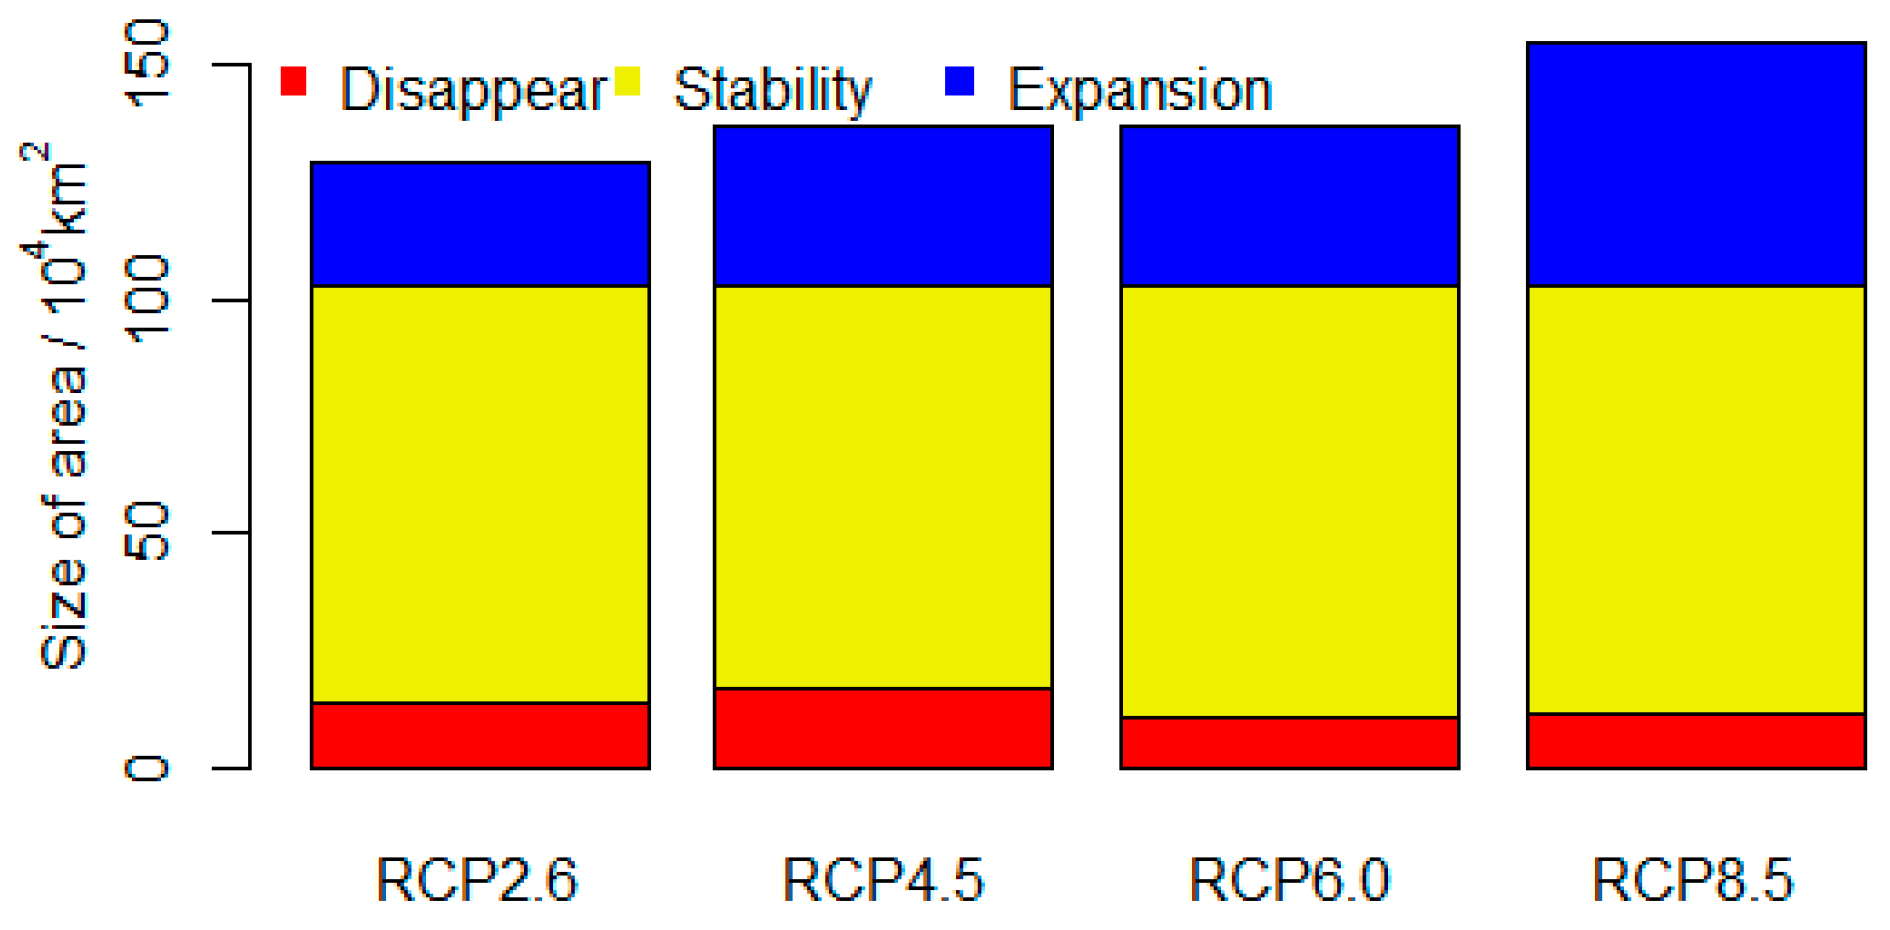
When the model is projected on the four climate scenarios in the 2070s, they show similar patterns (Figure 2). Low representative concentration paths (e.g., RCP2.6, RCP4.5) will have more effect on the loss of climatic range and less effect on expansion of climatic range for Chinese sea buckthorn, while the impact of high representative concentration paths is opposite (e.g., RCP6.0, RCP8.5). Overall, the future areas of climatic ranges will increase, especially under the RCP8.5 scenario. The increased areas are mainly located in Qinghai, Ningxia, Gansu, and Sichuan, with about 2.6–5.2 × 10⁵ km2 in the 2070s. The decreased areas of climatic ranges are mainly located in Henan, Shanxi, and Hebei provinces, with about 1.0–1.3 × 10⁵ km2 in the 2070s (Figure 3). The stable areas of climatic ranges will occupy 8.6–9.2 × 10⁵ km2, which occupies 84–90% of its current potential distributional range, located mainly in the Gansu, Qinghai, Ningxia, and Shaanxi provinces, where the current core climatically suitable areas are also located.
3.3. Migration Rate and Direction along Latitude, Longitude, and Altitude in the Future
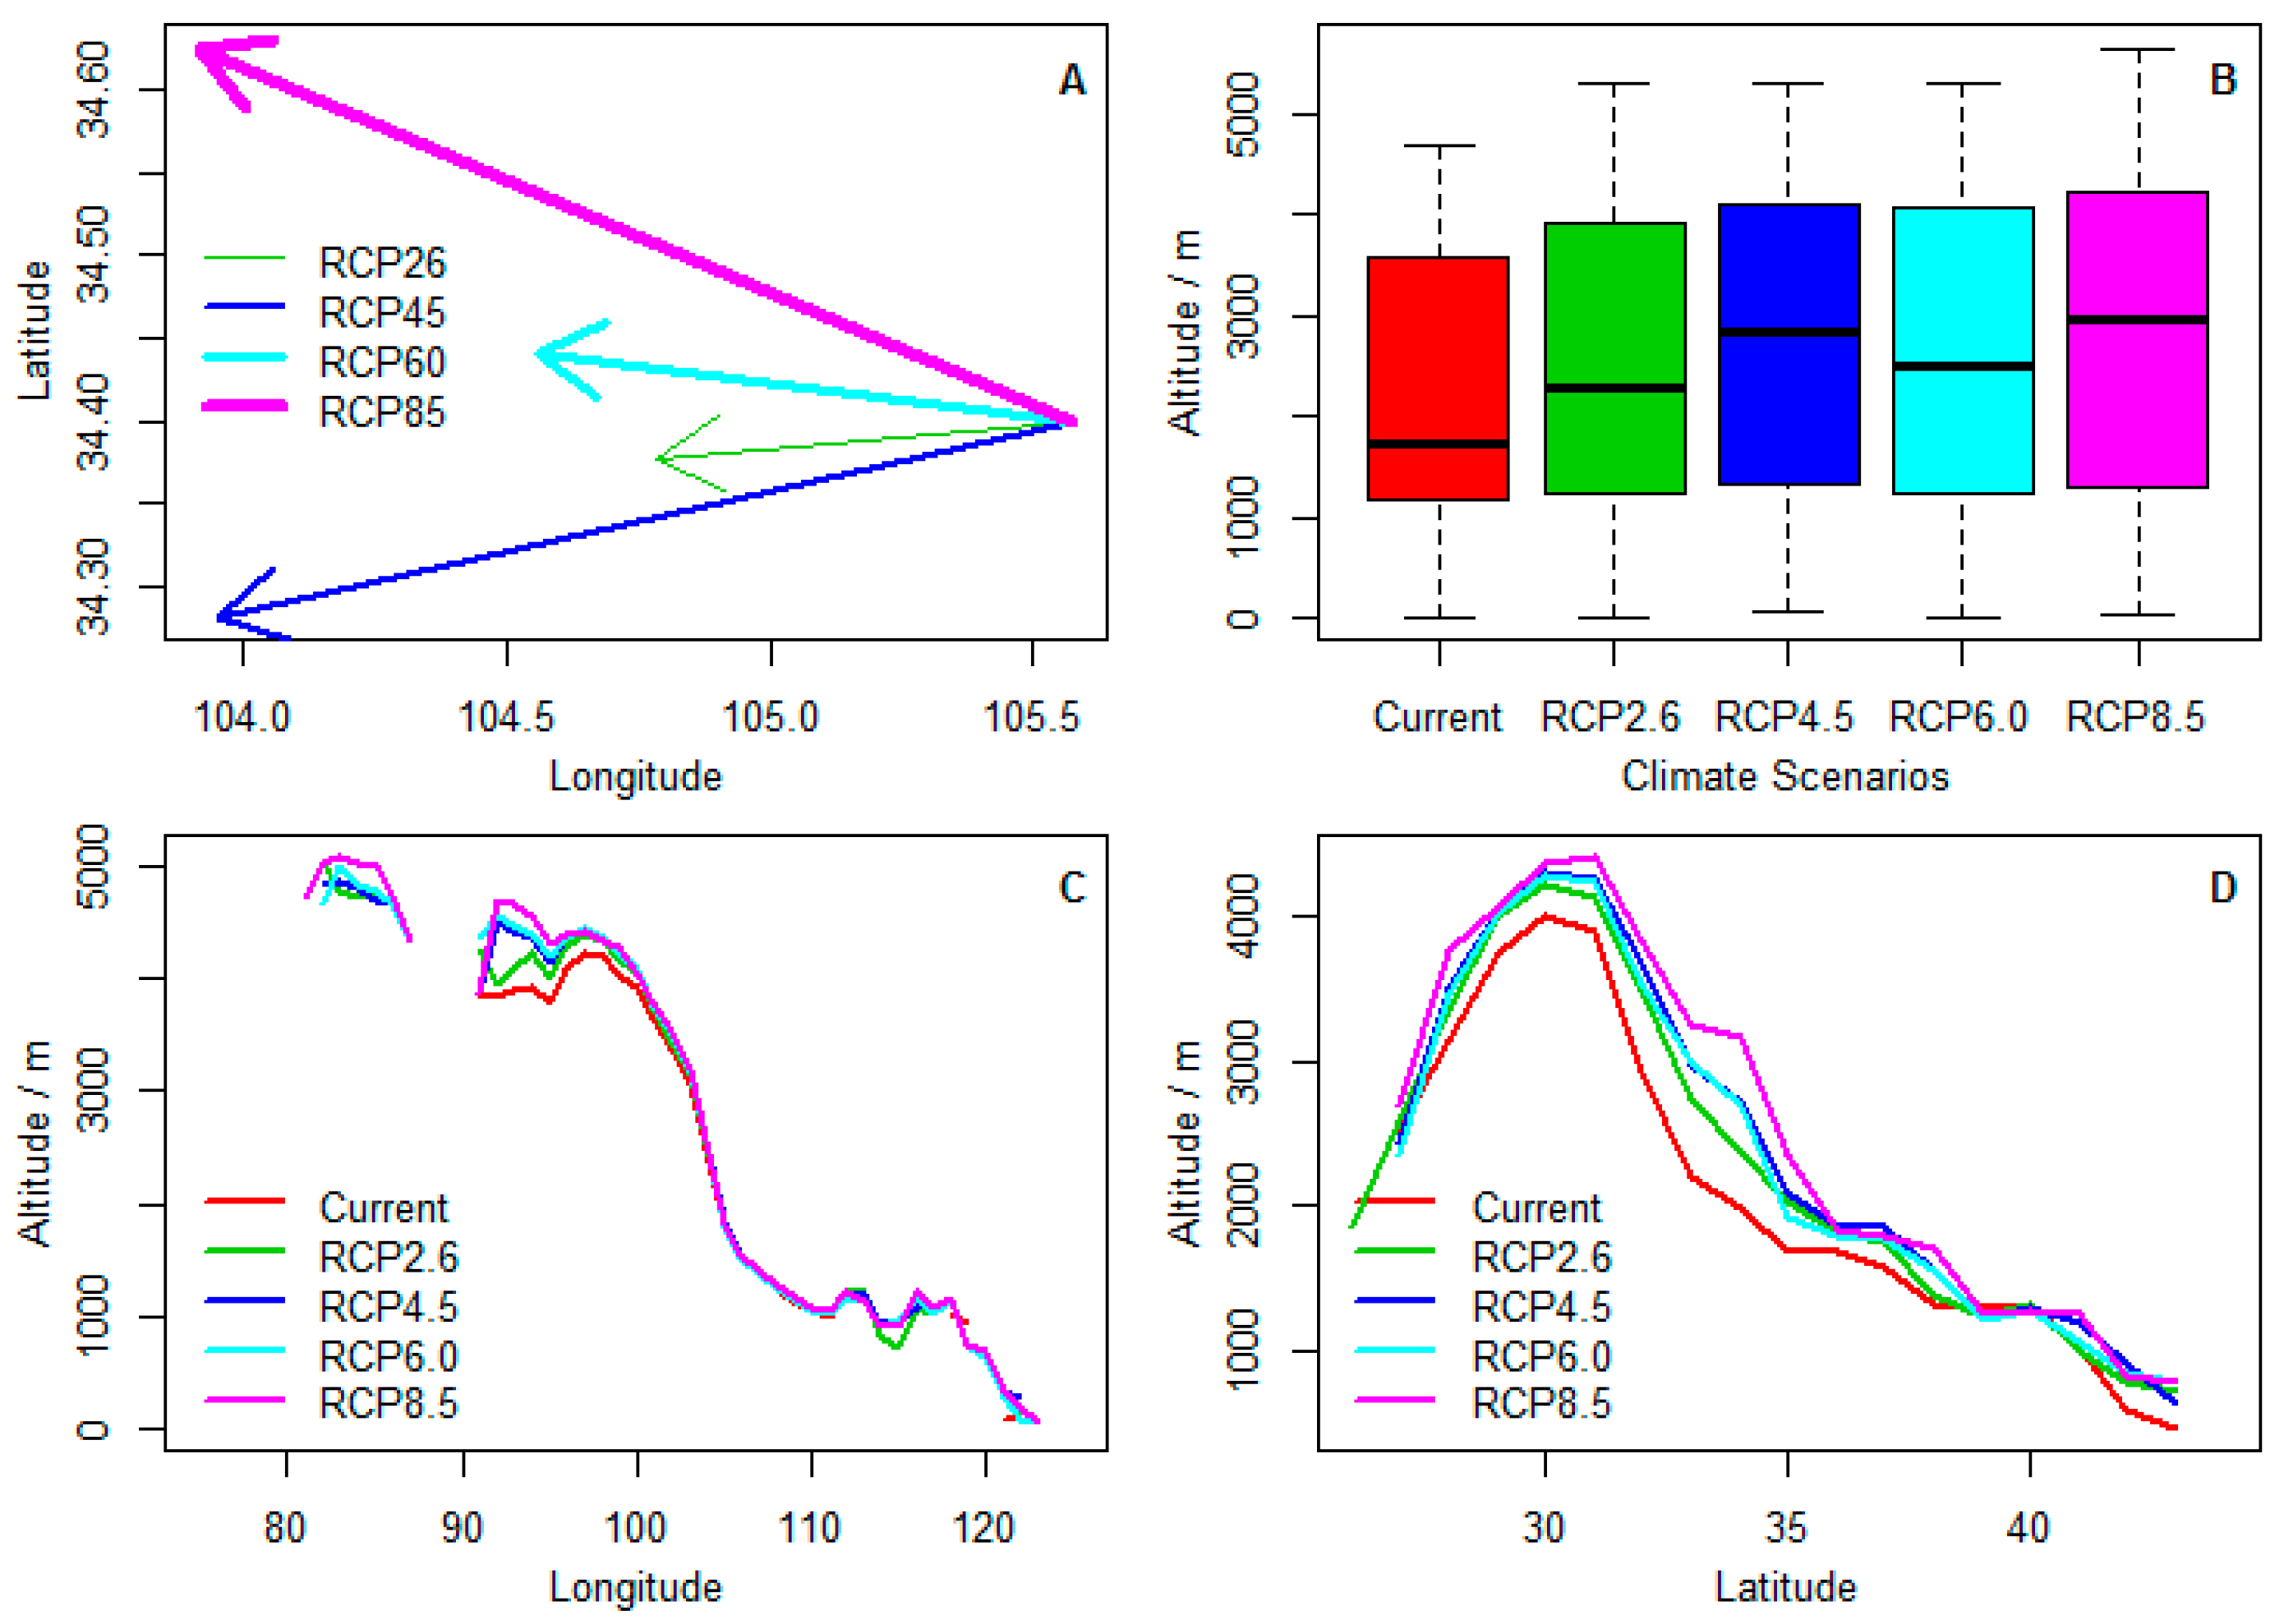
The centroid of climatic ranges of Chinese sea buckthorn will mainly migrate 72.6–154 km from the east to west in the 2070s (Figure 4A), which means that the migration rate of climatic range centroid will shift northwestward or westward by about 10.4–22 km per decade. In addition, the average altitude of the range will shift to a higher area from 1900 km to 2200–2800 km in the 2070s (Figure 4B), which means that the migration rate of centroid of altitude will shift to a higher region by 43–128 m per decade. The shift of altitude to higher regions mainly occurs in low longitudinal regions, but the shift of altitude occurs at mostly all latitudinal regions (Figure 4C,D).
4. Discussion
4.1. Climate-Related Range Shift in the Future and Its Explanation
Climate change has an important impact on the climatic range size of species, especially for species with narrow distributional ranges. Using projections of species’ distributions for future climate scenarios, Thomas et al. [35] assessed extinction risks for sample regions that cover about 20% of the Earth’s terrestrial surface, which showed that 15–37% of species will be ‘committed to extinction’ under mid-range climate-warming scenarios for 2050. In this study, we found that the stable area of climatically suitable habitat will occupy 84–90% of its current suitable habitat, located mainly in the Gansu, Qinghai, Ningxia, and Shaanxi provinces. This means that the population is generally stable and does not face the risk of climate-induced extinction. The expanded area of climatically suitable habitat under high emission scenario (RCP8.5) is more than that of low emission scenarios, which means that the planting potential of this species under a high emission scenario is larger than those in low emission scenarios. At the same time, the loss of suitable habitat in the high emission scenario is less than those of low emission scenarios (e.g., RCP4.5), which suggest that the current planted population at the south or east boundary will face higher risks of degeneration under low emission scenarios than high emission scenarios (RCP8.5). In our previous work [17], the limiting factor map of Chinese sea buckthorn shows that the southern or eastern boundaries of the species are mainly determined by the factors related to precipitation (e.g., PDM). The response curves show that high PDM value will inhibit the growth of Chinese sea buckthorn and high CI value will promote the growth of Chinese sea buckthorn. In the future climate change scenarios, the increase of PDM is accompanied by the increase of CI in the southern and eastern boundaries of the species. We infer that the inhibitory effect of PDM and the promoting effect of CI will be in a state of approximate equivalence in the high emission scenario (e.g., RCP8.5; resulting in the loss of a small area), whereas the inhibitory effects of PDM will be greater than the promoting effect of CI at low emission scenarios (e.g., RCP4.5; resulting in the loss of much more area). Such a mechanism may exist for many native species in the region and it still needs to be further tested.
Climate change has important impacts on climatic range shift of many terrestrial organisms. Using meta-analysis, Chen et al. [6] estimated that the distributions of species have recently shifted to higher latitudes at a median rate of 16.9 km per decade. Our findings suggest that, in the future, the distribution of Chinese sea buckthorn will move westward at the rate of about 10.4–22 km per decade. This difference of changed direction reflects the unique monsoon climate system in East Asia. IPCC implies that the East Asian monsoon climate will strengthen, which will increase rainfall in the western part of China [31,36]. The distributional boundary of Chinese sea buckthorn is governed by the combination of water and heat conditions [17]. Therefore, the climatically suitable habitat of the species can be expanded to the western region, where rainfall is projected to increase in the future.
Because of the increase of both rainfall and heat under future climate change scenarios, water available for uptake by Chinese sea buckthorn may be reduced in most of the northern region except for the northeast region of China, which will prevent Chinese sea buckthorn from migrating far north along the latitudinal gradient. Besides, an important reason that encourages migration westward rather than northward is China’s terrain distribution pattern [37]. The western part of China belongs to the higher altitudinal area, while the eastern part belongs to the lower altitudinal region. Chinese sea buckthorn’s westward migration is accompanied by an increase in altitude. Future climate warming will result in a greater upward shift (43–128 m per decade) in optimum elevation of Chinese sea buckthorn than the observed rate of 29 m per decade in western Europe [38] and a meta-analysis rate of 11 m per decade around the world [6], which will mainly be caused by the interaction of monsoon climate and stepwise terrain in China.
4.2. Simulation Uncertainty and Its Application
Species distribution model generally estimates the realized niche, which is where species occur when in competition with other species. This is smaller than the fundamental niche, which is related to species physiological limits [39]. Booth et al. [5,40] believe that under climate change long-lived trees, already well-established at a particular site, may be able to show some of the climatic adaptability that they show in trials outside of their natural distributions. In our study, many introduced records were included in the occurrence dataset, so the simulated niche extended beyond the natural distribution.
Our simulation of the potential range of Chinese sea buckthorn is only based on climatic variables rather than other type of factors. In fact, the true suitability of a particular location for a particular species is not only a function of climate, but also of soils, disturbance regime, presence of pests and diseases, which have not been considered in the current and future climate scenarios [8]. Therefore, the simulated climatic ranges may be larger than the actual ranges of the species. Generally, it argues that soil factors are associated with the Eltonian niche, which is defined by resource-consumer dynamics and mainly relates to the fine-grained structure of distributions but can modify the limits determined by coarse-grained structure of the Grinnellian niche [41,42]. Besides, the negative effects of interspecific competition on cultivated populations can be alleviated by management in the current and future periods. We suggest that the potential ranges of Chinese sea buckthorn we have simulated under current and future scenarios are the climatically suitable habitats, which are also named as introducible areas by Booth et al. [40] or invadable areas by Peterson et al. [43].
Future climate change may produce novel climate conditions that do not exist in the current climate scenario, which requires a species distribution model to have extrapolation capabilities. Generally, the extrapolated habitat is less reliable than the interpolation habitat, which is the shortcoming of most species distribution models [44]. Li et al. [17] found that most of the climatically suitable habitat under the current climate scenario is interpolated habitat rather than extrapolated habitat, indicating that the current climatic range map of Chinese sea buckthorn is highly reliable. When the climatic niche is projected on four future climate change scenarios, we still do not know how much novel climate condition is produced and where the novel climate is located. In addition, it argues that understanding climate uncertainty is critical for effective planning in forest management in climate change scenarios [45]. To reflect this uncertainty, we used four climate change scenarios integrated by 7 GCMs, which is recommended by the IPCC AR5 [31]. The differences among the climatic ranges shift of Chinese sea buckthorn under the four scenarios can reflect the uncertainty of future climate change.
Whether the climatically suitable habitat will be occupied by Chinese sea buckthorn in the future will depend on the factors affecting migration and landscape barriers [5,46]. Therefore, the climatic ranges that we have simulated do not indicate all the areas in which the species can arrive naturally in the future. However, the climatic ranges can provide valuable information for afforestation managers to plant Chinese sea buckthorn. We have found that the increased areas of climatically suitable habitat are mainly located in the western region of China, where China’s ecologically fragile region is also located. Therefore, the expansion range maps we obtained in this study can guide monitoring of future afforestation using Chinese sea buckthorn. We believe that Chinese sea buckthorn will play a significant role in improving the ecologically fragile areas in the future.
5. Conclusions
We projected the effect of climate change on climatic ranges of Chinese sea buckthorn using species distribution model under four representative concentration paths (RCP2.6, RCP4.5, RCP6.0, RCP8.5) in the 2070s. Our results show that the future climate change will increase the overall areas of climatically suitable habitat for Chinese sea buckthorn, especially under high emission scenarios. Future climate change will lead to the westward movement of the geographical centriods at the rate of 10.4–22 km per decade and will lead to a shift in centriods of altitude at the rate of 43–128 m per decade. We believe that our study provides valuable reference data to assist the development of climate change adaptation strategies for Chinese sea buckthorn.
Acknowledgments
The authors acknowledge two anonymous reviewers and academic editor for their constructive comments, which significantly improved the manuscript. The project was supported financially by the National Key Research and Development Program of China (2017YFC0504601), the National Nature Science Foundation of China (Nos. 31500449, 31300407) and Key Cultivation Project of Chinese Academy of Sciences “The promotion and management of ecosystem functions of restored vegetation in Loess Plateau, China”.
Author Contributions
J.H., G.L., J.L., X.Z., M.Y. and S.D. conceived and designed the experiments; J.H. and G.L. analyzed the data; J.H. wrote the paper.
Conflicts of Interest
The authors declare no conflict of interest. The founding sponsors had no role in the design of the study; in the collection, analyses, or interpretation of data; in the writing of the manuscript, and in the decision to publish the results.
References
- Zhou, S.X. Reconstruction of the Beautiful Mountains and Rivers: The Six Key Forestry Project Documentary; China Forestry Press: Beijing, China, 2002. [Google Scholar]
- Ryan, P.J.; Harper, R.J.; Laffan, M.; Booth, T.H.; McKenzie, N.J. Site assessment for farm forestry in Australia and its relationship to scale, productivity and sustainability. For. Ecol. Manag. 2002, 171, 133–152. [Google Scholar] [CrossRef]
- National Development and Reform Commission. National Response to Climate Change Planning (2014–2020). Available online: http://www.scio.gov.cn/xwfbh/xwbfbh/wqfbh/2014/20141125/xgzc32142/Document/1387125/1387125.htm (accessed on 4 May 2017).
- Booth, T.H.; Jovanovic, T.; Harwood, C.E. A generic method for climate change impact analysis of tree species planting domains. New For. 2014, 45, 507–522. [Google Scholar] [CrossRef]
- Booth, T.H.; Broadhurst, L.M.; Pinkard, E.; Prober, S.M.; Dillon, S.K. Native forests and climate change: Lessons from Eucalypts. For. Ecol. Manag. 2015, 347, 18–29. [Google Scholar] [CrossRef]
- Chen, I.C.; Hill, J.K.; Ohlemuller, R.; Roy, D.B.; Thomas, C.D. Rapid range shifts of species associated with high levels of climate warming. Science 2011, 333, 1024–1026. [Google Scholar] [CrossRef] [PubMed]
- Booth, T.H.; Nix, H.A.; Busby, J.R.; Hutchinson, M.F. Bioclim: The first species distribution modelling package, its early applications and relevance to most current MaxEnt studies. Divers. Distrib. 2014, 20, 1–9. [Google Scholar] [CrossRef]
- Pearson, R.G.; Dawson, T.P. Predicting the impacts of climate change on the distribution of species: Are bioclimate envelope models useful? Glob. Ecol. Biogeogr. 2003, 12, 361–371. [Google Scholar] [CrossRef]
- Hijmans, R.J.; Graham, C.H. The ability of climate envelope models to predict the effect of climate change on species distributions. Glob. Chang. Biol. 2006, 12, 2272–2281. [Google Scholar] [CrossRef]
- Franklin, J. Mapping Species Distributions: Spatial Interence and Prediction; Cambridge University Press: Cambridge, UK, 2009. [Google Scholar]
- Dolgener, N.; Freudenberger, L.; Schneeweiss, N.; Ibisch, P.L.; Tiedemann, R. Projecting current and potential future distribution of the Fire-bellied toad Bombina bombina under climate change in north-eastern germany. Reg. Environ. Chang. 2014, 14, 1063–1072. [Google Scholar] [CrossRef]
- Fischer, D.; Thomas, S.M.; Niemitz, F.; Reineking, B.; Beierkuhnlein, C. Projection of climatic suitability for Aedes albopictus Skuse (Culicidae) in Europe under climate change conditions. Glob. Planet. Chang. 2011, 78, 54–64. [Google Scholar] [CrossRef]
- Li, G.Q.; Xu, G.H.; Guo, K.; Du, S. Geographical boundary and climatic analysis of Pinus tabulaeformis in China: Insights on its afforestation. Ecol. Eng. 2016, 86, 75–84. [Google Scholar] [CrossRef]
- Narouei-Khandan, H.A.; Halbert, S.E.; Worner, S.P.; van Bruggen, A.H.C. Global climate suitability of citrus huanglongbing and its vector, the Asian citrus psyllid, using two correlative species distribution modeling approaches, with emphasis on the USA. Eur. J. Plant Pathol. 2016, 144, 655–670. [Google Scholar] [CrossRef]
- Li, T.S.C.; Schroeder, W.R. Sea buckthorn (Hippophae rhamnoides L.): A multipurpose plant. HortTechnology 1996, 6, 370–380. [Google Scholar]
- Xiong, B.Q.; Yu, D.; Yuan, J.; Zeng, M.; Zhang, Y.; Du, J.B. The wild plant resources and utilization of Hippophae in China. Chin. Wild Plant Resour. 2004, 23, 25–26. [Google Scholar]
- Li, G.Q.; Du, S.; Guo, K. Evaluation of limiting climatic factors and simulation of a climatically suitable habitat for Chinese sea buckthorn. PLoS ONE 2015, 10, e0136001. [Google Scholar]
- An, B.L.; Lu, S.G. Conservation and utilization of germplasm resources of seabuckthorn. Glob. Seabuckthorn Res. Dev. 2004, 2, 12–15. [Google Scholar]
- Chen, Y.M.; Liu, G.B.; Xu, B.C.; Chen, Y.Q. Research progress and prospect of function on soil and water conservation of seabuckthorn in China. Sci. Soil Water Conserv. 2004, 2, 88–93. [Google Scholar]
- Phillips, S.J.; Anderson, R.P.; Schapire, R.E. Maximum entropy modeling of species geographic distributions. Ecol. Model. 2006, 190, 231–259. [Google Scholar] [CrossRef]
- Fielding, A.H.; Bell, J.F. A review of methods for the assessment of prediction errors in conservation presence/absence models. Environ. Conserv. 1997, 24, 38–49. [Google Scholar] [CrossRef]
- Chinese Virtual Herbarium. Available online: Http://www.cvh.org.cn (accessed on 10 May 2014).
- Chen, X.L.; Lian, Y.S. Distribution pattern of Hippophae spp. and its cause. Hippophae 2007, 20, 1–5. [Google Scholar]
- Gu, H.; Zhang, H.; Chen, C.; Liu, X.B. Nature distribution of Hippophae rhamnoides l. Subsp. sinensis Rousi. In Qinghai-Tibetan Plateau and its relationships with main environmental factors. Glob. Seabuckthorn Res. Dev. 2008, 6, 10–16. [Google Scholar]
- Senay, S.D.; Worner, S.P.; Ikeda, T. Novel three-step pseudo-absence selection technique for improved species distribution modelling. PLoS ONE 2013, 8, e71218. [Google Scholar] [CrossRef] [PubMed] [Green Version]
- WorldClim. Global Climate Data—Free Climate Data for Ecological Modeling and GIS. Available online: http://www.worldclim.org/ (accessed on 2 May 2017).
- Holdridge, L.R. Determination of world plant formations from simple climatic data. Science 1947, 105, 367–368. [Google Scholar] [CrossRef] [PubMed]
- Kira, T. A New Classification of Climate in Eastern Asia as the Basis for Agricultural Geography; Horticultural Institute, Kyoto University: Kyoto, Japan, 1945. [Google Scholar]
- Li, G.Q.; Xu, G.H.; Guo, K.; Du, S. Mapping the global potential geographical distribution of black locust (Robinia pseudoacacia L.) using herbarium data and a maximum entropy model. Forests 2014, 5, 2773–2792. [Google Scholar] [CrossRef]
- Hijmans, R.J.; Cameron, S.E.; Parra, J.L.; Jones, P.G.; Jarvis, A. Very high resolution interpolated climate surfaces for global land areas. Int J. Climatol. 2005, 25, 1965–1978. [Google Scholar] [CrossRef]
- IPCC. Climate Change 2013: The Physical Science Basis. Contribution of Working Group I to the Fifth Assessment Report of the Intergovernmental Panel on Climate Change; Stocker, T.F., Qin, D., Plattner, G.-K., Tignor, M., Allen, S.K., Boschung, J., Nauels, A., Xia, Y., Bex, B., Midgley, B.M., Eds.; Cambridge University Press: Cambridge, UK; New York, NY, USA, 2013; p. 1535. [Google Scholar]
- Hijmans, R.J. Raster: Geographic Data Analysis and Modeling. R Package Version 2.5-8; 2016. Available online: Https://cran.R-project.Org/package=raster (accessed on 20 May 2016).
- Hijmans, R.J.; Phillips, S.; Leathwick, J.; Elith, J. Dismo: Species Distribution Modeling. R Package Version 1.1-4. 2017. Available online: Https://cran.R-project.Org/package=dismo (accessed on 20 May 2016).
- Vanderwal, J.; Falconi, L.; Januchowski, S.; Shoo, L.; Storlie, C. Sdmtools: Species Distribution Modelling Tools: Tools for Processing Data Associated with Species Distribution Modelling Exercises. R Package Version 1.1-221. 2014. Available online: Https://cran.R-project.Org/package=sdmtools (accessed on 20 May 2016).
- Thomas, C.D.; Cameron, A.; Green, R.E.; Bakkenes, M.; Beaumont, L.J.; Collingham, Y.C.; Erasmus, B.F.N.; de Siqueira, M.F.; Grainger, A.; Hannah, L.; et al. Extinction risk from climate change. Nature 2004, 427, 145–148. [Google Scholar] [CrossRef] [PubMed] [Green Version]
- Wang, S.Z.; Yu, E.T. Simulation and projection of changes in rainy season precipitation over China using the WRF model. Acta Meteorol. Sin. 2013, 27, 577–584. [Google Scholar] [CrossRef]
- Editorial Committee for Physical Geography of China. Physical Geography of China; Science Press: Beijing, China, 1985. [Google Scholar]
- Lenoir, J.; Gegout, J.C.; Marquet, P.A.; de Ruffray, P.; Brisse, H. A significant upward shift in plant species optimum elevation during the 20th century. Science 2008, 320, 1768–1771. [Google Scholar] [CrossRef] [PubMed]
- Soberon, J.; Arroyo-Pena, B. Are fundamental niches larger than the realized? Testing a 50-year-old prediction by Hutchinson. PLoS ONE 2017, 12, e0175138. [Google Scholar] [CrossRef] [PubMed]
- Booth, T.H.; Nix, H.A.; Hutchinson, M.F.; Jovanovic, T. Niche analysis and tree species introduction. For. Ecol. Manag. 1988, 23, 47–59. [Google Scholar] [CrossRef]
- Soberon, J. Grinnellian and Eltonian niches and geographic distributions of species. Ecol. Lett. 2007, 10, 1115–1123. [Google Scholar] [CrossRef] [PubMed]
- Strubbe, D.; Broennimann, O.; Chiron, F.; Matthysen, E. Niche conservatism in non-native birds in Europe: Niche unfilling rather than niche expansion. Glob. Ecol. Biogeogr. 2013, 22, 962–970. [Google Scholar] [CrossRef]
- Peterson, A.T.; Soberon, J.; Pearson, R.G.; Andersen, R.P.; Martinez-Meyer, E.; Nakamura, M.; Araujo, M.B. Ecological Niches and Geographic Distributions; Monographsin Population Biology No. 49; Princeton University Press: Princeton, NJ, USA, 2011. [Google Scholar]
- Elith, J.; Kearney, M.; Phillips, S. The art of modelling range-shifting species. Methods Ecol. Evol. 2010, 1, 330–342. [Google Scholar] [CrossRef]
- Koo, K.A.; Park, S.U.; Kong, W.S.; Hong, S.; Jang, I.; Seo, C. Potential climate change effects on tree distributions in the Korean peninsula: Understanding model & climate uncertainties. Ecol. Model. 2017, 353, 17–27. [Google Scholar]
- Tyler, T. Detecting migration routes and barriers by examining the distribution of species in an apomictic species complex. J. Biogeogr. 2000, 27, 979–988. [Google Scholar] [CrossRef]
Figure 1.
The current climatically suitable maps based on all occurrence data. (A) The probability map; (B) The binary map (threshold = 0.3 in MaxEnt). Core climatically suitable areas of Chinese sea buckthorn mainly occurs in Xizang (XZ), Sichuan (SC), Qinghai (QH), Gansu (GS), Shaanxi (SaX), and Shanxi (SX), which are mainly located in the semi-humid and semi-arid regions of China.

Figure 2.
Climate-related range shift in extent and location of Chinese sea buckthorn in China under four climate change scenarios in the 2070s. (A) RCP2.6; (B) RCP4.5; (C) RCP6.0; (D) RCP8.5.
Figure 2.
Climate-related range shift in extent and location of Chinese sea buckthorn in China under four climate change scenarios in the 2070s. (A) RCP2.6; (B) RCP4.5; (C) RCP6.0; (D) RCP8.5.

Figure 3.
Potential loss, stable, and expanded ranges of climatically suitable areas for Chinese sea buckthorn under four climate change scenarios (2070s). The loss plus stable area is equal to the current distributional area. The stable plus expanded area is equal to future distributional area. The expanded minus loss area is equal to the area change between current and future climate conditions.

Figure 4.
Climate-related centroids shift in three geographic dimensions of Chinese sea buckthorn under four climate change scenarios in the 2070s. (A) centroid shift of range along latitudinal and longitudinal gradients; (B) centroid shift of altitude; (C) centroid shift of altitude along the longitudinal gradient; (D) centroid shift of altitude along the latitudinal gradient.

© 2017 by the authors. Licensee MDPI, Basel, Switzerland. This article is an open access article distributed under the terms and conditions of the Creative Commons Attribution (CC BY) license (http://creativecommons.org/licenses/by/4.0/).
Share and Cite
MDPI and ACS Style
Huang, J.; Li, G.; Li, J.; Zhang, X.; Yan, M.; Du, S. Projecting the Range Shifts in Climatically Suitable Habitat for Chinese Sea Buckthorn under Climate Change Scenarios. Forests 2018, 9, 9. https://doi.org/10.3390/f9010009
AMA Style
Huang J, Li G, Li J, Zhang X, Yan M, Du S. Projecting the Range Shifts in Climatically Suitable Habitat for Chinese Sea Buckthorn under Climate Change Scenarios. Forests. 2018; 9(1):9. https://doi.org/10.3390/f9010009
Chicago/Turabian StyleHuang, Jinghua, Guoqing Li, Jie Li, Xiaoqin Zhang, Meijie Yan, and Sheng Du. 2018. "Projecting the Range Shifts in Climatically Suitable Habitat for Chinese Sea Buckthorn under Climate Change Scenarios" Forests 9, no. 1: 9. https://doi.org/10.3390/f9010009
Note that from the first issue of 2016, this journal uses article numbers instead of page numbers. See further details here.