Article

Natural Regeneration Dynamics of Mora paraensis (Ducke) Ducke in Estuarine Floodplain Forests of the Amazon River

by
Zenaide Palheta Miranda
1,*,
Marcelino Carneiro Guedes
2,
Anderson Pedro Bernardina Batista
3 and
Diego Armando Silva da Silva
4
1
Tropical Biodiversity Graduate Program, Federal University of Amapá (UNIFAP), Macapá CEP 68903-419, Amapá, Brazil
2
Research and Development Department, Brazilian Agricultural Research Corporation (Embrapa), Macapá CEP 68903-419, Amapá, Brazil
3
Department of Forest Science, Federal University of Lavras, Lavras CEP 37200-00, Minas Gerais, Brazil
4
Production Engineering Department, State University of Amapá, Macapá CEP 68900-070, Amapá, Brazil
*
Author to whom correspondence should be addressed.
Forests 2018, 9(2), 54; https://doi.org/10.3390/f9020054
Submission received: 14 November 2017 / Revised: 14 January 2018 / Accepted: 17 January 2018 / Published: 24 January 2018
(This article belongs to the Section Forest Ecology and Management)

Abstract

:
The aim of this study was to evaluate the natural regeneration dynamics of Mora paraensis in floodplain forests in three regions of the eastern Amazon, and specifically, to explore the relationship between the abundance of regenerating trees and canopy openness. Tree height and circumference of all individuals of height >50 cm and diameter at breast height (DBH) <5 cm were measured in 2012, 2013 and 2015. A matrix of transitions was created and the natural regeneration (RR), demographic and dynamic rates were calculated. Hemispherical photos were used to measure canopy openness. There was no difference in the density of regenerating trees between the three study regions (mean = 2.957 ind. ha−1). The abundance of regenerating trees was highest in 2013, when 5614 individuals were inventoried, and as such the RR 2012–2013 was positive in all three regions (mean = 7.9%). Between 2013 and 2015, the RR was negative and above 50% in all regions. Canopy openness had no significant effect on the abundance of regenerating trees. The abundance of regenerating trees of M. paraensis was high in estuarine floodplain forests of the Amazon River, but the regeneration dynamics varied between years with more favourable years alternating with periods of high mortality and negative regeneration.

1. Introduction

Floodplain forests are the second most abundant vegetation type in the Amazon, covering 75,880.8 km2 (approximately 1.6% of the biome). Continuous sedimentation of particles from the river waters in these forests leads to the formation of alluvial soils [1]. In estuarine floodplain forests, the vegetation is subject to daily inundations owing to tidal flow, leading to various ecological, physiological and morphological adaptations [2], which in turn influence dominance [3]. One dominant [4,5,6,7] and endemic [8] tree species in estuarine floodplain forests is Mora paraensis (Ducke) Ducke, or pracuúba, as it is commonly known.
Timber exploitation in these forests began in the 1950s, at which time the first forestry studies were already drawing attention to the importance of the analysis of natural regeneration for understanding forest dynamics. In the floodplain forests, various timber species including M. paraensis are exploited commercially by local riverine populations and the timber is used in riverside sawmills [7,9,10,11]. In Amapá, the remaining commercial stock (trees of diameter at breast height (DBH) ≥ 50 cm) is 13 trees ha−1, with an average volume per commercial tree of 2.8 m3, generating a timber volume of 37 m3 ha−1 [11].
However, control of timber extraction is lacking, and some species are being decimated as a result of disorganised exploitation and a lack of proper management [4,5]. Indeed, M. paraensis is the species most exploited in recent years [11,12]. Timber extraction directly modifies population and habitat structures [13,14], and alters both spatial distribution patterns [15] and the propagule production capacity of native species [16,17]. In this context, studies of the dynamics of forest regeneration are essential in order to evaluate the capacity of the ecosystem to recover. In turn, this knowledge can help to support decision-making regarding models of timber exploitation that can also favour conservation objectives [18]. Specifically, beyond its value for basic understanding of vegetation characteristics, analysis of natural structural regeneration is key to management planning and for the application of silvicultural practices that favour growth and maximise volume per unit area of desired species, with the objective of supporting continuing use of the forest [19].
Natural forest regeneration allows forests to recover following natural or anthropogenic disturbances [20]. The way in which forest regeneration occurs depends upon the relative importance of seed rain, soil seed banks, seedling banks and different seed dispersal mechanisms for the establishment of new individuals and species in the system [21,22]. Regeneration of floodplain forest species may occur below the canopy, or in clearings or open areas such as beaches, and along the edges of rivers, interfluvial channels and lakes [23]. The periodic flooding of these environments is probably the most important limiting factor determining the establishment of seedlings [24]. On the other hand, flooding favours seed dispersal as most floodplain forest species have seeds that float as an adaptation to hydrochoric dispersal [25]. Despite their large size, the seeds of M. paraensis float, and are carried away from the parent tree by the floodwaters.
There is a lack of knowledge concerning estuarine species, which makes it difficult to obtain indicators of natural regeneration. As such, a better understanding of the characteristics of estuarine floodplain forest trees, such as fruit and seed morphology, germination type and species survival strategies can contribute to a better understanding of community and population dynamics in these unique and characteristic environments.
The objective of the present study is to evaluate the natural regeneration dynamics of M. paraensis in three estuarine regions located at different distances from the mouth of the Amazon River, and explore the relationship between canopy openness and the stock of regenerating trees. The hypothesis is that M. paraensis will show a high potential for regeneration and rapid growth of regenerating individuals in all classes and populations evaluated, as it is highly adapted to estuarine floodplain forests, but that canopy openness will not influence the natural regeneration process of this species.

2. Materials and Methods
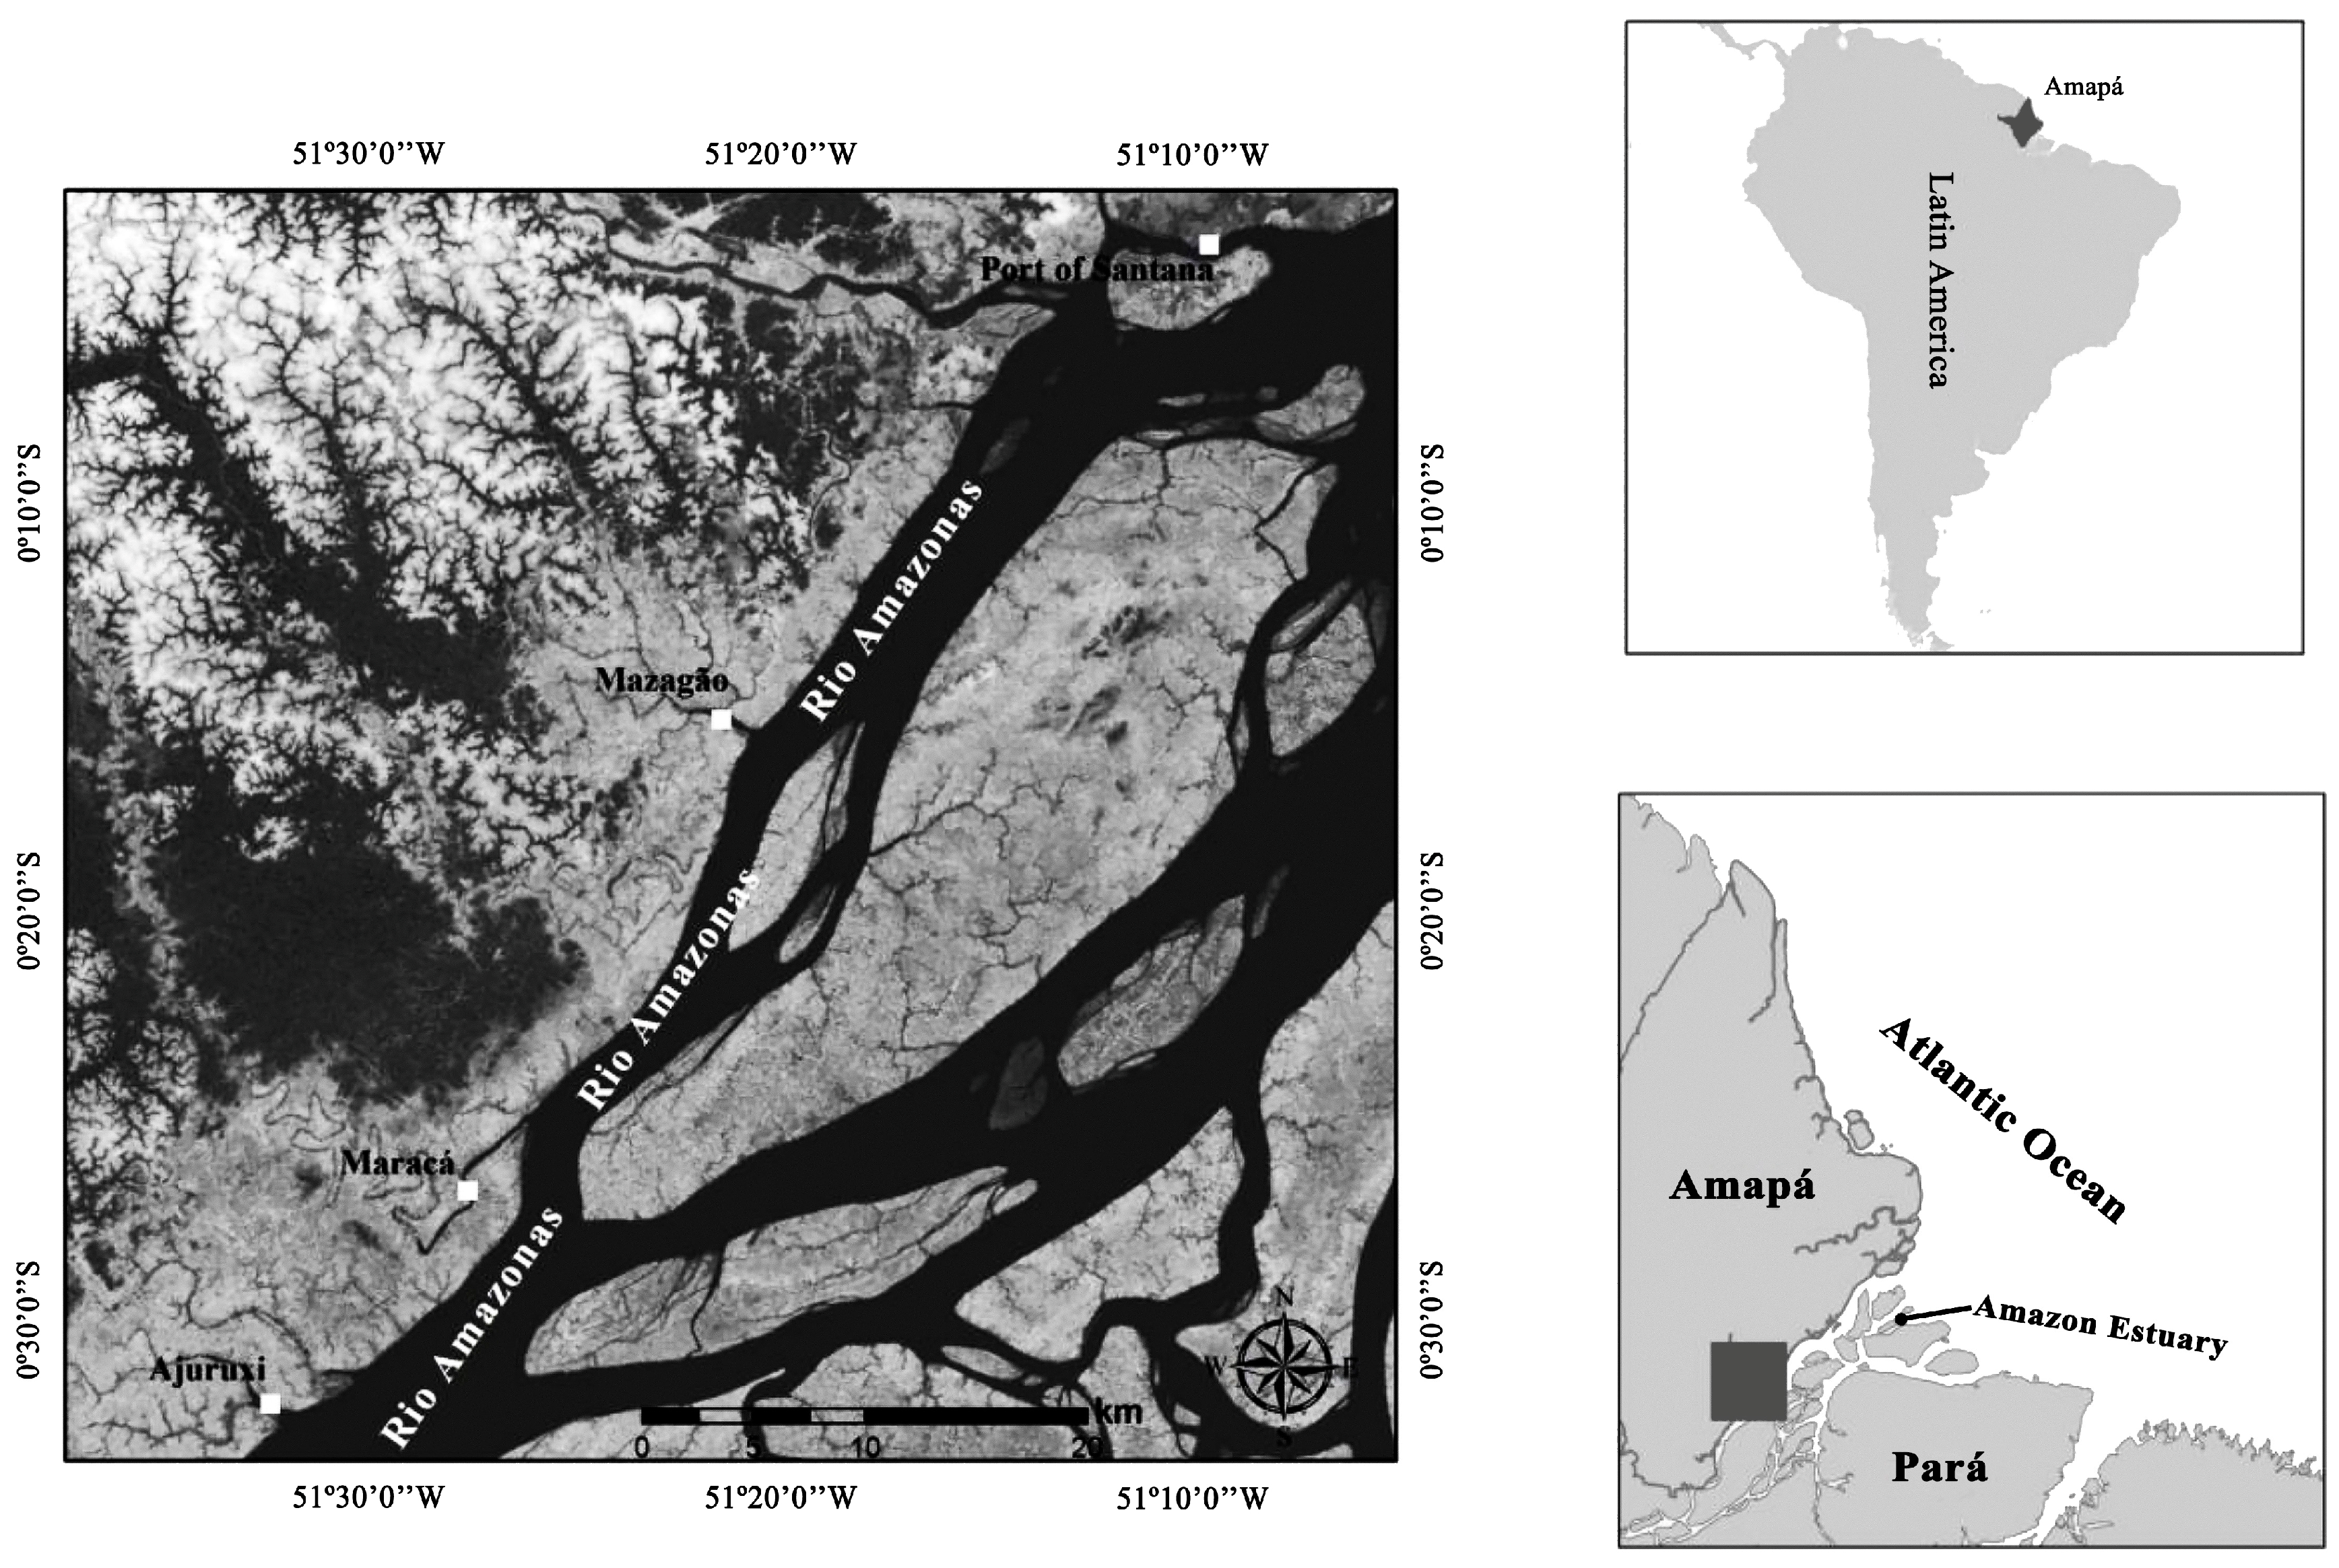
2.1. Study Area

Data were collected in three regions: Mazagão River (181.7 km from the mouth of the Amazon River), Maracá (200.8 km from the mouth of the Amazon River) and Ajuruxi (217.7 km from the mouth of the Amazon River). All three regions are in the municipality of Mazagão (0°13′00″ S, 51°26′00″ W) in the southeast of the state of Amapá, in the eastern Amazon. The study area is 250 km from the Atlantic Ocean waters, and while the tide influences water height and flow direction, it is still considered to be completely fluvial, being well upstream from any saltwater influence [26,27] (Figure 1). A previous study conducted in the same three sites showed that there are 27, 27 and 35 drainage channels in Mazagão, Maracá and Ajuruxi respectively, and that the density of adults of M. paraensis is 151 ind. ha−1, 115 ind. ha−1 and 219 ind. ha−1, respectively [28].
The region has a hot and humid tropical monsoon climate, with an average annual temperature of 27.7 °C [29]. Average annual rainfall is 2423 mm, irregularly distributed throughout the year, with highest rainfall between January and June [29]. This part of the Amazon Estuary is characterised by a tidal fluctuation of about 2–3 m, driven by the Atlantic Ocean. Because of the elevated river level during the wet season, the forests are inundated twice a day during high tides [30]. The soil is characterised by a silt–clay texture that can be classified as a Gleysol [31]. According to a recent classification, the typology of the vegetation of these flooded forests can be considered an alluvial dense rainforest [32].

2.2. Data Collection

In each region, four 1-km transects were marked, organised along each tributary of the Amazon River (Figure 1) with at least 1 km between transects to ensure independence. Twenty permanent 10 m × 25 m plots were established along each transect, totalling 80 plots and 2 ha per region, and 240 plots and 6 ha in total.
From August to November 2012, all individuals of M. paraensis above 0.5 m in height and up to 5 cm diameter at breast height (DBH) were inventoried in all of the plots. Four height levels were then defined to include regenerating individuals: N1 (above 0.5 m), N2 (above 1.0 m), N3 (above 1.50 m) and N4 (above 2.0 m). For each transect, three plots were then chosen at random to be sampled for individuals in level N1, three for level N2, three for N3 and the 11 remaining plots were only sampled for individuals in level N4. In these plots, the diameter at ground level (or DBH if the plant was over 1.3 m height) was measured for all individuals of M. paraensis in the relevant size level. In both cases, diameter was measured either using callipers or with a measuring tape, with precision of 1 mm. Height was measured either with a laser rangefinder or with a steel wire, from the ground up to the apical meristem. A numbered plate was attached to each inventoried individual to allow for later identification. From August to November 2013 and August to November 2015, the same measurements were made following the same criteria as in 2012, in order to verify the growth, recruitment and mortality of individuals and thus evaluate regeneration.
To measure canopy openness, hemispherical photos were taken at the centre of each of the 160 plots in Ajuruxi and Mazagão, using a Canon EOS T2i 550 D with an 8-mm fish-eye lens, mounted on a tripod at 1.3 m above ground level. The tripod spirit level was used to ensure the lens was level, and the camera was positioned facing geographic north using a compass. The photos were always taken in the morning between 07 h 00 min and 09 h 00 min, or at the end of the afternoon between 16 h 30 min and 18 h 30 min, to avoid excessive light on the lens [33]. From the images obtained, those presenting the best contrast between the canopy and the sky were selected and the percentage of canopy openness was calculated using Gap Light Analyser version 2.0 [34].

2.3. Data Analysis

The annual demographic rates of natural regeneration were calculated using the measurements taken in 2012, 2013 and 2015. Absolute density [35] and the abundance of regenerating individuals were estimated.
The total density of regenerating individuals DRI (height > 50 cm, DBH < 5 cm) in each transect was calculated by summing the individuals in each level, weighted by the total area sampled for each level, using the following formula:
DRI = (nN1 × 10,000/A1) + (nN2 × 10,000/A2) + (nN3 × 10,000/A3) +
(nN4 × 10,000/A4)
where:
  • DRI = Density of regenerating individuals (ind. ha−1);
  • nN = Height level category (see above);
  • A = area sampled in each level.
The total rate of natural regeneration for M. paraensis was calculated using the equation proposed by Mory and Jardim [36], which is defined as the ratio between absolute abundance resulting from the dynamic process of natural regeneration (recruitment, mortality and growth), and the abundance at the start of the study, expressed as a percentage, and being represented by the following expression:
R R = ( ( A 1 A 0 ) ( A 1 + A 0 ) ) × 100
where:
  • RR = natural regeneration rate;
  • A0 = absolute abundance at the start of the period;
  • A1 = absolute abundance at the end of the period.
Being: A1 = A0 + ni − ns
where:
  • ni = number of individuals that were recruited into the study;
  • ns = number of individuals that left the study.
Recruitment, mortality and survival behaviours of the species were evaluated using the following equations:
R = ni/A0
M = nm/A0
where:
  • R—recruitment rate expressed as a percentage;
  • M—mortality rate expressed as a percentage;
  • nm—number of individuals that died during the period.
The annual rate of increase in height of regenerating individuals was also calculated. Analysis of variance using repeated measurements over time was used to compare the absolute values of total regenerative density between the regions in each sampling year, with an interaction term (region × year) also included, and each transect used as a sampling unit. One-way analysis of variance was used to compare average values of regeneration rate, mortality rate, and recruitment rate between regions. Where the difference was significant, a Tukey test was applied to determine which regions were different from each other. All statistical analyses were carried out in R version 3.0.2 [37], using package agricolae [38].
A transition matrix was used to evaluate the dynamics of regenerating individuals of M. paraensis between height classes [39,40]. Data collected in 2012, 2013 and 2015 were used to estimate the probability of movement of seedlings between eight height classes: class one was recruitment or entry (R), classes two to seven represent subsequent increments of 1 m, and class eight was mortality (M). Each transition matrix was calculated based on the absolute frequency of individuals in the height classes, in the years for which data were collected, analysed in pairs: 2012–2013 and 2013–2015 [39,40].
The relationship between canopy openness and absolute abundance of regenerating individuals was tested using a regression analysis, using the abundance data from 2012, when the photos were taken, and separately the abundance data from 2013.

3. Results

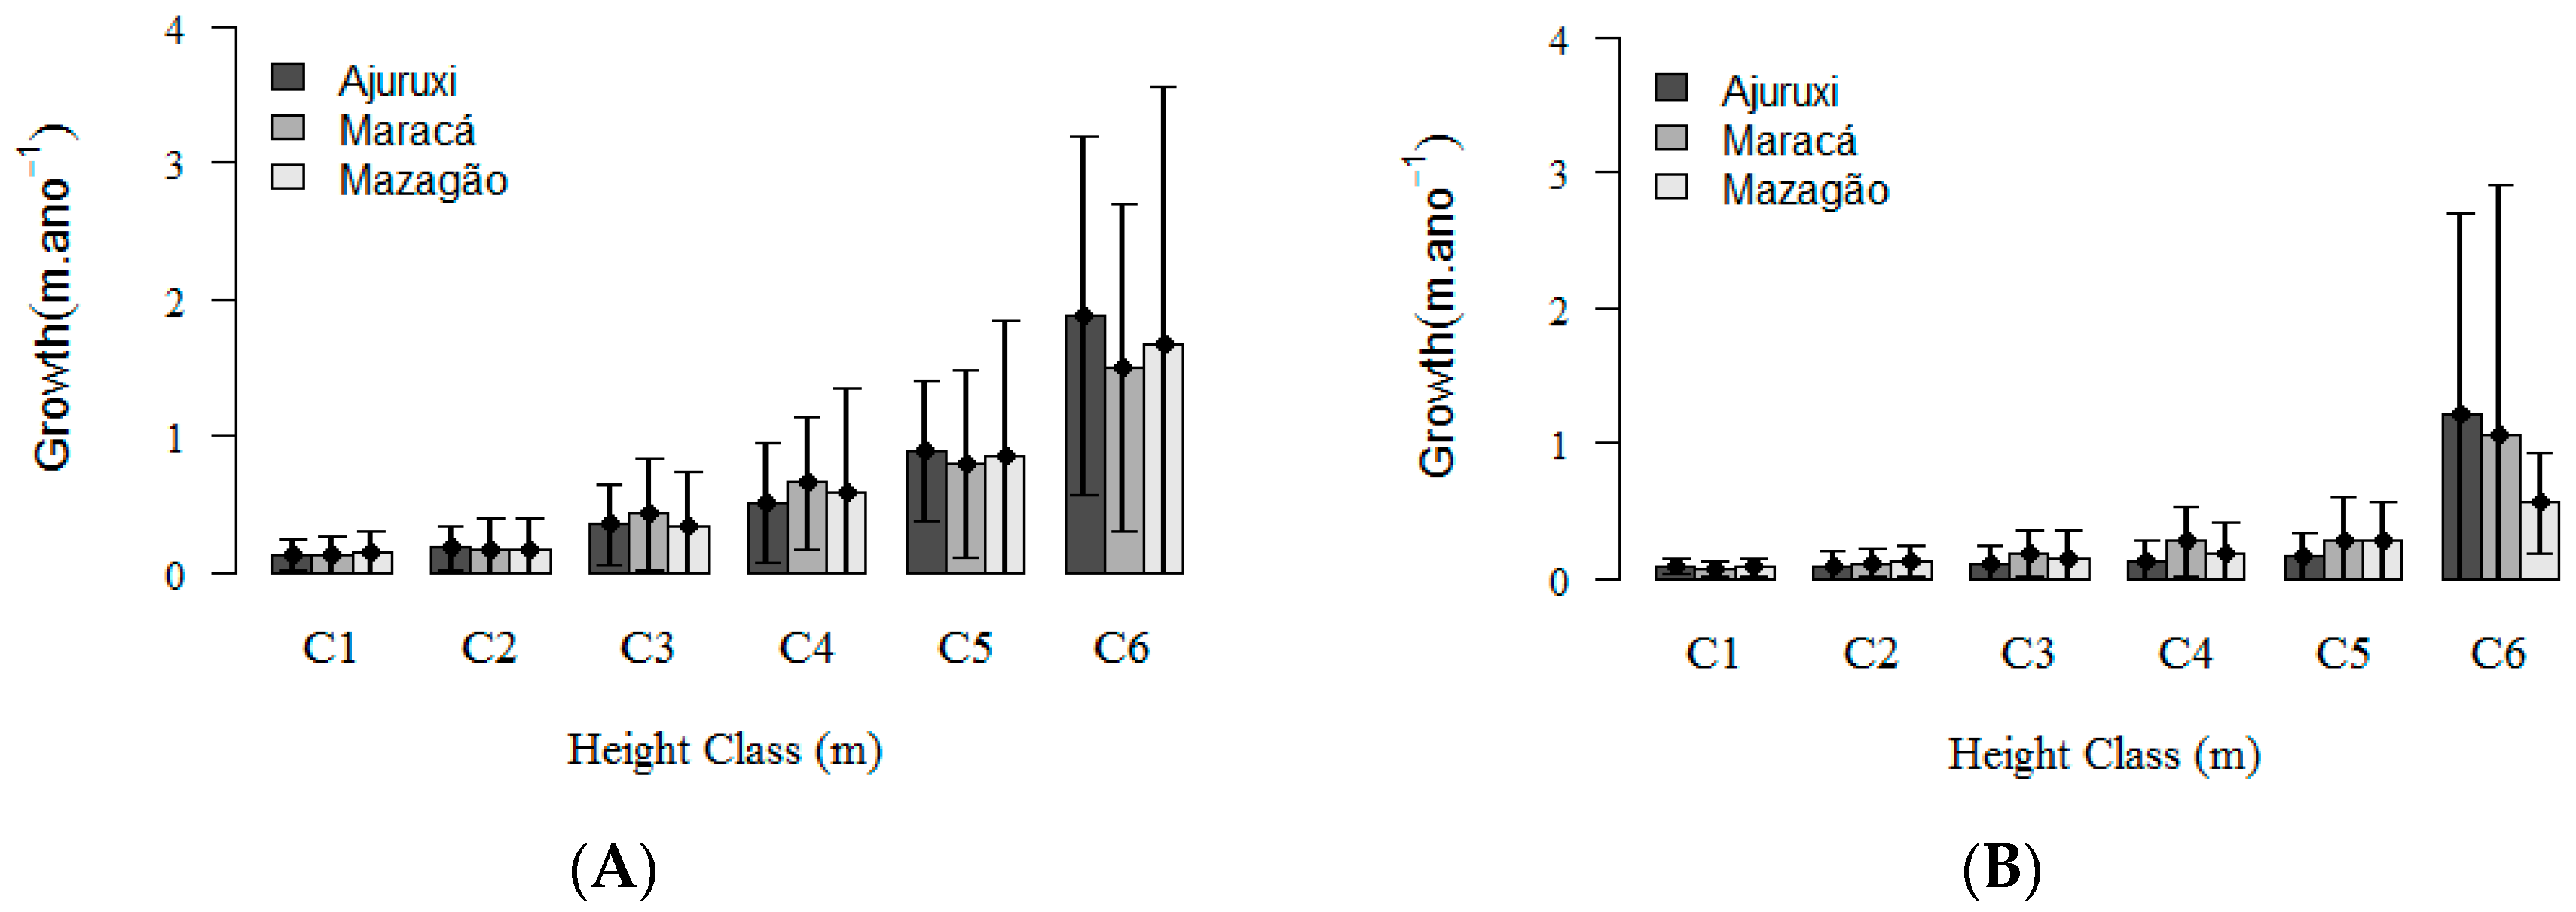
3.1. Natural Regeneration Dynamics

Total absolute abundance sampled in 2012 in the three regions was 4721 regenerating individuals. In 2013, it was 5614 and in 2015 it was 2888 individuals. There was no significant difference in density between the regions (Residual degrees of freedom—GL = 18, F = 1.05, p = 0.387). However, there was a significant difference between years (GL = 18, F = 32.15, p < 0.001). The interaction between year and region was not significant (GL = 18, F = 18.09, p = 0.411).
Between 2012 and 2013, the regeneration rates (RR) in all regions were positive, and there were no significant differences between regions (GL = 9, F = 0.648, p = 0.546). However, between 2013 and 2015, RR was negative in all regions, and there was a significant difference in RR between Mazagão and Ajuruxi (GL = 9, F = 9.703, p = 0.005). These negative regeneration rates show that density of regenerating individuals was lower in 2015 than in 2013, which is corroborated by the data on total abundance and density of regenerating individuals in each year (Table 1).
The mortality rate from 2012 to 2013 differed significantly between all regions (GL = 9, F = 16.6, p = 0.001). The mortality rate from 2013 to 2015 was, on average, 55%, and reached 60% in Maracá, but there was no significant difference between regions (GL = 9, F = 0.1, p = 0.939) (Table 1).
The recruitment rate between 2012 and 2013 was positive, and there were significant differences between areas (GL = 9, F = 4.6, p = 0.042). Recruitment between 2013 and 2015 was lower than in the previous period, being on average 10.3% and reaching a maximum of 17% in Mazagão, with no significant difference between regions (GL = 9, F = 1.6, p = 0.254) (Table 1).
The pattern of height growth between 2012 and 2013 was the same for all three regions. The increase in height was lower in the smallest height classes, and increased with height class (Figure 2A). Between 2013 and 2015, there was no increase in height in the smallest height classes, and only the last class showed a trend for higher growth (Figure 2B).
Six-hundred and eleven individuals were recruited into the study population in Mazagão between 2012 and 2013, with 68.7% entering into the first height class and 19.1% entering straight into the second class. In 2012, there were 618 individuals in the first class, of which 58% remained in the same class in 2013, 6.7% moved to the second and 1.4% to the third class. Mortality was higher in the first (32%) and last (33%) classes (Table 2). Between 2013 and 2015, 297 individuals were recruited into the population in Mazagão, with 62.2% entering into the first height class. There was recruitment into all height classes, and recruitment decreased with increasing height class. In 2013, there were 809 individuals in the first height class, of which 36.3% remained in the same class in 2015 and 10.3% moved to the second class. Mortality in the first class was 52.7%, reaching 84% in the last class (Table 2).
Between 2012 and 2013, in Maracá, 598 individuals were recruited with 73.2% entering into the first height class. In 2012, there were 454 individuals in the first height class, of which 42% did not reach the height necessary to move to the second class, with only 3.9% making this transition. In Maracá, the mortality rate was also higher in the first (53.7%) and last (46.4%) classes (Table 3). In Maracá between 2013 and 2015, 96 individuals were recruited, with 46.8% entering into the first height class. There was also recruitment into the other height classes, except into the class from 4.5 < 5.5 m. In 2013, there were 636 individuals in the first height class, of which 35.5% remained and only 8.9% moved to the second class. In this region, mortality in the first size class was 54.8%, reaching 66.6% in the last class (Table 3).
In Ajuruxi, in 2012–2013, there were the largest number of recruits (745 individuals), concentrated in the first (52.7%) and second (24.9%) classes. In the first year of monitoring, 493 regenerating individuals were in the first height class, and 808 in the second class. Mortality was highest in the last class (53.6%) (Table 4).
In Ajuruxi, 130 individuals entered the population in 2015, of which 43.8% went straight into the second height class (1.51 < 2.50 m). In 2013, there were 734 and 803 regenerating individuals in the first and second height classes, respectively, with 29.8% remaining in the first class in 2015 and 38.6% remaining in the second class. Mortality was highest in the last class (86%) (Table 4).

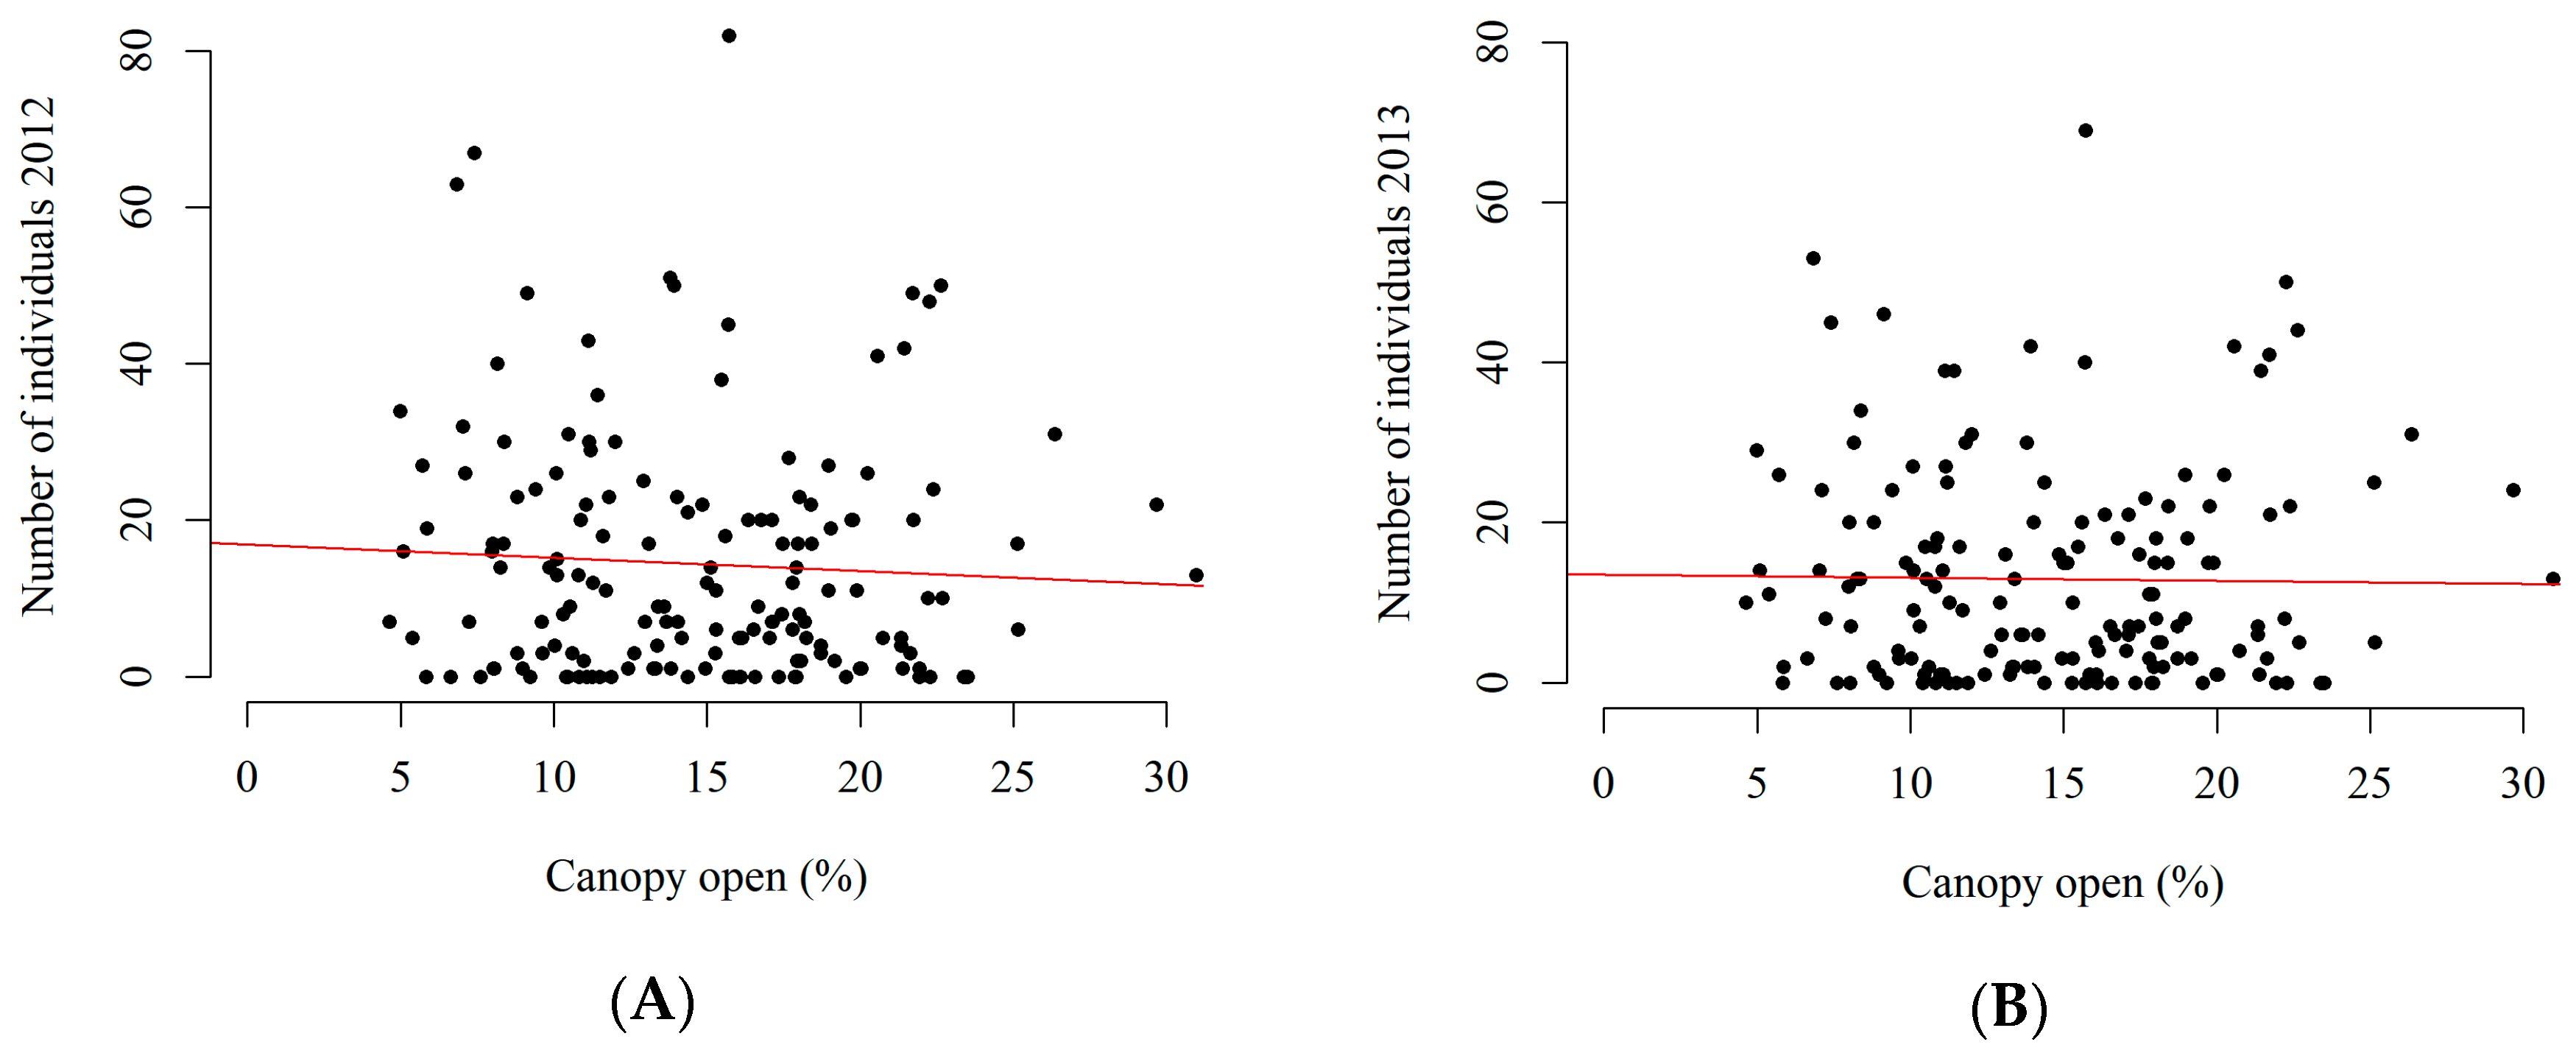
3.2. Canopy Openness and Abundance of Regenerating Individuals

Based on the hemispherical photos, calculated canopy openness varied between 4.66 and 30.97%. There was no relationship between total abundance of regenerating individuals of M. paraensis and canopy openness in either 2012 (GL = 158, R2 = 0.0028, p = 0.229), or 2013 (GL = 158, R2 = 0.0052, p = 0.177) (Figure 3).

4. Discussion

4.1. Regeneration Dynamics of Mora paraensis

The density of regenerating individuals of M. paraensis was high in all three study years (Table 1), even in 2015 when the density was reduced compared with the previous years. These individuals constitute a dense seedling bank, which allows for the replacement of trees that die or are extracted for timber. Average density of regenerating individuals was highest in Ajuruxi, with more than 2983 ind. ha−1, though the difference between regions was not significant. Of the three study regions, Ajuruxi is the furthest from the mouth of the Amazon River, and also has the largest drainage network (as can be seen in Figure 1) and the largest density of adult trees of M. paraensis [28]. Taken together, this means that Ajuruxi floods less than the other study regions, which could help to explain the observed positive regeneration rate and reduced mortality of M. paraensis in the region in 2012–2013.
Previous work carried out in floodplain forests in the same municipality found an average of 73 ind. ha−1 of adult M. paraensis, and that relative density is high (17.65% of the total basal area of the forest) [4], indicating that the species is dominant [5,7,11]. However, Rabelo [41] found a total density (all individuals, not just adult trees) of M. paraensis of 705 plants ha−1 in a wider study of regeneration of estuarine ecosystems in the state of Amapá. High relative density of adults also helps to explain the high density of regenerating individuals as, despite uncontrolled timber exploitation, there are still many reproductive adults in the region. A high density of regenerating individuals may be considered to be a survival strategy in shade-tolerant species, helping to guarantee sustainability over time [42].
The fruit of M. paraensis is a 20 cm long legume that contains two to four large seeds and a high reserve for the establishment of seedlings (Table S1). The seeds germinate and grow quickly, with the process beginning eight days later, and 100% germination occurring around day 48 (Figure S1) (unpublished data, see Supplementary Materials Figure S1 and Table S1). The species is shade tolerant, and forms a seedling bank with a high density of regenerating individuals. In general, the reproductive capacity of the species is high, and the dynamics of establishment of regenerating individuals and entry into adult classes are dependent on changes in biotic and abiotic factors over time. Indeed, diverse factors contribute to explain the balance between recruitment and mortality, as expressed by the regeneration rate. In forests, the natural regeneration process in its strictest sense is the autogenous mechanism of perpetuation of tree species, which is affected by rainfall, climate, solar radiation, and the availability of, and competition for, nutrients [43]. Analysis of natural regeneration rates for isolated species allows for conclusions to be drawn about competitive advantage, where species with a negative total RR are at a disadvantage compared with a species with a zero or positive RR, reflecting a predominance of mortality over recruitment and growth [44].
The natural regeneration rate (RR) of M. paraensis during the period 2012–2013 was always positive, as reflected in the increased density of the species in 2013. However, at the end of the 2013–2015 monitoring period, RR was negative in all regions, with the abundance of regenerating individuals and the total density of all inventoried individuals lower in 2015 than in 2013. This observed dynamic of the regeneration process, switching from a positive regeneration rate to a negative one, was consistent and occurred in all three study regions. This suggests that factors acting across the wider region, such as climate variation, rather than local factors, affected this dynamic.
Climate-related, continental-scale forest mortality events have been observed with increasing frequency during the past 20 years [45]. In 2015, there was a strong “El Niño” effect across the Amazon region [46], which contributed to reduced precipitation and increased temperatures. In the study region, the 2015 annual average temperature was 27.5 °C, 0.9 degrees warmer than the climatological norm based on 30 years of data [47]. The maximum and minimum absolute temperatures were also found to be higher in 2015, and the dry period (precipitation < 100 mm) extended for 6 months (July to December), compared to the usual 3-month period (September to November). This climatic phenomenon may help to explain the negative regeneration rate observed between 2013 and 2015, given that mortality was over 50% in all regions. Very high temperatures can cause denaturation of proteins and, in association with low soil water availability, may cause plant death, particularly among young individuals [48]. In the Amazonian floodplain forests, during the period of lowest rainfall of the Amazonian summer, most areas remain unflooded most of the time [49].
However, recruitment rates were positive in all regions and periods evaluated, showing that the adult trees maintained capacity to produce seeds, and as such ‘feed’ new individuals into the study plots. However, in all regions, there was a reduction in recruitment at the end of the study period, as reflected in the negative regeneration rates in 2013–2015. Variations in recruitment rates may be related to the viability of fruits and seeds produced by the trees [50]. Flowering and fruiting may have been higher in the first than in the second monitoring period, leading to a higher density of recruits. A longer period of observation would be necessary in order to verify the timing of these phenological events, and the intensity of production of viable seeds.
Another key factor likely to affect recruitment in estuarine floodplain forests is the continuous flow of the tides, determined by two daily cycles of flood and ebb that carry floating seeds far away from the parent trees. As such, hydrochory is the main mechanism of seed dispersal in these environments, occurring in the period of highest precipitation and highest tides in the region [25]. The seeds may be transported over long distances owing to the numerous drainage channels that criss-cross the region and feed in to the large rivers [5]. As rainfall was lower in 2015, reduced hydrochory may have directly influenced recruitment rates in the study period [44]. Reduced rainfall may have reduced both the timing and the reach of flooding, and as such the dispersal capacity of seeds of M. paraensis, which are adapted to float and show hydrochoric dispersal. This suggest that, in the second study period, recruitment may have been more related to differences in the quantity of matrices in each region, which may explain the significant between-region differences in 2013–2015. In the floodplain forests, flotation capacity is considered to be the most important factor for seed dispersal, as flotation can increase seed dispersal distances [51,52].
Increase in tree height was lowest in the smallest size classes, and increased with size class. The smallest regenerating individuals are more completely submerged by the tidal floodwaters, and as such need to invest more in diameter growth to be able to withstand the force of the flood. Larger individuals can invest more in height growth to optimise their ability to access the little light that reaches the understorey and therefore carry out photosynthesis. In the first study period (2012–2013), the mean increase in height occurred in all classes, but in the second period (2013–2015) only the largest size classes showed notably higher growth than the others, suggesting that climatic changes may also have affected growth of the smaller individuals. However, even with high mortality at the onset of vegetative growth, individuals which achieve some stability will be able to maintain themselves into adulthood [53].
The changes in the distribution of individuals between height classes were smaller in 2012–2013 than in 2013–2015, particularly in the smaller height classes. However, this apparent population stability may, in fact, reflect the shorter interval between samples (one rather than two years). In previous studies that have used transition matrices to evaluate the dynamics of individual trees between diametric size classes in natural forests, some authors have observed that the probability of remaining in the same class is higher in shorter time periods: two years [42], three years [40] and four years [54]. As such, when the observation period is shorter, the probability of remaining in the same class is higher, and when the period is longer, the probability of transitioning between classes increases. The probability of recruitment was highest in the first size class, in both study periods, except in Ajuruxi in 2013–2015, when recruitment was higher in the second size class. This is also probably due to the longer interval between samples, allowing for more seedling growth, and also the high density of individuals in Ajuruxi.
There was no significant trend in mortality across height classes in either study period, with smaller and taller seedlings as likely to die as each other, up to the limit of 5 cm DBH. However, in 2013–2015, there was a relative increase in the probability of mortality, particularly in the largest height class. These results are corroborated by the work of Swaine and Whitmore [55], who assert that in forests in dynamic equilibrium, mortality occurs independently of tree size. In this sense, it can be inferred that the population of M. paraensis is in dynamic equilibrium in the forest. Or rather, structural modifications and natural changes in dynamics occur in accordance with variation in environmental factors that can affect production and dispersal of seeds and the capacity of seedlings to establish.

4.2. Relationship with Canopy Openness

At this level of canopy cover, where the maximum value reached was ~30%, no association with the total abundance of regenerating individuals was observed. This suggests that this species employs a seedling bank strategy, which is typical of later-successional species for which light availability is not a key factor in establishment. Indeed, the demand for light and the regeneration strategy of plant species are related to potential growth rate [56], and the dependence on canopy openness for germination and sapling establishment has been used to define the difference between pioneer and non-pioneer species [55,57]. However, this relationship between canopy openness and seedling establishment is not seen for M. paraensis in floodplain forest environments.
The tendency for recruitment to decrease and mortality to increase with increasing gap size and canopy openness has been previously observed [58,59]. Gaps in the canopy promote rapid seedling establishment from the first to the second year, after which recruitment, and consequently plant density, is limited by competition. Higher levels of recruitment of fast growth pioneers, as expressed by their high relative density in larger canopy gaps, creates micro-environments where competition is much stronger than in smaller gaps, promoting higher mortality rates and, at the same time, inhibiting seed germination, plant establishment, and recruitment. Similar effects for recruitment, mortality, and plant density have been reported before in natural and artificial gaps [60,61]. However, whether these microenvironments are changing the level of resources available and the efficiency of recruitment or ingress is unknown [58]. In this environment, factors such as flood dynamics and micro-relief of the area may be more important determinants of regeneration sites, owing to seed accumulation.
Indeed, these previous studies have shown that some species, for example, Cedrela sp. and Schizolobium amazonicum Hub., benefit from canopy gaps and, at least in the first five years after gap creation, the relative density of saplings of these species was significantly higher in smaller gaps [62]. For most species, sampling under a closed canopy reveals large discontinuities in distribution, even including the complete absence of juveniles in some species. In studies of clearings, juveniles of some species are present, where they are absent from areas with a closed canopy [57].
In ecological terms, the canopy has a large influence in shrub and tree species regeneration, acting as a physical barrier to rain drops and protecting the soil from erosion [63]. Despite the relatively recent nature of studies on the canopy, understanding how this structure influences ecological processes is important for understanding ecosystem dynamics, as changes in canopy cover directly influence the availability and distribution of light in the understorey [64].

5. Conclusions

The species Mora paraensis (pracuúba) shows a high abundance of regenerating individuals in floodplain forests of the Amazon River estuary, which guarantees the supply of juveniles necessary to replace adults that die naturally or are harvested for timber within a management system. However, the dynamics of the natural regeneration process vary between years, with periods more favourable for positive regeneration that may alternate with periods of negative rates. This may lead to delays in the recruitment of adults, and if intense and disorganised timber exploitation continues without the implementation of management criteria, population stability may be affected, with knock-on effects for the timber supply capacity from these forests.

Supplementary Materials

The following are available online at https://www.mdpi.com/1999-4907/9/2/54/s1, Table S1: Biometry of Mora paraensis seeds, harvested in the southwest of Amapá, Brazilian Amazon, Figure S1: Seed germination of Mora paraensis in the southwest of Amapá, Brazilian Amazon.

Author Contributions

All the authors have made a substantial contribution towards the successful completion of this manuscript. They all have been involved in designing the study, drafting the manuscript and engaging in critical discussion. Z.P.M. collected the data in the field, carried out data analysis and was the main editor of the article, which is one of the chapters of his doctoral thesis. M.C.G. was involved in work planning, obtaining funding, collecting and analyzing data and reviewing the manuscript, is the Advisor of the thesis work and project coordinator to which the work is linked. A.P.B.B. carried out analyses and was involved in the discussion of the results. D.A.S.d.S. collected and analysed the data. All authors read and approved the final manuscript.

Conflicts of Interest

The authors declare no conflict of interest.

References

  1. Santos, S.R.M.; Miranda, I.S.; Tourinho, M.M. Análise florística e estrutural de sistemas agroflorestais das várzeas do rio Juba, Cametá, Pará. Acta Amazon. 2004, 34, 251–263. [Google Scholar] [CrossRef]
  2. Almeida, S.S.; Amaral, D.D.; Silva, A.S.L. Análise florística e estrutura de florestas de várzea no estuário amazônico. Acta Amazon. 2004, 34, 513–524. [Google Scholar] [CrossRef]
  3. Rabelo, F.G.; Zarin, D.J.; Oliveira, F.A.; Jardim, F.C.S. Regeneração natural de florestas estuarinas na região do rio Amazonas-Amapá-Brasil. Rev. Cienc. Agrar. 2000, 2, 129–138. [Google Scholar]
  4. Carim, M.J.V.; Jardim, M.A.G.; Medeiros, T.D.S. Composição florística e estrutura de floresta de várzea no município de Mazagão, Estado do Pará, Brasil. Sci. For. 2008, 36, 191–201. [Google Scholar]
  5. Fortini, L.B.; Zarin, D.J. Population dynamics and management of Amazon tidal floodplain forests: Links to the past, present and future. For. Ecol. Manag. 2011, 261, 551–561. [Google Scholar] [CrossRef]
  6. Queiroz, J.A.L.; Mochiutti, S.; Machado, A.S.; Galvão, F. Composição florística e estrutura de floresta em várzea alta estuarina Amazônica. Rev. Floresta 2005, 35, 41–56. [Google Scholar] [CrossRef]
  7. Queiroz, J.A.L.; Machado, S.A. Potencial de Utilização Madeireira de Espécies Florestais de Várzea no Município de Mazagão no Estado do Amapá. Rev. Floresta 2007, 37, 293–302. [Google Scholar] [CrossRef]
  8. Wittmann, F.; Householder, E.; Piedade, M.T.F.; Junk, W.J. Habitat specificity, endemism and the neotropical distribution of Amazonian white-water floodplain trees. Ecography 2013, 36, 690–707. [Google Scholar] [CrossRef]
  9. Jardim, M.A.G.; Vieira, I.C.G. Composição florística e estrutura de uma floresta de várzea do estuário Amazônico, Ilha do Combu, Estado do Pará. Brazil. Bol. Mus. Para. Emílio Goeldi 2001, 17, 333–354. [Google Scholar]
  10. Rodrigues, L.M.B.; Lira, A.U.S.; Santos, F.A.; Jardim, M.A.G. Composição florística e usos das espécies vegetais de dois ambientes de floresta de várzea. Rev. Bras. Farm. 2006, 87, 45–48. [Google Scholar]
  11. Lima, R.B.; Aparício, P.S.; Ferreira, R.L.C.; Silva, W.C.; Guedes, M.C.; Oliveira, C.P.; Silva, D.A.S.; Batista, A.P.B. Volumetria e classificação da capacidade produtiva para Mora paraensis (Ducke) no estuário amapaense. Sci. For. 2014, 42, 141–154. [Google Scholar]
  12. Castilho, N.T.F. Manejo da Regeneração Natural de Pau-Mulato em Floresta de Várzea do Estuário Amazônico. Master’s Thesis, Universidade Federal do Amapá, Macapá, Brazil, 2013. [Google Scholar]
  13. Lieberman, S.S.; Dock, C.F. Analysis of the leaf litter arthropod fauna of a lowland tropical evergreen forest site (La Selva, Costa Rica). Rev. Biol. Trop. 1982, 30, 27–34. [Google Scholar]
  14. Hoffmann, J. Assessing the effects of environmental changes in a landscape by means of ecological characteristics of plant species. Landsc. Urban Plan. 1998, 41, 239–248. [Google Scholar] [CrossRef]
  15. Almeida, D.R.; Cogliatti-Carvalho, L.; Rocha, C.F.D. As bromeliáceas da Mata Atlântica da Ilha Grande, RJ: Composição e diversidade de espécies em três ambientes diferentes. Bromélia 1998, 5, 54–65. [Google Scholar]
  16. Clark, D.A.; Clark, D.B. Population ecology and microhabitat distribution of Dipteryx panamensis, a neotropical rain forest emergent tree. Biotropica 1987, 19, 236–244. [Google Scholar] [CrossRef]
  17. Costa, F.R.C.; Magnusson, W.E. Effects of selective logging on the diversity and abundance of flowering and fruiting understory plants on a Central Amazonian Forest. Biotropica 2003, 35, 103–114. [Google Scholar] [CrossRef]
  18. Viana, A.C.N.; Jardim, F.C.S. Natural regeneration dynamic of Couratari guianesis in a tropical forest selectively logged in Moju, state of Para, Brazil. Rev. Cienc. Agrar. 2013, 56, 112–119. [Google Scholar]
  19. Gama, J.R.V.; Botelho, S.A.; Bentes-Gama, M.M.; Scolforo, J.R.S. Estrutura e potencial futuro de utilização da regeneração natural de floresta de várzea alta no município de Afuá, Estado do Pará, Brasil. Cienc. Florest. 2003, 13, 71–82. [Google Scholar] [CrossRef]
  20. Hüller, A.; Rauber, A.; Wolski, M.S.; Almeida, N.L.; De Wolski, S.R.S. Regeneração natural do componente arbóreo e arbustivo do parque natural municipal de Santo Ângelo-RS. Rev. Soc. Bras. Arborização Urbana 2011, 6, 25–35. [Google Scholar]
  21. Klauberg, C.; Vidal, E.; Silva, C.A.; Hudak, A.T.; Oliveira, M.; Higuchi, P. Short-Term Effects of Reduced-Impact Logging on Copaifera spp. (Fabaceae) Regeneration in Eastern Amazon. Forests 2017, 8, 257. [Google Scholar] [CrossRef]
  22. Leal Filho, N.; Sena, J.S.; Santos, G.R. Variações espaço-temporais no estoque de sementes do solo na floresta amazônica. Acta Amazon. 2013, 43, 305–314. [Google Scholar] [CrossRef]
  23. Junk, W.J.; Piedade, M.T. Plant life in the floodplain with special reference to herbaceous plants. In The Central Amazon Floodplain; Junk, W.J., Ed.; Springer: New York, NY, USA, 1997; pp. 147–185. [Google Scholar]
  24. Wittmann, F.; Junk, W. Sapling communities in Amazonian white-water forests. J. Biogeogr. 2003, 30, 1533–1544. [Google Scholar] [CrossRef]
  25. Cunha, A.C.; Mustin, K.; Santos, E.S.; Santos, E.W.G.; Guedes, M.C.; Cunha, H.F.A.; Rosman, P.C.C.; Sternberg, L.S.L. Hydrodynamics and seed dispersal in the lower Amazon. Freshw. Biol. 2017, 62, 1721–1729. [Google Scholar] [CrossRef]
  26. Salomão, P.; Terezo, E.F.M.; Jardim, M.A.G. Manejo Florestal nas Várzeas: Oportunidades e Desafios; MPEG: Belém, Portugal, 2007; 210p. [Google Scholar]
  27. Ward, N.D.; Keil, R.G.; Medeiros, P.M.; Brito, D.C.; Cunha, A.C.; Dittmar, T.; Richey, J.E. Degradation of terrestrially derived macromolecules in the Amazon River. Nat. Geosci. 2013, 6, 530–533. [Google Scholar] [CrossRef]
  28. Pinto, E.R. Solos, Hidrologia e Estrutura Populacional de Pracuubeiras em Florestas de Várzea do Estuário Amazônico. Master’s Thesis, Universidade Federal do Amapá, Macapá, Brazil, 2014. [Google Scholar]
  29. Instituto Nacional de Meteorologia. Ministério da Agricultura, Pecuária e Abastecimento. 2015. Available online: http://www.inmet.gov.br (accessed on 14 November 2017).
  30. Fortini, L.B.; Carter, D.R. The economic viability of smallholder timber production under expanding acai palm production in the Amazon Estuary. J. For. Econ. 2014, 20, 223–235. [Google Scholar] [CrossRef]
  31. Pinedo-Vasquez, M. Changing in soil formation and vegetation on silt bars and backslopes of levees following intensive production of rice and jute. In Várzea: Diversity, Development, and Conservation of Amazonias Whitewater Floodplains; Padoch, C., Ayres, J., Pinedo-Vasquez, M., Henderson, A., Eds.; The New York Botanical Garden Press: Bronx, NY, USA, 1999; pp. 301–311. [Google Scholar]
  32. Instituto Brasileiro de Geografia e Estatística (IBGE). Manual Técnico da Vegetação Brasileira; Instituto Brasileiro de Geografia e Estatística: Rio de Janeiro, Brazil, 2012; 275p.
  33. Rich, P.M. Characterizing Plant Canopies with Hemispherical Photographs. Remote Sens. Rev. 1990, 5, 13–29. [Google Scholar] [CrossRef]
  34. Frazer, G.W.; Canham, C.D.; Lertzman, K.P. Gap Light Analyzer. Imaging Software to Extract Canopy Structure and Gal Light Transmission Indices from True-colour Fisheye Photographs, User’s Manual and Program Documentation; Simon Fraser University: Burnaby, BC, Canada; The Institute of Ecosystem Studies: Millbrook, AL, USA, 1999. [Google Scholar]
  35. Volpato, M.M.L. Regeneração Natural em Uma Floresta Secundária no Domínio de Mata Atlântica: Uma Análise Fitossociológica. Master’s Thesis, Universidade Federal de Viçosa, Viçosa, Brazil, 1994. [Google Scholar]
  36. Mory, A.M.; Jardim, F.C.S. Comportamento de Eschweilera odora (Poepp.) Miers. (Matamatá-amarelo) em diferentes níveis de desbaste por anelamento. Rev. Cienc. Agrar. 2001, 36, 29–53. [Google Scholar]
  37. R Core Team. R: A Language and Environment for Statistical Computing, version 1.0.143 R; Foundation for Statistical Computing: Vienna, Austria, 2016; Available online: https://www.R-project.org/ (accessed on 10 October 2017).
  38. De Mendiburu, F. Package Agricolae. R Package, Version 1.2-1; Universidad Nacional Agraria: Lima, Peru, 2015; Available online: http://cran.rproject.org/web/packages/agricolae (accessed on 10 October 2017).
  39. Souza, A.L.; Soares, C.P.B. Florestas Nativas: Estrutura, Dinâmica e Manejo; UFV: Viçosa, Brazil, 2013; 322p. [Google Scholar]
  40. Batista, A.P.B.; Rodal, M.J.N.; Silva, J.A.A.; Silva, A.C.B.L.; Alves Junior, F.T.; Mello, J.M. Dynamics and Prediction of Diametric Structure in Two Atlantic Forest Fragments in Northeastern Brazil. Rev. Árvore 2016, 40, 307–317. [Google Scholar] [CrossRef]
  41. Rabelo, F.G.; Zarin, D.J.; Oliveira, F.A.; Jardim, F.C.S. Regeneração natural de florestas estuarinas na região do rio Amazonas Amapá-Brasil. Rev. Cienc. Agrar. 2000, 34, 129–137. [Google Scholar]
  42. Vasconcelos, L.M.R. Avaliação da Dinâmica Populacional de Rinorea guianensis Aublet (Acariquarana) Violaceae, em Uma Floresta Tropical Primária Explorada Seletivamente, Moju—PA. Master’s Thesis, Universidade Federal Rural da Amazônia, Belém, Brazil, 2004. [Google Scholar]
  43. Maciel, M.N.M.; Watzlawick, L.F.; Schoeninger, E.R.; Yamaji, F.M. Efeito da radiação solar na dinâmica de uma floresta. Rev. Cienc. Exatas Nat. 2002, 4, 101–114. [Google Scholar]
  44. Jardim, F.C.; Da, S.; Hosokawa, R.T. Estrutura da floresta equatorial úmida da Estação Experimental de Silvicultura Tropical do INPA. Acta Amazon. 1987, 16/17, 411–508. [Google Scholar] [CrossRef]
  45. Allen, C.D.; Macalady, A.; Chenchouni, H.; Bachelet, D.; McDowell, N.; Vennetier, M.; Kitzberger, T.; Rigling, A.; Breshears, D.D.; Hogg, E.T.; et al. A global overview of drought and heat-induced tree mortality reveals emerging climate change risks for forests. For. Ecol. Manag. 2010, 259, 660–684. [Google Scholar] [CrossRef]
  46. Vogt, N.D.; Pinedo-Vasquez, M.; Brondízio, E.S.; Rabelo, F.G.; Fernandes, K.; Almeida, O.; Rivero, S.; Deadman, P.J.; Dou, J. Local Ecological Knowledge and Incremental Adaptation to Changing Flood Patterns in the Amazon Delta. Sustain. Sci. 2016, 11, 624–643. [Google Scholar] [CrossRef]
  47. Marengo, J.A.; Alves, L.M.; Alvala, R.C.S.; Cunha, A.P.; Brito, S.; Moraes, O.L.L. Climatic characteristics of the 2010–2016 drought in the semiarid Northeast Brazil region. Ann. Braz. Acad. Sci. 2017. [Google Scholar] [CrossRef] [PubMed]
  48. Sevanto, S.; Mcdowell, N.G.; Dickman, L.T.; Pangle, R.; Pockman, W.T. How do trees die? A test of the hydraulic failure and carbon starvation hypotheses. Plant Cell Environ. 2017, 37, 153–161. [Google Scholar] [CrossRef] [PubMed]
  49. Gomes Sobrinho, T.R. Estrutura, Funcionamento e Evolução das Paisagens Cobertas por Savanas na Reserva Extrativista do Rio Cajari, Amazônia Oriental, Brasil. Ph.D. Thesis, Pontífica Universidade Católica de Minas Gerais, Belo Horizonte, Brazil, 2017. [Google Scholar]
  50. Wright, S.J.; Muller-Landau, H.C.; Condit, R.; Hubbell, S.P. Gap-dependent recruitment, realized vital rates, and size distributions of tropical trees. Ecology 2003, 84, 3174–3185. [Google Scholar] [CrossRef]
  51. Kubitzki, K.; Ziburski, A. Seed Dispersal in Floodplain Forest of Amazonian. Biotropica 1994, 26, 30–43. [Google Scholar] [CrossRef]
  52. Oliveira-Wittmann, A.; Piedade, M.T.F.; Parolin, P.; Wittmann, F. Germination in four low-várzea tree species of Central Amazonia. Aquat. Bot. 2007, 86, 197–203. [Google Scholar] [CrossRef]
  53. Vasconcelos, S.S.; Higuchi, N.; Oliveira, M.V.N. Projeção da distribuição diamétrica de uma floresta explorada seletivamente na Amazônia Ocidental. Acta Amazon. 2009, 39, 71–80. [Google Scholar] [CrossRef]
  54. Teixeira, L.M.; Chambers, J.Q.; Silva, A.R.; Lima, A.J.N.; Carneiro, V.M.C.; Santos, J.; Higuchi, N. Projeção da dinâmica da floresta natural de Terra-firme, região de Manaus-AM, com o uso da cadeia de transição probabilística de Markov. Acta Amazon. 2007, 37, 377–384. [Google Scholar] [CrossRef]
  55. Swaine, M.D.; Whitmore, T.C. On the definition of ecological species groups in tropical rain forests. Vegetatio 1987, 75, 81–86. [Google Scholar] [CrossRef]
  56. Finegan, B.; Camacho, M. Stand dynamics in a logged and silviculturally treated Costa Rica rain Forest, 1988–1996. For. Ecol. Manag. 1999, 121, 177–189. [Google Scholar] [CrossRef]
  57. Jardim, F.C.S. Natural regeneration in tropical forests. Rev. Cienc. Agrar. 2015, 58, 105–113. [Google Scholar]
  58. d’Oliveira, M.V.N. Sustainable Forest Management for Small Farmers in Acre State in the Brazilian Amazon. Ph.D. Thesis, University of Aberdeen, Aberdeen, UK, 2000. [Google Scholar]
  59. D’Oliveira, M.V.N. Regeneração florestal em clareiras artificiais após dois anos de abertura de dossel no Estado do Acre: Amazônia Ocidental. In Embrapa Acre: Ciência e Tecnologia Para o Desenvolvimento Sustentável do Sudoeste da Amazônia; Gonçaalvez, R.C., de Oliveira, L.C., Eds.; Embrapa Acre: Rio Branco, Brazil, 2009; pp. 68–96. [Google Scholar]
  60. Dupuy, J.M.; Chazdon, R.L. Effects of vegetation cover on seedling and sapling dynamics in secondary tropical wet forests in Costa Rica. J. Trop. Ecol. 2006, 22, 65–76. [Google Scholar] [CrossRef]
  61. Dupuy, J.M.; Chazdon, R.L. Interacting effects of canopy gap, understorey vegetation and leaf litter on tree seedling recruitment and composition in tropical secondary forests. For. Ecol. Manag. 2008, 255, 3716–3725. [Google Scholar] [CrossRef]
  62. D’Oliveira, M.V.N.; Braz, E.; d’Oliveira, M.V.N.; Ribas, L.A. Forest regeneration in artificial gaps twelve years after canopy opening in Acre State Western Amazon. For. Ecol. Manag. 2011, 261, 1722–1731. [Google Scholar] [CrossRef]
  63. Lowman, M.D.; Wittman, P.K. Forest Canopies: Methods, Hypotheses and Future directions. Annu. Rev. Ecol. Syst. 1996, 27, 55–81. [Google Scholar] [CrossRef]
  64. Engelbrecht, B.M.J.; Herz, H.M. Evaluation of Different Methods to Estimate Understory Light Conditions in Tropical Forests. J. Trop. Ecol. 2001, 17, 207–224. [Google Scholar] [CrossRef]
Figure 1. Location of the study area in the southeast of Amapá, in the Brazilian Amazon.
Forests 09 00054 g001
Figure 2. Average growth of the natural regeneration of Mora paraensis, in the southeast of Amapá, Brazil, eastern Amazonia, in function of height classes—C1 (0.5–1.50 m); C2 (1.51–2.50 m); C3 (2.51–3.50 m); C4 (3.51–4.50 m); C5 (4.51–5.50 m); C6 (5.51–6.50 m), between (A) 2012–2013 and (B) 2013–2015.
Forests 09 00054 g002
Figure 3. Number of regenerating individuals of M. paraensis in 2012 (A) and 2013 (B), as a function of canopy openness as measured in 2012, in estuarine floodplain forests of the Amazon River, municipality of Mazagão, state of Amapá, eastern Amazon.
Forests 09 00054 g003
Table 1. Density and demographic rates of regenerating individuals of Mora paraensis (height > 50 cm, diameter at breast height (DBH) < 5 cm), inventoried in floodplain forest in three regions (Mazagão, Maracá, Ajuruxi) of the eastern Amazon in 2012, 2013 and 2015.
ParametersMazagãoMaracáAjuruxi
Regenerating individuals 2012 (ind. ha−1)2248 (±831) ns1676 (±667) ns2472 (±951) ns
Regenerating individuals 2013 (ind. ha−1)2693 (±1107) ns1996 (±653) ns2983 (±1275) ns
Regenerating individuals 2015 (ind. ha−1)1543 (±554) ns937 (±255) ns1194 (±452) ns
Regeneration rate 2012–2013 (%)7.9 ns10.4 ns8.3 ns
Regeneration rate 2013–2015 (%)−22.0 ** a−29.0 ** ab−40.3 ** b
Mortality rate 2012–2013 (%)24.7 *** a43.4 *** b18.0 *** c
Mortality rate 2013–2015 (%)51.8 ns53.6 ns60.3 ns
Recruitment rate 2012–2013 (%)41.9 * ab66.6 * a31.4 * b
Recruitment rate 2013–2015 (%)17.4 ns8.7 ns4.8 ns
ns = not significant (p > 0.05); * = p < 0.05; ** = p < 0.01; *** = p < 0.001. Averages in the same row and followed by the same letter a, b, c were not significantly different from one another at the considered probability level.
Table 2. Probabilistic transition of height (m) classes for Mora paraensis in Mazagão, south-eastern Amapá, Brazil, eastern Amazon, for the period 2012 to 2013 and 2013 to 2015. Where: R = Recruitment; M = Mortality; C1 (0.50–1.50 m); C2 (1.51–2.50 m); C3 (2.51–3.50 m); C4 (3.51–4.50 m); C5 (4.51–5.50 m); C6 (5.51–6.50 m).
Height ClassC1C2C3C4C5C6M
R 2012–20130.6870.1910.0540.0290.0180.0190
R 2013–20150.6220.2280.0700.0330.0230.02020
C1 2012–20130.5800.0670.0140.0040.0030.0080.320
C1 2013–20150.3630.1030.0040000.527
C2 2012–201300.6000.1570.0350.00500.201
C2 2013–201500.5040.0730.0020.00200.416
C3 2012–2013000.6090.1430.0280.0280.189
C3 2013–2015000.4050.092000.502
C4 2012–20130000.5440.170.0710.205
C4 2013–20150000.3650.0870.0150.531
C5 2012–201300000.50.1950.304
C5 2013–201500000.1940.1380.666
C6 2012–2013000000.6660.333
C6 2013–2015000000.160.840
Table 3. Probabilistic transition of height (m) classes for Mora paraensis in Maracá, south-eastern Amapá, Brazil, eastern Amazon, for the period 2012 to 2013 and 2013 to 2015. Where R = Recruitment; M = Mortality; C1 (0.50–1.50 m); C2 (1.51–2.50 m); C3 (2.51–3.50 m); C4 (3.51–4.50 m); C5 (4.51–5.50 m); C6 (5.51–6.50 m).
Height ClassC1C2C3C4C5C6M
R 2012–20130.7320.1480.0430.0230.0160.0350
R 2013–20150.4680.2700.0720.12500.0620
C1 2012–20130.4200.0390.0020000.537
C1 2013–20150.3550.0890.001000.0040.548
C2 2012–201300.4820.1220.013000.381
C2 2013–201500.4770.0800.00800.0080.424
C3 2012–2013000.5540.1680.0480.0120.216
C3 2013–2015000.3360.1360.0180.0090.500
C4 2012–20130000.3600.1200.180.340
C4 2013–20150000.1920.0520.0170.736
C5 2012–201300000.3470.2170.434
C5 2013–201500000.2500.1070.642
C6 2012–2013000000.5350.464
C6 2013–2015000000.3330.666
Table 4. Probabilistic transition of height (m) classes for Mora paraensis in Ajuruxi, south-eastern Amapá, Brazil, eastern Amazon, for the period 2012 to 2013 and 2013 to 2015. Where: R = Recruitment; M = Mortality; C1 (0.50–1.50 m); C2 (1.51–2.50 m); C3 (2.51–3.50 m); C4 (3.51–4.50 m); C5 (4.51–5.50 m); C6 (5.51–6.50 m).
Height ClassC1C2C3C4C5C6M
R 2012–20130.5270.2490.1150.0460.0280.0320
R 2013–20150.2840.4380.1070.1230.0230.0230
C1 2012–20130.6220.0990.0040.00400.0040.265
C1 2013–20150.2980.1260.001000.0090.564
C2 2012–201300.6260.2040.0040.0020.0010.160
C2 2013–201500.3860.0820.00100.0030.526
C3 2012–2013000.6400.1980.0200.0020.139
C3 2013–2015000.3150.05600.0010.626
C4 2012–20130000.4640.2690.1070.158
C4 2013–20150000.2440.0270.0170.710
C5 2012–201300000.3210.3440.333
C5 2013–201500000.1930.0750.731
C6 2012–2013000000.4630.536
C6 2013–2015000000.1370.862

