Ecological Stoichiometric Characteristics of Two Typical Plantations in the Karst Ecosystem of Southwestern China
by
 , ,
, ,
Danbo Pang
1,2 ,
,
Genzhu Wang
1,2,
Guijing Li
1,2,
Yonglei Sun
1,2,
Yuguo Liu
3 and
Jinxing Zhou
1,2,* 1
Jianshui Research Station, School of Soil and Water Conservation, Beijing Forestry University, No. 35 Qinghua East Road, Haidian District, Beijing 100083, China
2
Key Laboratory of State Forestry Administration on Soil and Water Conservation, Beijing Forestry University, No. 35 Qinghua East Road, Haidian District, Beijing 100083, China
3
Institute of Desertification Studies, Chinese Academy of Forestry, No. 1 Dong Xiao Fu, Xiangshan Road, Haidian District, Beijing 100091, China
*
Author to whom correspondence should be addressed.
Forests 2018, 9(2), 56; https://doi.org/10.3390/f9020056
Submission received: 9 December 2017
/
Revised: 12 January 2018
/
Accepted: 19 January 2018
/
Published: 25 January 2018
(This article belongs to the Special Issue Nutrient Dynamics of Planted Forests)
Abstract
:Reforestation has been widely adopted to restore soil fertility and ecosystem service function in the rocky desertification region of southwestern China. However, there has been limited research concerning the stoichiometry of carbon (C), nitrogen (N), and phosphorus (P) and nutrient resorption rate of plantations in karst ecosystems. In this study, we selected plantations of Pinus yunnanensis Franch. (PY) and Eucalyptus maideni F. Muell. (EM) in Yunnan Province. The C, N, and P concentrations and the C:N:P stoichiometry in different soil layers (0–10 cm, 10–20 cm, and 20–30 cm) were examined. The nutrient limitation and nutrient resorption efficiency were also analyzed. The leaf C and N concentrations in the PY plantation were higher than that in the EM plantation; the P concentration demonstrated the opposite trend, both in green and senesced leaves. Soil C, N, and P concentrations in the EM plantation were much greater than in the PY plantation at all three depths and decreased with the depth of the soil. In addition, the high ratios of C:P, N:P, C:Available P, and N:Available P in soil coupled with the ratios of N:P in leaves indicate that the EM plantation has a greater P deficiency than the PY plantation. In the EM plantation, the relatively low P concentrations in senesced leaves indicates efficient TP (Total phosphorus) resorption, which highlights that the high reuse proficiency of P could have favored moderating P limitation in the karst ecosystem. This research aids in understanding the stoichiometric characteristics that mediate forest properties, and provides a basis for management of vegetation in karst ecosystems.
1. Introduction
Karst landscapes cover an area of 0.34 million km2 in southwestern China, accounting for nearly 15% of the world’s land surface [1,2]. Over the past several decades, the ecosystem in southwestern China has been degraded due to intensive anthropogenic disturbances, which have changed the soil fertility and ecosystem service function, resulting in the genesis of bare land [3,4]. Vegetation restoration and reforestation projects initiated by the Chinese government (e.g., the Green for Grain program and the Natural Forest Protection Project) have achieved limited success in the restoration of degraded land to maintain soil fertility and improve ecological conditions [5,6]. Plant growth and restoration in karst landscapes are largely influenced by water content, plant traits, and soil nutrient availability, including soil organic matter, nitrogen, and phosphorus [4,7,8,9,10].
The ecological stoichiometry of carbon (C), nitrogen (N), and phosphorus (P) is a powerful method to explore the biogeochemical cycle, coupling mechanisms (e.g., transformation, coordination, and balance), and nutrient limitation in terrestrial ecosystems [11,12,13]. Stoichiometry is closely related to ecological processes such as species composition and the adaptation of organisms to environmental stress [14]. Terrestrial ecosystems are complex due to conditions such as topography, vegetation, and anthropogenic interactions resulting in the spatial heterogeneity of the distribution and ratio of biogenic elements. In previous studies, the N:P ratio in leaves was shown to be indicative of nutrient limitation and nutrient imbalance for vegetative growth in various ecosystems [4,15,16]. The C:N:P ratio in soil directly reflects soil nutrients and element reserves, impacting plant nutritional status [17,18]. The ratios of C:N and C:P in soil have long been recognized as indicators of the source of organic matter, its state of decomposition, and its potential contribution to soil fertility [19]. The soil N:P ratio can also potentially be used to diagnose value and particular that changed by fertilization [20]. The plant and soil C:N:P stoichiometric characteristics require investigation within the karst ecosystem.
Pinus yunnanensis Franch. (PY), a conifer species native to China, is distributed in the Yunnan–Guizhou Plateau. This species is drought-resistant and tolerant of soils with low fertility; therefore, it is extensively used in reforestation efforts in southwestern China [21]. Another species commonly used in reforestation efforts in southwest China is Eucalyptus maideni (EM), which has been introduced to China from Australia. By the end of 2010, 3.68 × 10⁷ ha of Eucalyptus had been planted in plantations across southwest China due to its rapid growth, high adaptability, and economic value [22,23]. These two tree species are the most commonly used species for reforestation, especially in karst ecosystems. Investigations into the restoration of stoichiometric characteristics are important for developing vegetation recovery and management strategies.
There has been limited research concerning the stoichiometry of C, N, and P in the reforestation of karst ecosystems. In this study, we selected plantations of PY and EM from the same planting years in Yunnan Province, southwest China. The C, N, and P concentrations and the C:N:P stoichiometry in different soil layers and plant organs were examined. Nutrient limitation and nutrient resorption efficiency were also analyzed. The objectives of this study were to: (1) explore the differences in nutrient concentrations and stoichiometric characteristics between different species and organs; (2) quantify the differences in soil depth of C, N, and P concentrations and stoichiometric characteristics of the two plantations; and (3) provide evidence for nutrient limitation, nutrient resorption efficiency, and the mechanism for moderating nutrient deficiency in karst ecosystems. The ultimate goal of our findings is to provide the basis for improved vegetation restoration, management, and optimization of karst ecosystems.
2. Materials and Methods
2.1. Site Description
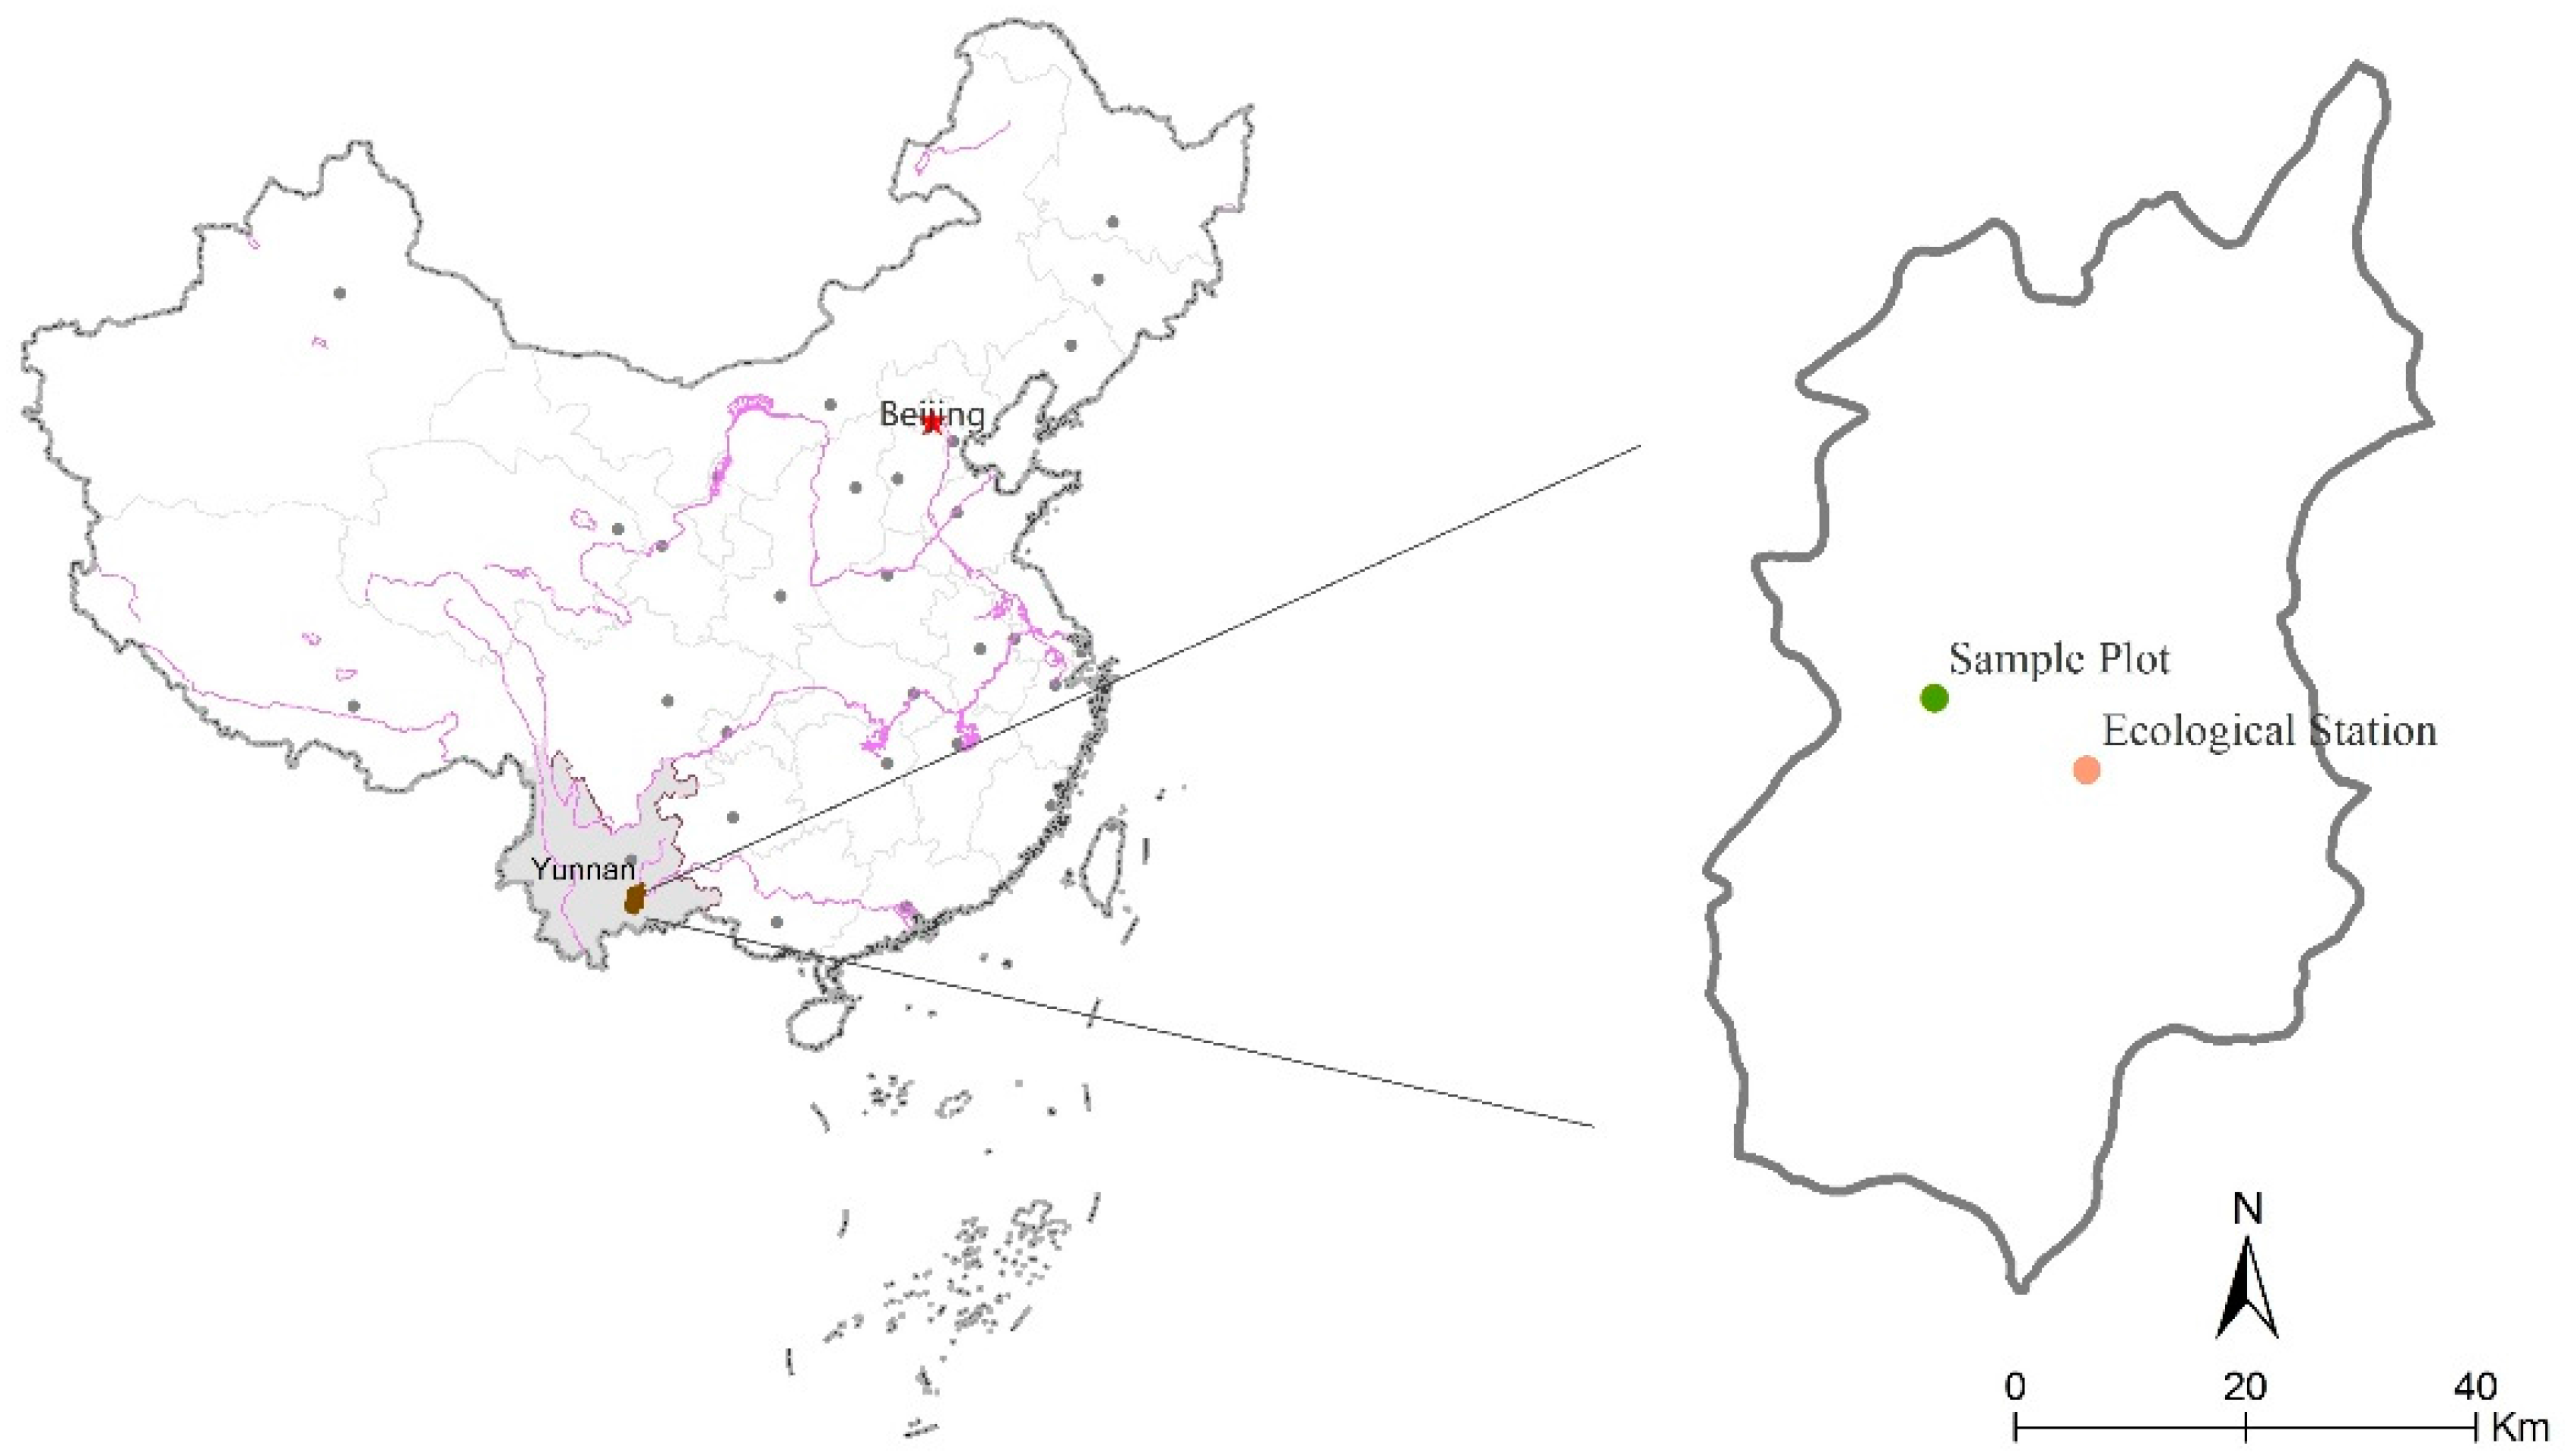
This study was conducted at the Desert Ecological Research Station in Jianshui County (102°54′ E, 23°37′ N), Yunnan Province, southwest China (Figure 1). The site has a typical subtropical monsoon climate with distinct warm-wet (May to October, about 85% of annual precipitation) and cool-dry seasons (November to April, about 15% of annual precipitation). The area has a mean annual precipitation of 805 mm and mean annual temperature of 19.8 °C. The average annual evaporation capacity is 2296.5 mm. As typical for karst ecosystems, the calcareous soil developed from a limestone base. Vegetation and soil degradation are serious due to anthropogenic disturbances, which have resulted in large areas of bare lands in this region. Since the 1990s, PY and EM plantations have been used to reforest the degraded ecosystem.
In this study, two vegetation restoration plantations (PY and EM) in isolated sites (less than 8 km away from each other) were chosen for this research. Before the planting of PY and EM, both sites were barren hills, and the plantations were closed to further human interference after planting.
2.2. Sample Collection and Preparation
In June 2016, two plantations consisting of six plots (each with dimensions of 20 × 20 m; three replicates) were selected for data collection. Quadrats of 10 × 10 m, 5 × 5 m, and 1 × 1 m were established in areas primarily composed of forest, shrub, and herb, respectively [24]. A total of 312 quadrats (24 from forests, 96 from shrubs, and 192 from herbs) were established. The diameter at breast height at 1.3 m was measured for all trees and the individual number for each tree species was recorded. The shrubs and herbs were measured in each quadrat and the species were identified. The GPS coordinates and elevation of each plot were measured, and the slope and aspect were recorded. Vegetation properties of the two plantations are shown in Table 1.
Plant samples were collected at the same height above the ground. Within each plot, five dominant trees were selected for the collection of plant organs. The plant organs collected were: live, green leaves (GLs) collected at the top of canopy; senesced yellow leaves (SLs) picked from the same tree to avoid nutrient loss from litter; branches; stems; and roots. All plant materials were gently washed with fresh water and oven dried to a constant mass at 65 °C for 72 h. Dried materials were then ground to pass through a 1-mm mesh sieve and stored for analysis.
Soil samples were collected simultaneously with plant samples by taking 4-cm diameter soil cores from 0–10, 10–20, and 20–30 cm depths from 12 locations in each plot. The 12 cores were combined to form one composite soil sample per depth per plot and placed in a polyethylene bag and shipped to a laboratory for soil physico-chemical analysis. In the laboratory, the roots, stones, and other debris were removed by hand. The samples were then air dried, ground, and sieved through a 60-mesh sieve (0.25 mm diameter) for chemical analysis.
2.3. Chemical Analyses
The organic C concentration of leaf samples was determined using the wet oxidation K2Cr2O7+H2SO4 digestion and titration following the FeSO4 method [24]. The total nitrogen (TN) concentration of plant samples was determined following a semi-micro Kjeldahl digestion using a flow injection autoanalyzer [4]. The total phosphorus (TP) concentration was analyzed colorimetrically following the ammonium molybdate method [25]. Soil pH, soil water content (SWC), bulk density (BD), capillary porosity (CP), organic carbon (SOC), TN, TP, available nitrogen (AN), available potassium (AK), and available phosphorus (AP) were all analyzed following the international standard methods as adopted and published by the Institute of Soil Science, Chinese Academy of Sciences (1978). Soil physicochemical characteristics from the selected plantations are given in Table 2.
2.4. Statistical Analyses
Plant organs and soil C, N, and P stoichiometric ratios were calculated on a mass basis of C, N, and P. C, N, and P concentrations in senesced leaves were used as indicators of the nutrient reuse efficiency (NRE). Nutrient resorption efficiency (NRE, %) was also calculated as the nutrient concentration between green leaves and senesced leaves using the equation (1) [26]:
where Xgre and Xsen are the nutrient concentrations in green and senesced leaves, and MLCF is the mass loss correction factor of 0.745 for conifer species, and 0.784 for deciduous species [27,28].
All analyses were performed using Microsoft Excel 2016 (Microsoft, Redmond, WA, USA) and statistical analyses were performed using SPSS 19.0 (SPSS Inc., Chicago, IL, USA). Figures were generated by Origin 8.5 (Origin Lab., Hampton, MA, USA). A one-way analysis of variance (ANOVA) was used to identify the significant differences of plant organs (leaves, branches, stems, and roots) organic C, TN, TP, physical properties of different soil horizons, organic C, TN, TP, and their ratios. The difference in nutrient concentrations and the ratios were analyzed by least significant difference (LSD) tests, and the significance was defined at 0.05. Multiple linear regressions were applied to explore the relationships between elements and their ratios within the different plantations.
3. Results
3.1. The Concentrations and Ratios of C, N, and P in Different Plant Organs
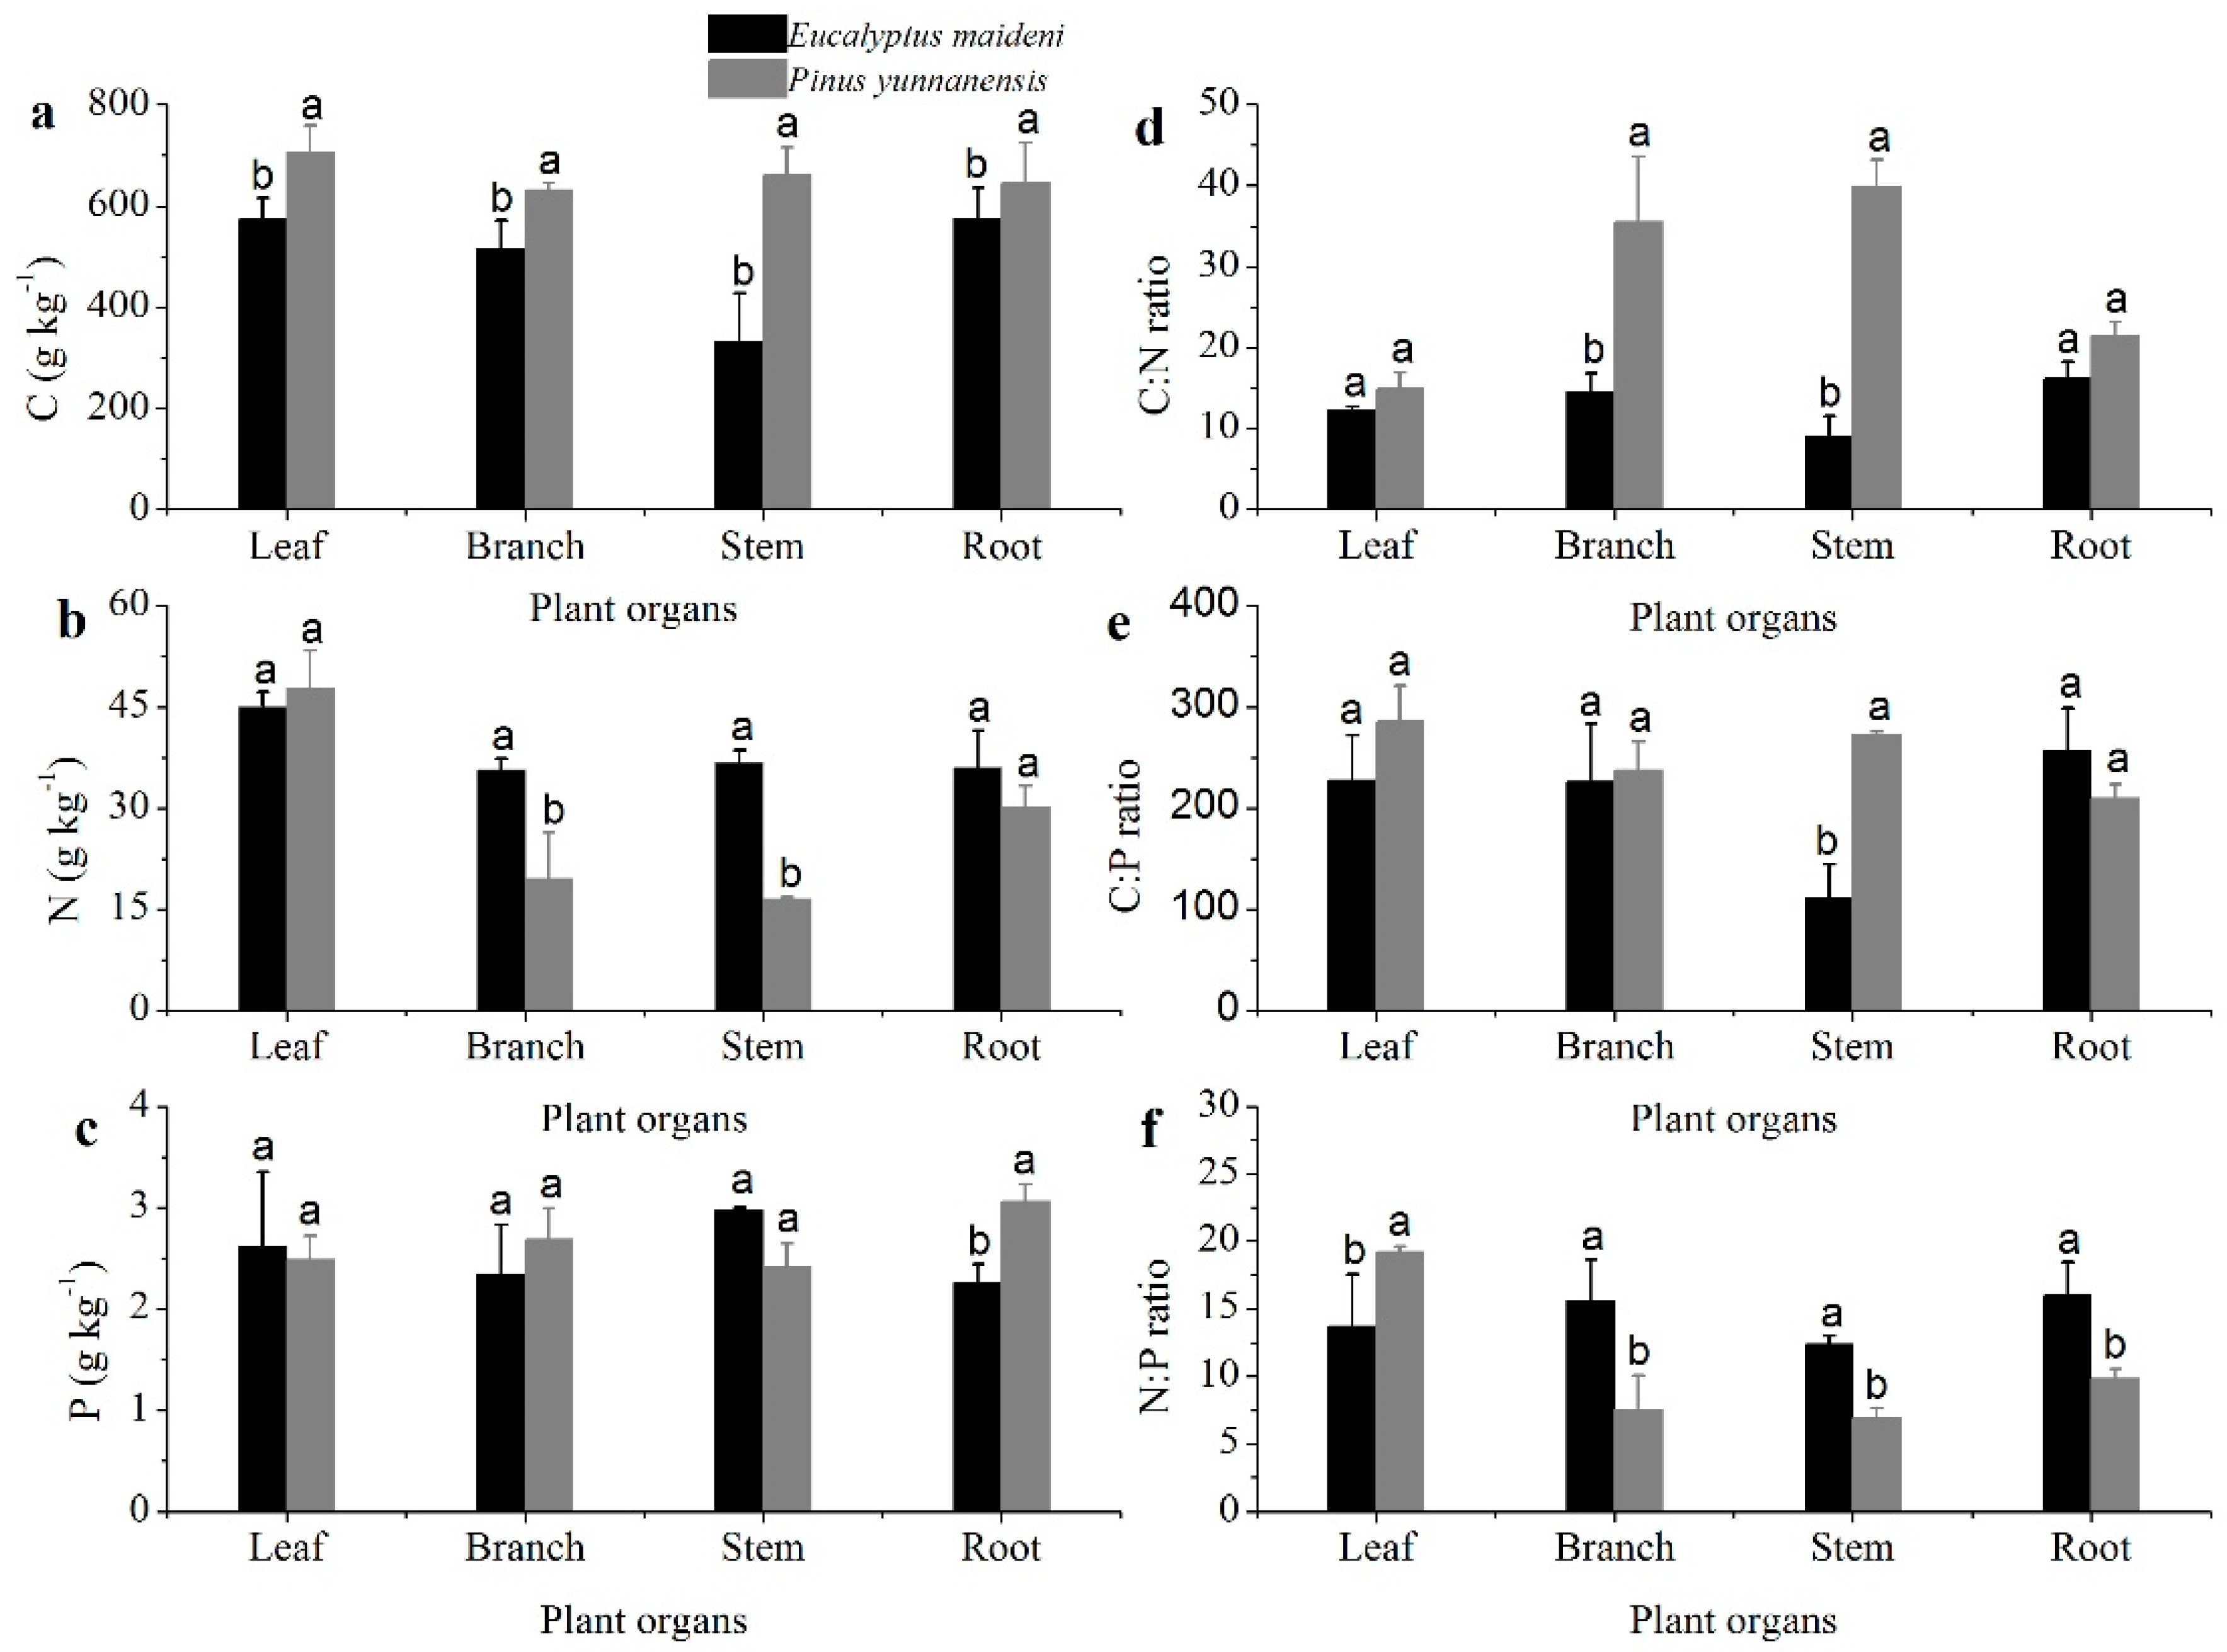
The C concentrations measured from the PY plant organs were much greater than that for EM (p < 0.05; Figure 2a). The N concentration was the greatest in leaves, but in branches, stems, and roots, the N concentrations were higher in EM than in PY (Figure 2b). The P concentrations of the plant organs were much lower than the C and N concentrations, and only limited differences can be seen among the different plant organs (Figure 2c). The C, N, and P concentrations in the plant organs of the two different plantation types are significantly different.
The ratios of C:N, C:P, and N:P in the plant organs from the PY and EM plantations are shown in Figure 2. The C:N ratios in the plant organs in the EM plantation was lower than that in the PY plantation, especially in branches and stems (p < 0.05; Figure 2d). The C:P ratio in the two vegetation types have similar trends as the C:N ratio except in the roots (Figure 2e). The N:P ratio in the leaves from EM was lower than that in PY, but with the branches, stems, and roots, the EM plantation was much higher than PY (p < 0.05; Figure 2f). The average C:N:P ratio of plant organs from the PY plantation was much higher than that of the EM plantation (Table 3).
3.2. The Concentrations and Ratios of C, N, and P in Soils
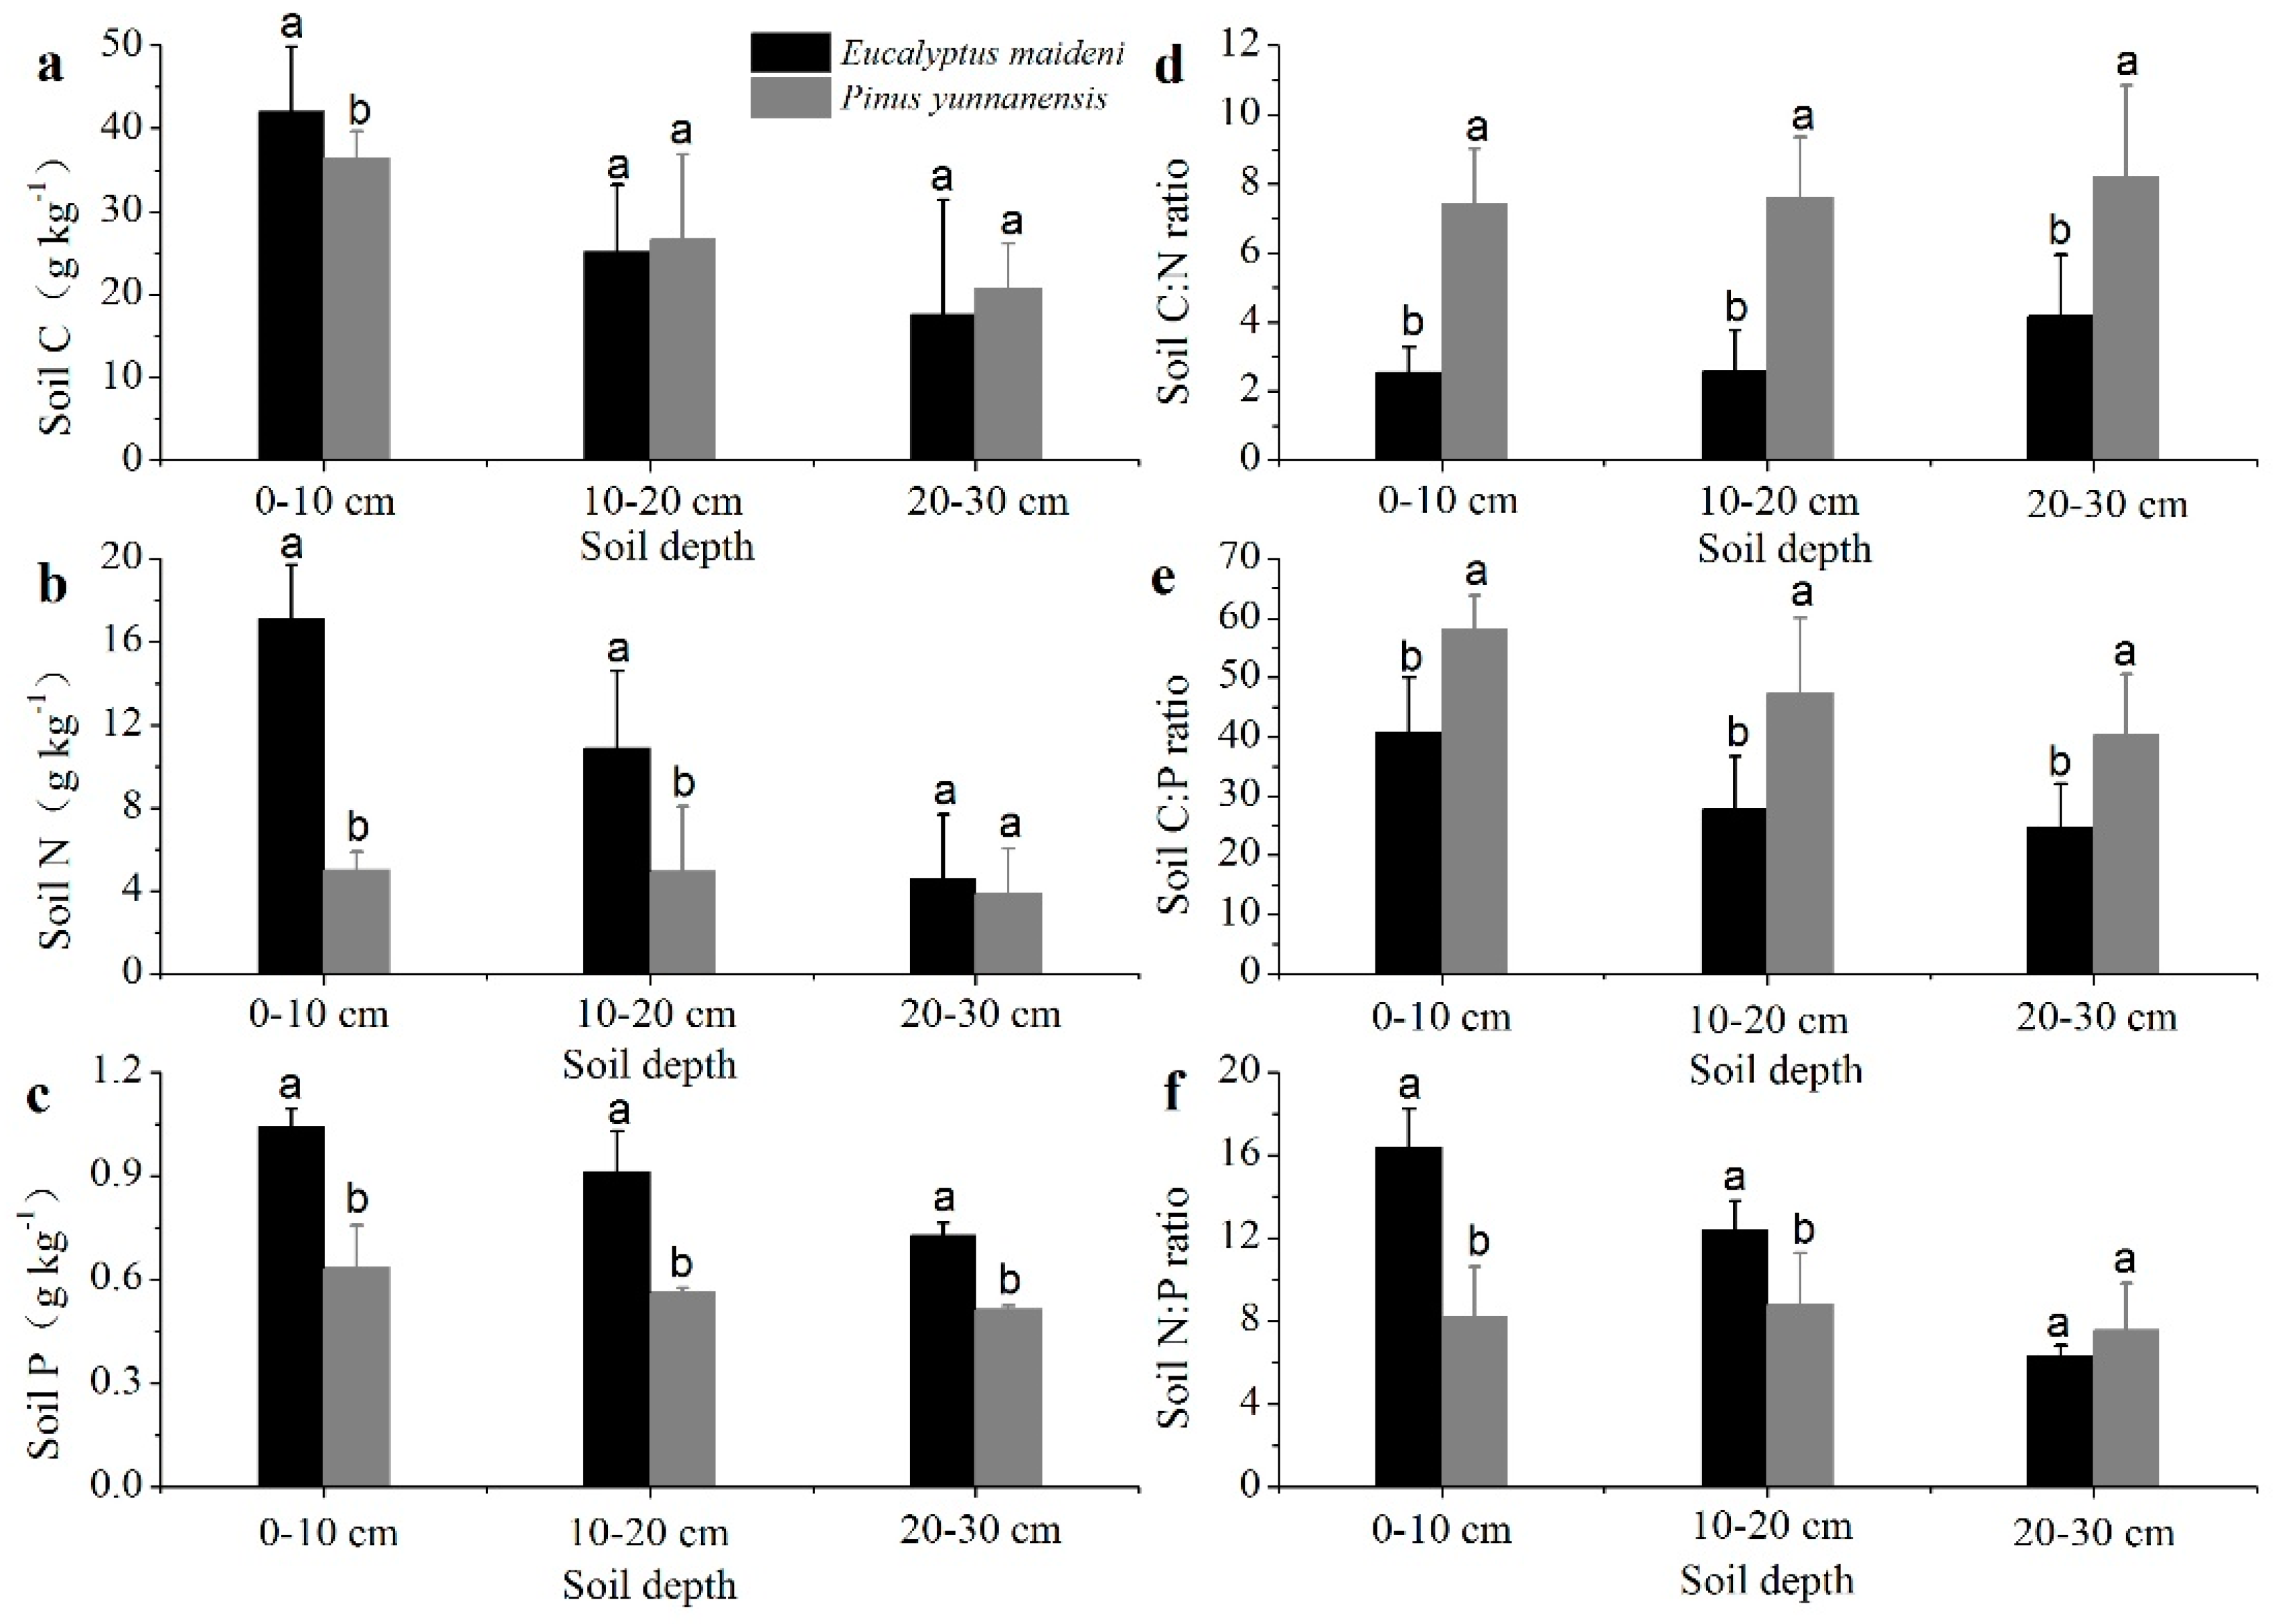
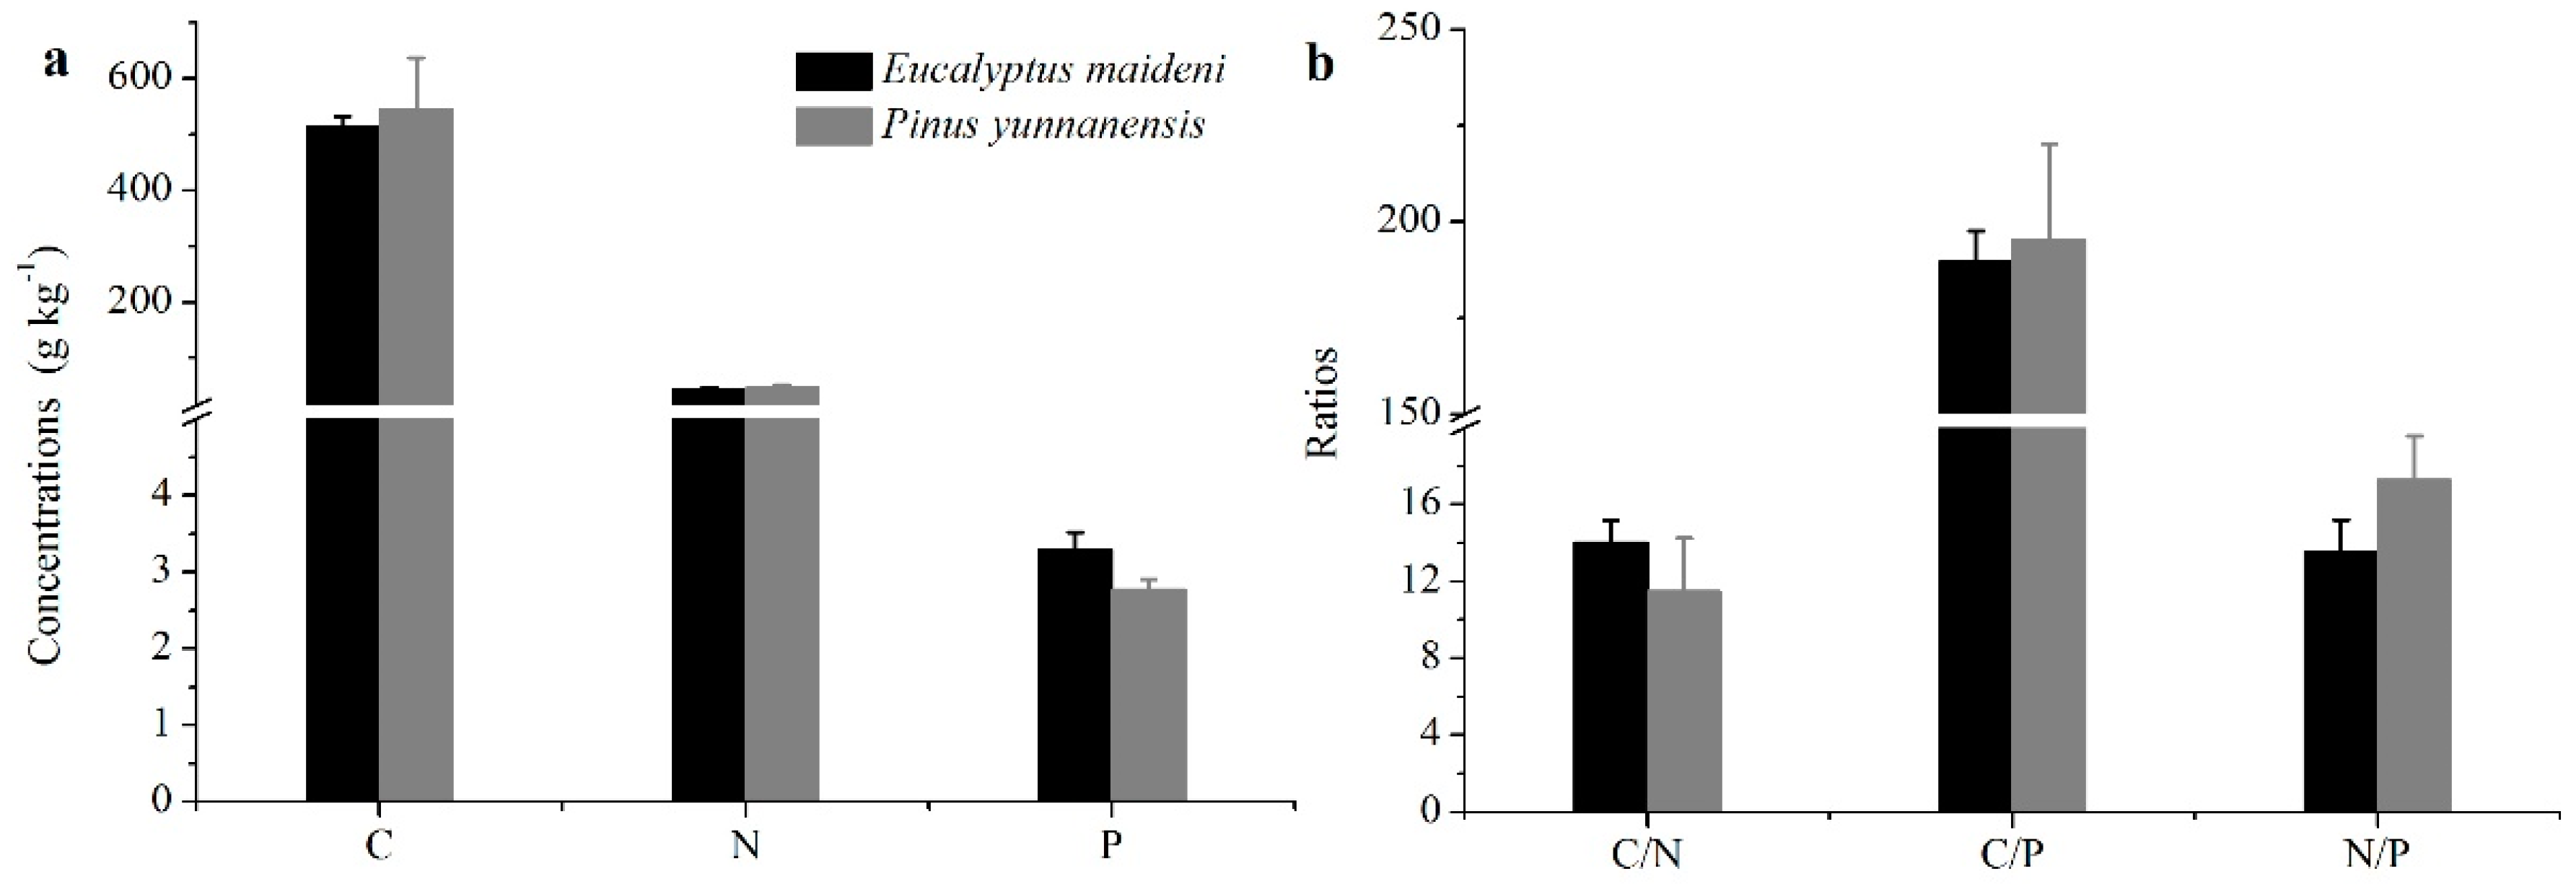
Soil C concentration tended to decline with soil depth and was significantly lower in soil collected from the 20–30 cm layer than in the 0–10 cm layer (p < 0.05). The C concentration in the 0–10 cm layer was higher in EM than PY, but in the 10–20 cm and 20–30 cm layers the opposite was found (Figure 3a). Soil N and P concentration tended to decrease with soil depth either in the EM or in the PY plantations at all three depths, and the EM was much greater than the PY, whereas only limited variation of the two concentrations was observed (Figure 3b,c).
The pattern of soil C:N and C:P in the EM plantation was much lower than the PY plantation at all three depths, but the soil C:N ratio in the soil profiles increased slightly with soil depth, and the soil C:P ratio in the soil profiles decreased with soil depth (Figure 3d,e). The soil N:P ratio in the EM plantation was much higher than the PY plantation in the 0–10 cm and 10–20 cm profiles, and both the values in the soil profiles decreased with soil depth (Figure 3f). The C:N:P ratio in the PY plantation was much greater than in the EM plantation (Table 3).
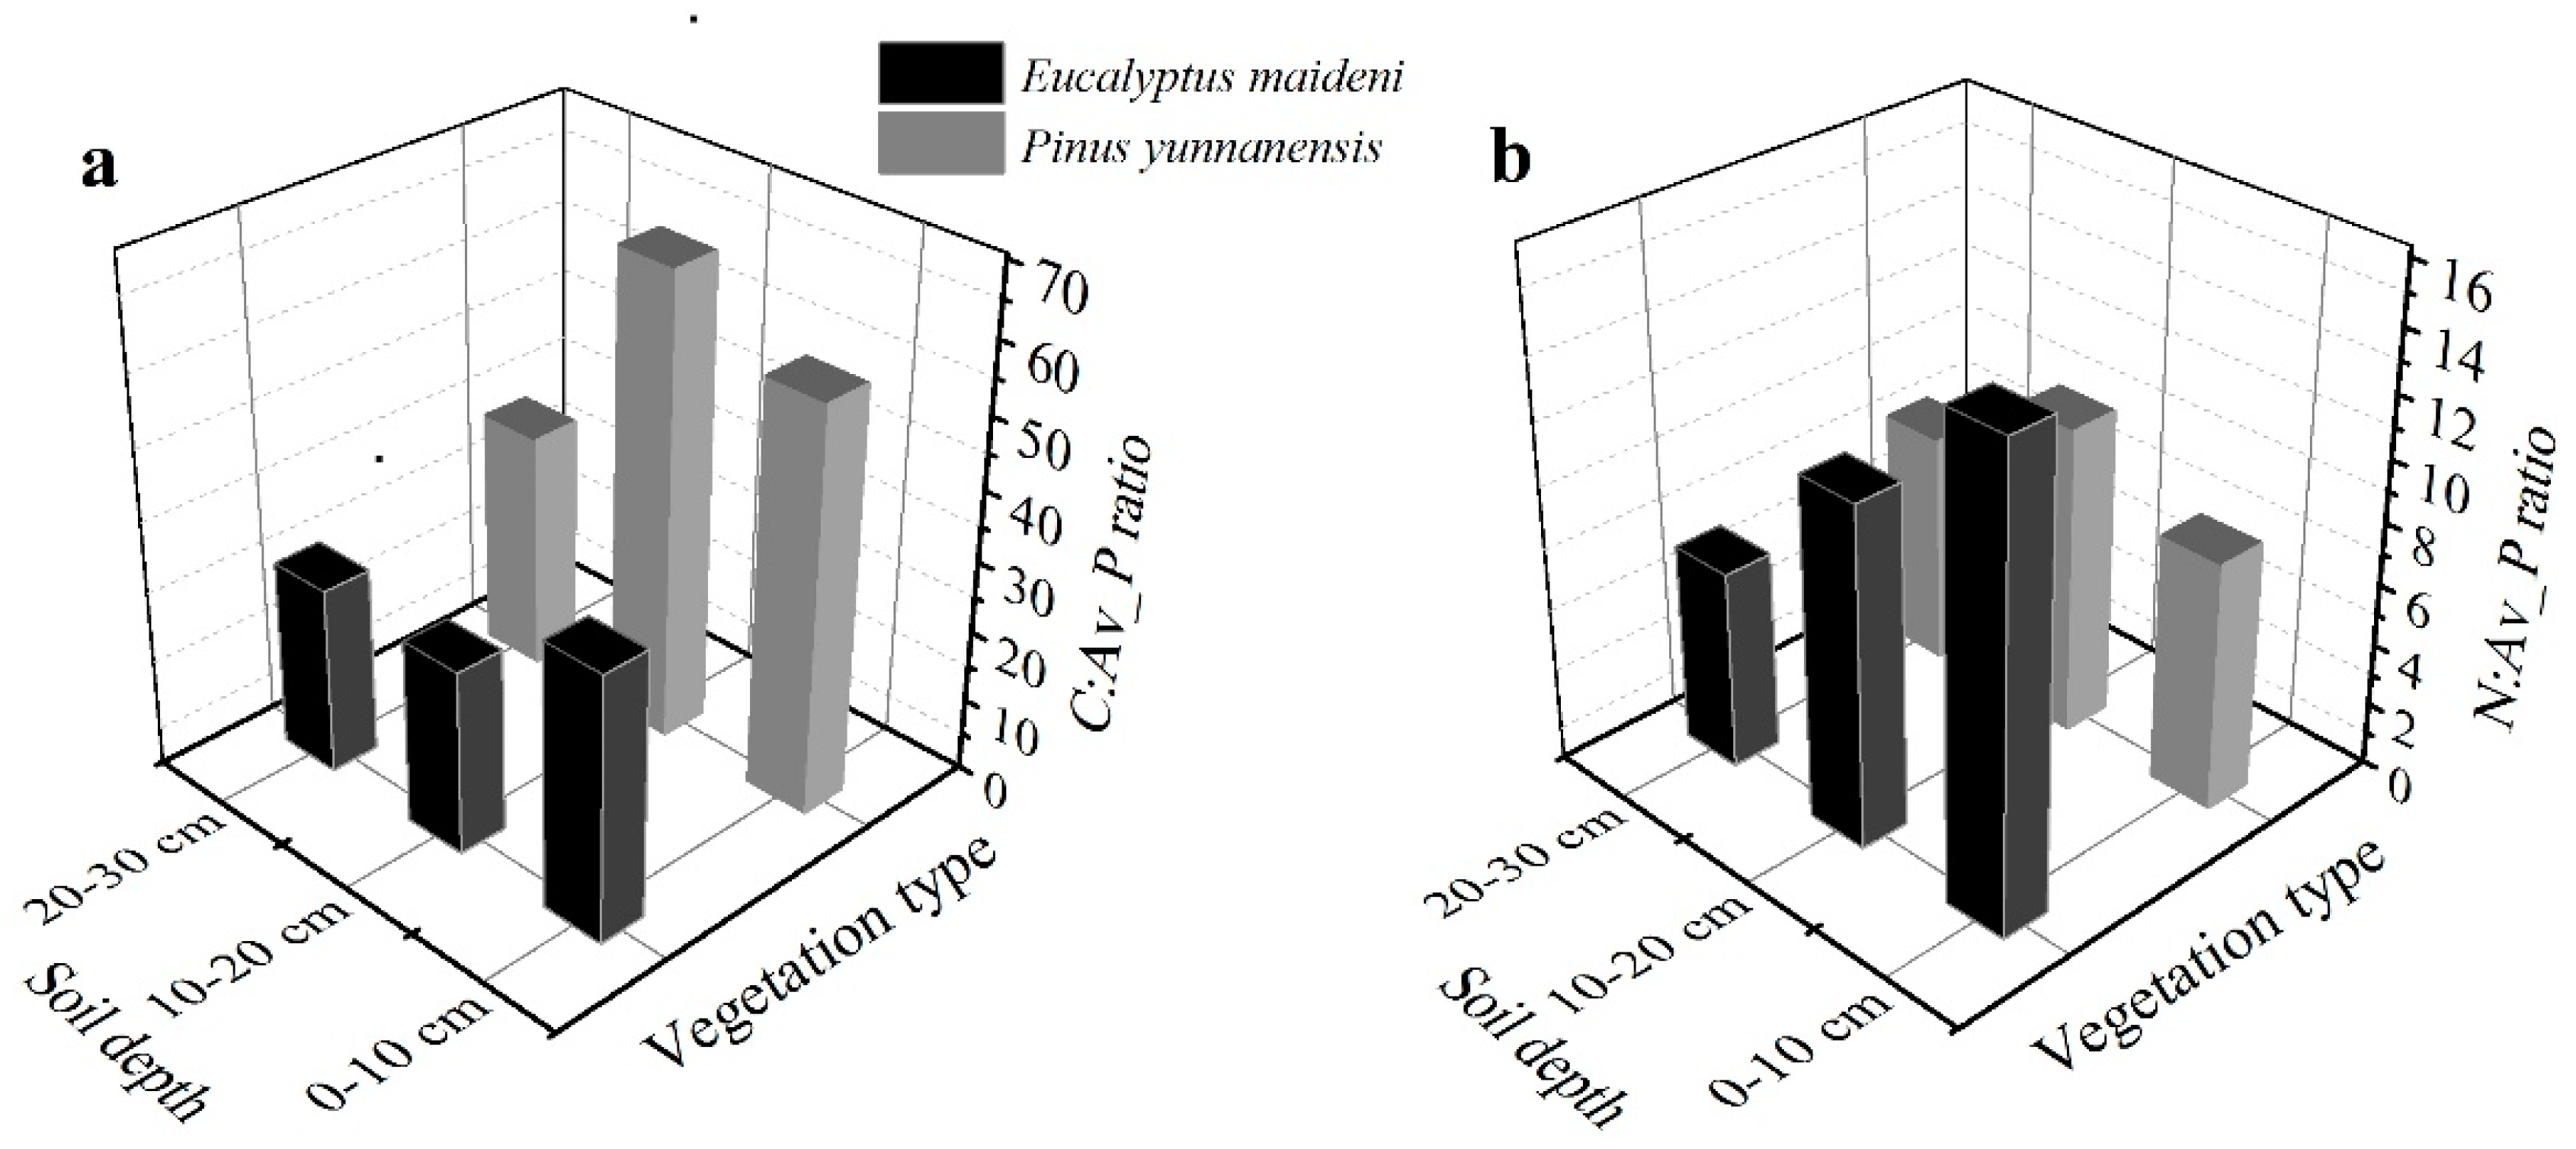
In the EM plantation, the available P (Av_P) concentrations varied between 0.973 g/kg and 1.626 g/kg, with a mean of 1.244 g/kg, and in the PY plantation, the available P concentrations varied between 0.667 g/kg and 1.013 g/kg, with a mean of 0.893 g/kg (Table 2). Both the ratios of C:Av_P and N:Av_P in the EM plantation in the soil profiles decreased slightly with the depth of the soil, but in the PY plantation, an increase and then decrease was observed with the soil depth. The average ratio of C:Av_P is much higher in the PY plantation, and N:Av_P is much higher in the EM plantation (Figure 4).
3.3. The Nutrient Resorption Efficiency (NRE) of the Two Different Vegetation Types
Figure 5 shows the nutrient resorption efficiency of C (NRE-C), N (NRE-N), and P (NRE-P) of the two plantations. The average rates of C resorption in the EM and PY plantations were 28.08% and 42.03%, respectively. The rates of N resorption were 26.30% and 32.80%, respectively. Both the rates of C and N resorption for the PY plantation were significantly higher than those for the EM plantation. The average rate of P resorption for the PY plantation was much lower than that in the EM plantation (33.05% and 42.96%, respectively; Figure 5).
4. Discussion
4.1. General Patterns of C, N, and P Concentrations and C:N:P Stoichiometry in Different Plant Organs
Plant organs contain various elements, and the contents of these elements affect the growth of plants [29]. The C, N, and P concentrations were different among the plant organs from Pinus yunnanensis and Eucalyptus (Figure 2a–c). In PY and EM plantations, the leaf C concentrations were 707.22 g/kg and 572.97 g/kg, and the leaf N concentrations were 47.87 g/kg and 45.04 g/kg, respectively (Figure 2a,b). The leaf C and N concentrations were much higher than what has been previously found in other studies at the same latitude, where C concentrations in PY and EM plantations were 509.25 g/kg and 462.45 g/kg, and leaf N concentrations were 11.24 g/kg and 18.03 g/kg, respectively [30,31,32]. Conifer needles have a large number of C-rich compounds such as resins, tannins, and waxes, which could contribute to the higher C content [33]. Plants in subtropical areas with high temperatures, sunlight, and precipitation have the ability to undergo cell division and require proteins involved in photosynthesis, resulting in relatively high N in leaves [34,35]. In PY and EM plantations, the P concentrations in leaves were 2.49 g/kg and 2.61 g/kg, respectively. This is higher than what was found in previous studies, where the P concentrations were 0.82 g/kg and 1.33 g/kg, respectively [30,32]. The dominant tree species in our research were significantly higher than that of the mean leaf P in terrestrial ecosystems (1.99 g/kg), and the P concentration in EM was higher than in the PY plantation [35,36]. Our research supported a previous study that suggested that plants with high relative growth rates generally have high leaf P concentrations, as they must have high metabolic rates to support the energy demands of macromolecular synthesis [37]. A previous study also argued that low leaf P in plants is indicative of low protein content and slow growth, which also would account for recalcitrant litter [38]. The concentrations of C, N, and P in leaves and needles are higher in karst landscapes, indicating that Eucalyptus and P. yunnanensis had a more conservative use of nutrients to cope with the harsh environment (e.g., low water retention capacity and soil nutrients), helping plants to gain a competitive advantage in barren soils [4,39,40,41].
There were higher C and relatively lower N concentrations in PY in the branches and stems; therefore, the C:N ratios of the branches and stems were significantly higher than those of the leaves and roots. The C:N ratios in the plant organs from EM were lower than that of PY, especially in branches and stems (p < 0.05; Figure 2d). These results are in accordance with earlier studies that showed that the C:N ratios of coniferous forests were higher than broad-leaved forests, but the N:P ratios were lower than in broad-leaved forests [42,43]. We speculate that the differences could be attributed to the high N concentration and low P concentration we found in coniferous forests. However, conifer needles have a large number of C-rich compounds such as resins, tannins, and waxes, which could contribute to higher C:N ratios [44].
4.2. Possible Factors Affecting the Nutrient Concentrations and Stoichiometry of C, N, and P in the Soils
A number of studies have reported that soil stoichiometry varied with biotic and abiotic factors, and varied with the scale of the study [45,46,47]. Climate plays an important role in nutrient cycling and availability [48]. In this study, EM and PY are located at low latitudes and the high precipitation facilitates the production of organic matter, thus leading to higher organic matter in the soil [42,49,50]. The soil P supply is strongly influenced by climate. Higher temperature and precipitation can accelerate soil weathering, leading to a rapid release of P and a decrease of the levels of P in soils [51]. Under the higher temperature and precipitation at our study sites, higher ratios of C:P and N:P were observed in the soils than the C:N in PY and EM (Figure 3).
Another effect of plants on the nutrients in soils is related to the litter. The litter can influence the structure of the soil microbial community, microbial biomass, and decomposition processes [52]. Combined with the higher temperature and precipitation, broadleaf trees (such as EM) have been found to have much greater quantities of litter and faster decomposition rates than coniferous trees (such as PY) [53]. Our data supported the assertion that during the litter decomposition process, various elements enter the soil and induce changes of the C, N, and P concentrations in soils and affect the nutrient element ratios. Compared with the PY plantation, the EM plantation had much higher C, N, and P concentrations and N:P ratio but lower C:N and C:P in the soils at each soil depth (Figure 3).
Carbon is generally closely related to N and P in the soil. As plants die, microorganisms decompose litter to obtain energy and nutrients [54]. Multiple linear regressions were used to distinguish factors influencing C:N, C:P, and N:P in soils. Results indicated that C:N was mostly affected by TN and AP; C:P was mostly affected by SOC, TP, and AK; and N:P was mostly affected by TN, TPAP, AK, and NO3−-N (Table 4).
4.3. Nutrient Limitation
Leaf TN and TP concentrations reflect nutrient demands required for plant growth of the different vegetation types and nutrient conditions; this is beneficial to understanding the relationship between plants and soils. In most terrestrial ecosystems, N and P availability can limit plant growth and affect plant traits, community composition, and biodiversity [55]. Leaf C, N, and P concentrations, as well as stoichiometric ratios of green and senesced leaves, showed significant differences in this research (Figure 2 and Figure 6). Researchers have found the critical N:P ratios that indicate N or P limitation using different plant tissues [56]. According to the definition above, our results indicated that P was limited in both the PY and EM plantations. The growth of PY and EM in the plantations was mostly limited by the availability of phosphorus, which was concordant with the P deficiency in the low latitude region and in the karst ecosystem [4,42,57].
Leaf nutrient contents are bound to the nutrient availability in soil [9]. Soils, especially surface soils, are highly involved in the biogeochemical cycling of nutrients in terrestrial ecosystems [58,59]. In the present study, the ratios of C:P, N:P, C:Av_P, and N:Av_P in soil was much greater in both plantations. This implied that SOC and TN were abundant and TP and AP were limited in the two plantations, indicating that P is the limiting element in the two vegetation types.
We found that P was the primary limiting nutrient in our study sites, and at least four reasons might account for this. The increased atmospheric N deposition will induce low soil P availability on a global scale [15,60]. High temperatures and precipitation at low latitudes will accelerate the chemical processes of soil phosphorus released from the parent material [16,35]. In addition, high concentrations of iron (Fe) and aluminum (Al) in red soils will reduce the availability of P through the synthesis of Fe–P and Al–P [61,62]. Furthermore, karst ecosystems have an abundance of CaCO3, which results in relatively low P bioavailability [63].
4.4. Nutrient Resorption Efficiency (NRE)
Nitrogen and phosphorus resorption efficiency were considered critical factors in affecting nutrient status of senesced leaves, which could have effects on litter quality, nutrient return to soils, and plant growth [4]. We found that nutrient contents and C:N:P stoichiometry in green and senesced leaves differed between the two plantations (Figure 2 and Figure 6). The resorption rates of C and N for PY were significantly higher than the resorption rates for EM, but the average rates of P resorption for PY were much lower than for EM (Figure 5). In our research, for example, NRE-P was greater (38.01 ± 7.01%) than NRE-N (29.55 ± 4.59%) on average for the two studied plantations considered in tandem (Figure 5). These values tended to be in general agreement with the mean NRE of 35.41% for P and 29.17% for N from the karst areas in China [4]. The resorption efficiency based on leaf mass in our study was lower than the average of 50% typically reported for conifers and broadleaf species [33].
The NRE-P was higher than NRE-N, which indicated the deficiency of P in soils of low latitude regions, or differences in the relative amounts of nutrients that were leached from the leaves. Thus, the high resorption rates of P could have favored moderating P deficiency in the karst ecosystem [4,7]. This finding is inconsistent with previous research that reported a negative response of nutrient resorption and conservation by plants to the availability of a limiting nutrient [64]. The C:N:P ratios in the senesced leaves of the two plantations were also different (Figure 6). The N:P ratio was higher in senesced leaves, suggesting that PY and EM plantations are more P limited. This also indicates a stronger tendency for the resorption of P relative to N in the karst ecosystem. The high C:P ratio but low C:N ratio in the two plantations implies more efficient use of C and P than N, which reflects the adaptation of plants to low P habitats (Figure 6).
5. Conclusions
This study clearly revealed that leaf C and N concentrations were higher in PY than EM, but the P concentration had an opposite trend in both green and senesced leaves. Soil C, N, and P concentrations in EM were much greater than the PY plantation at all three depths, and the concentrations decreased with the increasing depth of the soil. In addition, the ratios of C:P, N:P, C:Available P, and N:Available P in soil coupled with the ratio of N:P and the resorption rate in leaves indicates that P is the limiting element in the two plantations. The ratio of N:P and the resorption rate could be effective indictors for nutrient limitation in karst ecosystems. Furthermore, the relatively low P concentrations in senesced leaves and the higher TP resorption rate reflected the low availability and deficiency of phosphorus in the soil. Thus, the high reuse proficiency of P could have mitigated P limitation. Our findings will be useful for vegetation restoration and reconstruction in karst ecosystems.
Acknowledgments
This study was supported by the National Key R&D Program of China (2016YFC0502504), the Fundamental Research Funds for the Central Non-profit Research Institution of CAF (CAFYBB2014ZD006, CAFYBB2016QB020), and the National Natural Science Foundation of China (31500583).
Author Contributions
Experimental design: Danbo Pang, Yuguo Liu, and Jinxing Zhou; Field investigation and laboratory experiment: Genzhu Wang, Guijing Li, and Yonglei Sun; Data analysis: Genzhu Wang and Yonglei Sun; Drafting of manuscript: Danbo Pang and Yuguo Liu; Revisions and suggestions: Jinxing Zhou.
Conflicts of Interest
The authors declare no conflict of interest.
References
- Liu, C.C.; Wei, Y.F.; Liu, Y.G.; Guo, K. Biomass of canopy and shrub layers of karst forests in Puding, Guizhou, China. J. Plant Ecol. 2009, 33, 698–705. [Google Scholar]
- Jiang, Z.C.; Lian, Y.; Qin, X. Rocky desertification in Southwest China Impacts, causes, and restoration. Earth-Sci. Rev. 2014, 132, 1–12. [Google Scholar] [CrossRef]
- Wang, S.J.; Liu, Q.M.; Zhang, D.F. Karst rocky desertification in southwestern China: Geomorphology, landuse, impact and rehabilitation. Land Degrad. Dev. 2004, 15, 115–121. [Google Scholar] [CrossRef]
- Du, Y.X.; Pan, G.X.; Li, L.Q.; Hu, Z.L.; Wang, X.Z. Leaf N/P ratio and nutrient reuse between dominant species and stands: Predicting phosphorus deficiencies in Karst ecosystems, southwestern China. Environ. Earth Sci. 2011, 64, 299–309. [Google Scholar] [CrossRef]
- Behera, N.; Sahani, U. Soil microbial biomass and activity in response to Eucalyptus plantation and natural regeneration on tropical soil. For. Ecol. Manag. 2003, 174, 1–11. [Google Scholar] [CrossRef]
- Zhu, H.H.; He, X.Y.; Wang, K.L.; Su, Y.R.; Wu, J.S. Interaction of vegetation succession, soil biochemical properties and microbial communities in Karst ecosystem. Eur. J. Soil Biol. 2012, 51, 1–7. [Google Scholar] [CrossRef]
- Hofmeister, J.; Mihaljevic, M.; Hosek, J.; Sadlo, J. Eutrophication of deciduous forests in the Bohemian Karst (Czech Republic): The role of nitrogen and phosphorus. For. Ecol. Manag. 2002, 169, 213–230. [Google Scholar] [CrossRef]
- Hatano, R.; Shinano, T.; Zheng, T.G.; Okubo, M.; Li, Z.W. Nitrogen budgets and environmental capacity in farm systems in a largescale karst region, southern China. Nutr. Cycl. Agroecosyst. 2002, 63, 139–149. [Google Scholar] [CrossRef]
- Niinemets, U.; Kull, K. Co-limitation of plant primary productivity by nitrogen and phosphorus in a species-rich wooded meadow on calcareous soils. Acta Oecol. 2005, 28, 345–356. [Google Scholar] [CrossRef]
- Pan, F.J.; Zhang, W.; Liu, S.J.; Wang, K. Leaf N:P stoichiometry across plant functional groups in the karst region of southwestern China. Trees 2015, 29, 883–892. [Google Scholar] [CrossRef]
- Kirkby, C.A.; Kirkegaard, J.A.; Richardson, A.E.; Wade, L.J.; Blanchard, C.; Batten, G. Stable soil organic matter: A comparison of C:N:P:S ratios in Australian and other world soils. Geoderma 2011, 163, 197–208. [Google Scholar] [CrossRef]
- Ågren, G.I.; Wetterstedt, J.Å.; Billberger, M.F.K. Nutrient limitation on terrestrial plant growth—modeling the interaction between nitrogen and phosphorus. New Phytol. 2012, 194, 953–960. [Google Scholar] [CrossRef] [PubMed]
- Ostrowska, A.; Porebska, G. Assessment of the C/N ratio as an indicator of the decomposability of organic matter in forest soils. Ecol. Indic. 2015, 49, 104–109. [Google Scholar] [CrossRef]
- Güsewell, S.; Koerselman, W.; Verhoeven, J.T.A. Biomass N: P ratios as indicators of nutrient limitation for plant populations in wetlands. Ecol. Appl. 2003, 13, 372–384. [Google Scholar] [CrossRef]
- Bing, H.J.; Wu, Y.H.; Zhou, J.; Sun, H.Y.; Luo, J.; Dong, Y. Stoichiometric variation of carbon, nitrogen,and phosphorus in soils and its implication for nutrient limitation in alpine ecosystem of Eastern Tibetan Plateau. J. Soils Sediment. 2016, 16, 405–416. [Google Scholar] [CrossRef]
- Aerts, R.; Chapin, F.I. The mineral nutrition of wild plants revisited: A re-evaluation of processes and patterns. Adv. Ecol. Res. 2000, 30, 1–67. [Google Scholar]
- Li, Y.; Wu, J.S.; Liu, S.L.; Shen, J.L.; Huang, D.; Su, Y.; Wei, W.; Syers, J.K. Is the C:N:P stoichiometry in soil and soil microbial biomass related to the landscape and land use in southern subtropical China? Glob. Biogeochem. Cycles 2012, 26, GB4002. [Google Scholar] [CrossRef]
- Batjes, N. Total carbon and nitrogen in the soils of the world. Eur. J. Soil Sci. 2014, 65, 10–21. [Google Scholar] [CrossRef]
- Paul, E.A. Soil Microbiology, Ecology, and Biochemistry, 3rd ed.; Academic Press: Amsterdam, The Netherlands; Boston, MA, USA, 2007. [Google Scholar]
- Penuelas, J.; Sardans, J.; Rivas-ubach, A.; Janssens, I.A. The human-induced imbalance between C, N and P in Earth’s life system. Glob. Chang. Biol. 2012, 18, 3–6. [Google Scholar] [CrossRef]
- Chen, F.; Wang, J.M.; Sun, B.G.; Chen, X.M.; Yang, Z.X.; Duan, Z.Y. Relationship between geographical distribution of Pinus yunnanensis and climate. J. For. Res. 2012, 25, 163–168. [Google Scholar]
- Yang, M.; Xie, Y.; Liu, J. Thirty Years of Eucalyptus Research in China (1981–2010); China Forestry Press: Beijing, China, 2011. [Google Scholar]
- Wu, J.; Liu, Z.; Huang, G.; Chen, D.; Zhang, W.; Shao, Y.; Wan, S.; Fu, S. Response of soil respiration and ecosystem carbon budget to vegetation removal in eucalyptus plantations with contrasting ages. Sci. Rep. 2014, 4, 6262. [Google Scholar] [CrossRef] [PubMed]
- Zhang, J.T.; Dong, Y.R. Factors affecting species diversity of plant communities and the restoration process in the loess area of China. Ecol. Eng. 2010, 36, 345–350. [Google Scholar] [CrossRef]
- Luo, Y.Z.; Zeng, T.; Dong, W.; He, Y.L.; Xu, S.M. Research of ecological stoichiometry of plant community in alpine Kobresia meadow. Chin. J. Grassl. 2013, 35, 92–96. [Google Scholar]
- Killingbeck, K.T. Nutrients in senesced leaves: Keys to the search for potential reuse and reuse proficiency. Ecology 1996, 77, 1716–1727. [Google Scholar] [CrossRef]
- Van, H.L.M.; Toet, S.R.; Aerts, R. Current measures of nutrient resorption efficiency lead to a substantial underestimation of real resorption efficiency: Facts and solutions. Oikos 2003, 101, 664–669. [Google Scholar]
- Leonardus, V.; Manzoni, S.; Porporato, A.; Novais, R.F.; Jackson, R.B. Global resorption efficiencies and concentrations of carbon and nutrients in leaves of terrestrial plants. Ecol. Monogr. 2012, 82, 205–220. [Google Scholar]
- Sterner, R.W.; Elser, J.J. Ecological Stoichiometry: The Biology of Elements from Molecules to the Biosphere; Princeton University Press: Fairfield, OH, USA, 2002. [Google Scholar]
- Tong, Z.L.; Chen, Q.B.; Wang, Y.X.; Xiong, H.Q.; Wu, J.X. Accumulation and distribution characteristics of nutrients in Pinus yunnanensis forests with different ages. J. Northwest A&F Univ. 2014, 42, 100–114. (In Chinese) [Google Scholar]
- Yang, Y.; Ran, F.; Wang, G.X.; Zhu, W.Z.; Yang, Y.; Zhou, P. Biomass model and carbon storage of Pinus yunnanensis on Tibet Plateau of China. Chin. J. Ecol. 2013, 32, 1674–1682. (In Chinese) [Google Scholar]
- Xu, Y.X.; Wang, Z.C.; Zhu, W.K.; Du, A.P. Stochiometric characteristics of C,N and P in leaf-litter-soil of different Eucalyptus in varieties. J. Northwest A&F Univ. 2017, 46, 1–8. (In Chinese) [Google Scholar]
- Yuan, Z.Y.; Chen, H.Y.H. Global-scale patterns of nutrient resorption associated with latitude, temperature and precipitation. Glob. Ecol. Biogeogr. 2009, 18, 11–18. [Google Scholar] [CrossRef]
- Gorokhova, E.; Kyle, M. Analysis of nucleic acids in daphnia: Development of methods and ontogenetic variations in RNA–DNA content. J. Plankton Res. 2002, 24, 511–522. [Google Scholar] [CrossRef]
- Reich, P.B.; Oleksyn, J. Global patterns of plant leaf N and P in relation to temperature and latitude. Proc. Natl. Acad. Sci. USA 2004, 101, 11001–11006. [Google Scholar] [CrossRef] [PubMed]
- Elser, J.J.; Sterner, R.W.; Gorokhova, E.; Fagan, W.F.; Markow, T.A.; Contner, J.B.; Harrison, J.F.; Hobbie, S.E.; Odell, G.M. Biological stoichiometry from genes to ecosystems. Ecol. Lett. 2000, 6, 540–550. [Google Scholar] [CrossRef]
- Reich, P.B.; Oleksyn, J.; Wright, I.J.; Niklas, K.J.; Hedin, L.; Elser, J.J. Evidence of a general 2/3-power law of scaling leaf nitrogen to phosphorus among major plant groups and biomes. Proc. R. Soc. B Biol. Sci. 2010, 277, 877–883. [Google Scholar] [CrossRef] [PubMed]
- Lambers, H.; Brundrett, M.C.; Raven, J.A.; Hopper, S.D. Plant mineral nutrition in ancient landscapes: High plant species diversity on infertile soils is linked to functional diversity for nutritional strategies. Plant Soil 2010, 334, 11–31. [Google Scholar] [CrossRef]
- Fan, H.B.; Wu, J.P.; Liu, W.F.; Yuan, Y.H.; Hu, L.; Cai, Q.K. Linkages of plant and soil C:N:P stoichiometry and their relationships to forest growth in subtropical plantations. Plant Soil 2015, 392, 127–138. [Google Scholar] [CrossRef]
- Cao, Y.B.; Wang, B.T.; Wei, T.T.; Ma, H. Ecological stoichiometric characteristics and element reserves of three stands in a closed forest on the Chinese loess plateau. Environ. Monit. Assess. 2016, 188, 80. [Google Scholar] [CrossRef] [PubMed]
- Liu, J.T.; Gu, Z.J.; Shao, H.B.; Zhou, F.; Peng, S.Y. N–P stoichiometry in soil and leaves of Pinus massoniana forest at different stand ages in the subtropical soil erosion area of China. Environ. Earth Sci. 2016, 75, 1091. [Google Scholar] [CrossRef]
- Han, W.X.; Fang, J.Y.; Guo, D.L.; Zhang, Y. Leaf nitrogen and phosphorus stoichiometry across 753 terrestrial plant species in China. New Phytol. 2005, 168, 377–385. [Google Scholar] [CrossRef] [PubMed]
- Ren, S.J.; Yu, G.R.; Tao, B.; Wang, S.Q. Leaf nitrogen and phosphorus stoichiometry across 654 terrestrial plant species in NSTEC. Environ. Sci. 2007, 28, 2665–2673. [Google Scholar]
- Yuan, Z.Y.; Chen, H.Y.H. Global trends in senesced-leaf nitrogen and phosphorus. Glob. Ecol. Biogeogr. 2009, 18, 532–542. [Google Scholar] [CrossRef]
- Sardans, J.; Rivas-Ubach, A.; Peñuelas, J. Factors affecting nutrient concentration and stoichiometry of forest trees in Catalonia (NE Spain). For. Ecol. Manag. 2011, 262, 2024–2034. [Google Scholar] [CrossRef]
- He, M.Z.; Dijkstra, F.A.; Zhang, K.; Li, X.; Tan, H.; Gao, Y.; Li, G. Leaf nitrogen and phosphorus of temperate desert plants in response to climate and soil nutrient availability. Sci. Rep. 2014, 4, 6932. [Google Scholar] [CrossRef] [PubMed]
- Wu, T.G.; Wang, G.G.; Wu, Q.T.; Cheng, X.; Yu, M.; Wang, W.; Yu, X. Patterns of leaf nitrogen and phosphorus stoichiometry among Quercus acutissima provenances across China. Ecol. Complex. 2014, 17, 32–39. [Google Scholar] [CrossRef]
- Dijkstra, F.A.; Pendall, E.; Morgan, J.A.; Blumenthal, D.M.; Carrillo, Y.; LeCain, D.R.; Follett, R.F.; Williams, D.G. Climate change alters stoichiometry of phosphorus and nitrogen in a semiarid grassland. New Phytol. 2012, 196, 807–815. [Google Scholar] [CrossRef] [PubMed]
- Houlton, B.Z.; Wang, Y.P.; Vitousek, P.M.; Field, C.B. A unifying framework for dinitrogen fixation in the terrestrial biosphere. Nature 2008, 454, 327–330. [Google Scholar] [CrossRef] [PubMed]
- Manzoni, S.; Trofymow, J.A.; Jackson, R.B.; Porporato, A. Stoichiometric controls on carbon, nitrogen, and phosphorus dynamics in decomposing litter. Ecol. Monogr. 2010, 80, 89–106. [Google Scholar] [CrossRef]
- Chen, Y.H.; Han, W.X.; Tang, L.Y.; Tang, Z.Y.; Fan, J.Y. Leaf nitrogen and phosphorus concentrations of woody plants differ in responses to climate, soil and plant growth form. Ecography 2011, 36, 178–184. [Google Scholar] [CrossRef]
- Aponte, C.; Marañón, T.; García, L. Microbial C, N, and P in soils of Mediterranean oak forests: Influence of season, canopy cover and soil depth. Biogeochemistry 2010, 101, 77–92. [Google Scholar] [CrossRef] [Green Version]
- Wang, Q.K.; Wang, S.L.; Fan, B.; Yu, X.J. Litter production, leaf litter decomposition and nutrient return in Cunninghamia lanceolata plantations in south China: Effect of planting conifers with broadleaved species. Plant Soil 2007, 297, 201–211. [Google Scholar] [CrossRef]
- Cambardella, C.A.; Elliott, E.T. Carbon and nitrogen dynamics of soil organic fractions from cultivated grassland soils. Soil Sci. Soc. Am. J. 1992, 58, 123–130. [Google Scholar] [CrossRef]
- Aerts, R.; Caluwe, H.D.; Beltman, B. Is the relation between nutrient supply and biodiversity co-limited by the type of nutrient limitation? Oikos 2003, 101, 489–498. [Google Scholar] [CrossRef]
- Koerselman, W.; Meuleman, A.F.M. The vegetation N: P ratio: A new tool to detect the Nature of Nutrient Limitation. J. Appl. Ecol. 1996, 33, 1441–1450. [Google Scholar] [CrossRef]
- Zhang, J.; Zhao, H.; Zhang, T.; Zhao, X.; Drake, S. Community succession along a chronosequence of vegetation restoration on sand dunes in Horqin Sandy Land. J. Arid Environ. 2005, 62, 555–566. [Google Scholar] [CrossRef]
- Tian, H.; Chen, G.; Zhang, C.; Melillo, J.M.; Hall, C.A.S. Pattern and variation of C:N:P ratios in China’s soils: A synthesis of observational data. Biogeochemistry 2010, 98, 139–151. [Google Scholar] [CrossRef]
- Izquierdo, J.; Houlton, B.; Huysen, T. Evidence for progressive phosphorus limitation over long-term ecosystem development: Examination of a biogeochemical paradigm. Plant Soil 2013, 367, 135–147. [Google Scholar] [CrossRef]
- Chiwa, M.; Ikezaki, S.; Katayama, A.; Enoki, T. Topographic Influence on Plant Nitrogen and Phosphorus Stoichiometry in a Temperate Forested Watershed. Water Air Soil Pollut. 2013, 227, 6. [Google Scholar] [CrossRef]
- Solomon, D.; Lehmann, J.; Mano, T.; Fritzsche, F.; Zech, W. Phosphorus forms and dynamics as influenced by land use changes in the sub-humid Ethiopian highland. Geoderma 2002, 105, 21–48. [Google Scholar] [CrossRef]
- Yang, J.C.; Huang, J.H.; Pan, Q.M.; Tang, J.W.; Han, X.G. Soil phosphorus dynamics as influenced by land use changes in humid tropical, Southwest China. Pedosphere 2005, 15, 24–32. [Google Scholar]
- Zhao, X.L.; He, X.D.; Xue, P.P.; Zhang, N.; We, W.; Li, R.; Ci, H.C.; Xu, J.J.; Gao, Y.B.; Zhao, H.L. Effects of soil stoichiometry of the CaCO3/available phosphorus ratio on plant density in Artemisia ordosica communities. Chin. Sci. Bull. 2012, 57, 492–499. [Google Scholar] [CrossRef]
- Escudero, A.; Arco, J.M.; Sanz, I.C.; Ayala, J. Effects of leaf longevity and retranslocation efficiency on the retention time of nutrients in the leaf biomass of different wood species. Oecologia 1992, 90, 80–87. [Google Scholar] [CrossRef] [PubMed]
Figure 1.
Location of the study area in Jianshui County, southeastern Yunnan, southwestern China.

Figure 2.
The stoichiometric characteristics of the C, N, and P concentrations of different plant organs. The (a–f) are represent C, N, P concentrations and the tatios of C:N, C:P and N:P, respectively. The error bars represent the standard error. The different letters indicate a significant difference of the means from each plant organ from the two plantations based on ANOVA (Analysis of Variance) and LSD (Least Significant Difference) tests (p < 0.05).

Figure 3.
The stoichiometric characteristics of soil C, N, and P. The error bars represent the standard error. The (a–f) are represent C, N, P concentrations and the tatios of C:N, C:P and N:P, respectively. The different letters indicate a significant difference of the means at each soil depth in the two plantations based on ANOVA and LSD tests (p < 0.05).

Figure 4.
The ratios of C and N to available P of C:Av_P (a) and N:Av_P (b) with different soil depths in the two plantations.
Figure 4.
The ratios of C and N to available P of C:Av_P (a) and N:Av_P (b) with different soil depths in the two plantations.

Figure 5.
Nutrient resorption rates of the two plantations. The error bars represent the standard error. The different letters indicate a significant difference of the means based on ANOVA and LSD (p < 0.05).
Figure 5.
Nutrient resorption rates of the two plantations. The error bars represent the standard error. The different letters indicate a significant difference of the means based on ANOVA and LSD (p < 0.05).
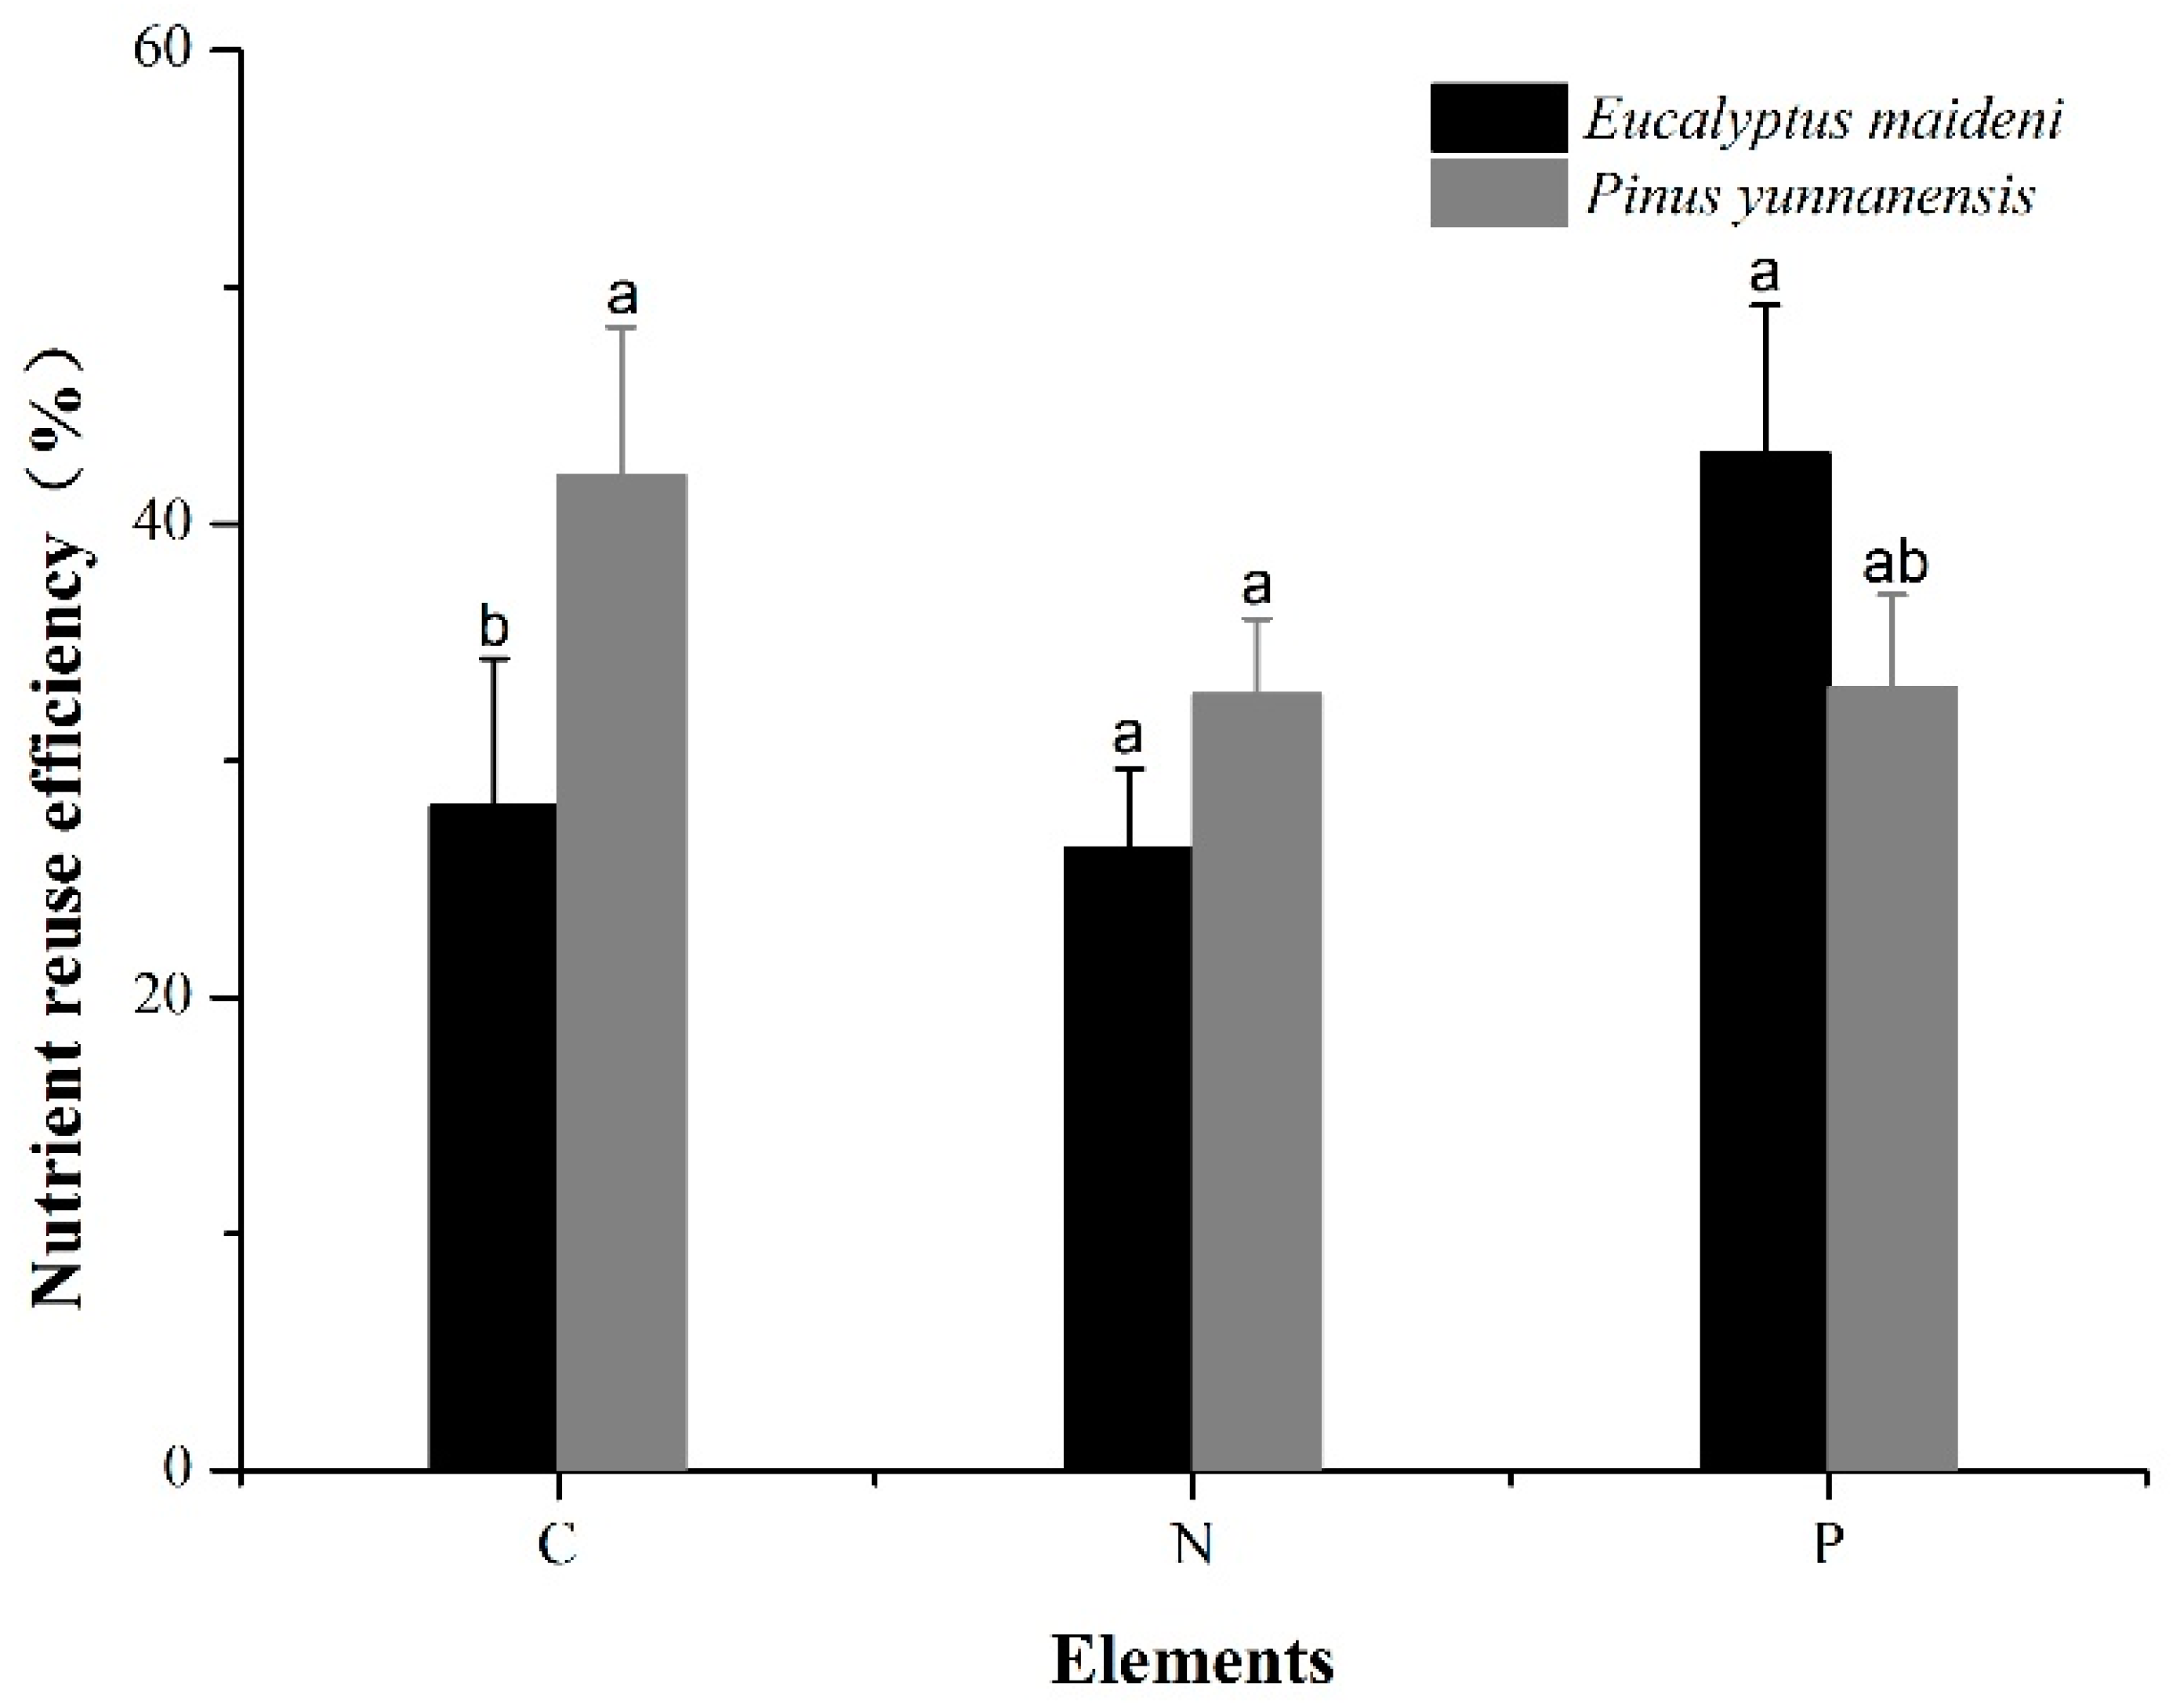
Figure 6.
The C, N, and P concentrations (a) and stoichiometric characteristics (b) of in senesced leaves.
Figure 6.
The C, N, and P concentrations (a) and stoichiometric characteristics (b) of in senesced leaves.


Table 1.
Vegetation properties of the two plantations in the study area.
| Dominant Tree Species | Height (m) | DBH (cm) | Crown Diameter (m) | Dominant Shrub Species | Dominant Herb Species |
|---|---|---|---|---|---|
| Eucalyptus maideni | 7.06 | 6.42 | 2.25 × 2.33 | Campylotropis polyantha, Dodonaea viscosa (L.) Jacq., Osteomeles anthyllidifolia (Sm.) Lindl. | Arthraxon hispidus (Thunb.) Makino, Ainsliaea henryi Diels, Rubia cordifolia L., Juncus effusus, Arundinella anomala Steud. |
| Pinus yunnanensis | 3.38 | 3.66 | 3.32 × 3.26 | Carissa spinarum, Osteomeles anthyllidifolia (Sm.) Lindl, Myrsine africana L., Dodonaea viscosa (L.) Jacq. | Arundinella anomala, Gramineae, Barleria cristata L., Elsholtzia ciliata (Thumb.) Hyland. |
DBH: diameter at breast height.
Table 2.
Mean values of the soil properties from the two selected vegetation types.
| Soil Layer | 0–10 cm | 10–20 cm | 20–30 cm | |||
|---|---|---|---|---|---|---|
| Vegetation Type | EM | PY | EM | PY | EM | PY |
| pH | 5.467 ± 0.196a | 5.990 ± 0.115a | 5.827 ± 0.096a | 5.997 ± 0.084a | 5.637 ± 0.318a | 5.990 ± 0.066a |
| SWC (%) | 33.976 ± 1.993a | 22.361 ± 1.983b | 30.494 ± 4.419a | 22.805 ± 0.955b | 30.816 ± 4.710a | 23.719 ± 0.940b |
| BD (g cm−3) | 1.026 ± 0.033a | 1.077 ± 0.048a | 1.120 ± 0.059a | 1.255 ± 0.025a | 1.172 ± 0.059a | 1.284 ± 0.078a |
| CP (%) | 50.274 ± 0.013a | 48.774 ± 0.035a | 44.402 ± 0.010a | 47.757 ± 0.003a | 44.688 ± 0.023a | 46.848 ± 0.021a |
| AP (mg kg−1) | 1.133 ± 0.061a | 1.013 ± 0.821a | 0.973 ± 0.122a | 1.000 ± 0.734a | 1.627 ± 1.103a | 0.667 ± 0.300b |
| AK (mg kg−1) | 73.333 ± 17.638b | 126.667 ± 32.145a | 70.000 ± 0.000b | 90.000 ± 17.321a | 60.000 ± 20.000b | 76.667 ± 11.548a |
| NO3−-N (mg kg−1) | 11.127 ± 0.562a | 12.907 ± 0.406a | 10.533 ± 0.284a | 12.480 ± 0.555a | 10.053 ± 0.511a | 12.147 ± 0.081a |
| NH4+-N (mg kg−1) | 4.437 ± 1.594a | 5.735 ± 4.048a | 3.567 ± 0.424a | 3.325 ± 0.058a | 2.625 ± 0.322a | 2.663 ± 0.411a |
Means and standard deviations of soil pH, soil water content (SWC), bulk density (BD), capillary porosity (CP), available potassium (AK), available phosphorus (AP), nitrate (NO3−-N), and ammonium (NH4+-N). Means with the same letter in the different soil layer are not significantly different at the 0.05 level (LSD).
Table 3.
Stoichiometric characteristics of plant organs and soil C:N:P of the two vegetation types.
| Variable | The Characteristics of C:N:P Stoichiometry | ||
|---|---|---|---|
| EM | PY | ||
| Plant organs | Leaves | 227:14:1 | 281:19:1 |
| Branches | 226:16:1 | 273:7:1 | |
| Stems | 112:12:1 | 235:7:1 | |
| Roots | 257:16:1 | 211:10:1 | |
| Average | 206:14:1 | 250:11:1 | |
| Soil depth (cm) | 0–10 | 41:16:1 | 57:8:1 |
| 10–20 | 28:12:1 | 47:9:1 | |
| 20–30 | 25:6:1 | 40:8:1 | |
| Average | 31:11:1 | 48:8:1 | |
Table 4.
Multiple linear regressions of RCN, RCP, and RNP.
| Vegetation Type | Equations | y | F | R2 | P |
|---|---|---|---|---|---|
| EM | y = 0.015x1 − 0.389x2 − 2.587x3 + 0.874x4 − 0.017x5 + 2.806x6 + 0.734x7 − 23.015 | RCN | 35.06 | 0.996 | 0.1293 |
| PY | y = −0.740x1 − 2.340x2 + 43.140x3 + 9.193x4 + 0.334x5 − 11.207x6 − 1.046x7 + 117.997 | RCN | 8.61 | 0.984 | 0.2567 |
| EM | y = 1.140x1 − 0.375x2 − 41.786x3 − 3.365x4 + 0.001x5 + 1.869x6 + 1.277x7 + 20.026 | RCP | 798.87 | 0.999 | 0.0272 |
| PY | y = 1.704x1 + 0.759x2 − 75.863x3 + 3.296x4 + 0.141x5 − 8.381x6 − 0.796x7 + 131.985 | RCP | 3848.39 | 0.999 | 0.0124 |
| EM | y = −0.109x1 + 1.121x2 − 9.592x3 − 1.810x4 − 0.002x5 + 1.342x6 − 0.343x7 + 0.593 | RNP | 520.05 | 0.999 | 0.0338 |
| PY | y = 0.059x1 + 1.665x2 − 16.395x3 − 1.037x4 − 0.046x5 + 2.316x6 + 0.206x7 − 16.212 | RNP | 583.43 | 0.999 | 0.0319 |
RCN (C:N), RCP (C:P), and RNP (N:P). x1, x2, x3, x4, x5, x6 and x7 represent SOC, TN, TP, AP, AK, NO3−-N and NH4+-N, respectively.
© 2018 by the authors. Licensee MDPI, Basel, Switzerland. This article is an open access article distributed under the terms and conditions of the Creative Commons Attribution (CC BY) license (http://creativecommons.org/licenses/by/4.0/).
Share and Cite
MDPI and ACS Style
Pang, D.; Wang, G.; Li, G.; Sun, Y.; Liu, Y.; Zhou, J. Ecological Stoichiometric Characteristics of Two Typical Plantations in the Karst Ecosystem of Southwestern China. Forests 2018, 9, 56. https://doi.org/10.3390/f9020056
AMA Style
Pang D, Wang G, Li G, Sun Y, Liu Y, Zhou J. Ecological Stoichiometric Characteristics of Two Typical Plantations in the Karst Ecosystem of Southwestern China. Forests. 2018; 9(2):56. https://doi.org/10.3390/f9020056
Chicago/Turabian StylePang, Danbo, Genzhu Wang, Guijing Li, Yonglei Sun, Yuguo Liu, and Jinxing Zhou. 2018. "Ecological Stoichiometric Characteristics of Two Typical Plantations in the Karst Ecosystem of Southwestern China" Forests 9, no. 2: 56. https://doi.org/10.3390/f9020056
Note that from the first issue of 2016, this journal uses article numbers instead of page numbers. See further details here.