Article

A Revised Historical Fire Regime Analysis in Tunisia (1985–2010) from a Critical Analysis of the National Fire Database and Remote Sensing

1
Université Manouba, UR Geomatique & Geosystemes, Campus Universitaire BP 95, Manouba 2010, Tunisia
2
Faculté des Sciences Humaines et Sociales de Tunis, 94 Bd du 9 avril 1938, Tunis 1007, Tunisia
3
Department of Environmental and Natural Resources Management, University of Patras, G. Seferi 2, Agrinio GR-30100, Greece
4
Institut de Recherche pour le Développement (IRD), 2 rue des sports, Tunis 1004, Tunisia
5
Laboratoire des ressources sylvo-pastorales, Institut Sylvo-Pastoral de Tabarka, Tabarka 8110, Tunisia
6
Institut de Recherche pour le Développement (IRD), UMR CEFE 5175, CNRS, Université Montpellier, Université Paul Valery Montpellier, EPHE, IRD, 1919 Route de Mende, 34293 Montpellier CEDEX 5, France
*
Author to whom correspondence should be addressed.
Forests 2018, 9(2), 59; https://doi.org/10.3390/f9020059
Submission received: 18 December 2017 / Revised: 15 January 2018 / Accepted: 23 January 2018 / Published: 26 January 2018

Abstract

:
Long-term fire history reconstructions provide fruitful information in the context of global change. Global remotely-sensed burned areas offer a uniform estimate of fire regimes worldwide, but hardly capture small fire events and cover only the last 20 years. Burned areas from national statistics often lack credibility due to discrepancies in fire report protocols between countries, partial data records and uncertain burned area estimates from field observations. However, they constitute a unique and valuable alternative long-term key source of information. We provide here a detailed critical analysis of the fire database in Tunisia, on the southern boundary of the Mediterranean basin and with a contrasted socio-economic environment compared to the more studied European side. We analyzed the fire record database with a quality checking protocol, combined with remote sensing burned area characterization from Landsat images. The high uncertainties in fire numbers could not lead to any conclusion for an accurate trend estimate. The corrected burned area lead to an average yearly burned area of 1799 ha year−1 compared to previous estimates of 1017 ha year−1, leading to a fraction of burnable land affected by fires of 0.19%, on the lowest range of observations in the Mediterranean basin. From this corrected database, we revised the usually assumed burned area decrease in this region, with no significant trend detected over the 1985–2010 period. We conclude on the need for thorough assessment of data quality in fire history reconstruction from national statistics to prevent misleading conclusions, and for an increased credibility, in order to be further used in fire models benchmarking or fire weather analysis. Our results can contribute to the under-represented fire regime analysis on the southern boundary of the Mediterranean basin.

1. Introduction

Fires are an intrinsic disturbance of ecosystems worldwide [1], driven by climate features and human ignitions. The response of fire ignitions and spread to these drivers are however stochastic, and the combination of fire weather with human variables can be spatially and temporally heterogeneous [2]. Long-term historical fire data, across various bioclimates and contrasted socio-economic conditions, are then essential for understanding how fire activity responds to these drivers [3], how they might change over time [4] and how they successively spread over landscapes and affect ecosystem functioning and management [5]. Since the 1990s, global remote sensing has substantially improved our knowledge and understanding of global pyroregimes based on burned area [6,7], and more recently based on finer resolution burned area data for fire patch characterization [8,9,10]. These global datasets cover however only roughly the last 20 years, mostly focused on large fires, and with some remaining uncertainties on burned area [11,12]. Drivers of the seasonal variations on burned area, its interannual variability, and the global spatial pattern of these drivers could then be assessed, both for local land management and for global fire modelling [13] aiming at integrating combustion fluxes in biosphere/atmosphere interactions [14].
However, the need for longer-term information on fire activity has quickly emerged. As a first need, global modelers need to figure if the backward burned area reconstruction outside the model benchmarking period is still valid [15]. Also, fire effects on ecosystems and biosphere/atmosphere interactions can last for decades to centuries, so that understanding present ecosystems functioning requires having a better picture of their disturbance history [16]. Finally, the combination of fire weather and anthropogenic conditions leading to fire start and spread can vary over time [17] so that unexpected and nonlinear changes in fire activity can be observed [18]. In addition, information on small fires from this local information, allows for a better description of the source of ignition (mostly missing in global remote sensing products) without which understanding why larger fires occur is hard to apprehend.
Various ways of assessing historical fire activity (locally or globally) can be used: charcoal residues in soils, lakes or marine sediment accumulation areas can witness past combustion activities across centuries to millennia [19]. Burned scars on tree rings can inform on local fire history on a yearly basis for decades to centuries [20]. The most informative historical fire archive still remains fire statistics (when they exist) where precise fire location, burned area, date, even timing and duration or fire types can be referenced. This information even if being not global and short in time (few decades to one century at best) [4] has been used for global historical emission reconstruction [21,22], and for assessing historical changes in fire drivers [17,23,24,25].
Using raw unchecked fire data can be misleading, and numerous cases where burned area or fire number were misreported have been referenced [26,27,28,29], particularly in the past when they were visually inferred from field observations, with no standardized protocol on minimum fire size. The heterogeneity in the type of fires (agricultural, wildfires, forest fires, or types of land ownership being state or private) and the minimum fire size referenced actually referenced in databases can lead to contrasted estimates and highly mislead subsequent conclusions and interpretations [17,26].
We focused our study in deeply and carefully analyzing the historical fire database in Tunisia, on the southern boundary of the Mediterranean basin and the most northern part of Africa. Mediterranean type ecosystems are particularly fire-prone [30], due to wet and cool winters favoring biomass growth and dry/hot summers inducing its critical desiccation [31]. Most Mediterranean countries on the European side have been collecting fire statistics since the 1970′s now assembled in the European Forest Fire Information System (EFFIS) initiative [32], allowing for a better understanding of fire drivers, their temporal trends, and local variations across regions [33,34]. For the southern boundary of the Mediterranean basin, few studies, most of them hardly accessible to an international audience, could be performed in Tunisia [35,36,37], Algeria [38,39] or Morocco [40]. Analyses mostly remain on annual burned area synthesis only. This region is however at the southern boundary of the Mediterranean bioclimate, in its transition zone toward the arid climate, with summer drought and temperatures which could be expected to increase in the near future [41]. Also, countries like Algeria are highly fire-prone within the Mediterranean context, without clearly disentangling the socio-economic or climatic reasons. Assessing the fire drivers on this part of the Mediterranean basin with a contrasted socio-economic status compared to Europe and on the driest and hottest part of the Mediterranean bioclimate would provide fruitful information for a better understanding of historical fire regimes of the Mediterranean basin in the past and forecast potential trends in the future under social or climate changes.
We went through the official Tunisian fire database, with the raw data, to fully analyze each fire event, in a context where this fire database was highly politically controlled by the government, until 2011, year of the Arab Spring leading to a recent less-censored access to governmental data. Our objectives were (i) to analyze the fire database deep into details by investigating and quantifying all the errors, uncertainties or missing data, (ii) to check the burned areas referenced for large fires with remote sensing and (iii) to provide an uncensored and critical reference fire database with the corresponding maps of fire contours. Our final goal is to describe the seasonal fire regime and temporal trend for the 1985–2010 period across the Tunisian climate gradient, with their corresponding uncertainties. We aim at providing a fully detailed description of the database, for a further use by local forest management services, or international synthesis on fire regimes and environmental risk assessment in the Mediterranean basin.

2. Materials and Methods
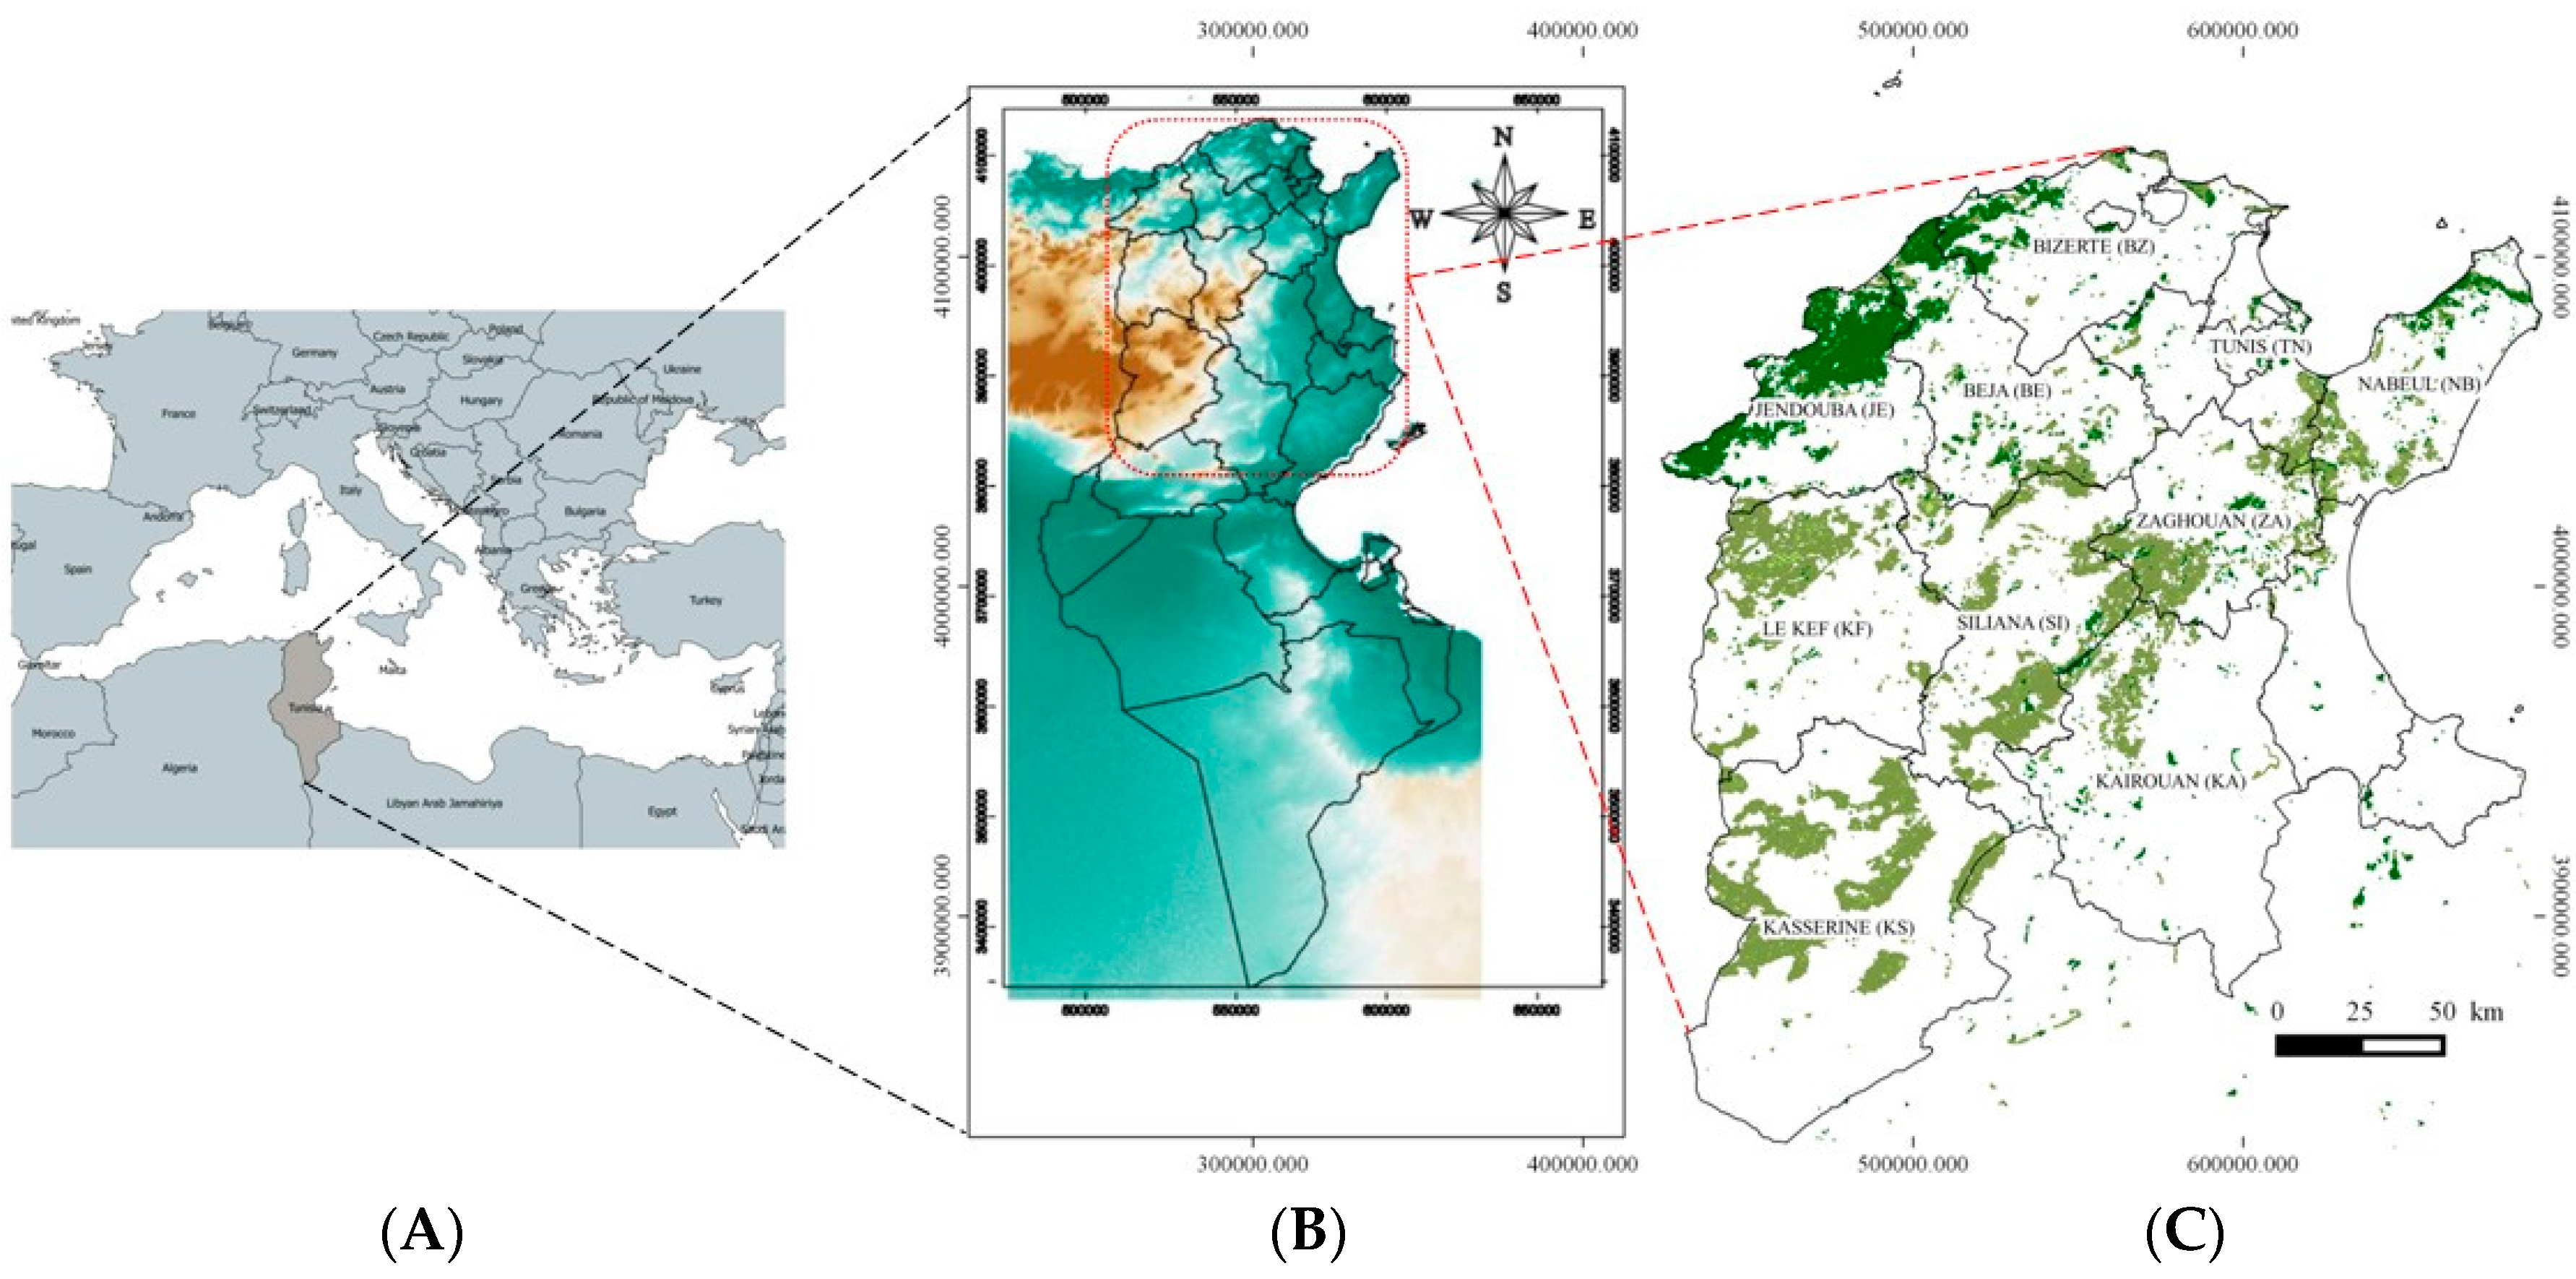
2.1. Study Area

The study area covers the northern part of the Tunisian national territory (7° E, 35° N/12° E, 38° N) where forest ecosystems occur in the humid Mediterranean and arid bioclimates (Figure 1). The region is mountainous with elevations ranging from 0 m on the coast to 1235 m at Mount Chaambi (Atlas Mountain range). The regional climate is Mediterranean, where precipitation is mainly distributed in autumn, winter and spring, while summers are dry, with a strong north/south gradient (see Table 1 for climate description of Tunisian administrative units). Tunisia covers a total area of 165,000 km2, among which only 9416 km2 are covered by forest and shrublands. Quercus suber L. covers 70,000 ha on the northern part of the country where mean annual precipitation is 800 mm varying between 700 m and 1500 m, and mean temperature is 16 °C [42,43]. Pinus halepensis Miller covers 361,000 ha in the southern part of the country where mean annual precipitation is 400 mm [44]. Mediterranean shrublands cover 328,000 ha and are composed of Arbutus unedo L., Erica arborea L., Cistus spp. L., Phyllirea latifolia L., and Pistacia lentiscus L. on the northern coastal part [45], and Rosmarinus officinalis L., Cistus spp. L., and Lavendula spp. L. in the central part. Tunisia is composed of administrative units (called “gouvernorat”) and covers a climate gradient from north to south, with more humid and mildest climate in the north, and driest/warmest conditions in the south (Table 1).

2.2. The Tunisian National Fire Database

We used the official fire database from the Tunisian forest services (Direction Générale des Forêts, further referenced as DGF) available since 1971 in a digital format. DGF delivers annual fire reports, where each fire event is referenced by its burned area (in ha), the date and time of fire detection and fire extinction. Additional information on vegetation type affected is also provided, as well as the location of the fire events, according to the hierarchically structured administrative units (‘gouvernorat’, ‘délégation’ and ‘secteur’), and eventually the name of the main landmark (name of a mountain, a watershed or a village). Data are collected from field observations by local foresters to estimate burned area and vegetation type affected. Data are stored as yearly tables. This final file is the official dataset used for governmental reports. DGF actually assembles, processes and delivers the official data derived from the local files collected at the Rades forest service center (further called RADES). In turn, RADES also stores and provides a set of table files of raw data. The data assembled in RADES is itself an assemblage of files collected from local forest services (at the administrative level of the ‘gouvernorat’), called CRDA (Commissariat Régional au Développement Agricole), where fire events are also registered. Local foresters then report fire events at the corresponding CRDA, referencing the burned area affecting their administrative unit. In order to check and minimize errors in the reported fire events and potential missing transmissions across services, we collected the fire report tables from DGF, RADES and CRDAs.
All fire events were then assembled in a merged single final fire table (further referenced as COR-1). We started with the DGF official fire table (mostly used in previous scientific reports and publications), that we updated with additional fires identified in RADES or CRDA when they were missing, and provided the source where the fire event was stored. We also homogenized and standardized the referencing of fire locations with the official alpha-numeric codes of the administrative units they belong to, as the fire locations were in Arabic since 2002, and in French before that period with numerous spelling versions of the same Arabic name (e.g., the Bizertegouvernorat”, being spelled into Bizert, Bizerte, Binzert or Benzert). Vegetation types affected by fires, provided as a non-standardized description, were also coded into Forest (F), Shrublands (S), Herbaceous (H), Litter (L), or Agriculture (AG). Standardized codes finally facilitated the filtering and automatic analysis. A total of 4758 fire events were assembled.

2.3. Remote Sensing Datasets

2.3.1. Fire Detection from Historical Landsat Archives

To ensure that most large fires were actually stored in the dataset, and to evaluate the reliability of the referenced burned areas, we processed the Landsat-5 and Landsat-7 time series satellite images for the 1985–2010 period acquired free from the United States Geological Survey (USGS) and European Space Agency (ESA) archives, as the most extensive satellite database for fire history reconstruction [46,47]. In total, six tiles were processed, and for each tile all available Landsat images, excluding those covered by clouds or corresponding to dates where no fires were expected, were initially considered. The number of available Landsat images from both archive sources were 558 (path/row 191/34), 586 (path/row 191/35), 594 (path/row 191/36), 589 (path/row 192/34), 592 (path/row 192/35) and 595 images (path/row 192/36) covering the period from 1985 to 2010, although not all of them were finally processed.
Landsat images were processed with the Burned Area Mapping Software (BAMS) [48] to provide fire contours. BAMS is based on a two-phase semi-automated processing chain to provide fire contours by computing several spectral indexes commonly used in burned area mapping (e.g., Normalized Differential Vegetation Index (NDVI), Burned Area Index (BAIM), Global Environment Monitoring Index (GEMI), Normalized Burn Ratio (NBR), Mid Infrared Burn Index (MIRBI)). BAMS actually uses a two-phase strategy aiming to balance commission and omission errors by using strict criteria in the first phase (conservative), to identify seed pixels and applying a more flexible criterion in the second phase to progressively map the burned area until the whole burned patch is captured.
Fires larger than 4 ha could be detected. Yearly fire polygons could then be drawn semi-automatically, with reference to the Landsat scene (date and tile) used for the analysis. The final date for each fire polygon is then highly uncertain due to the 16-day time step of Landsat image acquisition (given that one satellite is in orbit, that drops to 8 when the two satellites operate simultaneously since Landsat 7 orbits 8 days behind Landsat 5) or even longer when Landsat images were covered by clouds or not available for download. In turn, it was hardly ever the case that we could provide an accurate dating of the fire events derived from Landsat. For each fire polygon, we then identified the location (gouvernorat, delegation and secteur from the Tunisian administrative map) and year of the fire event, and searched for the concordance with fire events occurring in the same area during that year stored in the forest service database. When matching, we then corrected the burned area from official statistics with the Landsat-based burned area and referenced the data source of this corrected burned area as LANDSAT. However, some large fires identified from Landsat were not stored in the official database. For these cases, we provided, at best, the month of the fire event if two consecutive Landsat scenes could identify the pre-fire unburned and post-fire burned patch within a monthly time step. In case we could not identify the month, we referenced the fire with ‘NA’ (not available) in the ‘month’ and ‘day’ column. Vegetation type affected by the fire was derived from the Tunisian forest inventory [49].

2.3.2. Global Fire ‘Hot-Spots’

To cope with these missing dates of the fire events identified in the LANDSAT database, and not referenced in the forest service database, we used the global fire hotspot MCD14ML collection 5 database from the Moderate-Resolution Imaging Spectroradiometer (MODIS) sensor available since 2000 [50,51]. MCD14ML provided fire date and location information identified from temperature anomalies during the fire event from satellite passes over the study area (4 times per day). It’s however acknowledged that (i) the whole burned patch might not be covered by hotspots due to cloud cover, (ii) that committed hotspots can be observed due to solar contamination [52], and (iii) that hot spots could be located outside the fire patch due to spatial uncertainty. Errors associated to fire hotspot location and timing have been referenced to vary between 90 m to 2200 m for the spatial uncertainty [53,54], and 70% of ignitions were estimated with less than 12 h uncertainty [54]. Due to its spatial uncertainty, MCD14ML was not used for fire contours. From MCD14ML fire hot spots, over the 2000–2010 period, we allocated to each undated LANDSAT fire the earliest burn date from the MCD14ML database belonging within fire polygons in the LANDSAT data, with a buffer zone of 2000 m to account for the spatial uncertainty. We acknowledge here a remaining temporal uncertainty of 1 to 3 days to the timing of the undated LANDSAT fires.

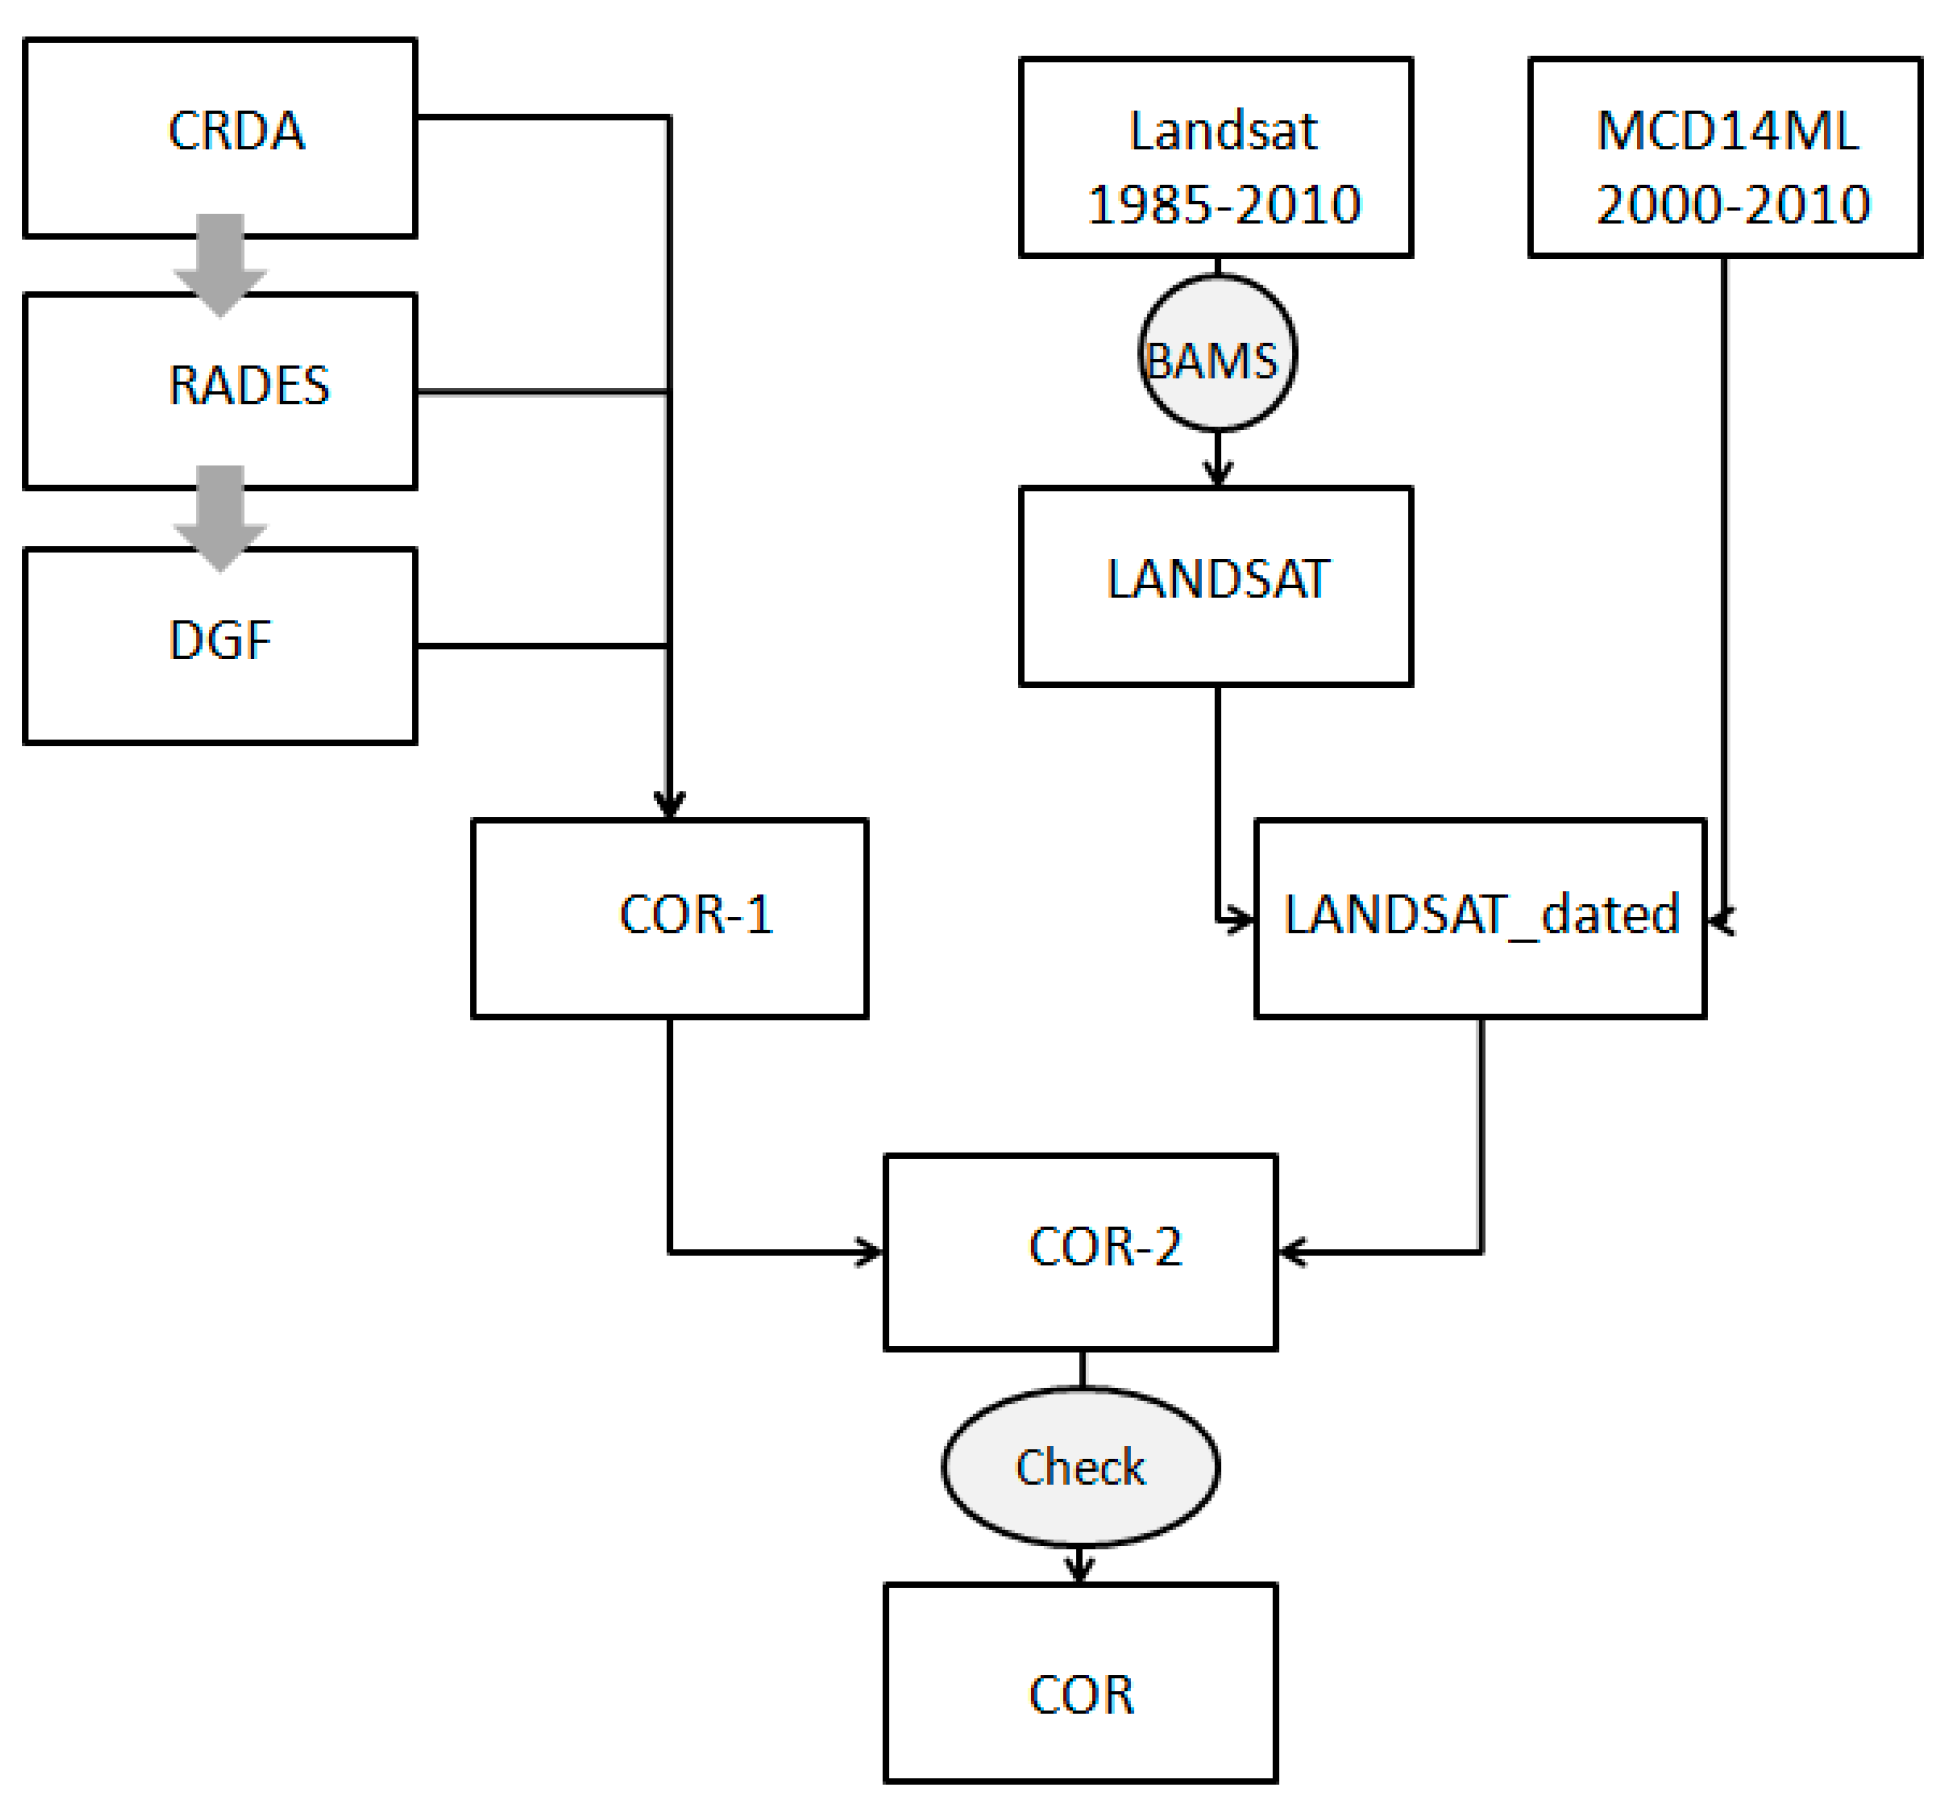
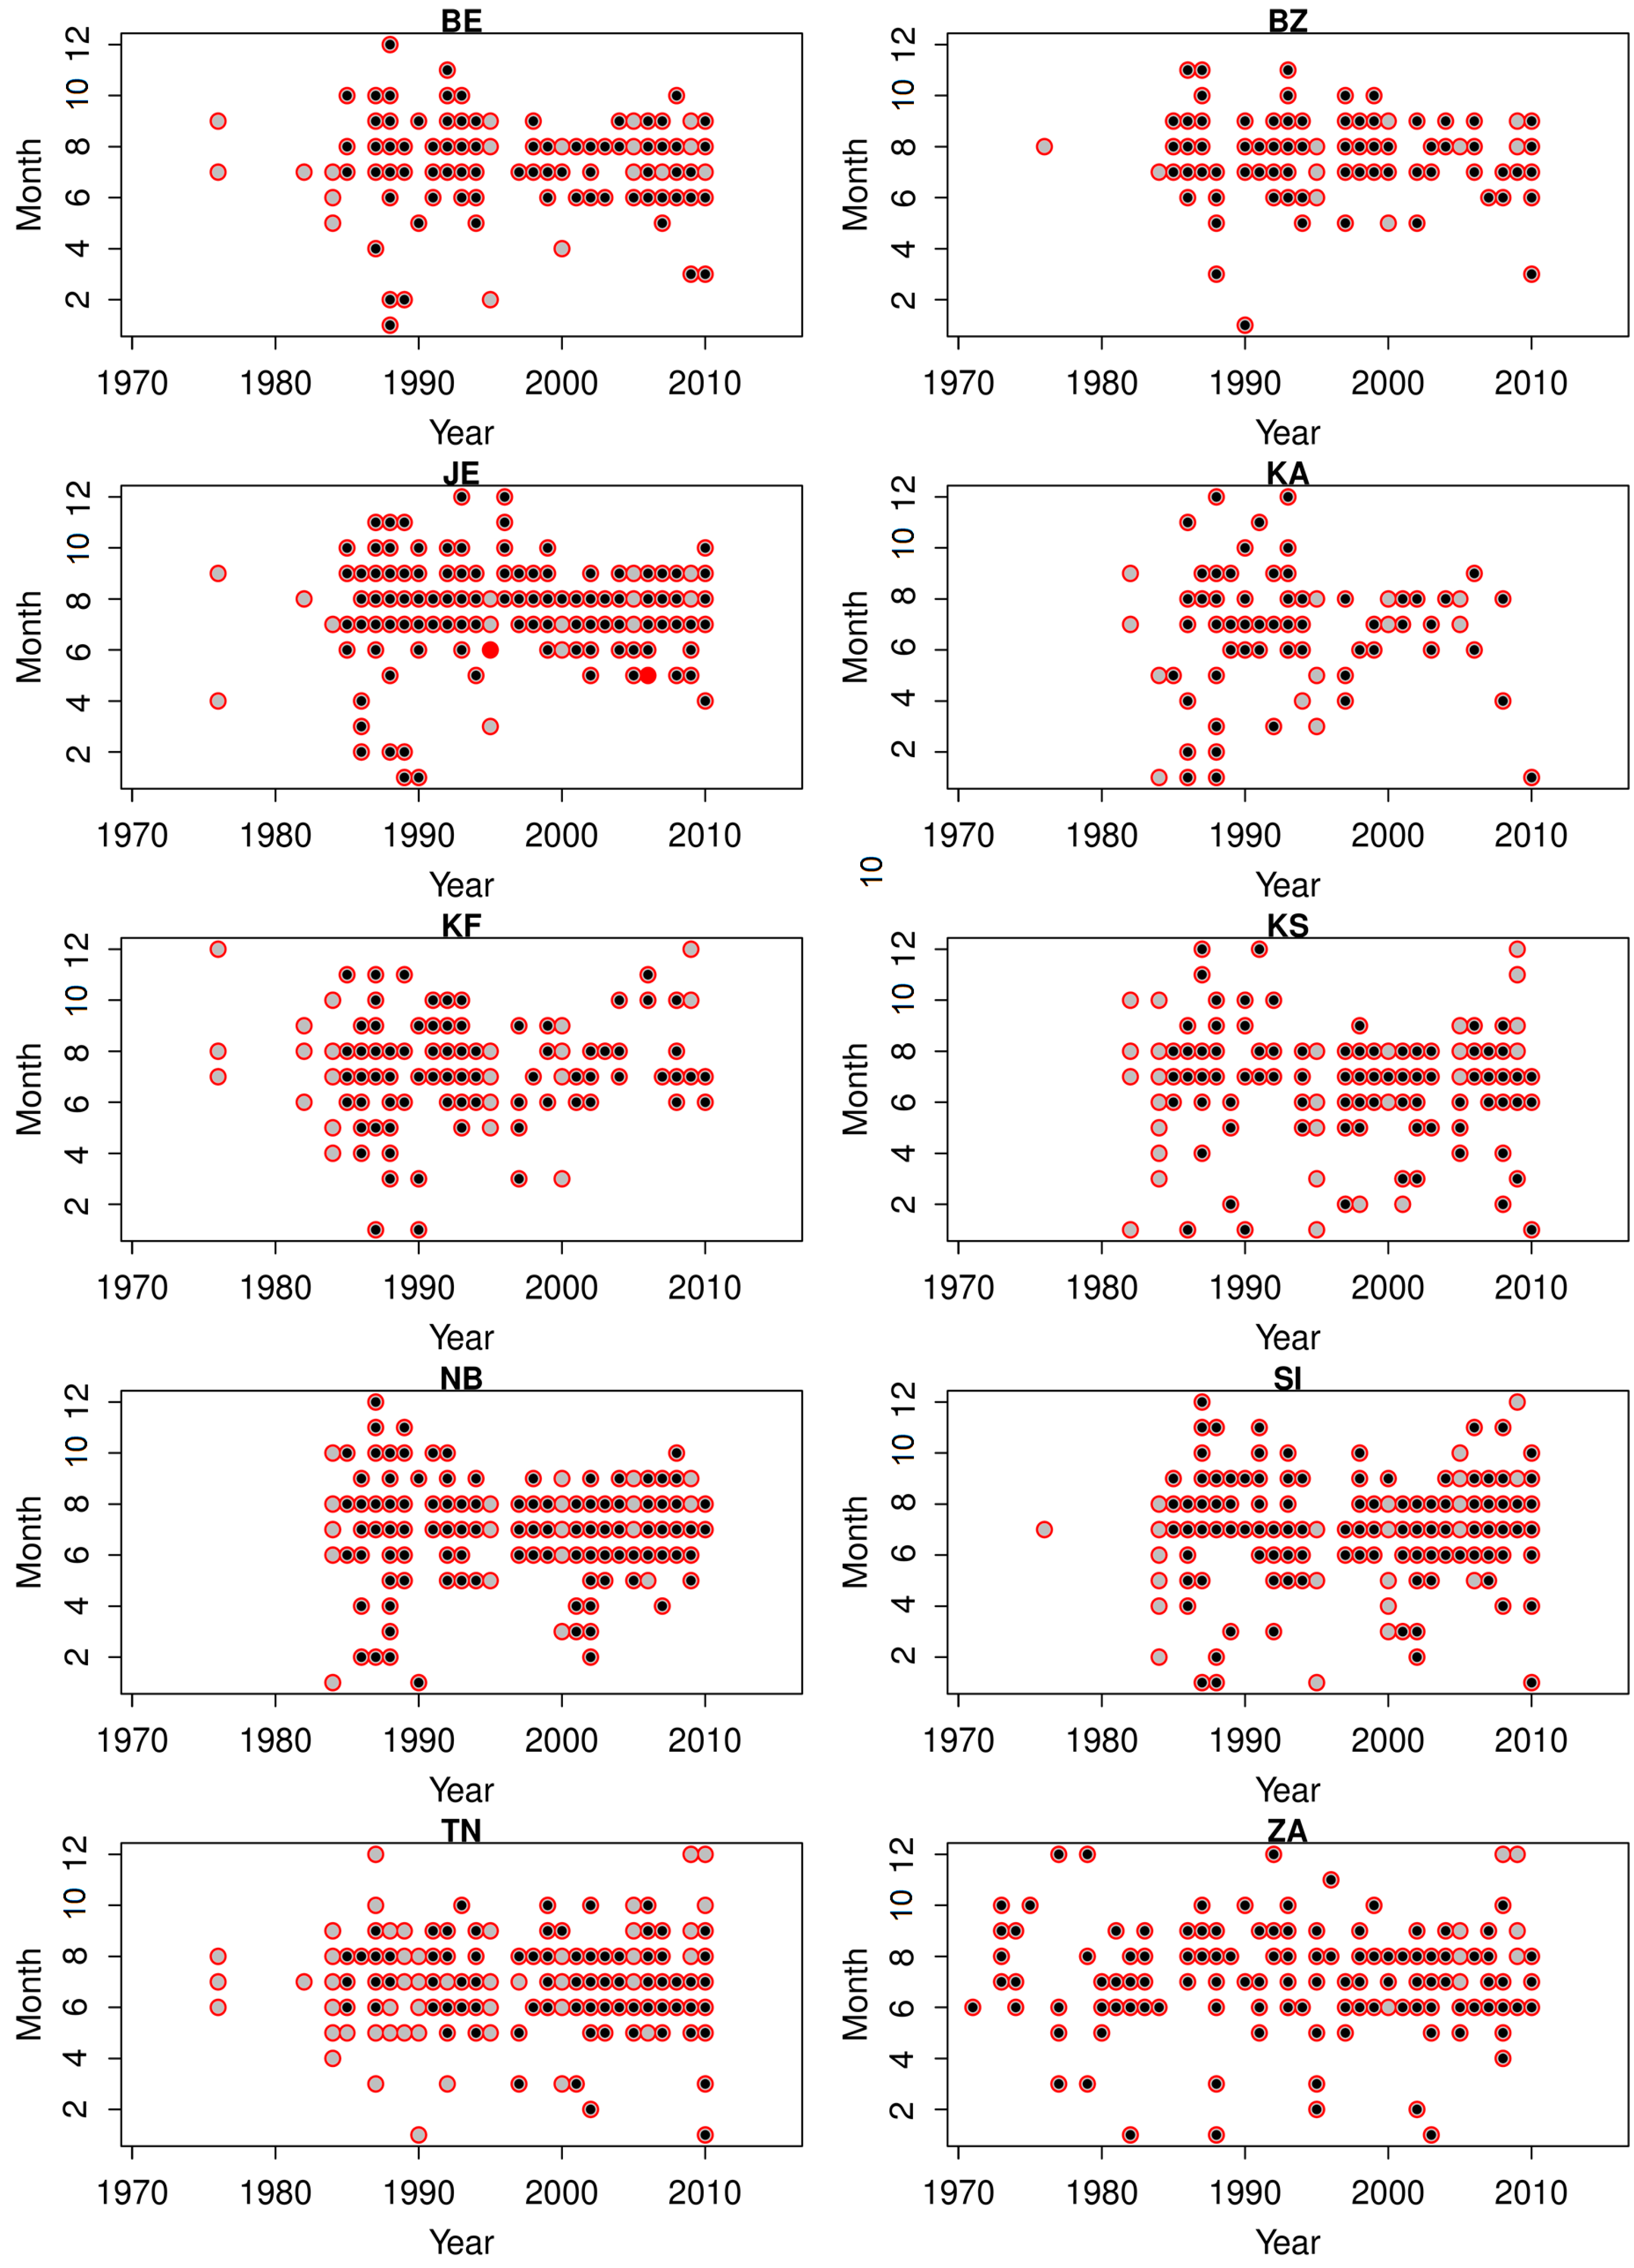
2.4. Data Assemblage

An intermediate database (further called COR-2) was then composed of the assembled forest services list of fire events COR-1, for which the burned area for the largest fires (>4 ha) were corrected and referenced as a LANDSAT source for corrected value. When a given fire was missing in the official statistics and was identified from LANDSAT, the fire event was added to the database, and the corrected burned area data source was referenced as LANDSAT.
We finally checked for redundant fires in COR-2, when similar fire events were identified at the same date (68 cases actually happened). When fires occurring the same day were identified in different non-neighboring delegation or secteur, we kept this fire in the database. When fires were identified for the same day, with similar further information on burned area, similar location (delegation and secteur) and vegetation type, we removed one of them. When fires occurring on the same day were identified on neighboring gouvernorat, delegation or secteur, we checked for their landmark location name and actually assembled the burned areas of each event in one single fire. When contacting forest officers, we actually figured that each CRDA provides the burned area in its own administrative region only, so that a single fire event can be referenced twice or more and split into smaller fires if covering different gouvernorat. When available with LANDSAT (most of the cases for large fires), we could assemble with high confidence these replicated fire events into one single large fire. When not available, we made the assumption they had to be assembled (6 cases). The final database (further called COR) is finally provided. The whole processing chain is described in Figure 2. As an illustration of the regional fire distribution in Tunisia, we finally located in a Geographic Information System (GIS) database each fire event larger than 4 ha from the COR-1 database, based on the gouvernorat, secteur administrative information and the landmark names identified on a georeferenced topographical map. This database was then completed with the LANDSAT fire polygons.

2.5. Data Analysis

From the DGF and revised COR dataset, we provided the main descriptors of the fire regime in each gouvernorat of Tunisia across the climatic gradient. The annual burned area and fire numbers along the 1985–2010 timeline from the DGF and COR data were calculated. We also provided a comprehensive description of monthly missing data for each gouvernorat so that we could propose an associated error estimate of the yearly burned area and fire number. Regarding the spurious missing months in the database based on the review of monthly fire number seasonality in Mediterranean countries in Europe (EFFIS [32]), and the southern boundary of the Mediterranean basin [40,55], we proposed a gap-filled estimate of yearly and monthly fire numbers. When no fires were registered in a given month, we gap-filled for each gouvernorat the missing months with the mean, minimum and maximum values of fire numbers registered for this month when the data exists. In turn, we got a range of uncertainty based on the observed extremes, assuming that the missing months did not experience out-of-the-range fire numbers.
We conducted a fire size distribution analysis to check how our data were following the self-criticality hypothesis observed globally [9] and locally in the Mediterranean basin [56]. We fitted a linear regression between the log10-scaled fire number (Nfires) and the log10-scaled fire size class (Sfire) for each gouvernorat according to Equation (1):
Nfires = a + k Sfire
where a is a constant and k is the slope of the regression, as an indicator of the dominance of small fires compared to large fires.
Statistical analyses on the temporal trends of burned area and fire numbers were performed with a bootstrapped Theil-Sen [57] test using the ‘open air’ package from R-cran [58]. Data analysis, statistics and graphs were performed using R-cran [59].

3. Results

3.1. A Critical Analysis of Official Statistics from Forest Services

As a first step, we analyzed the yearly records of fire events for each gouvernorat along the 1971–2010 period derived from the official statistics of DGF, RADES and CRDA. A total of 3284 fire events were recorded in the DGF database, 1005 additional events in RADES and 57 in CRDAs, leading to a total database of 4488 fire events in the COR database. Figure 3 represents the fire number by year for each data source. For example, we observed for years 1995 and 2001 almost no fire record in the DGF database. However, numerous fires were recorded in the RADES files. For the Jendouba (JE) gouvernorat, extra data were available from the CRDA. When looking at vegetation types affected by fires (Figure 3), we can identify a temporal instability in the record of agricultural and herbaceous fires, mostly for the Silina (SI) and Tunis (TN) gouvernorat, so that removing these fires substantially reduced the high fire increase since the year 2000 in these areas, and in the resulting synthesis for the whole of Tunisia. We removed these fires from further analysis to keep a stability in fire types analyzed. A total of 3558 fire events were then further analyzed.
As a second step, and based on previous results from Spain [26] and France [17], we checked for the temporal stability of the minimum fire size detected. Figure 4 illustrates, for each gouvernorat, the temporal trend of fire event’s sizes. We did not detect any peculiar change in the minimum fire size along time, nor major differences among gouvernorats. We then kept all the 3558 fire events for further analysis, among which 1911 were larger than 0.1 ha, and 2974 were larger than 0.01 ha.
With this filtered and homogenized database COR-1, we then plotted the years and months where at least one fire is detected, as an indicator of potential missing fires in the data records. Official fire records are supposed to cover the whole year, and within the Mediterranean bioclimate we expect to have fires at least during the June-September period. Months with no fire during this period are considered as highly suspicious. Figure 5 then represents, for each gouvernorat and for each year (X-axis), the months (1 to 12 representing the January to December period of the year, Y-axis) where at least one fire has been identified in DGF, and additional fires were collected in RADES and CRDA. We could identify here that before 1985, the database is highly uncertain with many months registering no fires. This period has been further removed from the analysis. During the 1985–2010 period, the data record is much more complete. However, we can identifiy some suspicious years where monthly records seem to be missing. For example, the year 1995 and 1996 had almost no records for all gouvernorat in the DGF database. We could however fill out some missing data for these years from the RADES and CRDA databases in COR-1. We conclude here that the time series in fire number and burned area in Tunisia has to be considered with caution according to the data source being used, and that missing data sporadically occur, creating a substantial source of uncertainty in the fire number and burned area along the studied period.

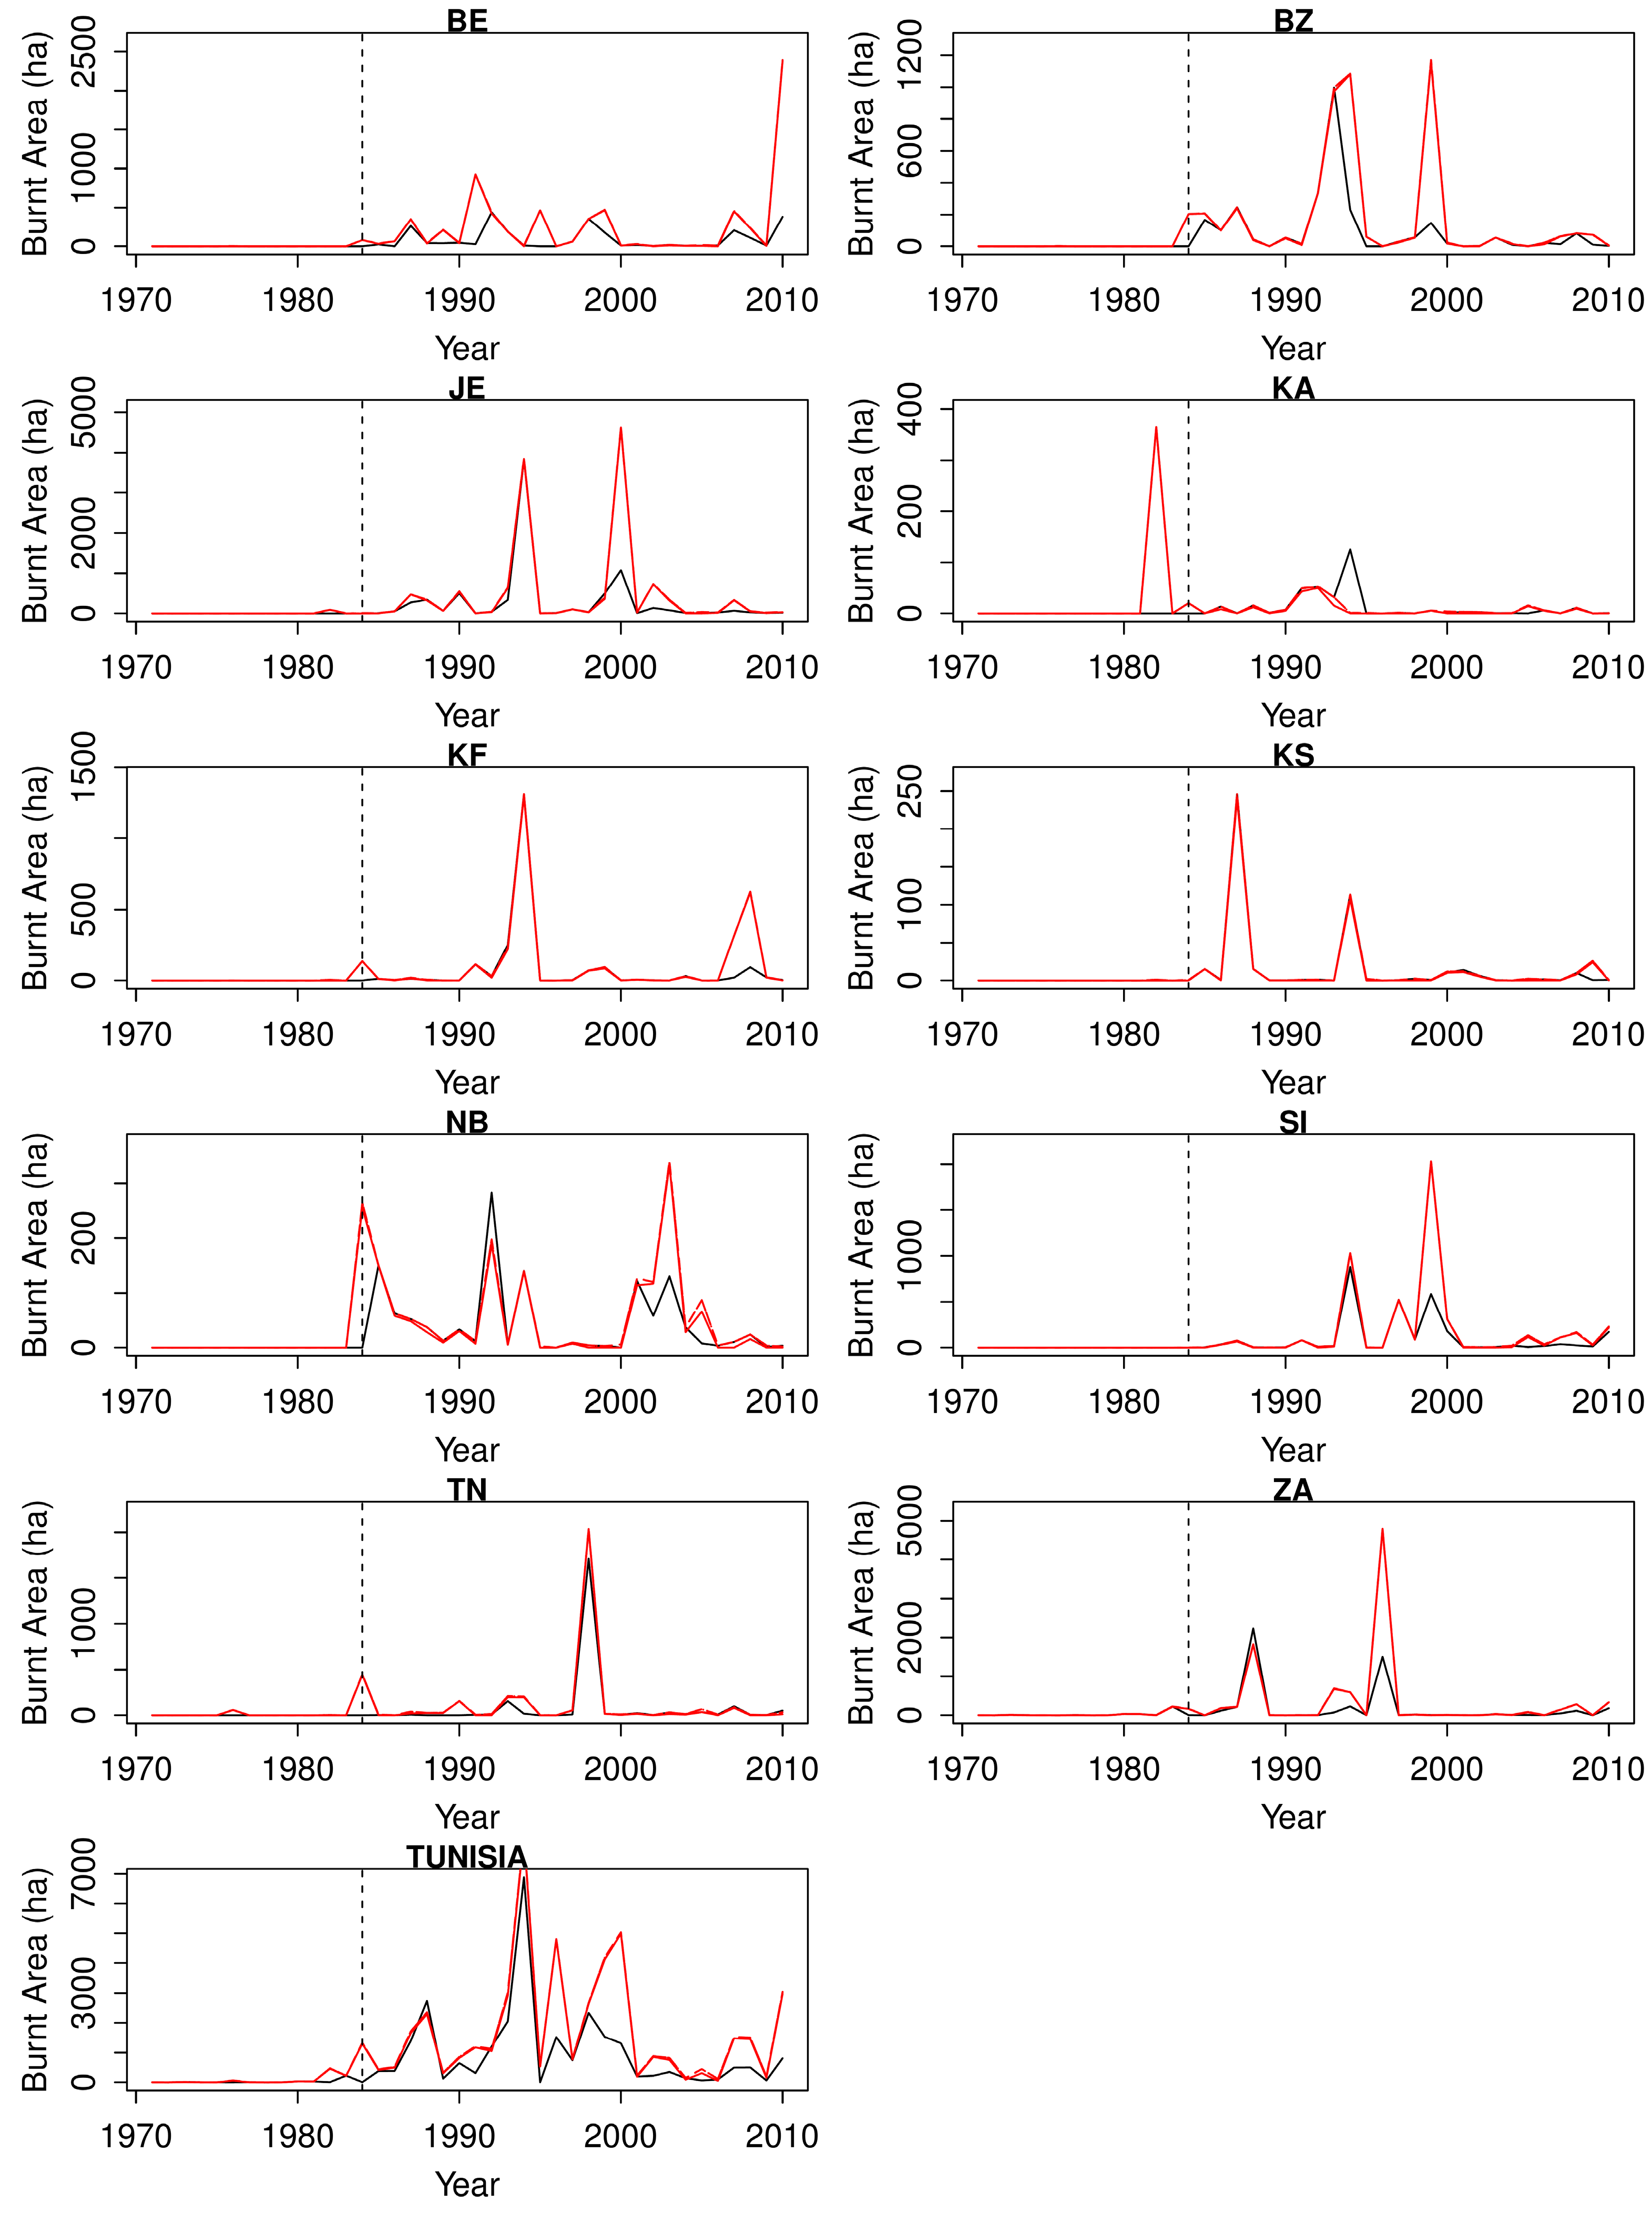
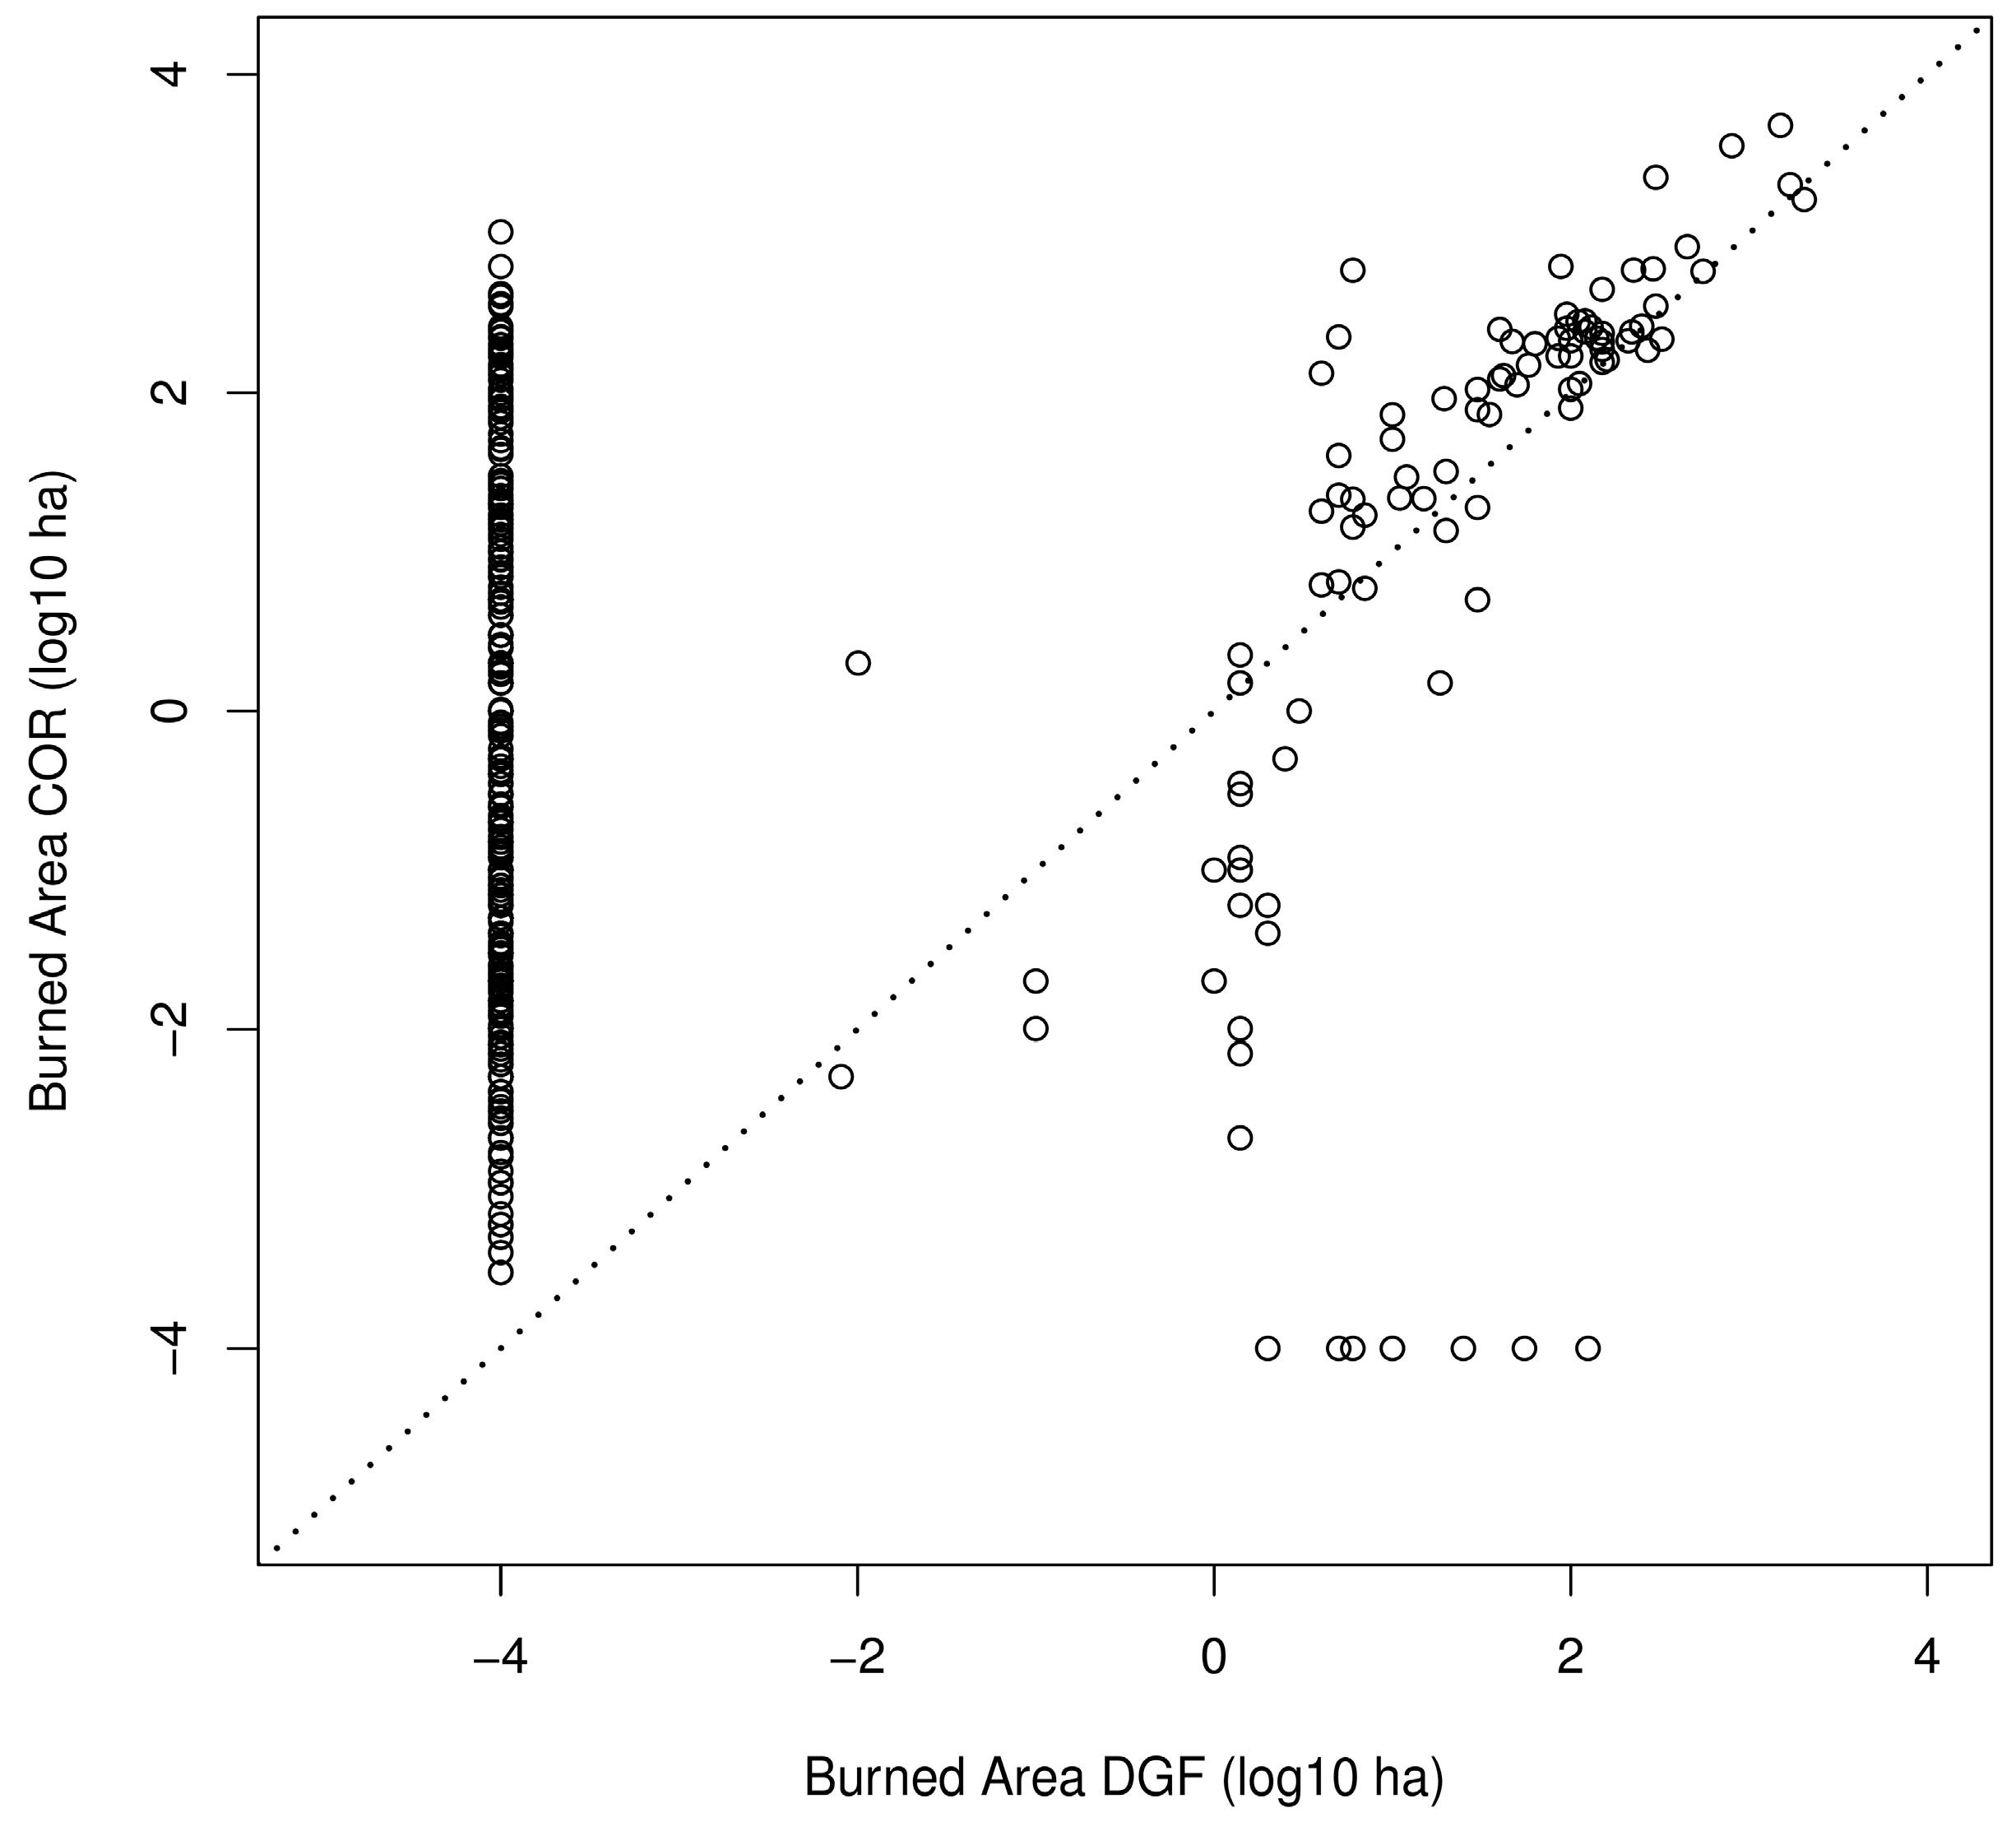
3.2. Burned Area Corrections from Landsat Data

From the Landsat image analysis, a total of 130 fire events could be identified. Among these fire events, 78 were actually reported in the official fire database, representing 60% of the database. When plotting the official burned area against the Landsat evaluation of the burned area for each fire event, we could identify a high underestimation in the burned area from official sources, particularly after 2000, varying from 30% underestimation and up to 600% (Figure 6). Fire contours are presented in Figure 7B, as well as the location of fires >4 ha referenced in the COR-1 database (Figure 7A).

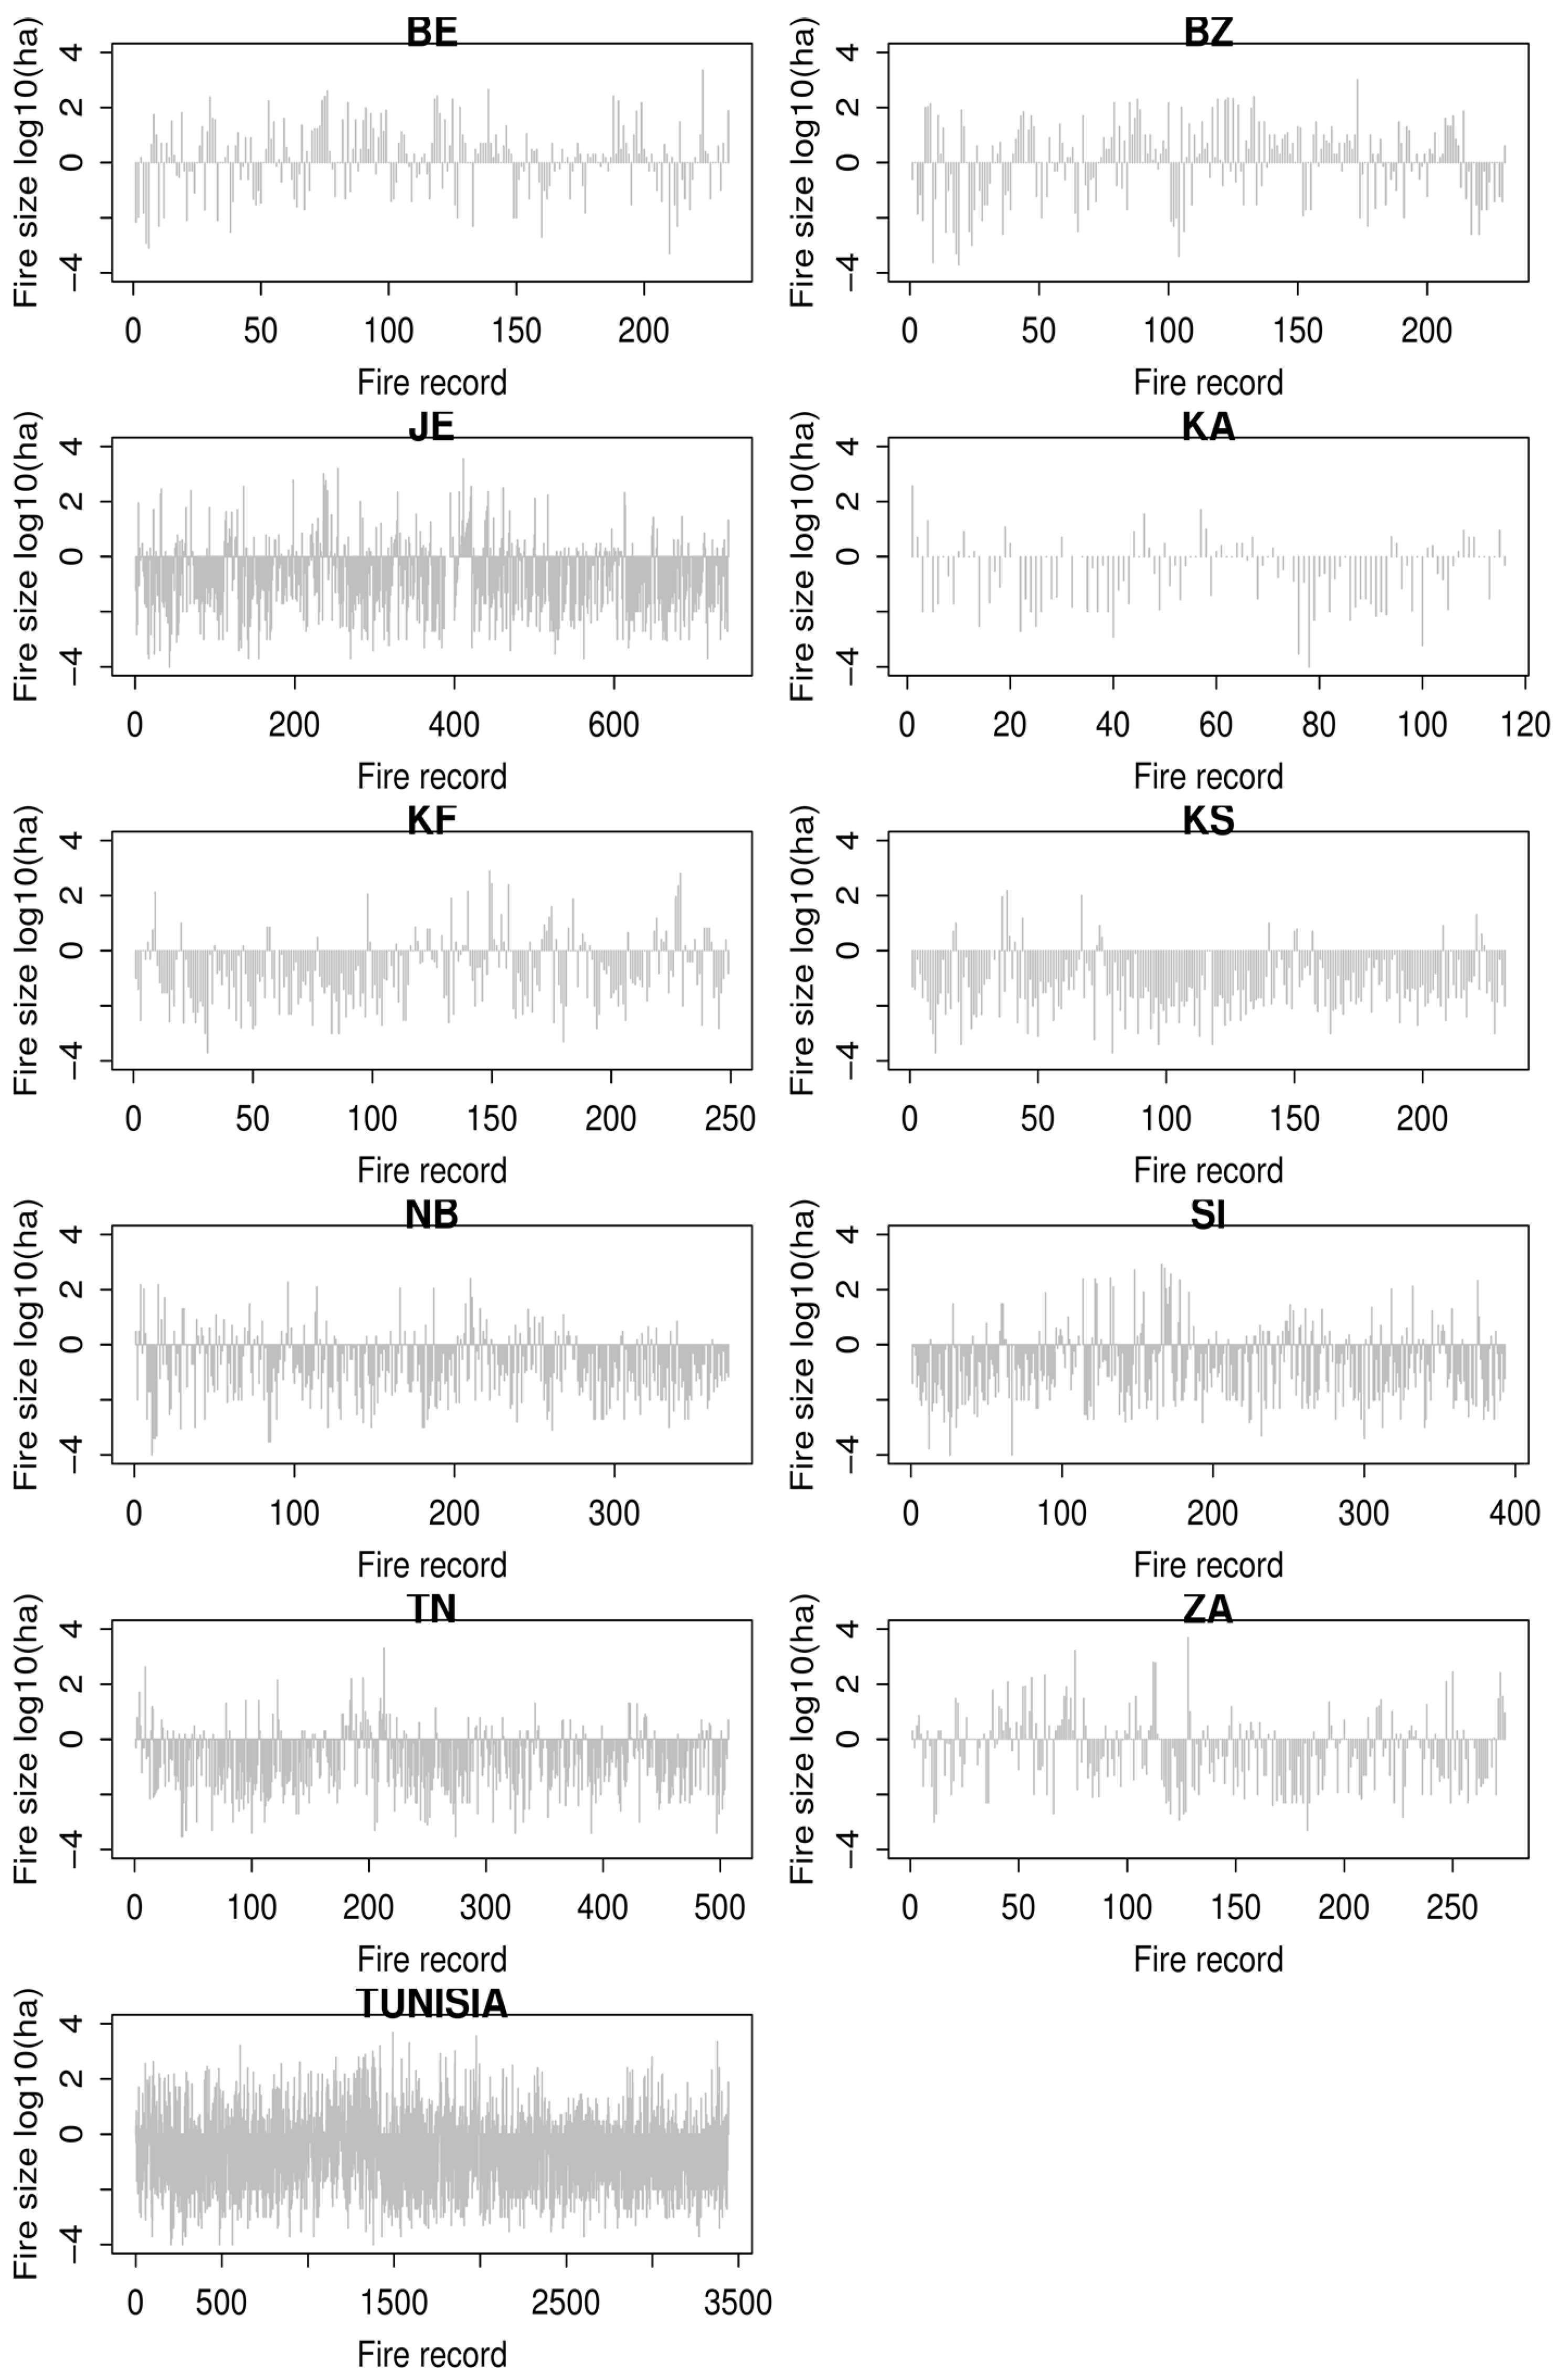
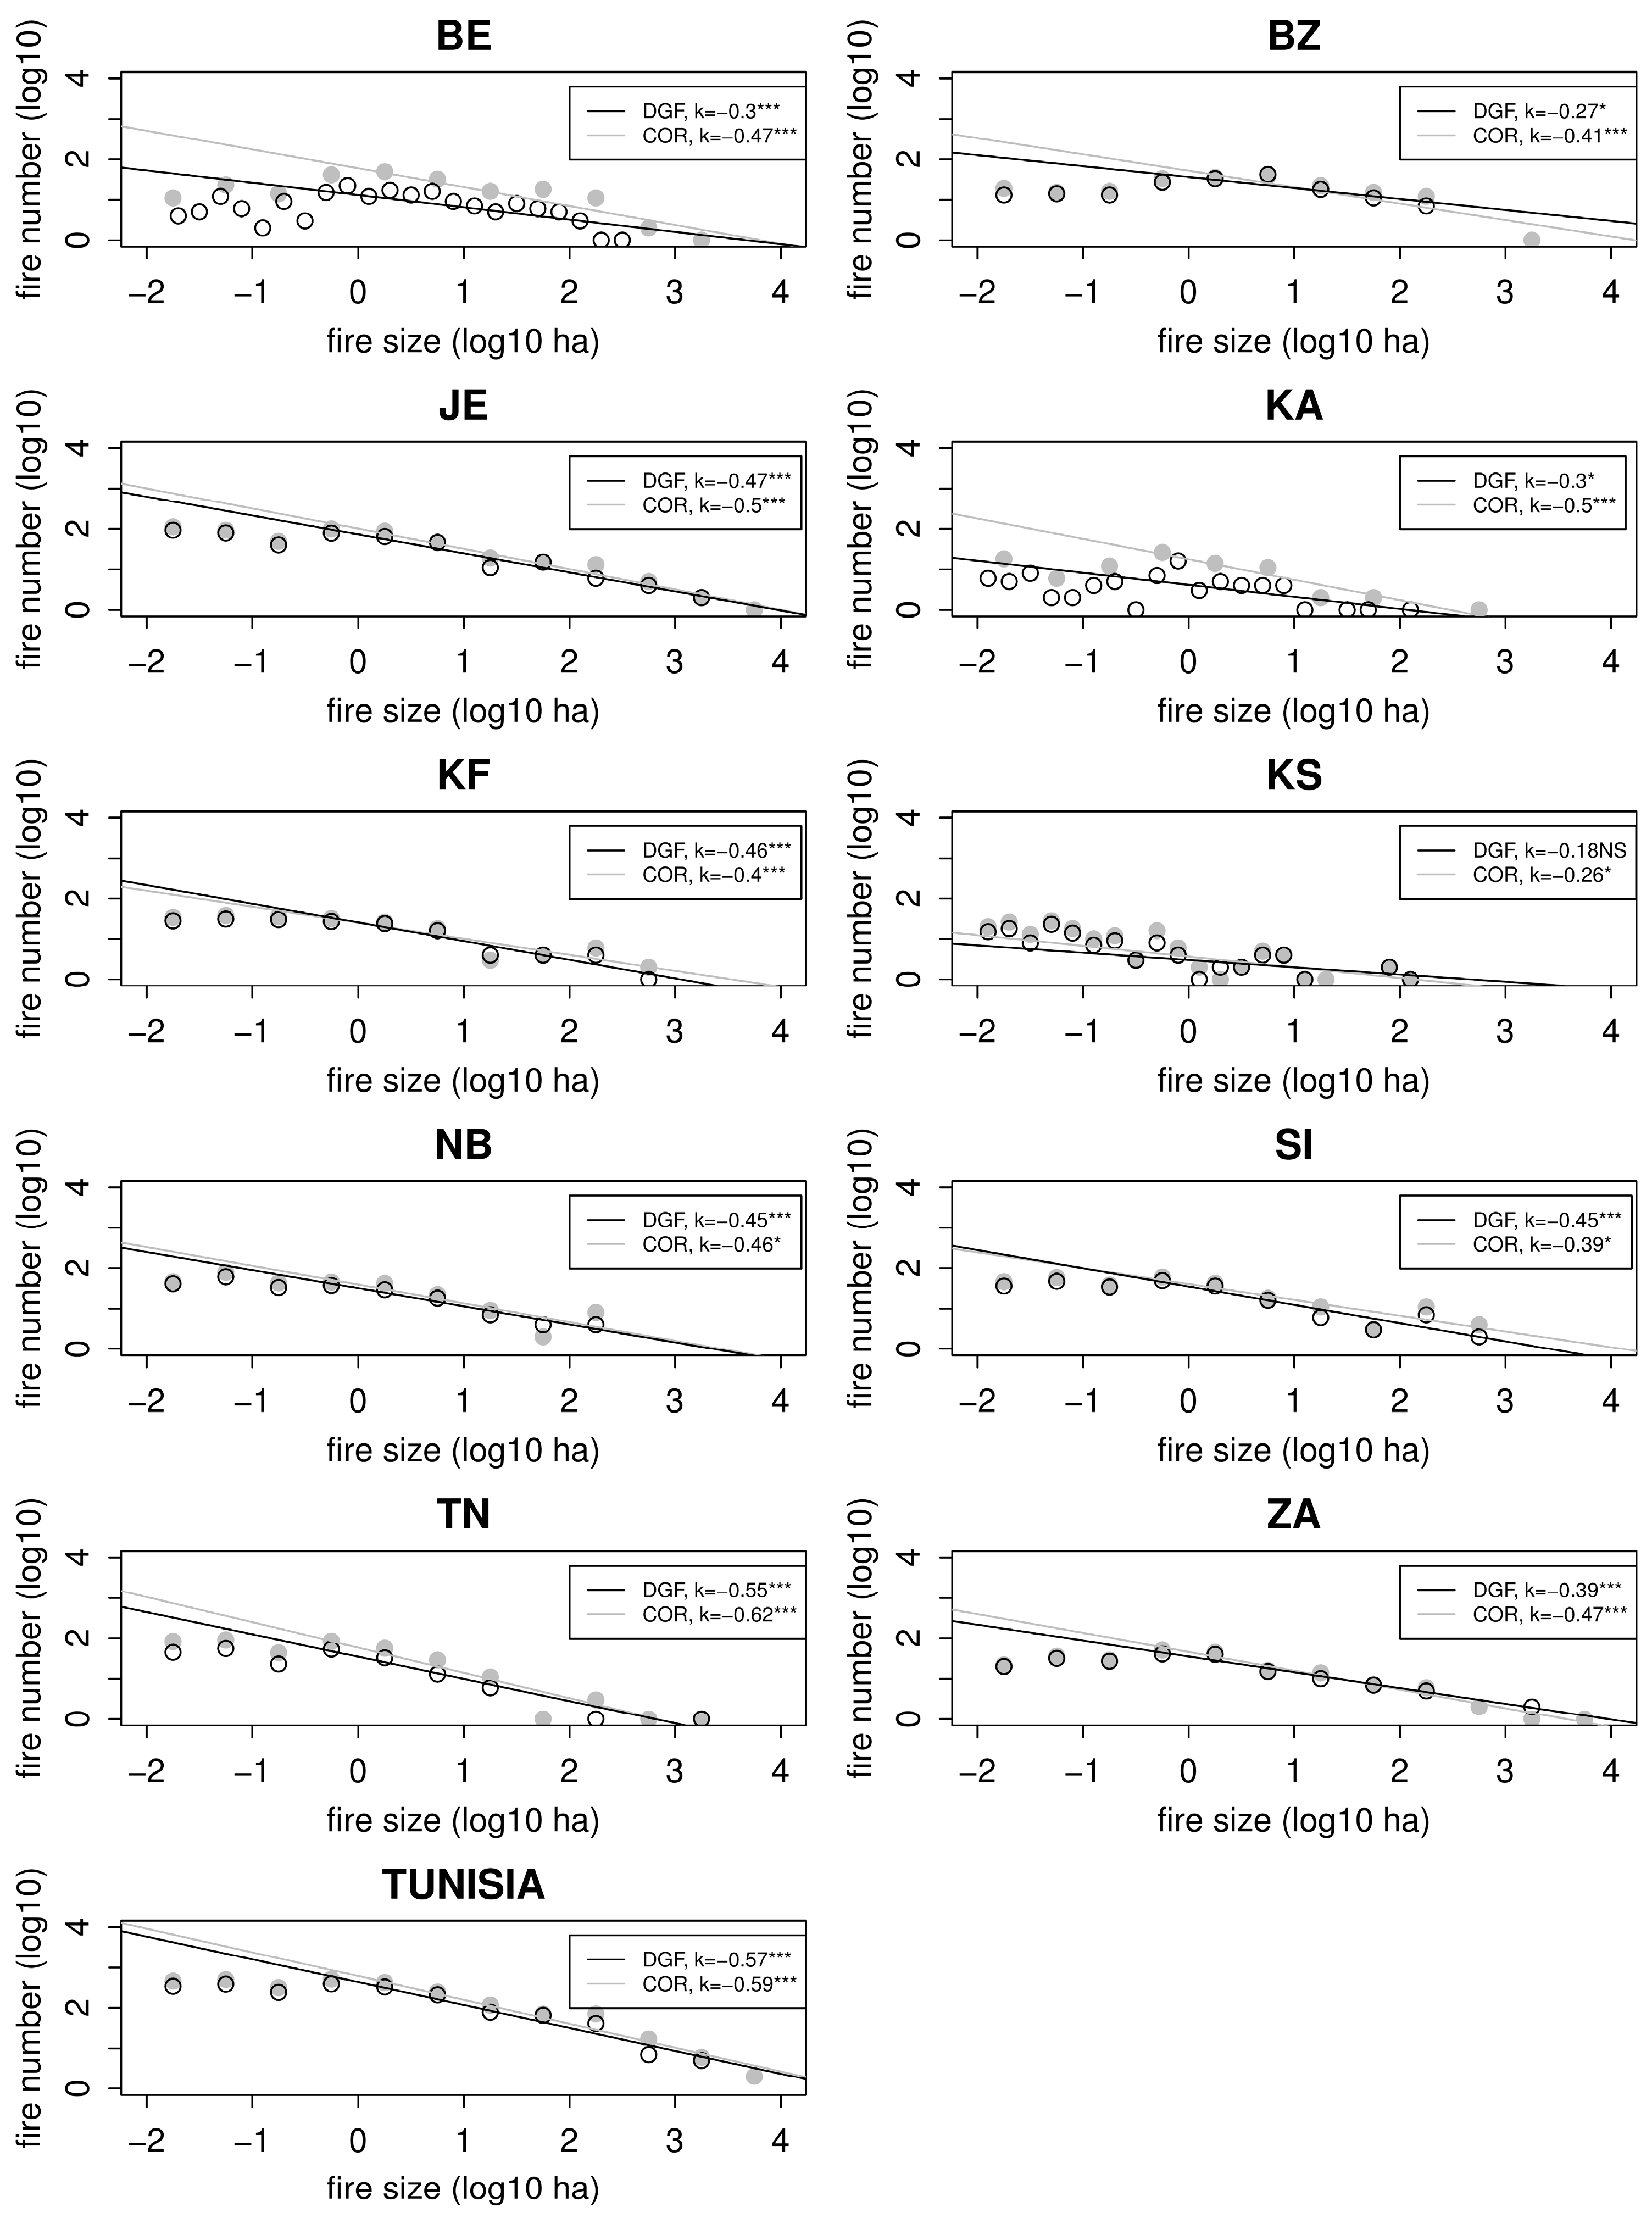
3.3. Fire Size Distribution

We finally checked the fire size distribution from the official DGF database and the corrected dataset COR as a quality index. We observed a fire size distribution describing the fire regime in Tunisia (Figure 8) mostly following the self-criticality hypothesis for all gouvernorat and the whole Tunisia. However, for fires less than 1 ha, the relationship is flattened out, potentially indicating missing fires below this threshold. The fire size distribution on COR partially modified this relationship, with still remaining potential missing fires smaller than 1 ha. The significance of the linear relationship between fire number and the fire size class improved when using COR, and the k value (slope of the regression trend line) mostly increased for all gouvernorat due to additional referencing of small fires in the COR database. Corrected k values varied between −0.26 for Kasserine (KS) to −0.64 for TN, with a mean value for the whole Tunisia −0.59, most gouvernorat varying between −0.4 and −0.5.

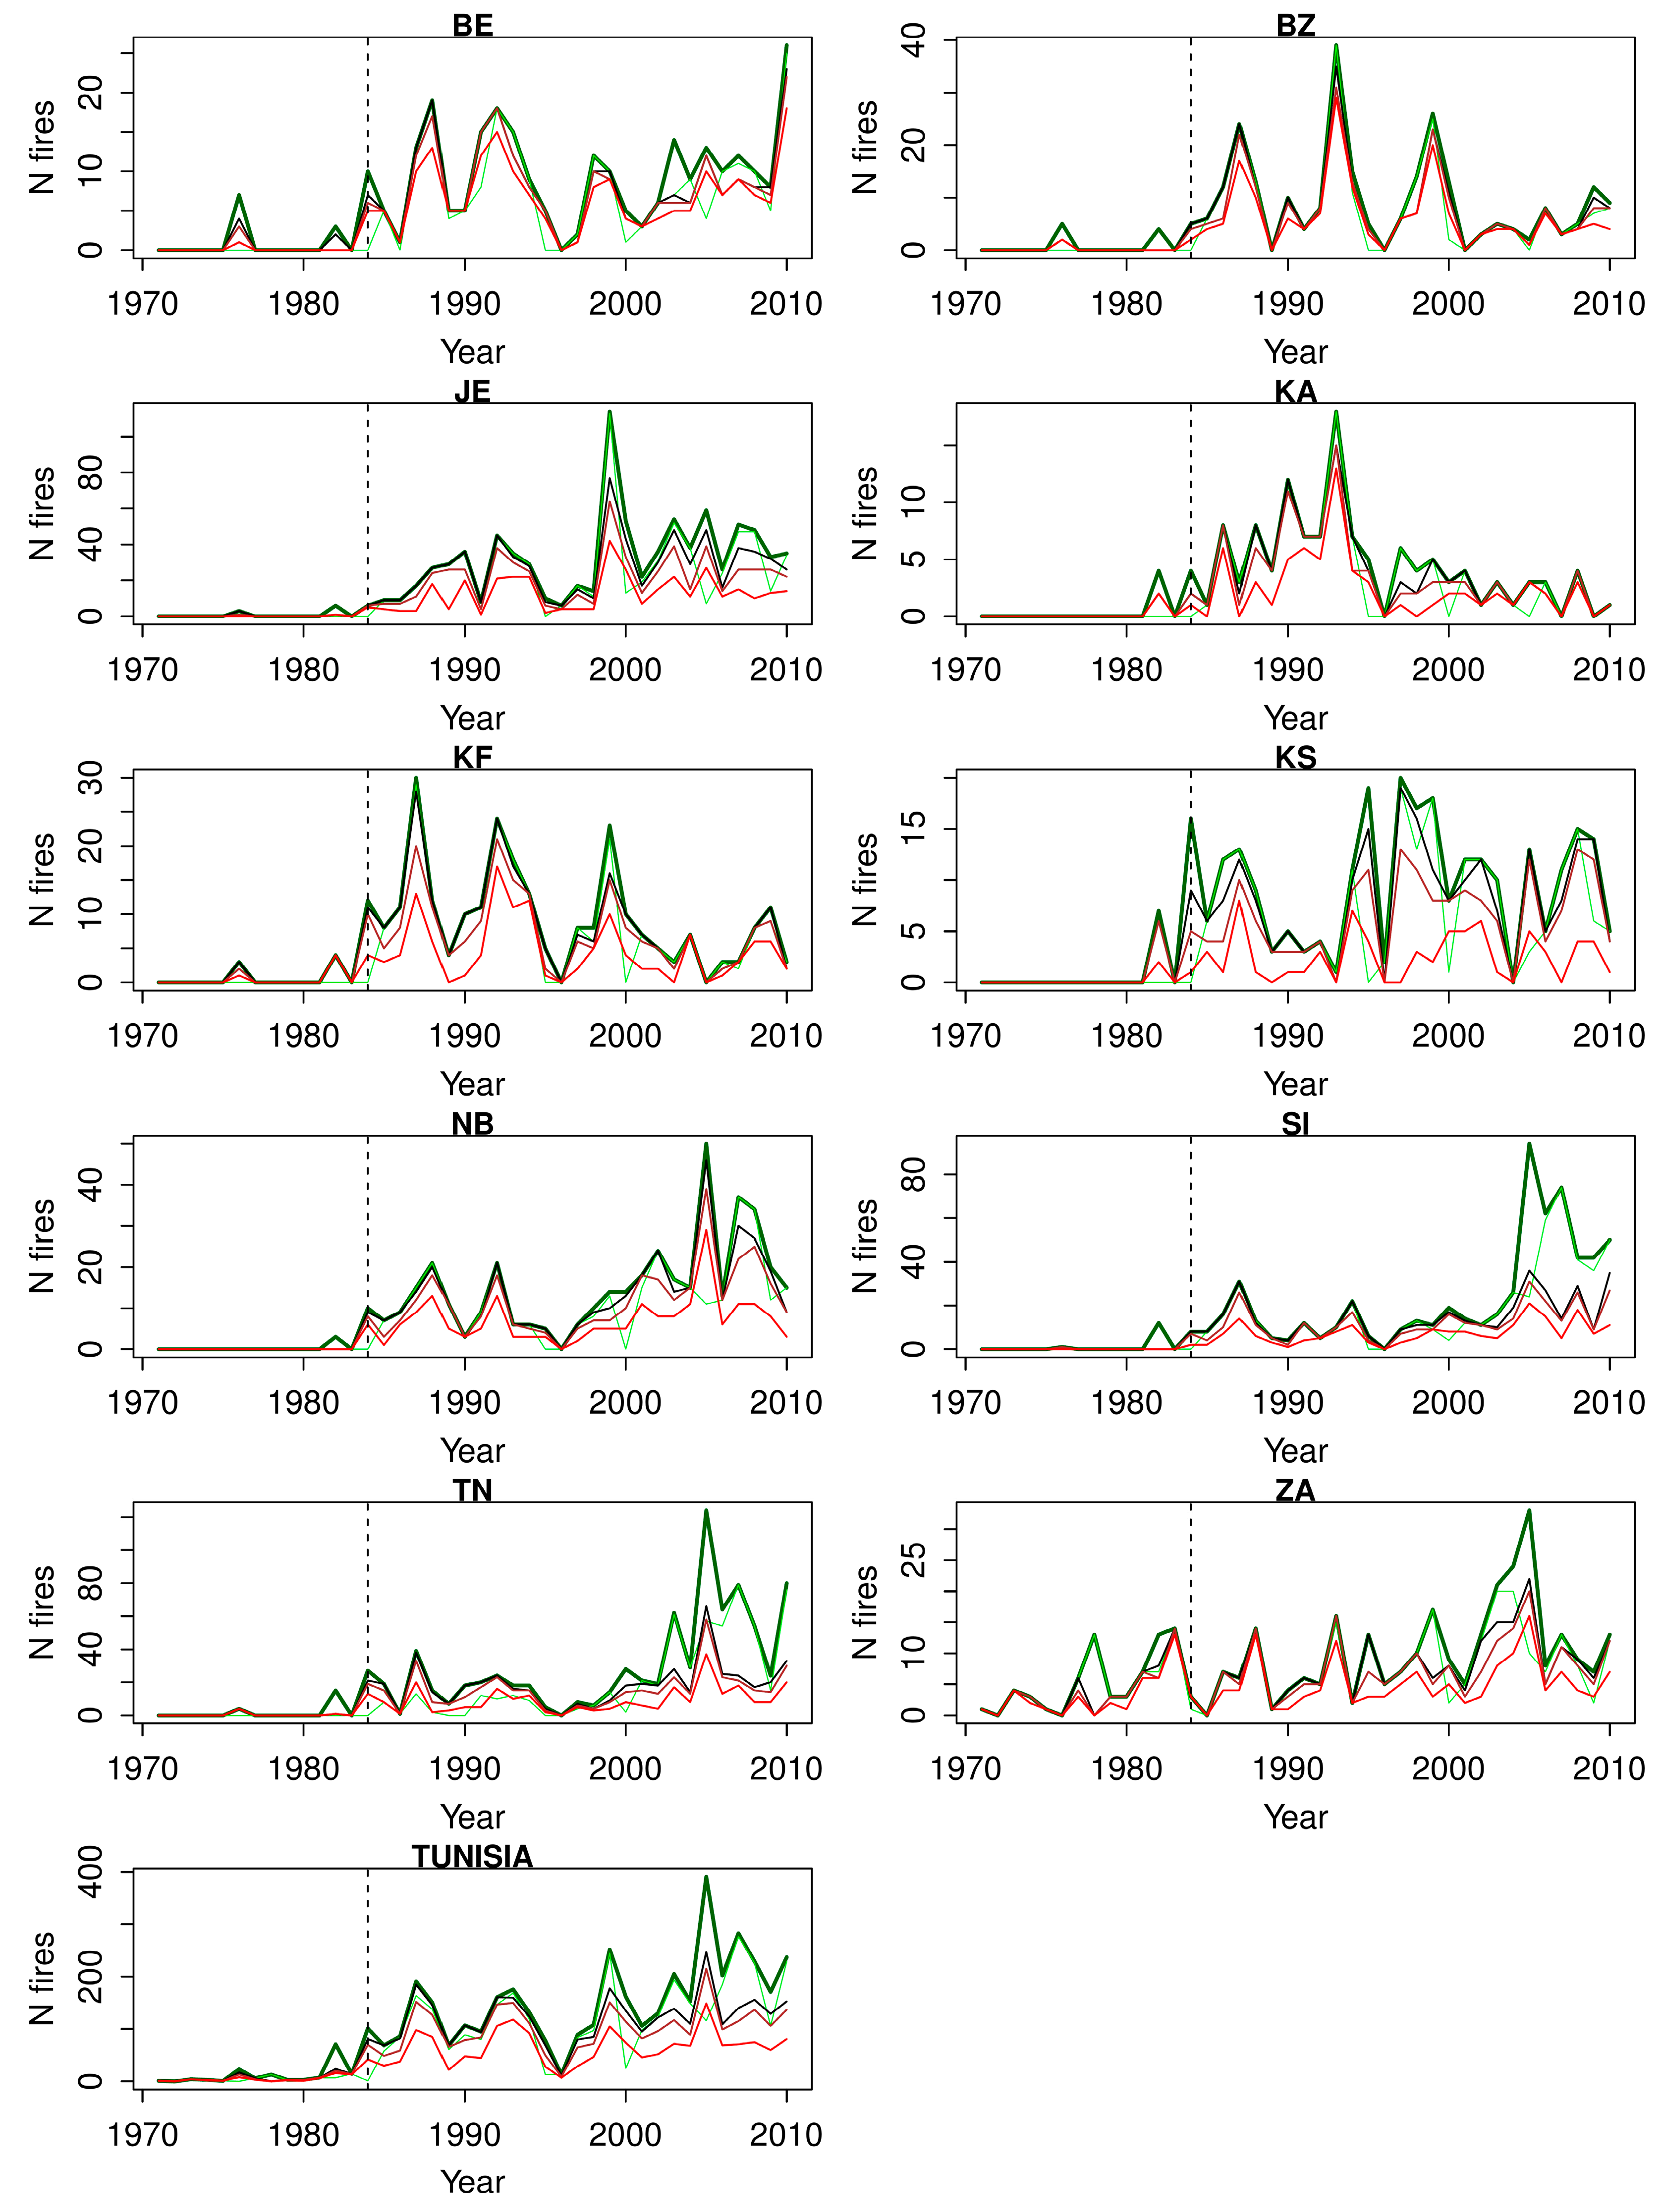
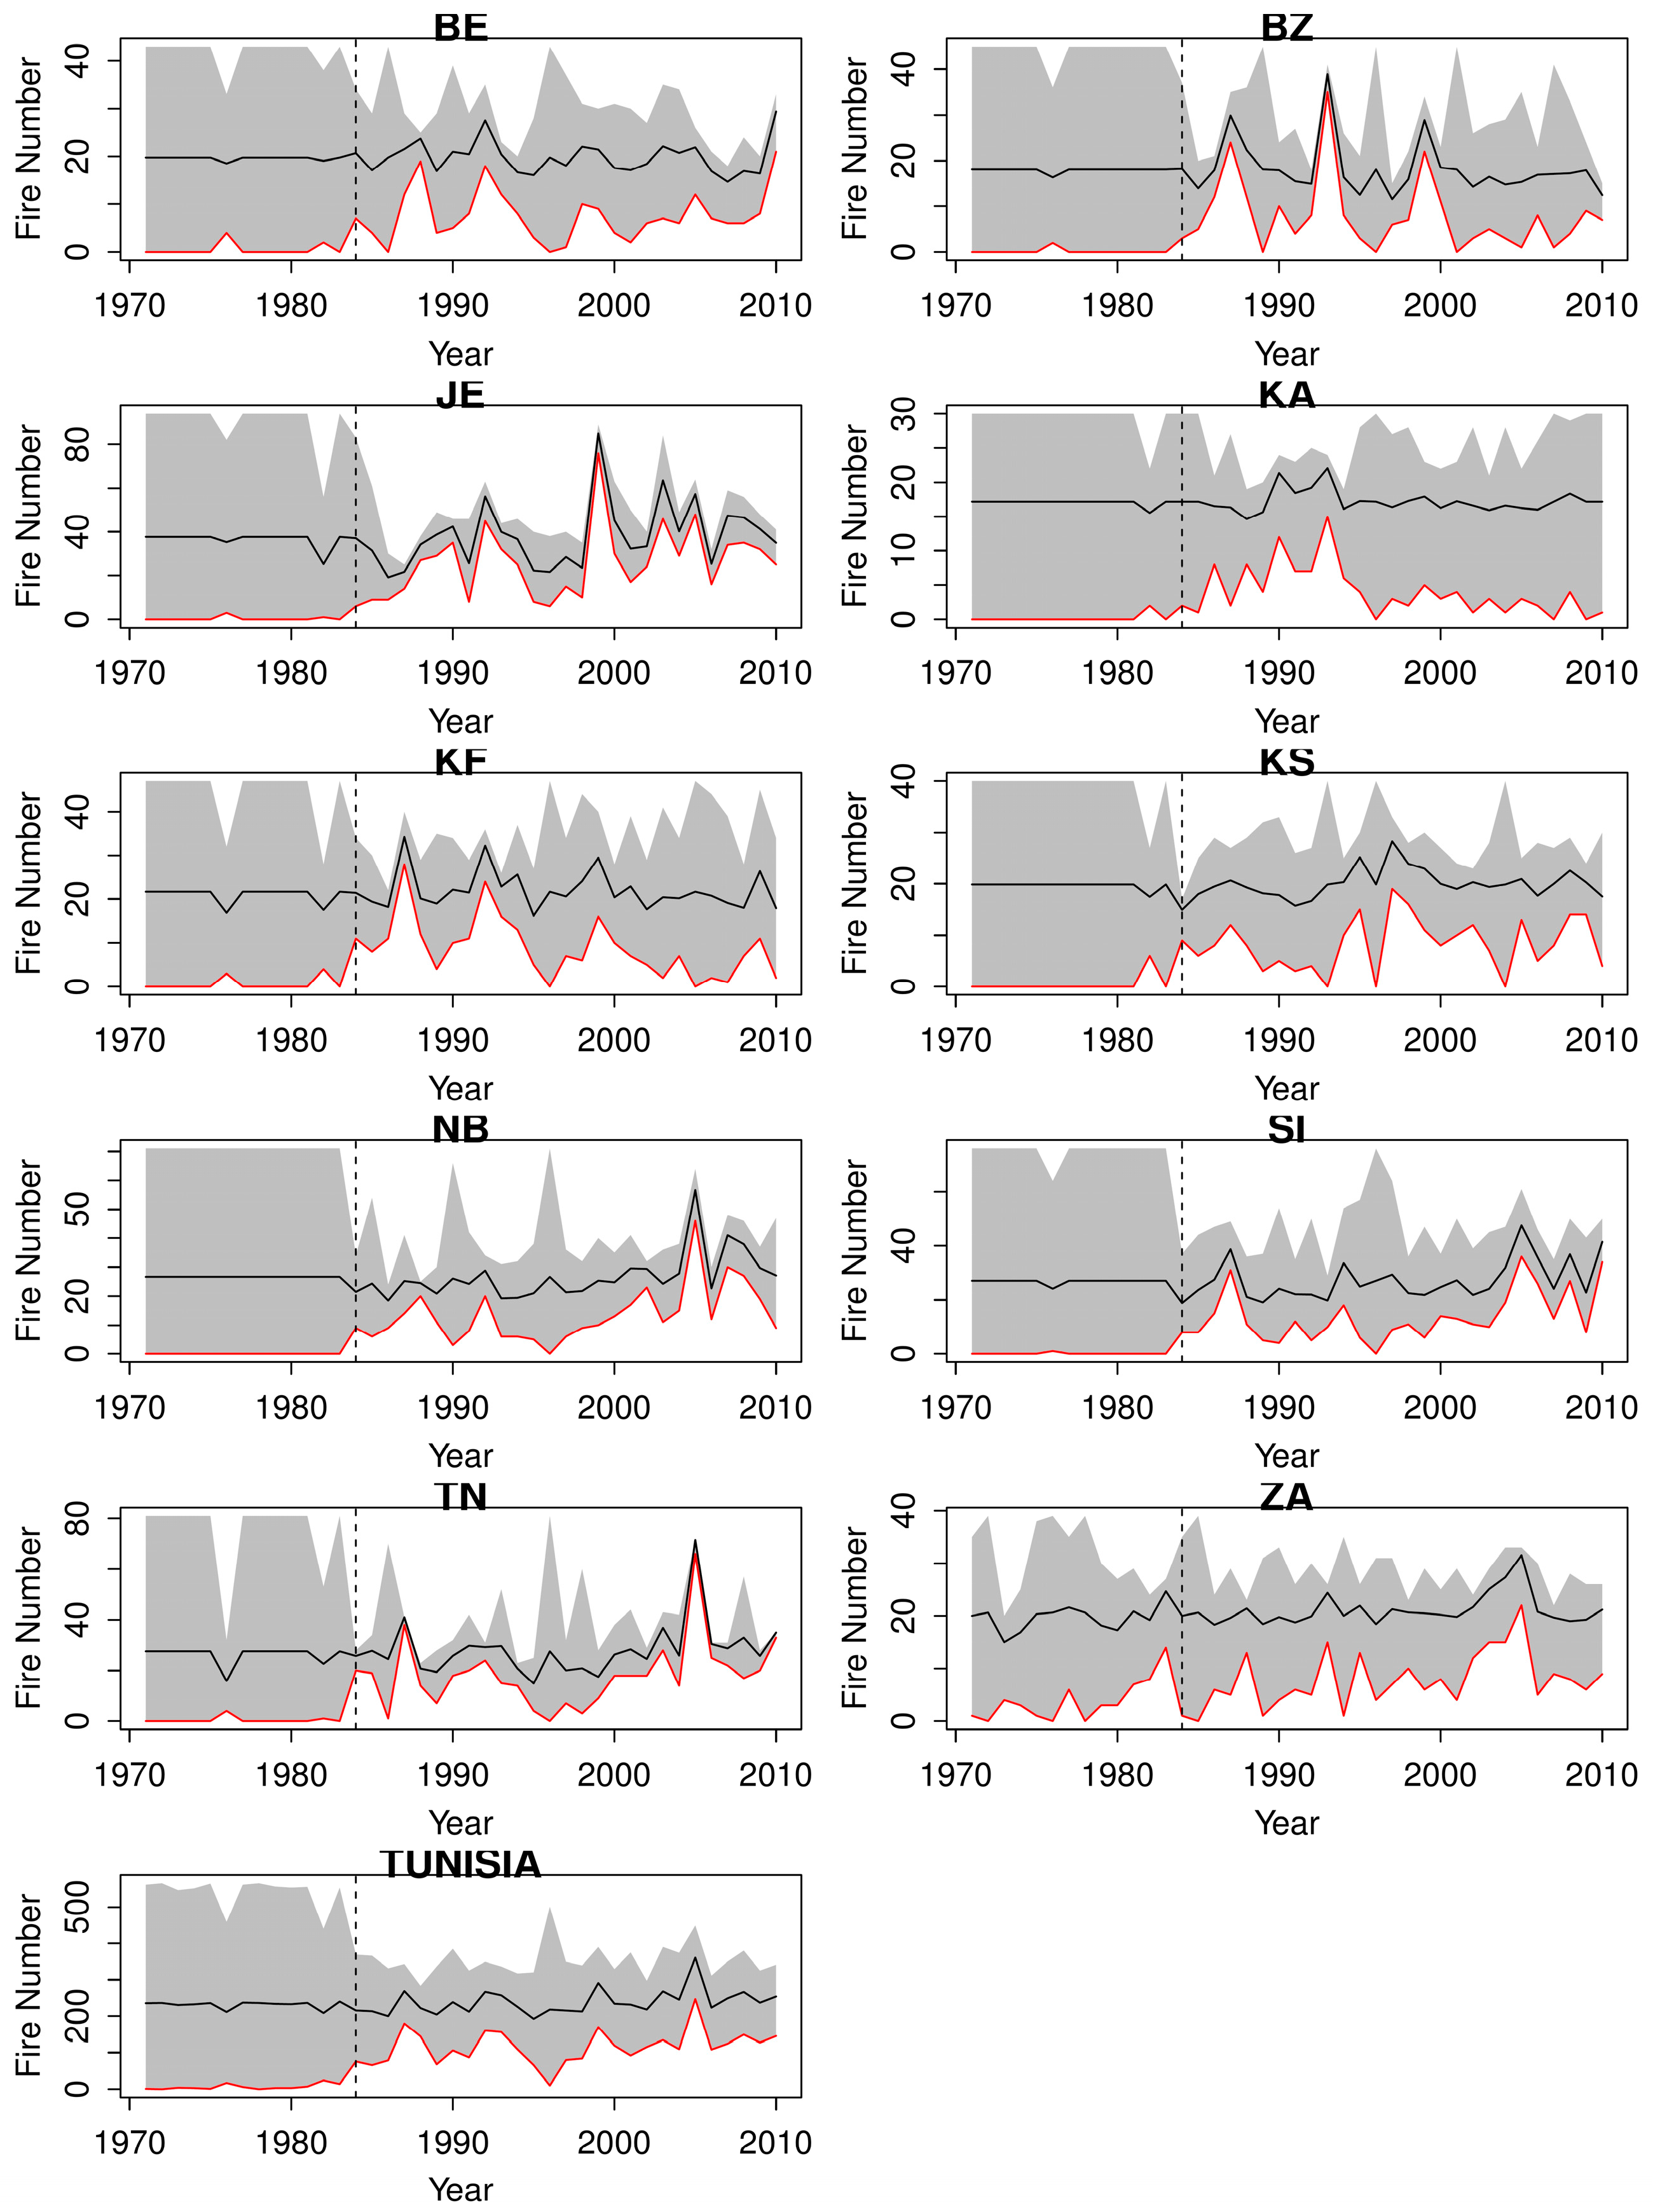
3.4. Burned Area and Fire Number for the 1985–2010 Period

Figure 9 represents the burned area, for each gouvernorat, for the 1985–2010 period from the official statistics DGF and the corrected data COR (burned area before 1985 is represented but should not be considered due to many missing fires). After 2000, the mean burned area was estimated to be 385 ha year−1 by DGF. We now corrected this value to 1270 ha year−1. Before 2000, the mean annual burned area was estimated as 1470 ha year−1, now revised to 2382 ha year−1. We then conclude on a 3-time and 2-time underestimation respectively for the 2001–2010 and 1985–2000 periods. The maximum fire years were 1994, 1988 and 1998 with 6883 ha, 2735 ha, 2337 ha respectively in the DGF database, now revised to 1994, 2000 and 1996 with respectively 8348 ha, 5027 ha and 4802 ha in the COR database.
We synthesized the mean annual burned area for each gouvernorat from the raw DGF data and our corrected COR data in Table 2. We observed a high underestimation for all gouvernorat in the DGF data, varying between 6% for KS and up to 180% for BE, with a mean underestimation of 76% for Tunisia. With the COR data, the fraction of forest cover affected by fire varies between 0.01% in Kairouan (KA) to 0.43% in JE with a mean value of 0.19% for Tunisia.
When comparing our historical reconstruction (COR) with previously published burned area, from official DGF datasource, from a recent publication [35], from official global Forest Resource Assessment reports (FRA), and from the recent EFFIS publications on fire reports in Europe and the Mediterranean basin (Table 3), we confirm here the high underestimation from national statistics, potentially used in scientific analysis [35], and delivered to global reports. We then warn here about previously published fire trends in Tunisia not accounting for missing data and using underestimated burned area.
Over the 1985–2010 period, the Theil-Sen test on the temporal trend of burned area was significantly decreasing in Tunisia with the official DGF statistics (Table 4). The Theil-Sen test on the temporal trend of burned area was however not significant for Tunisia with the corrected data, whatever the threshold of fire size considered, thus opening the possibility of reconsidering the usually stated fire decrease in this country.
Figure 10 illustrates more particularly the fire numbers for each gouvernorat and the whole country, with uncertainty related to identified missing data records. We plotted the raw data, the expected mean due to missing data, and the potential maximum and minimum expected fire number when gapfilling missing months. The lowest uncertainty is observed for the TN and JE gouvernorat, while KA, the least-forested gouvernorat, is highly uncertain. Temporal trend analysis revealed a significant fire increase in the fire number in the raw DGF data when considering all fire types (Table 4), but no significant trend when considering only forest and shrubland fires (COR). The high uncertainty in the fire numbers could not lead to any substantial conclusion on either the temporal trends or interannual variability; thus, data should be considered with caution if further used in fire weather characterization.

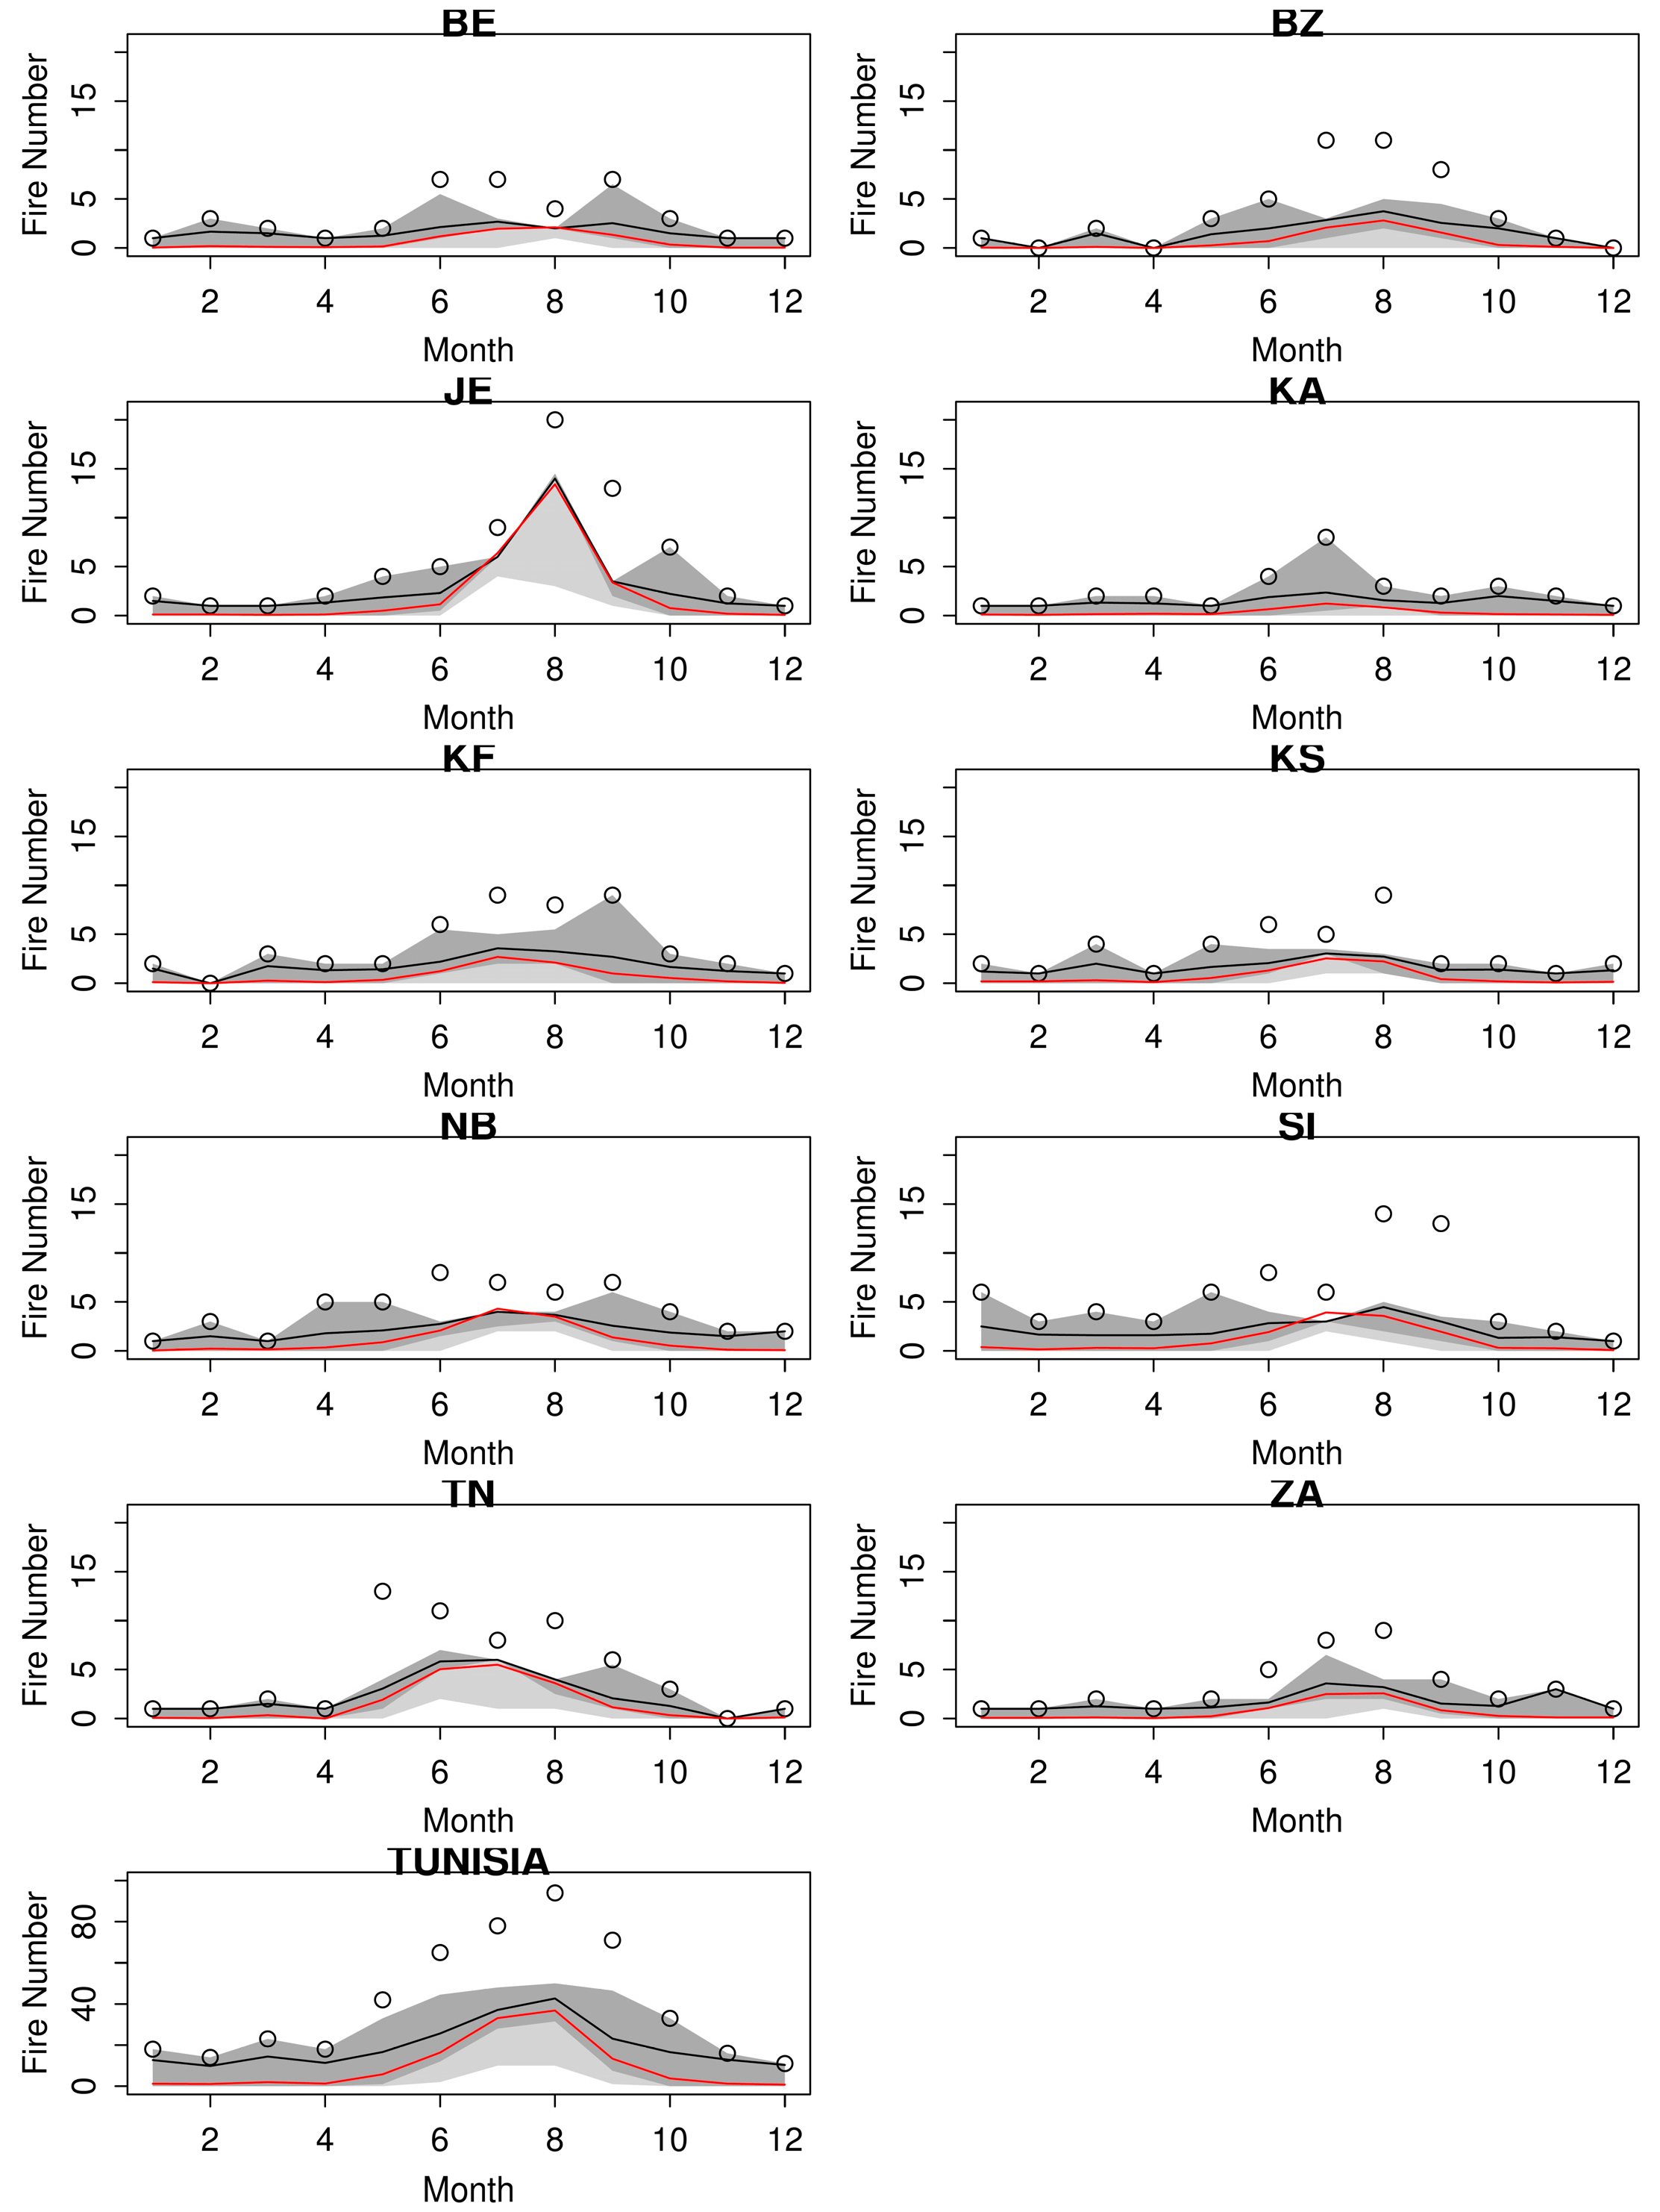
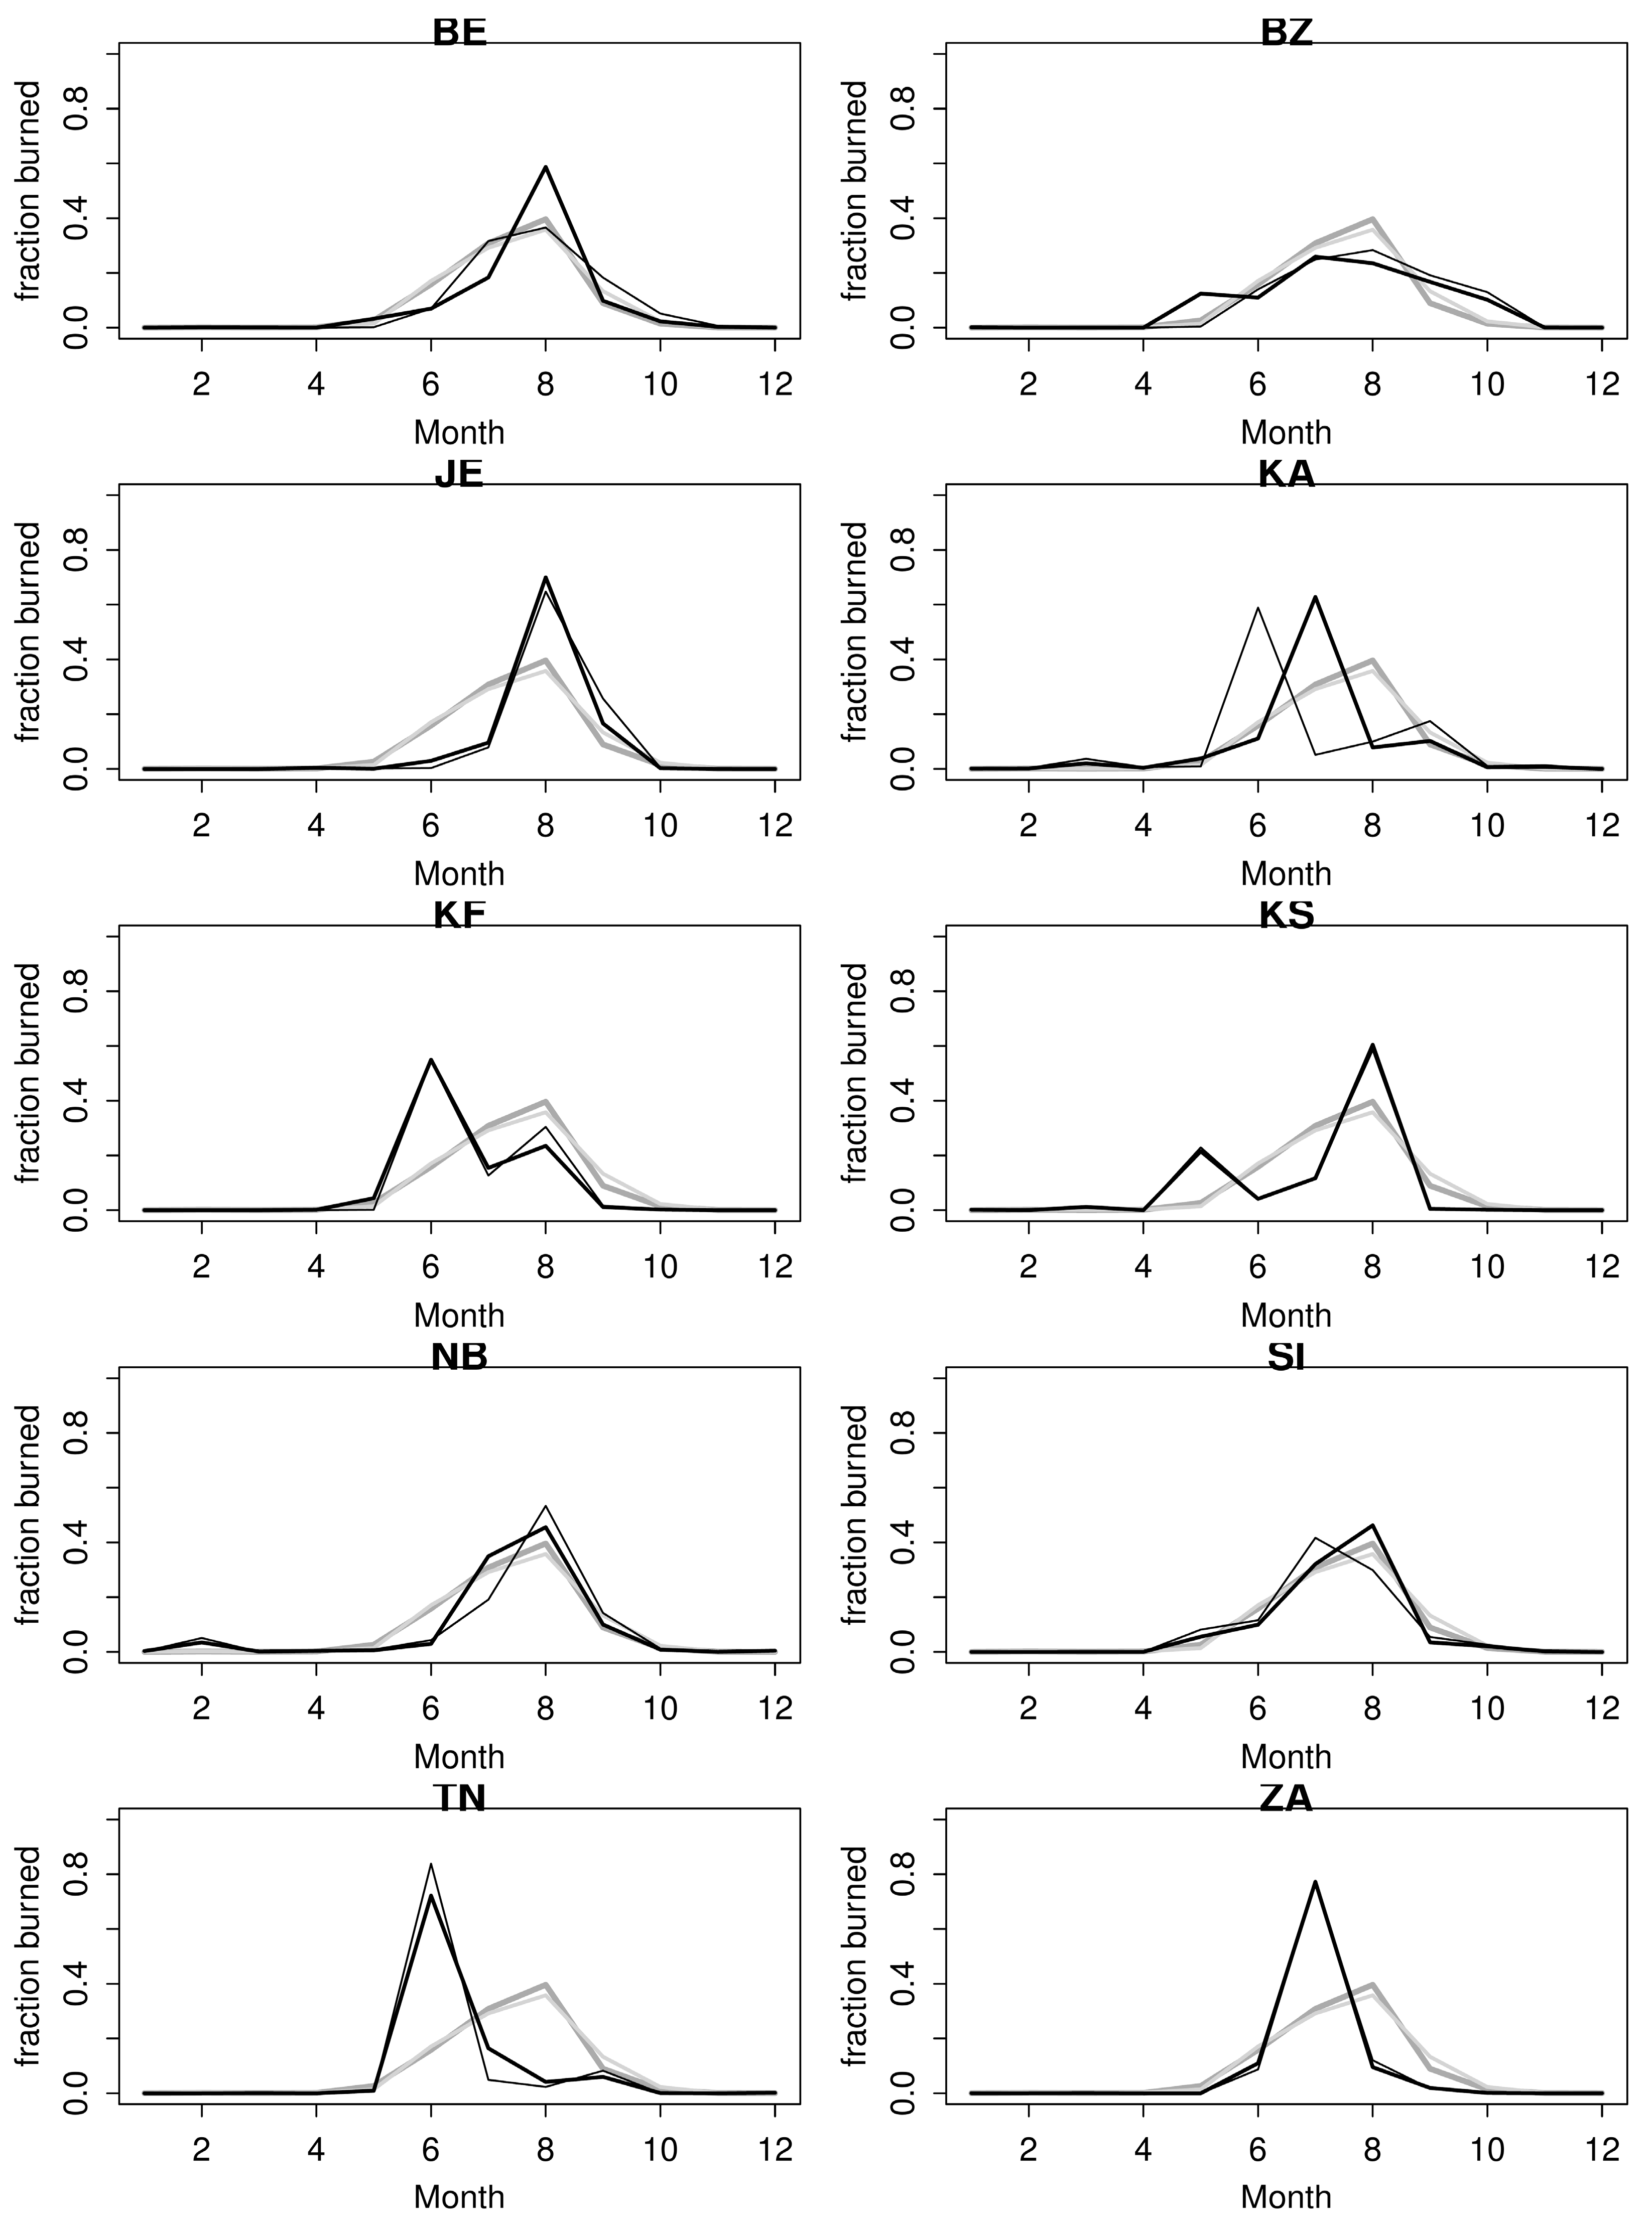
3.5. Seasonal Pattern of Burned Area and Fire Number

The seasonal patterns of fire number and burned area are presented in Figure 11 and Figure 12. The main fire season in Tunisia covers July and August with an average 37 and 39 fires (>0.1 ha) year−1 respectively, partially extending in June and September with an average 11 and 10 fires (>0.1 ha) year−1 respectively. A similar pattern is observed between the COR and the gap-filled COR databases, with increased uncertainty in spring and autumn due to missing reports, leading to an estimated mean fire number of 39 and 41 in July and August, and 20 and 21 in June and September in the gap-filled COR dataset. This pattern can locally vary within Tunisia, with a shorter fire period narrowed in August for the northern gouvernorat of JE and Bizerte (BZ), an early fire extension toward June in TN, Nabeul (NB), KA, Zaghouan (ZA), and a later extension toward September in the mountainous regions of KF and SI. The seasonal pattern of burned area (Figure 12), also illustrates the fire season from June to August for Tunisia. The burned area distribution is however mostly distributed in August for northern gouvernorats (BE, BZ, JE) with more than 50% of burned area happening during this month, in July for central Tunisia (ZA, NB, KA, KS) and covering the whole June-August period for TN, SI, Le Kef (KF). The COR and DGF databases for Tunisia lead to quite similar results, but at the gouvernorat level, substantial differences can be observed, in turn revisiting the seasonal pattern obtained from the raw data.

4. Discussion

4.1. Uncertainties in Reporting Fires

We identified numerous types of misreporting in the DGF official database of fire events in Tunisia. Our main concern was the missing monthly fire reports, even in critical summer months, or over entire years. Collecting data from each level of administrative units allowed us to identify some problems in the transfer of information across administrative levels, such as omission of some gouvernorat or some months in yearly final DGF reports. The second main issue was related to the highly underestimated burned area of fire events, that we were able to correct with historical Landsat archives. We estimated the actual burned area to be 176% of official statistics for the whole Tunisia, reaching up to 280% in the BE gouvernorat, much larger than uncertainties referenced for European states when comparing official statistics with global remote sensing data, but in the range of uncertainty quantified for eastern Europe and Turkey [62]. When getting more into details, we identified duplicated fires with similar areas, dates and location that we had to filter out. Finally, we faced the reporting of large fire events being split into administrative units, so that a single large fire could be referenced into two or more smaller fire events covering the burned fraction in each gouvernorat. This kind of misreporting/error in official fire statistics is actually common, as already reported for Portugal [63]. In the USA, where different fire registration offices occur, an assembled database was produced to cover this potential bias [64].
A common issue across fire databases is also the minimum referenced fire size, potentially very misleading in terms of understanding the long-term climatic or anthropogenic effects on fire starts. The fire database for Greece along the 20th century had to be reassessed after filtering out fire sizes, to provide a clear understanding on the temporal trend of fire numbers [23]. Similarly for Spain the recent fire trend was revisited when considering a homogeneous minimum fire size threshold all along the time series [26]. This problem does not seem to happen in Tunisia, but we might question the reliability of the very small fire (<0.1 ha) census across gouvernorat and across the seasons. The fire size distribution analysis actually revealed this uncertainty in fires smaller than 1 ha with potential missing small fires based on the self-criticality hypothesis. Our results are however in agreement with other areas within the Mediterranean basin [56], with similar bias on small fire occurrences, and a similar range of k values describing the fire size distribution.
Beside these methodological issues, in Tunisia, we additionally faced a high political control on official statistics, under a strong political regime willing to control any potential rural riots. In turn, underestimating burned area would better highlight the efficiency of the government in providing to the rural population all the sufficient expenditures for protecting their goods and the forest services they depend on. The rural population in Tunisia has long ago been considered as less advantaged by political decisions than the coastal fund-raising touristic part of the country, making this population prone to aggressively react to natural events affecting their precarious way of life. This kind of political manipulation of official statistics has actually also been identified in the former Union of Soviet Socialist Republic (USSR, now Russia), where fire statistics were highly underestimated to better emphasize the power of the political system, and where official forest officers were getting additional salary when actively and efficiently fighting fires, so they were more prompt to falsify reported burned areas [27]. The collapse of the political regime in Tunisia during the 2011 Arab Spring and the wider access to remote sensing data (previously actively controlled by the government through highly censored Internet access, and drastic authorizations to use remote sensing data) significantly contributed to fully perform this study and provide this critical analysis.
Our corrected fire database could either correct errors in burned area, or provide the uncertainty associated to burned area and fire number. For the fire number, we gap-filled the missing data with the assumption that no fire in a given month was suspicious, based on observed fire seasonality in the Mediterranean countries previously reported. By replacing monthly missing data by the minimum, mean and maximum monthly fire number observed during years fire data exist, we could provide a range of uncertainty assuming that no extreme month happened during the study period. Our objectives here were to provide to future users the full characteristics of the database and its uncertainty related to missing data by giving a probable range of variability. This brings forward critical information for impact assessment and management decisions [65], and increasing efforts have been devoted to characterize, or at least mention, an estimation of missing information in fire databases, as recently done for the USA for example [64]. Concerning the accuracy of our results on burned area, fires larger than 5 ha are usually captured correctly by using Landsat satellite images. In Greece, the number of fires higher than 5 ha, recorded by the Forest Service, was 89 compared to the 87 fires captured by Landsat images [66]. Fires larger than 5 ha, depending on the availability of satellite images, can be successfully captured and mapped by Landsat Thematic Mapper (TM) and Enhanced Thematic Mapper (ETM+) satellite images, even though in their study, they did not use as dense time series Landsat images as we did in our present study. Additionally, ten classification approaches were compared for burned land mapping using Landsat TM imagery on three Mediterranean test sites, and no statistically significant differences were observed in the accuracy of burned area maps among the mapping methods used [67]. Actually, the accuracy of the burned land maps was in the range of 90–95% depending on the study area. The variance in accuracy results imposed by the different methods applied was less than that imposed by factors differentiated locally in the three test sites. Similar results were also observed for the recent fire history of Attica region (Greece), reconstructed from a series of Landsat images acquired from 1984 to 2011 [68]. Regression modeling showed that the observed differences in the area burned could be explained by the number of satellite images used (86.3% of the variance) followed by the acquisition date of the first image. Therefore, we have evidence that the uncertainty of fire scar delineation as implemented in our study by using Landsat time series images should be generally low without creating any problems in the data analysis, given that the methods we applied to map the fire scars were the same or similar to the ones used in the mentioned studies. Additionally, in our study we used much more dense time series Landsat images than used in these mentioned studies.

4.2. Regional Gradient of the Fire Regime

From this revised burned area dataset in Tunisia, we could provide a first analysis of the fire regime across the climate gradient at the southern boundary of the Mediterranean bioclimatic zone, a poorly studied zone compared to the northern part of the Mediterranean basin. Our results show the highest burned area on the northern coastal part of the country, belonging to the humid and sub-humid Mediterranean bioclimate, on the evergreen Quercus spp. L. ecosystems and associated shrublands. This region is then not fuel limited with a recurrent summer drought of 2 months, and high summer temperatures. In addition, large forest patches, little road access at the boundary with Algeria, and a moderate grazing activity allowing for a high understory fuel buildup, make this region the most fire-prone. The southern part of the country is less affected by burned area, despite being covered by Pinus halepensis Miller and low shrublands with annual rainfalls below 350 mm. Forest patches are much smaller, with an extensive use of pine forests by local populations for grazing and collecting pine seeds (widely used in Tunisia for a traditional custard) [69], overall leading communities to consider their surrounding forest systems as a beneficial source of services. When considering the fraction of burnable land affected by fires, we actually get an average value of 0.19% with the corrected data for Tunisia, varying between 0.01% and 0.46%, lower than the ones observed in the Mediterranean basin. For example in neighboring Algeria, this value reaches 0.85% [70], compared to 3.31% in Portugal, 0.84% in Spain, 0.53% in France, 1.14% in Italy and 0.57% in Greece [71]. Across the latitudinal and climate gradient in Tunisia, we then did not observe any major link of fire activity based on this index, with increasing drought and temperature when going southward. We observed more particularly an increasing fraction of burnable area affected by fires when forests cover a larger fraction of the administrative zone (Table 1), making land cover and anthropogenic local effects at least as much important as climate in driving the regional pattern of fires in Tunisia, as observed for other non-Mediterranean [72] or Mediterranean [73] fire-prone areas. We observed however a contrasted seasonal pattern on fire number distribution across the climate gradient, with an extended fire season when going southward.
Overall, with 1799 ha year−1 affected by fires, Tunisia is on the low range of burned areas within the Mediterranean basin, even with the corrected burned areas [62]. This result then supports the conclusion that human influence (through landscape structure, forest use, population consideration for its environment, fire policies) can actively mitigate the effect of increasing drought and temperature on fire risk in the Mediterranean basin.

4.3. No Significant Temporal Changes in the Fire Regime

Regarding the high uncertainties in the fire number, and based on the corrected burned area, we did not detect any significant trend either on the fire number nor the burned area in the region for the period 1985–2010. This result revisits the widely assumed idea that fire number increases in the southern boundary of the Mediterranean basin, as a result of a growing rural population, and that burned area decreases as a consequence of increased agricultural land use [74]. Previous results and Food and Agricultural Organization (FAO) reports erroneously used the official statistics as a whole without checking for inconsistencies in the fire reports [60,61]. We provide here a thorough analysis with a quantified uncertainty to be further considered in global or Mediterranean synthesis. Our observed temporal stability in both the fire number and burned area for Tunisia is actually similar to the one observed in neighboring Algeria [38,39], and provides a contrasting study case to the widely studied northern boundary of the Mediterranean basin where an increase in burned area has been observed after land abandonment since the 1970s, and where recent decreases due to active firefighting and prevention policies have occurred [30]. Despite increasing temperatures in an already hot area, and increasing drought [75], supposedly leading to increased burned area [76,77], Tunisia did not experience any fire increase since 1985, providing an additional study case where recent climate change did not affect burned area. Fire weather types should be more deeply investigated to better understand potential changes in fire weather types along the period [78], and evaluate how firefighting development has actually mitigated an increased fire hazard based on fire weather.

4.4. Interannual Variability: Social Events and Climate

In absence of any temporal trend either in the fire number or burned area in Tunisia, we could identify a high interannual variability, actually representative of the Mediterranean basin. Extreme fire events in this area have been usually linked to prolonged drought or heat waves in the past decades [79]. We face here a peculiar case where Tunisia is a rather small country, with a long boundary with Algeria in the most forested part. Our remote sensing analysis could identify a significant impact of the cross-border fires in the final burned area of the country. The highest fire years 2000 and 1994 are actually driven by two major fires in the JE gouvernorat that started in Algeria and reached the Tunisian territory with a fire size impossible to control when reaching the country. The absence of collaboration on fire fighting forces between the two countries and the civil war in Algeria in the 1990’s then actively contributed to these two major fire years. Social events in politically unstable countries might then be a poorly investigated aspect of fire activity on long time series, and prevalent in the southern/eastern boundary of the Mediterranean basin. In 2011, the Tunisian revolution deeply modified the socio-political system with a huge impact on fire activity [35], which should be further studied in detail in comparison with this analysis.

5. Conclusions

In this study, we used successive steps of a thorough control protocol for quality checking on fire size homogeneity across time, burned area from remote sensing, monthly distribution of fire reports and fire size distribution, ensuring a detailed referencing of uncertainties of the Tunisian fire database. Historical national fire statistics offer a keystone source of data for global burned area modeling across time, charcoal fire history reconstruction validation or even for recent global burned area from remote sensing accuracy assessment. To be actually used, these datasets deserve increasing credibility through deepened uncertainty analysis as we provided here. In turn, previously assumed ideas that fire numbers increased and burned area decreased on the southern boundary of the Mediterranean basin in recent decades as a result of increasing population density and cropland areas has been revisited. From this revised database, further analysis can now be properly investigated on fire risk estimates in this area, and for Mediterranean scale synthesis on fire regimes [80].

Acknowledgments

This study was supported by the EU FP7 FUME Project, Contract Grant No. 243888. N. Koutsias received funding from the European Union’s Horizon 2020 Research and Innovation Program under the Marie Skłodowska-Curie Grant Agreement No. 705067. We thank Samir Belhadj Salah at the ‘Direction Générale des Forêts’ (DGF, Tunis) for providing free access to the Tunisian fire database and for the fruitful discussions on our results. Landsat-5 and Landsat-7 images courtesy of the U.S. Geological Survey. Landsat-5 and Landsat-7 images have been also acquired from the European Space Agency (ESA).

Author Contributions

C.B.-K. lead the study as part of her PhD, and collected and processed the data. N.K., A.K., C.B.-K., H.N. and B.O. performed the Landsat analysis for fire contours. A.H. provided local data. T.E.-M. and F.M. supervised C.B.-K.’s PhD and designed the analysis. F.M. performed statistical analysis. C.B.-K. and F.M. jointly wrote the manuscript.

Conflicts of Interest

The authors declare no conflict of interest.

References

  1. Bowman, D.M.J.S.; Balch, J.K.; Artaxo, P.; Bond, W.J.; Carlson, J.M.; Cochrane, M.A.; D’Antonio, C.M.; De Fries, R.S.; Doyle, J.C.; Harrison, S.P.; et al. Fire in the earth system. Science 2009, 324, 481–484. [Google Scholar] [CrossRef] [PubMed]
  2. Parisien, M.A.; Miller, C.; Parks, S.A.; DeLancey, E.R.; Robinne, F.N.; Flannigan, M.D. The spatially varying influence of humans on fire probability in North America. Environ. Res. Lett. 2016, 11. [Google Scholar] [CrossRef]
  3. San Miguel-Ayanz, J.; Moreno, J.M.; Camia, A. Analysis of large fires in European Mediterranean landscapes: Lessons learned and perspectives. For. Ecol. Manag. 2013, 294, 11–22. [Google Scholar] [CrossRef]
  4. Mouillot, F.; Field, C.B. Fire history and the global carbon budget: A 1° × 1° fire history reconstruction for the 20th century. Glob. Chang. Biol. 2005, 11, 398–420. [Google Scholar] [CrossRef]
  5. Avitabile, S.C.; Callister, K.E.; Kelly, L.T.; Haslem, A.; Fraser, L.; Nimmo, D.G.; Watson, S.J.; Kenny, S.A.; Taylor, R.S.; Spence Bailey, L.M.; et al. Systematic fire mapping is critical for fire ecology, planning and management: A case study in the semi-arid Murray Mallee, south-eastern Australia. Landsc. Urban Plan. 2013, 117, 81–91. [Google Scholar] [CrossRef]
  6. Giglio, L.; Randerson, J.T.; van der Werf, G.R.; Kasibathla, P.S.; Collatz, G.J.; Morton, D.C.; DeFries, R.S. Assessing variability and long-term trends in burned area by merging multiple satellite fire products. Biogeosciences 2010, 7, 1171–1186. [Google Scholar] [CrossRef] [Green Version]
  7. Archibald, S.; Lehmann, C.E.R.; Gomez-Dans, J.L.; Bradstock, R.A. Defining pyromes and global syndromes of fire regimes. Proc. Natl. Acad. Sci. USA 2013, 110, 6442–6447. [Google Scholar] [CrossRef] [PubMed]
  8. Loepfe, L.; Rodrigo, A.; Lloret, F. Two thresholds determine climatic control of forest fire size in Europe and northern Africa. Reg. Environ. Chang. 2014, 14, 1395–1404. [Google Scholar] [CrossRef]
  9. Hantson, S.; Pueyo, S.; Chuvieco, E. Global fire size distribution is driven by human impact and climate. Glob. Ecol. Biogeogr. 2015, 24, 77–86. [Google Scholar] [CrossRef]
  10. Nogueira, J.M.P.; Ruffault, J.; Chuvieco, E.; Mouillot, F. Can we go beyond burned area in the assessment of global remote sensing products with fire patch metrics? Remote Sens. 2017, 9, 7. [Google Scholar] [CrossRef]
  11. Mouillot, F.; Schultz, M.G.; Yue, C.; Cadule, P.; Tansey, K.; Ciais, P.; Chuvieco, E. Ten years of global burned area products from spaceborne remote sensing—A review. Analysis of user needs and recommendations for future developments. Int. J. Appl. Earth Obs. Geoinf. 2014, 26, 64–79. [Google Scholar] [CrossRef]
  12. Vilar, L.; Camia, A.; San Miguel-Ayanz, J. A comparison of remote sensing products and forest fire statistics for improving fire information in Mediterranean Europe. Eur. J. Remote Sens. 2015, 48, 345–364. [Google Scholar] [CrossRef]
  13. Bistinas, I.; Harrison, S.P.; Prentice, I.C.; Pereira, J.M.C. Causal relationships versus emergent patterns in the global controls of fire frequency. Biogeosciences 2014, 11, 5087–5101. [Google Scholar] [CrossRef]
  14. Hantson, S.; Arneth, A.; Harrison, S.P.; Kelley, D.I.; Prentice, I.C.; Rabin, S.S.; Archibald, S.; Mouillot, F.; Arnold, S.R.; Artaxo, P.; et al. The status and challenges of global fire modelling. Biogeosciences 2016, 13, 3359–3375. [Google Scholar] [CrossRef]
  15. Rabin, S.S.; Melton, J.R.; Lasslop, G.; Bachelet, D.; Forrest, M.; Hantson, S.; Kaplan, J.O.; Li, F.; Mangeon, S.; Ward, D.S.; et al. The fire modeling intercomparison project (FireMIP), phase 1: Experimental and analytical protocol with details model descriptions. Geosci. Model Dev. 2017, 10, 1175–1197. [Google Scholar] [CrossRef]
  16. Yue, C.; Ciais, P.; Zhu, D.; Wang, T.; Peng, S.S.; Piao, S.L. How past fire disturbances contributed to the current carbon balance of boreal ecosystems? Biogeosciences 2016, 13, 675–690. [Google Scholar] [CrossRef] [Green Version]
  17. Ruffault, J.; Mouillot, F. How a new fire suppression policy can abruptly reshape the fire-weather relationship. Ecosphere 2015, 6, 1–19. [Google Scholar] [CrossRef]
  18. Van der Werf, G.R.; Peters, W.; van Leeuwen, T.T.; Giglio, L. What could have caused pre-industrial biomassburning emissions to exceed current rates? Clim. Past 2013, 9, 289–306. [Google Scholar] [CrossRef]
  19. Marlon, J.R.; Kelly, R.; Daniau, A.L.; Vanniere, B.; Power, M.J.; Bartlein, P.; Higuera, P.; Blarquez, O.; Brewer, S.; Brucher, T.; et al. Reconstruction of biomass burning from sediment-charcoal records to improve data-model comparisons. Biogeosciences 2016, 13, 3225–3244. [Google Scholar] [CrossRef] [Green Version]
  20. Kitzberger, T.; Swetnam, T.W.; Veblen, T.T. Inter hemispheric synchrony of forest fires and the El Niño southern oscillation. Glob. Ecol. Biogeogr. 2001, 10, 315–326. [Google Scholar] [CrossRef]
  21. Mouillot, F.; Narasimha, A.; Balkanski, Y.; Lamarque, J.F.; Field, C.B. Global carbon emissions from biomass burning in the 20th century. Geophys. Res. Lett. 2006, 33. [Google Scholar] [CrossRef]
  22. Mieville, A.; Granier, C.; Liousse, C.; Guillaume, B.; Mouillot, F.; Lamarque, J.F.; Gregoire, J.M.; Petron, G. Emissions of gases and particles from biomass burning during the 20th century using satellite data and an historical reconstruction. Atmos. Environ. 2010, 44, 1469–1477. [Google Scholar] [CrossRef]
  23. Koutsias, N.; Xanthopoulos, G.; Founda, D.; Xystrakis, F.; Nioti, F.; Pleniou, M.; Mallinis, G.; Arianoutsou, M. On the relationships between forest fires and weather conditions in Greece from long term national observations (1894–2010). Int. J. Wildland Fires 2013, 22, 493–507. [Google Scholar] [CrossRef]
  24. Higuera, P.E.; Abatzouglou, J.T.; Littell, J.S.; Morgan, P. The changing strength and nature of fire climate relationships in the northern Rocky Mountains, USA, 1902–2008. PLoS ONE 2015, 10. [Google Scholar] [CrossRef] [PubMed]
  25. Bradstock, R.; Penman, T.; Boer, M.; Price, O.; Clarke, H. Divergent responses of fire to recent warming and drying across south eastern Australia. Glob. Chang. Biol. 2014, 20, 1412–1428. [Google Scholar] [CrossRef] [PubMed]
  26. Turco, M.; Llasat, M.C.; Tudela, A.; Castro, X.; Provenzale, A. Brief communication Decreasing fires in a Mediterranean region (1970–2010, NE Spain). Nat. Hazards. Earth Syst. Sci. 2013, 13, 649–652. [Google Scholar] [CrossRef]
  27. Kasischke, E.S.; Stocks, B.J.; O’Neil, K.; French, N.H.F.; Bourgeau-Chavez, L.L. Direct effects of fire on the boreal forest carbon budget. In Biomass Burning and Its Interrelations with the Climate System; Innes, J.L., Beniston, M., Verstraete, M.M., Eds.; Kluwer Academic: Dordrecht, The Netherlands, 2000; pp. 51–68. [Google Scholar]
  28. Short, K.C. Sources and implications of bias and uncertainty in a century of USA wildfire activity data. Int. J. Wildland Fires 2015, 24, 883–891. [Google Scholar]
  29. Syphard, A.D.; Keeley, J.E. Historical reconstruction of California wildfires vary with data source. Int. J. Wildland Fires 2016, 25, 1221–1227. [Google Scholar] [CrossRef]
  30. Turco, M.; Bedia, J.; Di Liberto, F.; Fiorucci, P.; von Hardenberg, J.; Koutsias, N.; Llasat, M.C.; Xystrakis, F.; Provenzale, A. Decreasing fires in Mediterranean Europe. PLoS ONE 2016, 11. [Google Scholar] [CrossRef] [PubMed]
  31. Pellizzaro, G.; Cesaraccio, C.; Duce, P.; Ventura, A.; Zara, P. Relationships between seasonal patterns of live fuel moisture and meteorological drought indices for Mediterranean shrubland species. Int. J. Wildland Fire 2007, 6, 232–241. [Google Scholar] [CrossRef]
  32. San-Miguel-Ayanz, J.; Schulte, E.; Schmuck, G.; Camia, A.; Strobl, P.; Liberta, G.; Giovando, C.; Boca, R.; Sedano, F.; Kempeneers, P.; et al. Comprehensive monitoring of wildfires in Europe: The European forest fire information system (EFFIS). In Approaches to Managing Disaster—Assessing Hazards, Emergencies and Disaster Impacts; Tiefenbacher, J., Ed.; InTech: London, UK, 2012; Available online: http://dx.doi.org/10.5772/28441 (accessed on 12 December 2017).
  33. Urbieta, I.R.; Zavala, G.; Bedia, J.; Gutierrez, J.M.; San Miguel-Ayanz, J.; Camia, A.; Keeley, J.E.; Moreno, J.M. Fire activity as a function of fire-weather seasonal severity and antecedent climate across spatial scales in southern Europe and Pacific western USA. Environ. Res. Lett. 2015, 10. [Google Scholar] [CrossRef]
  34. Turco, M.; von Hardenberg, J.; Agha Kouchak, A.; Llasat, M.C.; Provenzale, A.; Trigo, R.M. On the key role of droughts in the dynamics of summer fires in Mediterranean Europe. Sci. Rep. 2017, 7, 81. [Google Scholar] [CrossRef] [PubMed]
  35. Chriha, S.; Sghari, A. Les incendies de forêt en Tunisie: Séquelles irréversibles de la révolution de 2011. Mediterrannée 2016, 121, 87–93. (In French) [Google Scholar] [CrossRef]
  36. Abdelmoula, K. Journées d’études sur la réhabilitation des subéraies incendiées et reboisements. Tlemcen (Algeria), 2013. Available online: http://www.rencontre-medsuber.com/dmediafiles/biblio/2013/2013–15.pdf (accessed on 12 December 2017).
  37. Sebei, S. Le degré météorologique du risque incendie de forêt (DMRIF): Méthode d’évaluation du risque d’incendie en Tunisie. XXVIII colloque de l’association internationale de climatologie, Liège (Belgium), 2015. Available online: http://www.climato.be/aic/colloques/actes/ACTES_AIC2015/2%20Climatologie%20appliquee/034-SEBEI-212&#x2013;217.pdf (accessed on 12 December 2017).
  38. Madoui, A. Les incendies de forêts en Algérie: Historique, bilan et analyse. Forêt Mediterranéenne 2002, 23, 23–30. Available online: http://hdl.handle.net/2042/39420 (accessed on 12 December 2017).
  39. Meddour-Sahar, O.; Meddour, R.; Leone, V.; Lovreglio, R.; Derridj, A. Analysis of forest fires causes and their motivations in northern Algeria: The Delphi method. iForest 2013, 6, 247–254. [Google Scholar] [CrossRef]
  40. Chergui, B.; Fahd, S.; Santos, X.; Pausas, J.G. Socio-economic factors drive fire regime variability in the Mediterranean basin. Ecosystems 2017. [Google Scholar] [CrossRef]
  41. Venalainen, A.; Korhonen, N.; Hyvarinen, O.; Koutsias, N.; Xystrakis, F.; Urbieta, I.R.; Moreno, J.M. Temporal variations and change in forest fire danger in Europe for 1960–2012. Nat. Hazards. Earth Syst. Sci. 2014, 14, 1477–1490. [Google Scholar] [CrossRef]
  42. Chakroun, H.; Mouillot, F.; Hamdi, A. Regional equivalent water thickness modeling from remote sensing across a tree cover/LAI gradient in Mediterranean forests of northern Tunisia. Remote Sens. 2015, 7, 1937–1961. [Google Scholar] [CrossRef]
  43. Zribi, L.; Mouillot, F.; Guibal, F.; Rejeb, S.; Rejeb, M.N.; Gharbi, F. Deep soil conditions make Mediterranean cork oak stem growth vulnerable to autumnal rainfall decline in Tunisia. Forests 2016, 7, 245. [Google Scholar] [CrossRef]
  44. Rezgui, F.; Gharbi, F.; Zribi, L.; Mouillot, F.; Ourcival, J.M.; Hanchi, B. Soil respiration behavior in a Mediterranean Aleppo pine forest in north Tunisia. Appl. Ecol. Environ. Res. 2016, 14, 343–356. [Google Scholar] [CrossRef]
  45. Longepierre, D.; Mouillot, F.; Ouelhazi, B.; Ourcival, J.M.; Rocheteau, A.; Degueldre, D.; Rejeb, M.N. True water constraint under a rainfall interception experiment in a Mediterranean shrubland (Northern Tunisia): Confronting discrete measurements with a plant soil water budget model. Plant Ecol. 2014, 215, 779–794. [Google Scholar] [CrossRef]
  46. Oliveira, S.L.J.; Pereira, J.M.C.; Carreiras, J.M.B. Fire frequency analysis in Portugal (1975–2005), using Landsat-based burnt area maps. Int. J. Remote Sens. 2012, 21, 48–60. [Google Scholar] [CrossRef]
  47. Diaz-Delgado, R.; Pons, X. Spatial patterns of forest fires in Catalonia (NE of Spain) along the period 1975–1995: Analysis of vegetation recovery after fire. For. Ecol. Manag. 1998, 147, 67–74. [Google Scholar] [CrossRef]
  48. Bastarrika, A.; Alvarado, M.; Artano, K.; Martinez, M.P.; Mesanza, A.; Torre, L.; Ramo, R.; Chuvieco, E. BAMS: A tool for supervised burned area mapping using Landsat data. Remote Sens. 2014, 6, 12360–12380. [Google Scholar] [CrossRef]
  49. INFOTEL, Inventaire des Forêts par Télédétection. Résultats du Deuxième Inventaire Forestier et Pastoral National; CNCT (Ministère de la Défense Nationale, Tunisie); Direction Générale des Forêts (Ministère de l’Agriculture); Direction Générale de la Recherche Scientifique (Ministère de l’Enseignement Supérieure et de la Recherche Scientifique, Tunisie): Tunis, Tunisia, 2010.
  50. Fire Information for Resource Management System (FIRMS). Available online: https://earthdata.nasa.gov/firms (accessed on 12 December 2017).
  51. Giglio, L.; van der Werf, G.R.; Randerson, J.T.; Collatz, G.J.; Kasibathla, P. Global estimation of burned area using MODIS active fire observations. Atmos. Chem. Phys. 2006, 6, 957–974. [Google Scholar] [CrossRef] [Green Version]
  52. He, L.; Li, Z. Enhancement of a fire-detection algorithm by eliminating solar contamination effects and atmospheric path radiance: Application to MODIS data. Int. J. Remote Sens. 2011, 32, 6273–6293. [Google Scholar] [CrossRef]
  53. Hantson, S.; Padilla, M.; Corti, D.; Chuvieco, E. Strength and weaknesses of MODIS hotspots to characterize global fire occurrence. Remote Sens. Environ. 2013, 131, 152–159. [Google Scholar] [CrossRef]
  54. Benali, A.; Russo, A.; Sa, A.C.L.; Pinto, R.M.S.; Price, O.; Koutsias, N.; Pereira, J.M.C. Determining fire dates and locating ignitions points with satellite data. Remote Sens. 2016, 8, 326. [Google Scholar] [CrossRef]
  55. Turco, M.; Levin, N.; Tessler, N.; Saaroni, H. Recent changes and relations among drought, vegetation and wildfires in the Eastern Mediterranean: The case of Israel. Glob. Planet. Chang. 2017, 151, 28–35. [Google Scholar] [CrossRef]
  56. Ricotta, C.; Arianoutsou, M.; Diaz-Delgado, R.; Duguy, B.; Lloret, F.; Maroudi, E.; Mazzoleni, S.; Moreno, J.M.; Rambal, S.; Vallejo, R.; et al. Self-organized criticality of wildfires ecologically revisited. Ecol. Model. 2001, 141, 307–311. [Google Scholar] [CrossRef]
  57. Sen, P.K. Estimates of the regression coefficient based on Kendall’s tau. J. Am. Stat. Assoc. 1968, 63, 1379–1389. [Google Scholar] [CrossRef]
  58. Tools for the Analysis of Air Pollution Data. Available online: https://cran.r-project.org/web/packages/openair/openair.pdf (accessed on 15 June 2017).
  59. The R Project for Statistical Computing. Available online: http://www.R-project.org/ (accessed on 15 June 2017).
  60. Forest Resource Assessment; Country Report; FAO: Roma, Italy, 2014; Available online: http://www.fao.org/3/a-az357f.pdf (accessed on 25 January 2018).
  61. Schmuck, G.; San Miguel-Ayanz, J.; Camia, A.; Durrant, T.; Boca, R.; Whitmore, C.; Liberta, G.; Corti, P.; Schulte, E. Forest Fires in Europe, Middle East and North Africa, 2011; Publications Office of the European Union: Luxembourg, 2012; 108p. [Google Scholar]
  62. Turquety, S.; Menut, L.; Bessagnet, B.; Anav, A.; Viovy, N.; Maignan, F.; Wooster, M. APIFLAME v1.0: High-resolution fire emission model and application to the Euro-Mediterranean region. Geosci. Model. Dev. 2014, 7, 587–612. [Google Scholar] [CrossRef] [Green Version]
  63. Pereira, M.G.; Malamud, B.D.; Trigo, R.M.; Alves, P.I. The history and characteristics of the 1980–2005 Portuguese rural fire database. Nat. Hazards. Earth Syst. Sci. 2011, 11, 3343–3358. [Google Scholar] [CrossRef] [Green Version]
  64. Short, K.C. A spatial database of wildfires in USA, 1992–2011. Earth Syst. Sci. Data 2014, 6, 1–27. [Google Scholar] [CrossRef]
  65. Thompson, M.P.; Calkin, D.E. Uncertainty and risk in wildland fire management: A review. J. Environ. Manag. 2011, 92, 1895–1909. [Google Scholar] [CrossRef] [PubMed]
  66. Koutsias, N.; Pleniou, M.; Mallinis, G.; Nioti, F.; Sifakis, N.I. A rule-based semi-automatic method to map burned areas: Exploring the USGS historical Landsat archives to reconstruct recent fire history. Int. J. Remote Sens. 2013, 34, 7049–7068. [Google Scholar] [CrossRef]
  67. Mallinis, G.; Koutsias, N. Comparing ten classification methods for burned area mapping in a Mediterranean environment using Landsat TM satellite data. Int. J. Remote Sens. 2012, 33, 4408–4433. [Google Scholar] [CrossRef]
  68. Pleniou, M.; Xystrakis, F.; Dimopoulos, P.; Koutsias, N. Maps of fire occurrence—Spatially explicit reconstruction of recent fire history using satellite remote sensing. J. Maps 2012, 8, 499–506. [Google Scholar] [CrossRef]
  69. Ayari, A.; Moya, D.; Rejeb, M.N.; Ben Mansoura, A.; Albouchi, A.; De Las Heras, J.; Fezzani, T.; Henchi, B. Geographical variation on cone and seed production of natural Pinus halepensis Mill. forests in Tunisia. J. Arid Environ. 2011, 75, 403–410. [Google Scholar] [CrossRef]
  70. Meddour-Sahar, O.; Derridj, A. Bilan des feux de forêts en Algérie: Analyses spatio-temporelle et cartographie du risqué (1985–2010). Sécheresse 2012, 23, 133–141. (In French) [Google Scholar]
  71. Meddour-Sahar, O. Les Feux de Forêts en Algérie: Analyse du Risque, Étude des Causes, Évaluation du Dispositif de Défense et des Politiques de Gestion. Ph.D. Thesis, Université Mouloud Maameri de Tizi Ouzou, Tizi Ozou, Algeria, 3 April 2014; 295p. (In French). [Google Scholar]
  72. Portier, J.; Gauthier, S.; Leduc, A.; Arseneault, D.; Bergeron, Y. Fire regime along latitudinal gradients of continuous to discontinuous coniferous Boreal forests in Eastern Canada. Forests 2016, 7, 211. [Google Scholar] [CrossRef]
  73. Moreno, M.V.; Chuvieco, E. Fire regime characteristics along environmental gradients in Spain. Forests 2016, 7, 262. [Google Scholar] [CrossRef]
  74. Moreno, J.M.; Vazquez, A.; Velez, R. Recent History of Forest Fires in Spain. In Large Fires; Moreno, J.M., Ed.; Backhuys: Leiden, The Netherlands, 1998; pp. 159–185. [Google Scholar]
  75. Dai, A. Increasing drought under global warming in observations and models. Nat. Clim. Chang. 2013, 3, 52–58. [Google Scholar] [CrossRef]
  76. Pausas, J.G. Changes in fire and climate in the eastern Iberian Peninsula (Mediterranean basin). Clim. Chang. 2004, 63, 337–350. [Google Scholar] [CrossRef]
  77. Frejaville, T.; Curt, T. Seasonal changes in the human alteration of fire regimes beyond the climate forcing. Environ. Res. Lett. 2017, 12. [Google Scholar] [CrossRef]
  78. Ruffault, J.; Moron, V.; Trigo, R.M.; Curt, T. Objective identification of multiple large fire climatologies: An application to a Mediterranean ecosystem. Environ. Res. Lett. 2016, 11. [Google Scholar] [CrossRef]
  79. Sarris, D.; Christopoulou, A.; Angelonidi, E.; Koutsias, N.; Fule, P.Z.; Arianoutsou, M. Increasing extremes of heat and drought associated with recent severe wildfires in southern Greece. Reg. Environ. Chang. 2014, 14, 1257–1268. [Google Scholar] [CrossRef]
  80. Moreira, F.; Viedma, O.; Arianoutsou, M.; Curt, T.; Koutsias, N.; Rigolot, E.; Barbati, A.; Corona, P.; Vaz, P.; Xanthopoulos, G.; et al. Landscape-wildfire interactions in southern Europe: Implications for landscape management. J. Environ. Manag. 2011, 92, 2389–2402. [Google Scholar] [CrossRef] [PubMed] [Green Version]
Figure 1. Location of Tunisia within the Mediterranean basin (A); with the map of altitudes (B); and administrative units (Gouvernorat) overlayed with forests/shrubland distribution (C).
Forests 09 00059 g001
Figure 2. Flow chart of the data processing chain. CRDA (Commissariat Régional au Développement Agricole), RADES (Rades forest service centre), and DGF (Direction Générale des Forêts) refer to the local data source. COR-1 refers to the first correction phase assembling all available databases. LANDSAT are the fire events for which burned area was derived from the BAMS (Burned Area Mapping Software) [48] processing of Landsat images. Fire events were then dated (over the 2000–2010 period) with the MCD14ML fire hotspots to derive LANDSAT_dated data. COR-2, merging COR-1 and LANDSAT_dated, was then checked for multiple referencing to provide the final database (further called COR).
Forests 09 00059 g002
Figure 3. For each gouvernorat and the whole Tunisia, yearly fire numbers from the raw DGF database (thin green line), the assembled database COR-1 (thick green line) and fire numbers from COR-1 filtered for Forest and Shrublands (no agricultural, nor herbaceous fires) for fire sizes >1 ha (red line), 0.1 ha (brown line) and all fires (black line). BE: Beja; BZ: Bizerte; JE: Jendouba; KA: Kairouan, KF: Le Kef; KS: Kasserine; NB: Nabeul; SI: Silina; TN: Tunis; ZA: Zaghouan.
Forests 09 00059 g003
Figure 4. Size (in ha, log scale, on Y-axis) of each fire record (X-axis, fire record identification number, classified from the oldest to the most recent), for each gouvernorat and for Tunisia as a whole.
Forests 09 00059 g004
Figure 5. Yearly (X-axis) and monthly (Y-axis) distribution of fire records in the DGF database (black dots), RADES (grey dots) and CRDA (red dots) for each ‘gouvernorat’. Each dot represents a month where at least one fire has been registered in a given database.
Forests 09 00059 g005
Figure 6. Scatterplot representing the corrected (COR) burned area of large fire events (Y-axis, in ha, log10 scale) as a function of official burned area (X-axis, in ha, log10 scale) from DGF.
Forests 09 00059 g006
Figure 7. Location of fire events larger than 4 ha in Tunisia from the COR-1 database (red dots) (A); Fire contours (red polygons for fires larger than 4 ha) in Tunisia obtained from the Landsat image analysis over the period 1985–2010 (B). Background information refers to the needleleaf and broadleaf forests in Tunisia based on the Tunisian Forest Inventory [49].
Forests 09 00059 g007
Figure 8. Fire size distribution plots for each gouvernorat and Tunisia, representing fire event number (log10 scale, Y-axis) as a function of their size (X-axis, log10 scale). Empty black dots represent the official DGF database and the grey dots represent the corrected database COR.
Forests 09 00059 g008
Figure 9. Yearly (X-axis) burned area (Y-axis in ha) for each gouvernorat and Tunisia for the 1971–2010 period. The dotted line represents the year 1985, the year before which burned area is not reliable due to missing fire records in the digital DGF database. The black line represents the official DGF burned area, and the red line represents the corrected burned area COR.
Forests 09 00059 g009
Figure 10. Yearly (X-axis) fire numbers (Y-axis) for each gouvernorat and Tunisia from 1971 to 2010 (vertical dashed line presenting year 1985 after which we consider the database to be reliable). The COR database (non-gap-filled, in red), gap-filled with mean (black line), and maximum (grey upper envelope boundary) fire numbers over the time series when a monthly report is missing.
Forests 09 00059 g010
Figure 11. Seasonal (month, X-axis) pattern of fire numbers for each gouvernorat and for whole Tunisia. Each plot describes the monthly mean fire number in the COR dataset (red line), the monthly mean fire number in the COR dataset gap-filled when no fires were recorded during a given month, with the mean fire number in the time series (black line), the maximum recorded fire number during a month in the COR dataset (dots). The dark grey envelope represents the gap-filled COR dataset gap-filled with the maximum, or minimum (non-zero) fire number recorded for this month in the time series. The light grey envelope represents the minimum fire number recorded during a month in the COR dataset along the whole time series.
Forests 09 00059 g011
Figure 12. Seasonal pattern of burned area for each gouvernorat in Tunisia from the DGF (black thin line) and COR (black thick line). For comparison, the seasonal pattern of burned area for the whole Tunisia (grey lines) is also plotted as a background of each gouvenorat (thin line, DGF; thick line, COR).
Forests 09 00059 g012
Table 1. Environmental description of the forested administrative units in Tunisia: Mean Annual Temperature (MAT) in °C, Mean Annual Precipitation (MAP) in mm, surface area of the respective administrative units (in ha), and the forest and shrubland cover within these units (in ha). The percentage of forest and shrubland cover within each administrative unit is also indicated (% admin. unit in parentheses).
GouvernoratMAT (°C)MAP (mm)Administrative Surface (ha)Forest Shrubland Surface (ha) (% of admin. unit)
BEJA (BE)17.7662367,79948,117 (13.1)32,063 (8.71)
BIZERTE (BZ)18.0527357,42935,658 (9.98)55,157 (15.43)
JENDOUBA (JE)18.0504307,69498,714 (32.08)14,964 (4.86)
KAIROUAN (KA)17.9293662,12336,879 (5.56)34,773 (5.25)
LE KEF (KF)16.3521507,62677,728 (15.31)38,088 (7.50)
KASSERINE (KS)16.9289825,131132,326 (16.04)26,717 (3.23)
NABEUL (NB)17.9358282,82542,410 (14.99)26,664 (9.42)
SILIANA (SI)16.9423463,40082,399 (17.78)45,963 (9.91)
TUNIS (TN)18.1448256,44621,471 (8.37)13,623 (5.31)
ZAGHOUAN (ZA)17.9483284,26952,575 (18.49)25,291 (9.92)
Table 2. Burned area and fire number synthesis for each gouvernorat in Tunisia from the official DGF (Direction Générale des Forêts) database and the corrected database (COR). The COR/DGF ratio represents the error in the official data. Surface area of gouvernorat (in ha), forest and shrubland cover (in ha) are also shown and used to derive the percentage of forest cover burned per year for each gouvernorat and Tunisia.
Burned Area ha year−1 (% Forest Cover Burned year−1) COR/DGFFire Number year−1Surface Area × 1000 ha (Forest/Gouvernorat Ratio)
DGFCORGouvernoratForest
BEJA (BE)94.48 (0.12)264.48 (0.33)280%20367.880.18 (21.8)
BIZERTE (BZ)101.59 (0.11)182.89 (0.20)180%19357.490.81 (25.4)
JENDOUBA (JE)288.99 (0.25)492.31 (0.43)170%39307.7113.68 (36.9)
KAIROUAN (KA)12.56 (0.02)8.53 (0.01)68%17662.171.65 (10.8)
LE KEF (KF)79.95 (0.07)111.55 (0.09)139%21507.6115.8 (22.8)
KASSERINE (KS)16.87 (0.01)18.02 (0.01)106%20825.1159.0 (19.2)
NABEUL (NB)46.17 (0.07)56.96 (0.08)123%27282.869.1 (24.4)
SILIANA (SI)106.86 (0.08)190.84 (0.15)178%25463.4128.4 (27.7)
TUNIS (TN)84.39 (0.24)118.02 (0.34)140%28256.435.1 (13.7)
ZAGHOUAN (ZA)185.37 (0.24)356.19 (0.46)192%20284.377.9 (27.4)
TUNISIA1017.3 (0.11)1799.8 (0.19)176%2364314.7941.6 (21.8)
Table 3. Yearly burned area (in ha), for the period 2000–2010 in Tunisia from different sources compared to our historical synthesis on official statistics (DGF) and corrected values (COR).
20002001200220032004200520062007200820092010
FRA (tot) [60] 1871894742671532696225889
FRA (forests) 15210435511145747883702
EFFIS [61] 1293551
Chriha [35]137422823137119635515046748499700
DGF1309195217346137629549449961806
COR5027226878818147442114152315021943037
Table 4. Slope and p-value of the temporal regression of fire number and burned area over the 1985–2010 period for Tunisia (Theil-Sen test). *** p-value < 0.01, ** p-value < 0.05, * p-value < 0.1. NS non-significant. Temporal trend is analyzed for all fires in DGF and COR, and for fire sizes >0.01 ha, >0.1 ha and >4 ha in COR.
Fire Number (year−1)Burnt Area (ha year−1)
Slopep-ValueSlopep-Value
DGF5.600.00 ***−19.930.10 *
COR2.300.11 (NS)−9.740.75 (NS)
COR > 0.012.300.07 *−9.740.75 (NS)
COR > 0.11.400.21 (NS)−9.750.75 (NS)
COR > 4 ha0.000.88 (NS)−9.820.70 (NS)

