Intraspecific Variation in Pines from the Trans-Mexican Volcanic Belt Grown under Two Watering Regimes: Implications for Management of Genetic Resources

 , ,
, ,
Abstract
:1. Introduction
2. Materials and Methods
2.1. Plant Material
2.2. Experiment Description and Experimental Design
2.3. Variables Measured
2.4. Data Analysis
2.4.1. Seedling Survival
2.4.2. Mixed Model
2.4.3. Phenotypic Plasticity
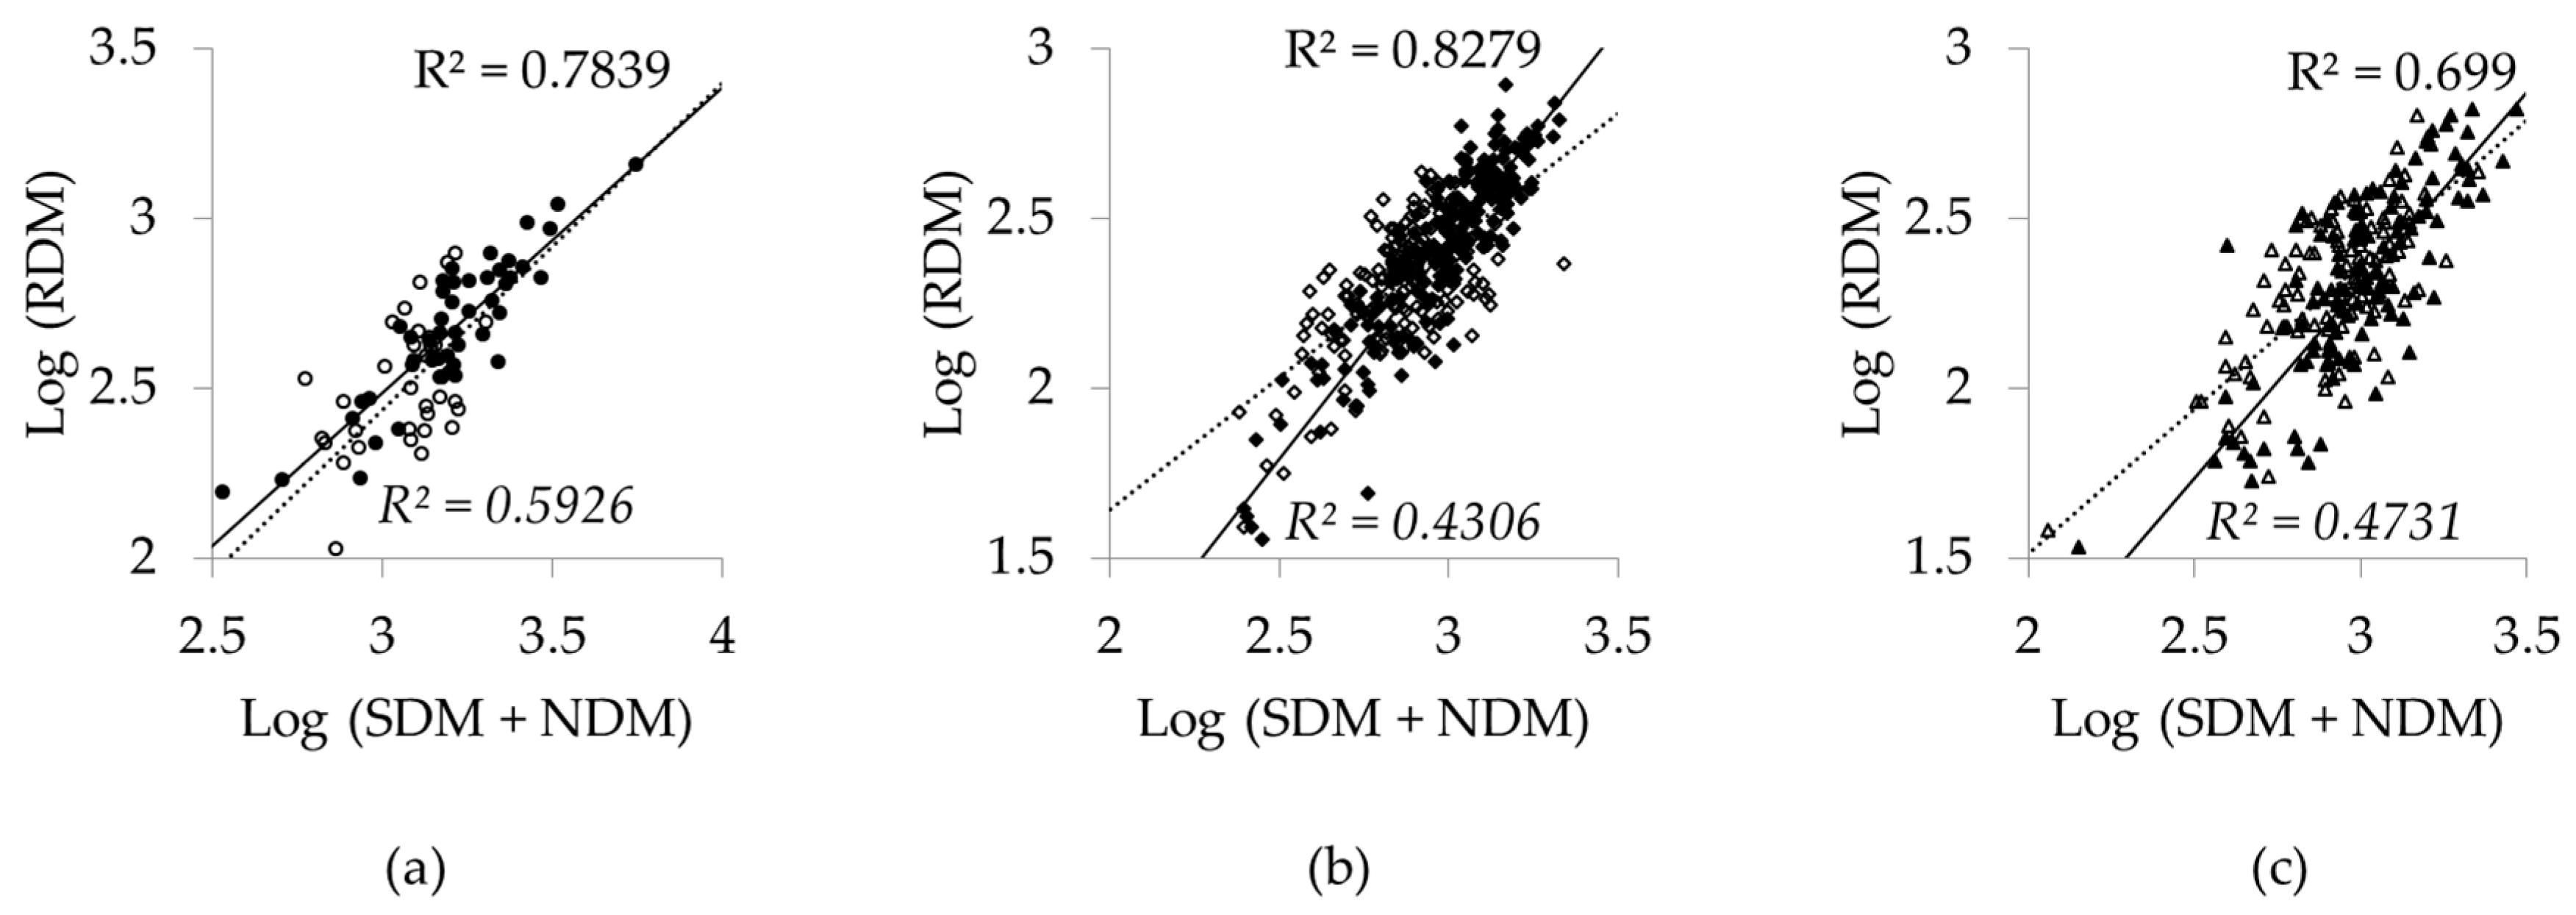
2.4.4. Allometric Analysis
2.4.5. Factor Analysis
2.5. Data Access
3. Results
3.1. Response to Watering Regimes
3.2. Allocation Patterns
3.3. Intraspecific Variation
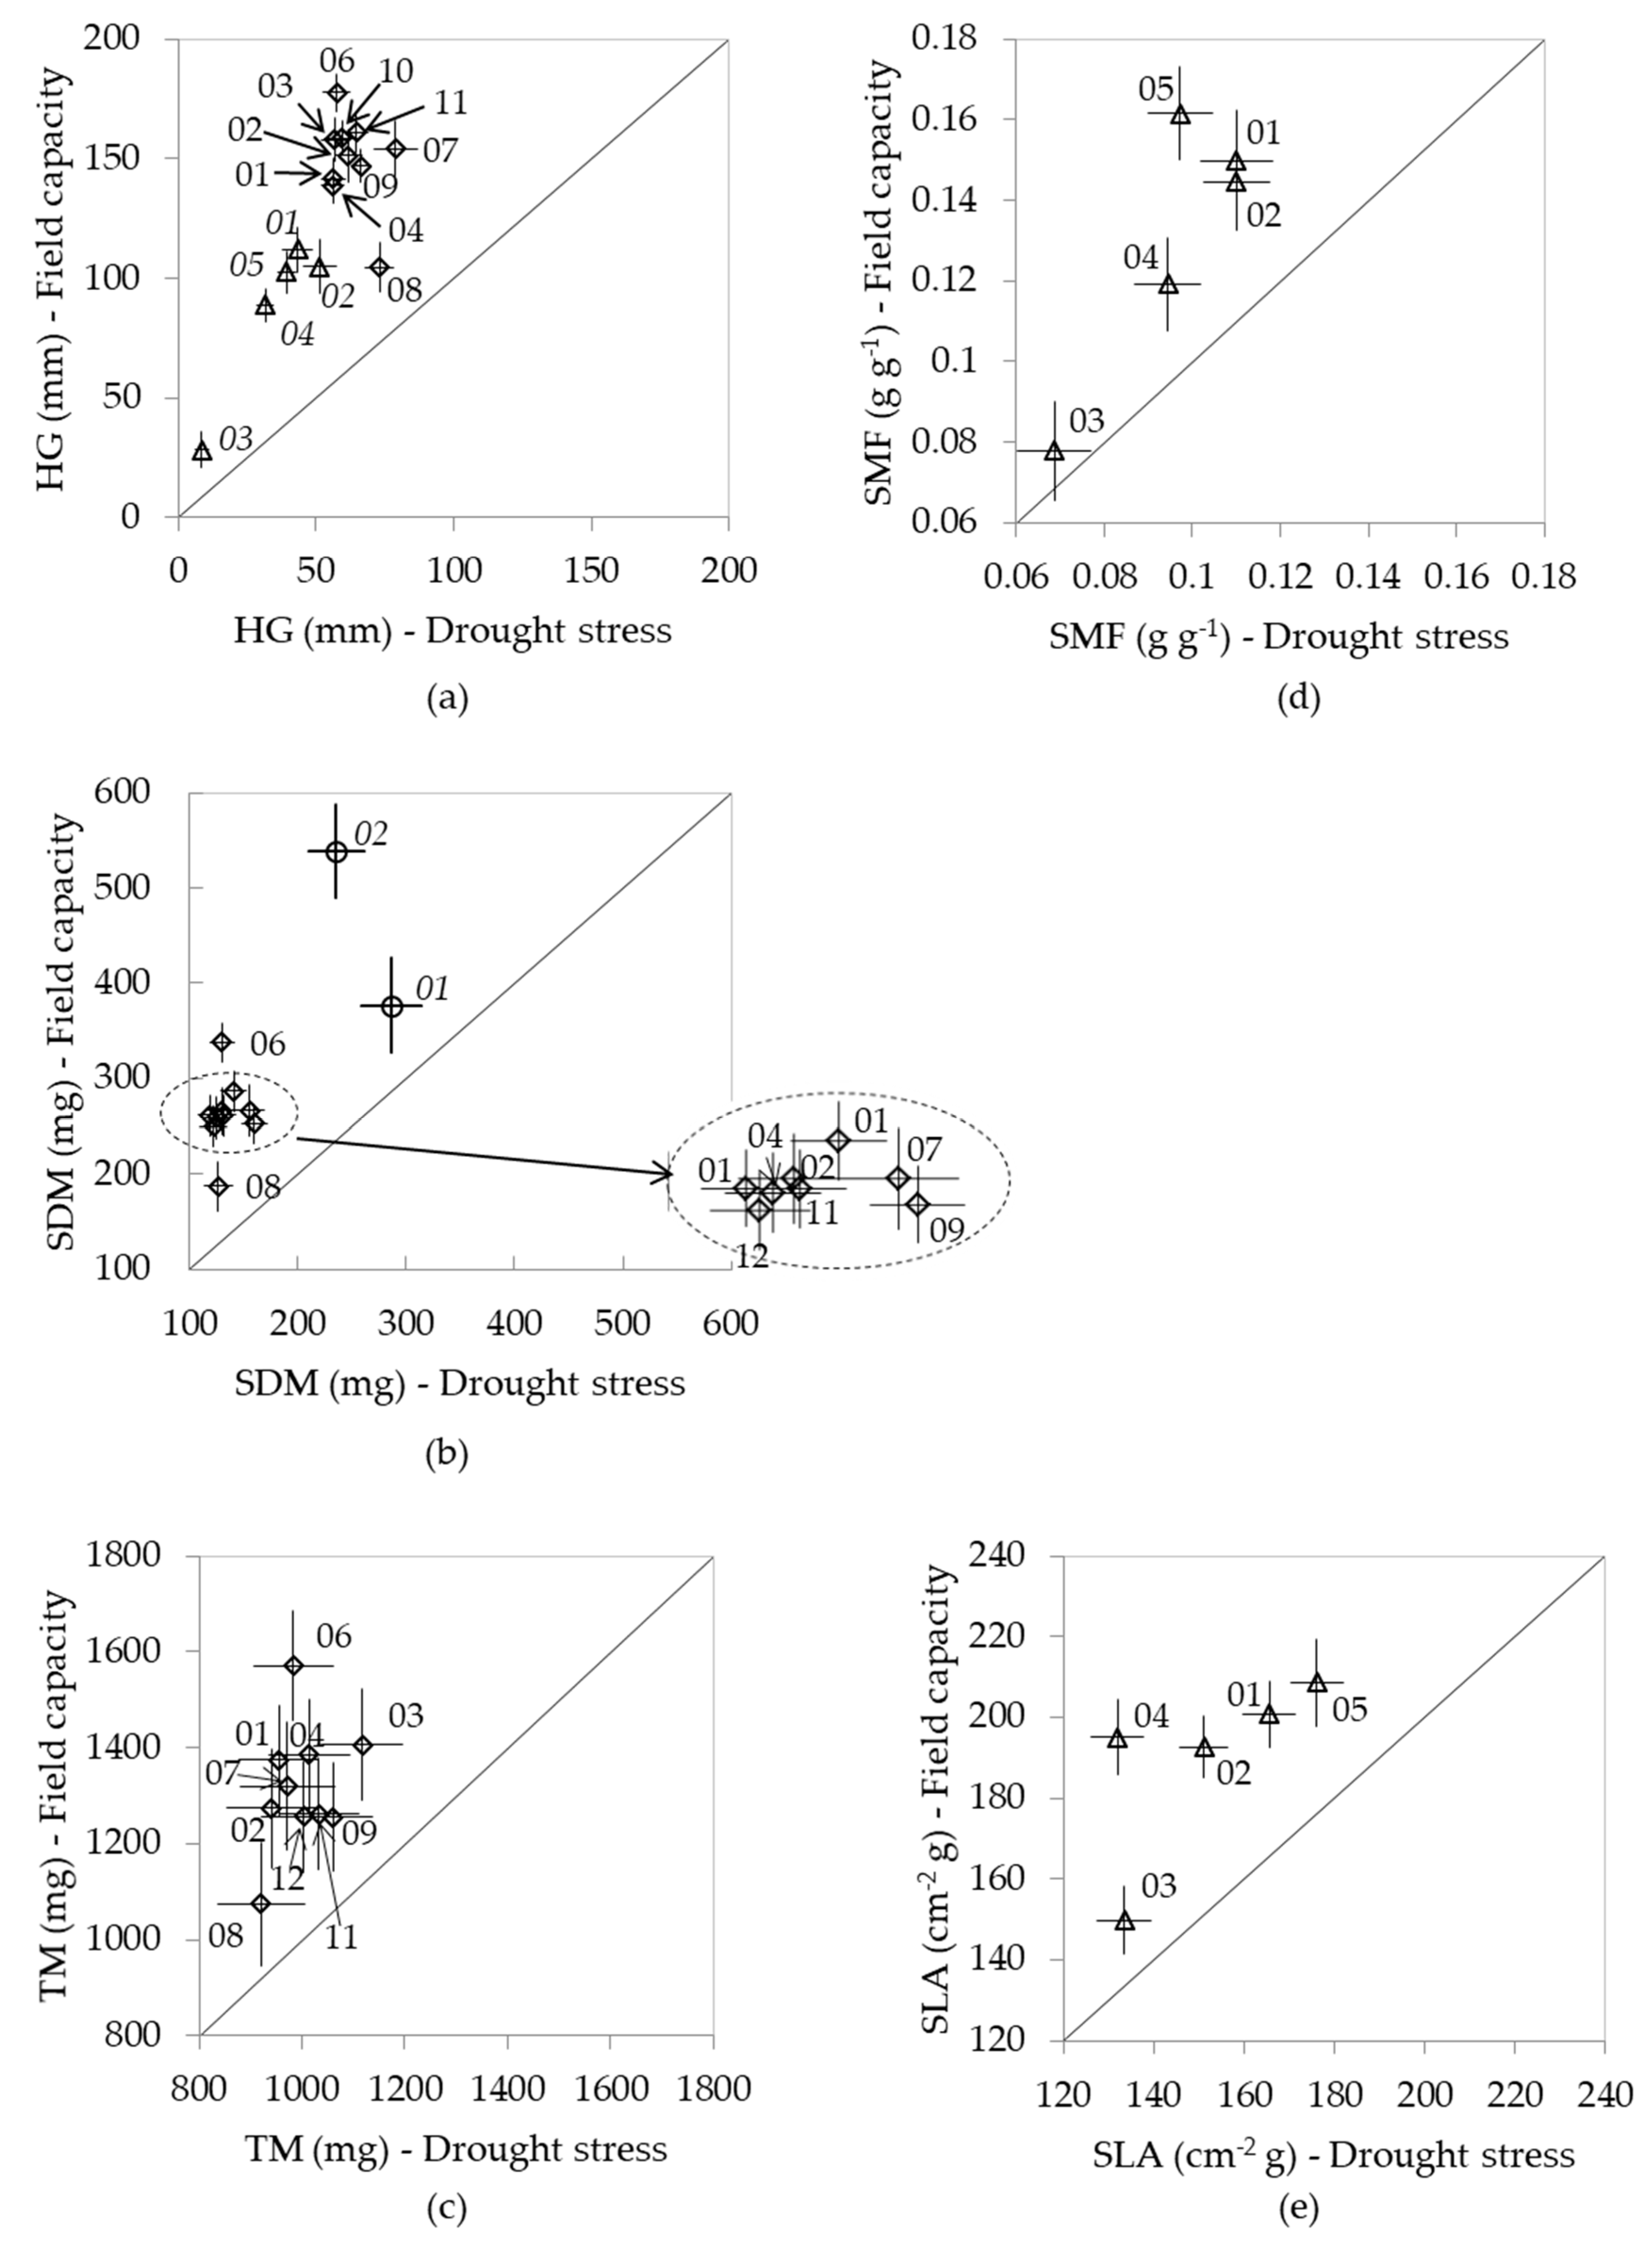
3.4. Phenotypic Variation of the Mexican Species Under Full Capacity and Drought Stress Treatments
4. Discussion
5. Conclusions
Supplementary Materials
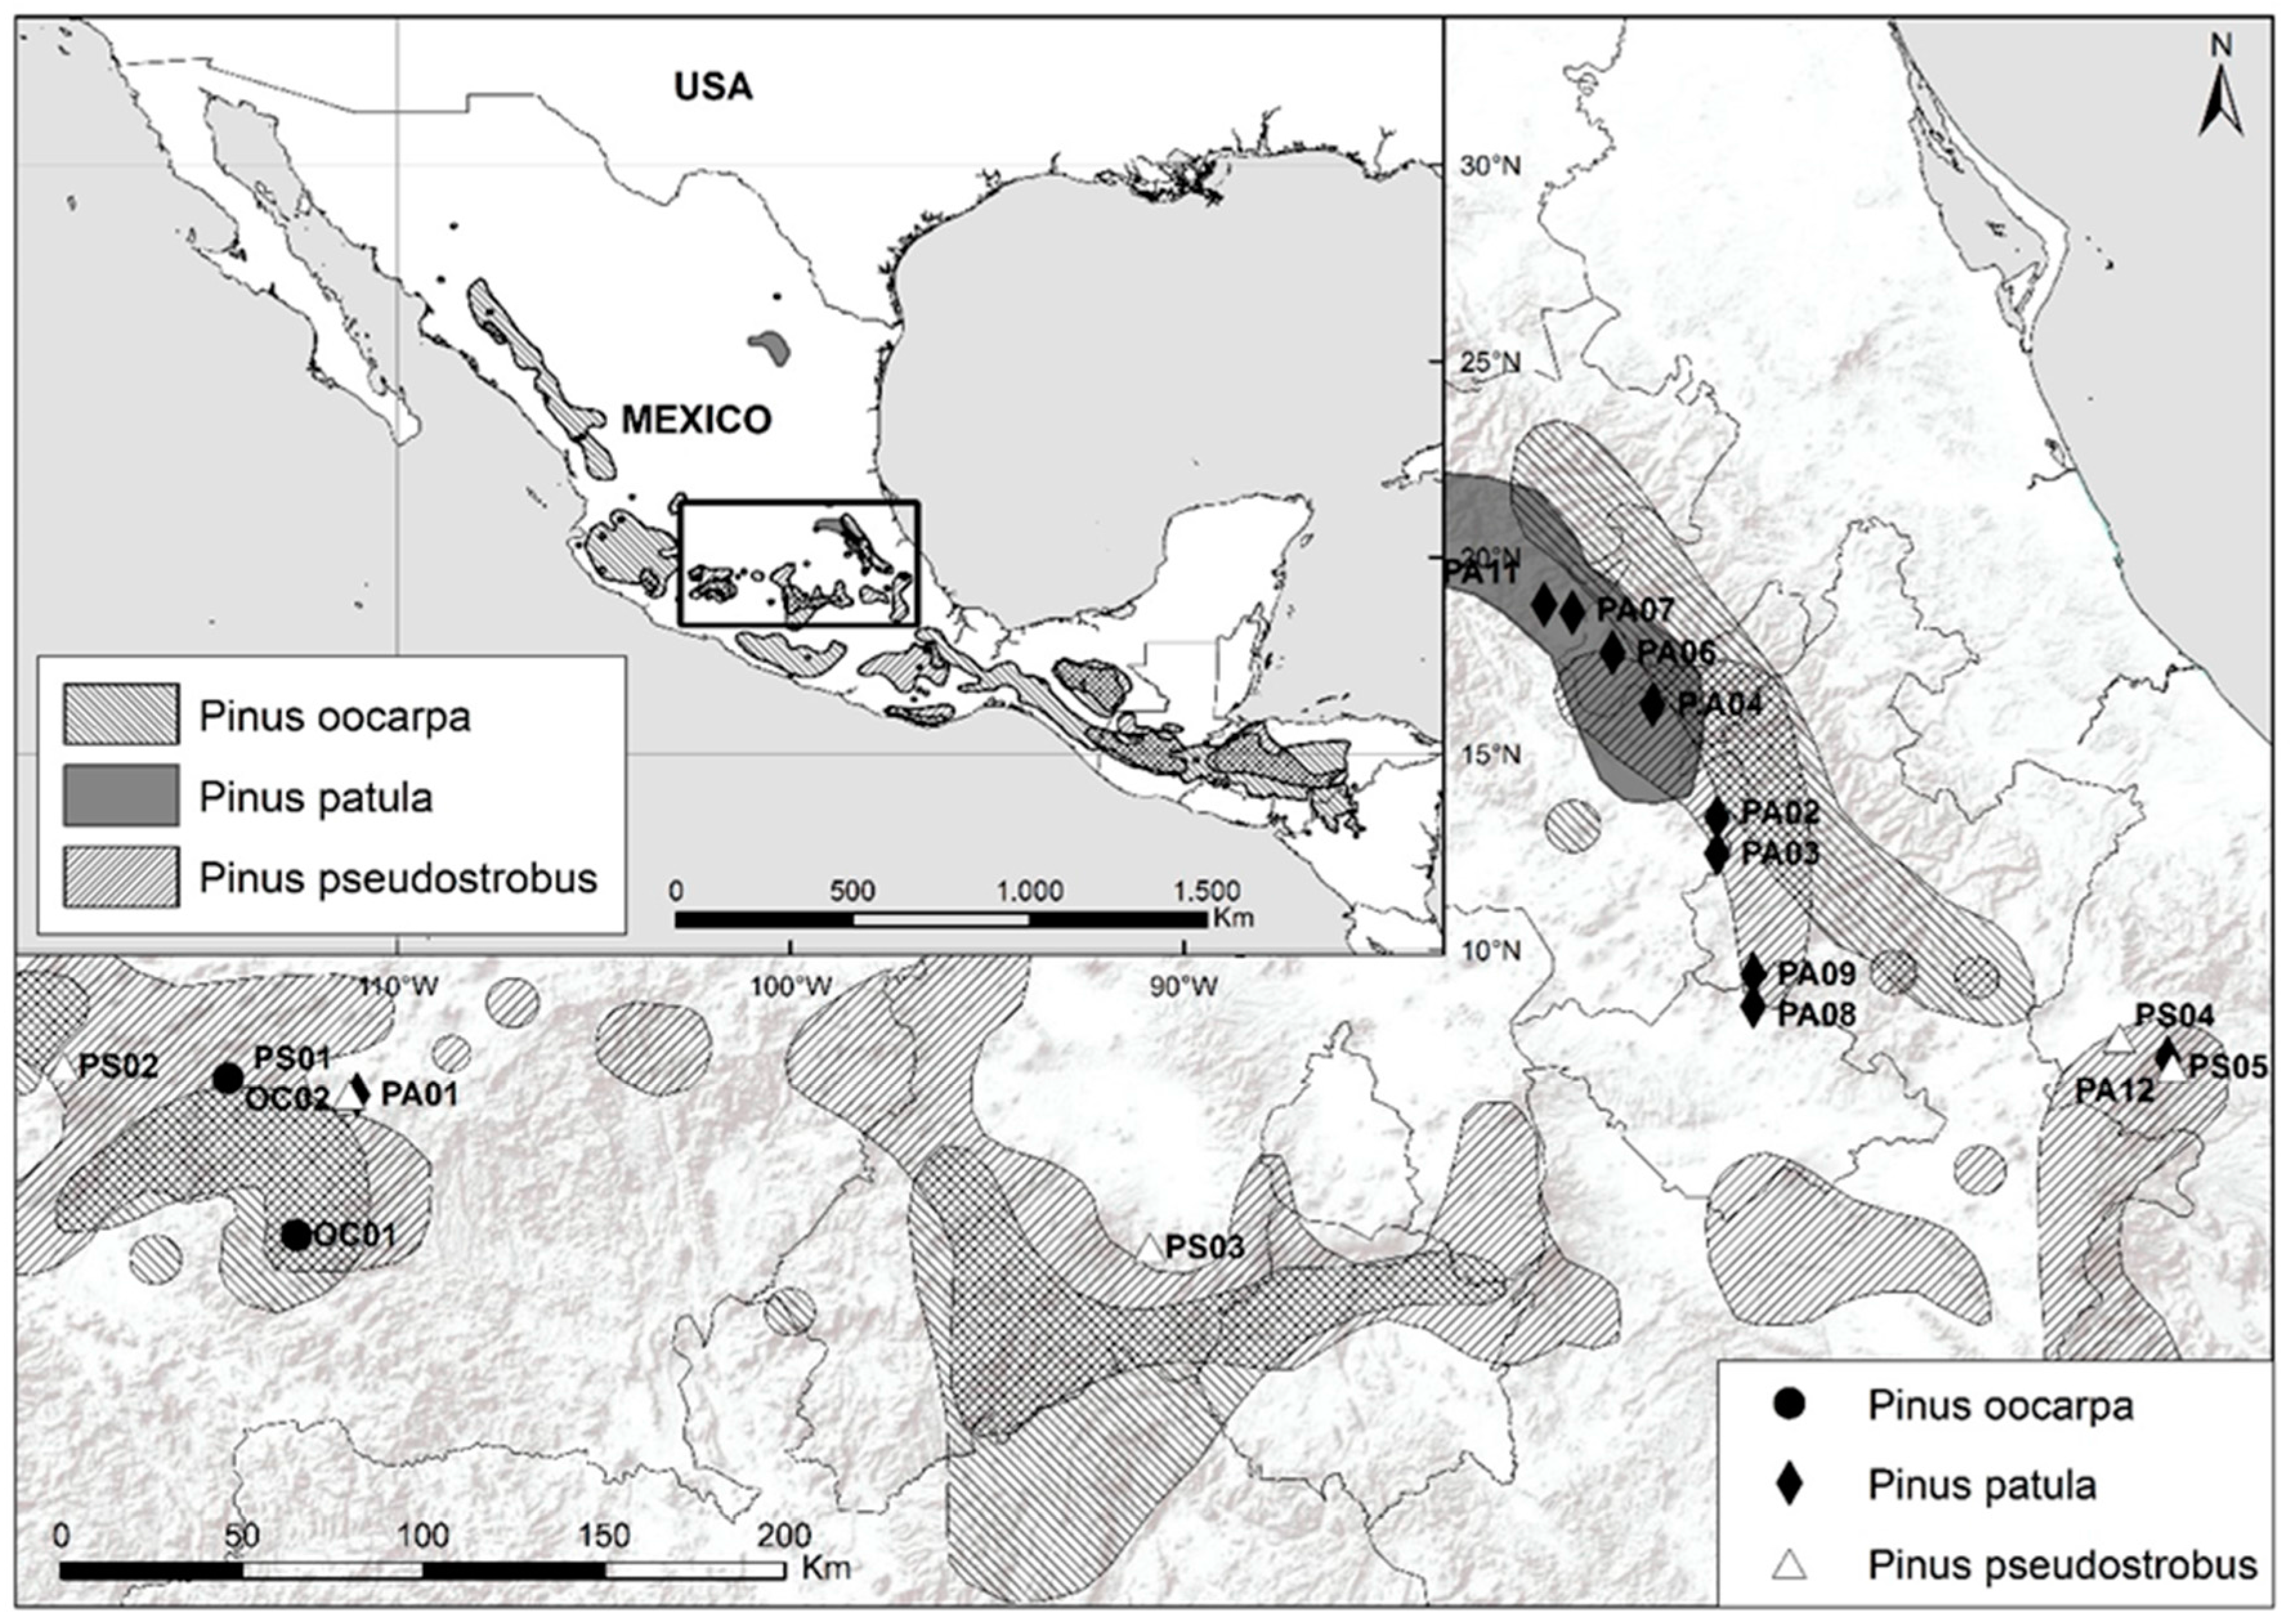
 ) and P. pseudostrobus (
  ). Filled symbols and population’s number represent FC treatment, while empty symbols and underlined population’s number represent DS treatment. Also, the database of the four Pines species is available at: https://doi.org/10.5281/zenodo.1162044.
Acknowledgments
Author Contributions
Conflicts of Interest
Appendix A
Experimental Details

| Slow-Growth Phase | Normal-Growth Phase | |
|---|---|---|
| Duration | 135 days, November-March | 90 days, April to June |
| Position of the trays with respect to the solar angle | west to east | west to east |
| Temperature | 8 ± 2 °C | 24 ± 2 °C |
| Photoperiod | Short days | Long days |
| Irrigation system | misting nozzle | misting nozzle |
| Watering amount | Full capacity | Two watering regimes |
| Relative humidity | 60 ± 5% | 80 ± 5% |
| Heat shield | 40–50% reflecting radiant heat | 40–50% reflecting radiant heat |
| Fertilization | Peter’s 20-20-20 -N-P-K | Peter’s 20-20-20 -N-P-K |
References
- Sáenz-Romero, C.; Rehfeldt, G.E.; Crookston, N.L.; Duval, P.; St-Amant, R.; Beaulieu, J.; Richardson, B.A. Spline models of contemporary, 2030, 2060 and 2090 climates for Mexico and their use in understanding climate-change impacts on the vegetation. Clim. Chang. 2010, 102, 595–623. [Google Scholar] [CrossRef]
- Thuiller, W.; Lavorel, S.; Araujo, M.B.; Sykes, M.T.; Prentice, I.C. Climate change threats to plant diversity in Europe. Proc. Natl. Acad. Sci. USA 2005, 102, 8245–8250. [Google Scholar] [CrossRef] [PubMed]
- Hubert, J.; Cottrell, J. The Role of Forest Genetic Resources in Helping British Forests; Forestry Commission: Edinburgh, UK, 2007. [Google Scholar]
- Chevin, L.-M.; Lande, R.; Mace, G.M. Adaptation, plasticity, and extinction in a changing environment: Towards a predictive theory. PLoS Biol. 2010, 8, e1000357. [Google Scholar] [CrossRef] [PubMed]
- Santos-del-Blanco, L.; Alía, R.; González-Martínez, S.C.; Sampedro, L.; Lario, F.; Climent, J. Correlated genetic effects on reproduction define a domestication syndrome in a forest tree. Evol. Appl. 2015, 8, 403–410. [Google Scholar] [CrossRef] [PubMed]
- Pallardy, S.G. Physiology of Woody Plants, 3rd ed.; Academic Press: San Diego, CA, USA, 2008; ISBN 978-0-12-088765-1. [Google Scholar]
- Stebbins, G.L. Variation and Evolution in Plants, 2nd ed.; Columbia University Press: New York, NY, USA, 1950; ISBN 0069-6285. [Google Scholar]
- Valladares, F.; Sánchez-Gómez, D. Ecophysiological traits associated with drought in Mediterranean tree seedlings: Individual responses versus interspecific trends in eleven species. Plant Biol. 2006, 8, 688–697. [Google Scholar] [CrossRef] [PubMed]
- Barton, A.M.; Teeri, J.A. The ecology of elevational positions in plants: Drought resistance in five montane pine species in Southeastern Arizona. Am. J. Bot. 1993, 80, 15–25. [Google Scholar] [CrossRef]
- Holt, R.D. The microevolutionary consequences of climate change. Trends Ecol. Evol. 1990, 5, 311–315. [Google Scholar] [CrossRef]
- Jones, H.G. Monitoring plant and soil water status: Established and novel methods revisited and their relevance to studies of drought tolerance. J. Exp. Bot. 2007, 58, 119–130. [Google Scholar] [CrossRef] [PubMed]
- López, R.; Rodríguez-Calcerrada, J.; Gil, L. Physiological and morphological response to water deficit in seedlings of five provenances of Pinus canariensis: Potential to detect variation in drought-tolerance. Trees Struct. Funct. 2009, 23, 509–519. [Google Scholar] [CrossRef]
- Alía, R.; Chambel, R.; Notivol, E.; Climent, J.; González-Martínez, S.C. Environment-dependent microevolution in a Mediterranean pine (Pinus pinaster Aiton). BMC Evol. Biol. 2014, 14, 200. [Google Scholar] [CrossRef] [PubMed]
- Wright, S.J.; Machado, J.L.; Mulkey, S.S.; Smith, A.P. Drought acclimation among tropical forest shrubs (Psychotria, Rubiaceae). Oecologia 1992, 89, 457–463. [Google Scholar] [CrossRef] [PubMed]
- Engelbrecht, B.M.J.; Kursar, T.A. Comparative drought-resistance of seedlings of 28 species of co-occurring tropical woody plants. Oecologia 2003, 136, 383–393. [Google Scholar] [CrossRef] [PubMed]
- Chambel, M.R.; Climent, J.; Alía, R. Divergence among species and populations of Mediterranean pines in biomass allocation of seedlings grown under two watering regimes. Ann. For. Sci. 2007, 64, 87–97. [Google Scholar] [CrossRef]
- Poorter, H.; Bühler, J.; van Dusschoten, D.; Climent, J.; Postma, J.A. Pot size matters: A meta-analysis of the effects of rooting volume on plant growth. Funct. Plant Biol. 2012, 39, 839–850. [Google Scholar] [CrossRef]
- Levy, Y.; Syvertsen, J. Irrigation water quality and salinity effects in citrus trees. In Horticultural Reviews; Janick, J., Ed.; John Wiley & Sons, Inc.: Hoboken, NJ, USA, 2004; Volume 30, pp. 37–82. ISBN 0-471-35420-1. [Google Scholar]
- Farjon, A.; Filer, D. An Atlas of the World’s Conifers: An Analysis of Their Distribution, Biogeography, Diversity and Conservation Status; Brill: Leiden, The Netherlands, 2013; ISBN 978-90-04-21180-3. [Google Scholar]
- Perry, J.P. The Pines of Mexico and Central America; Timber Press, Inc.: Portland, OR, USA, 1991; ISBN 0881921742. [Google Scholar]
- Cambrón-Sandoval, V.H.; Sánchez-Vargas, N.M.; Sáenz-Romero, C.; Vargas-Hernández, J.J.; España-Boquera, M.L.; Herrerías-Diego, Y. Genetic parameters for seedling growth in Pinus pseudostrobus families under different competitive environments. New For. 2012, 44, 219–232. [Google Scholar] [CrossRef]
- Crookston, N.L. Research on Forest Climate Change: Potential Effects of Global Warming on Forests and Plant Climate Relationships in Western North America and Mexico. Available online: http://www.webcitation.org/6uJ6DepQ9 (accessed on 18 October 2017).
- Poorter, H.; Nagel, O. The role of biomass allocation in the growth response of plants to different levels of light, CO2, nutrients and water: A quantitative review. Aust. J. Plant Physiol. 2000, 27, 595–607. [Google Scholar] [CrossRef]
- South, D.; Larsen, H.S. Use of seedling size as a covariate for root growth potential studies. In 5th Biennial Southern Silvicultural Research Conference; USDA Forest Service: Memphis, TN, USA, 1988; pp. 89–93. [Google Scholar]
- Hernández-Pérez, C.; Vargas-Hernández, J.J.; Ramírez-Herrera, C.; Muñoz-Orozco, A. Variación geográfica en la respuesta a la sequía en plántulas de Pinus greggii Engelm. Rev. Cienc. For. México 2001, 26, 61–79. [Google Scholar]
- Pigliucci, M.; Schlichting, C.D. Reaction norms of Arabidopsis. IV. Relationships between plasticity and fitness. Heredity 1996, 76, 427–436. [Google Scholar] [CrossRef] [PubMed]
- Poorter, H.; Niklas, K.J.; Reich, P.B.; Oleksyn, J.; Poot, P.; Mommer, L. Biomass allocation to leaves, stems and roots: Meta-analyses of interspecific variation and environmental control. New Phytol. 2012, 193, 30–50. [Google Scholar] [CrossRef] [PubMed]
- Institute, S.A.S. SAS/GRAPH 9.1 Reference; SAS Institute: Cary, NC, USA, 2004; ISBN 1590471954. [Google Scholar]
- Poorter, L.; Markesteijn, L. Seedling traits determine drought tolerance of tropical tree species. Biotropica 2008, 40, 321–331. [Google Scholar] [CrossRef]
- Schlichting, C.D. Hidden reaction norms, cryptic variation and evolvability. Ann. N. Y. Acad. Sci. 2008, 1133, 187–203. [Google Scholar] [CrossRef] [PubMed]
- Zas, R.; Cendán, C.; Sampedro, L. Mediation of seed provisioning in the transmission of environmental maternal effects in Maritime pine (Pinus pinaster Aiton). Heredity 2013, 111, 248–255. [Google Scholar] [CrossRef] [PubMed]
- Sáenz-Romero, C.; Rehfeldt, G.E.; Soto-Correa, J.C.; Aguilar-Aguilar, S.; Zamarripa-Morales, V.; López-Upton, J. Altitudinal genetic variation among Pinus pseudostrobus populations from Michoacán, México. Two location shadehouse test results. Rev. Fitotec. Mex. 2012, 35, 111–120. [Google Scholar]
- Niinemets, Ü. Components of leaf dry mass per area—Thickness and density—Alter leaf photosynthetic capacity in reverse directions in woody plants. New Phytol. 1999, 144, 35–47. [Google Scholar] [CrossRef]
- Climent, J.M.; Aranda, I.; Alonso, J.; Pardos, J.A.; Gil, L. Developmental constraints limit the response of Canary Island pine seedlings to combined shade and drought. For. Ecol. Manag. 2006, 231, 164–168. [Google Scholar] [CrossRef]
- Baquedano, F.J.; Castillo, F.J. Comparative ecophysiological effects of drought on seedlings of the Mediterranean water-saver Pinus halepensis and water-spenders Quercus coccifera and Quercus ilex. Trees Struct. Funct. 2006, 20, 689–700. [Google Scholar] [CrossRef]
- Reich, P.B.; Wright, I.J.; Cavender-Bares, J.; Craine, J.M.; Oleksyn, J.; Westoby, M.; Walters, M.B. The evolution of plant functional variation: Traits, spectra, and strategies. Int. J. Plant Sci. 2003, 164, S143–S164. [Google Scholar] [CrossRef]
- Cregg, B.M. Carbon allocation, gas exchange, and needle morphology of Pinus ponderosa genotypes known to differ in growth and survival under imposed drought. Tree Physiol. 1994, 14, 883–898. [Google Scholar] [CrossRef] [PubMed]
- Leimu, R.; Fischer, M. A meta-analysis of local adaptation in plants. PLoS ONE 2008, 3, e4010. [Google Scholar] [CrossRef] [PubMed]
- Bansal, S.; Harrington, C.A.; Gould, P.J.; St.Clair, J.B. Climate-related genetic variation in drought-resistance of Douglas-fir (Pseudotsuga menziesii). Glob. Chang. Biol. 2015, 21, 947–958. [Google Scholar] [CrossRef] [PubMed]
- Warwell, M.V.; Shaw, R.G. Climate-related genetic variation in a threatened tree species, Pinus albicaulis. Am. J. Bot. 2017, 104, 1205–1218. [Google Scholar] [CrossRef]
- Greaves, A. Review of the Pinus caribaea Mor. and Pinus oocarpa Schiede International Provenance; CFI Occasional Papers; University of Oxford: Oxford, UK, 1980. [Google Scholar]
- Sáenz-Romero, C.; Guzmán-Reyna, R.R.; Rehfeldt, G.E. Altitudinal genetic variation among Pinus oocarpa populations in Michoacán, Mexico. For. Ecol. Manag. 2006, 229, 340–350. [Google Scholar] [CrossRef]
- Salazar-García, J.G.; Vargas-Hernández, J.J.; Jasso-Mata, J.; Molina-Galán, J.D.; Ramírez-Herrera, C.; López-Upton, J. Variación en el patrón de crecimiento en altura de cuatro especies de Pinus en edades tempranas. Madera Bosques 1999, 5, 19–34. [Google Scholar] [CrossRef]
- Sáenz-Romero, C.; Beaulieu, J.; Rehfeldt, G.E. Altitudinal genetic variation among Pinus patula populations from Oaxaca, México, in growth chambers simulating global warming temperatures. Agrociencia 2011, 45, 399–411. [Google Scholar]
- Sáenz-Romero, C.; Ruiz-Talonia, L.F.; Beaulieu, J.; Sánchez-Vargas, N.M.; Rehfeldt, G.E. Genetic variation among Pinus patula populations along an altitudinal gradient. Two environment nursery tests. Rev. Fitotec. Mex. 2011, 34, 19–25. [Google Scholar]
- Lopez-Toledo, L.; Heredia-Hernández, M.; Castellanos-Acuña, D.; Blanco-García, A.; Saénz-Romero, C. Reproductive investment of Pinus pseudostrobus along an altitudinal gradient in Western Mexico: Implications of climate change. New For. 2017, 48, 867. [Google Scholar] [CrossRef]
- Masuka, A.J.; Gumbie, C.M. Susceptibility of Pinus oocarpa to Armillaria root disease in Zimbabwe. J. Appl. Sci. S. Afr. 1998, 4, 43–48. [Google Scholar]
- Poulos, H.M.M.; Berlyn, G.P.P. Variability in needle morphology and water status of Pinus cembroides across an elevational gradient in the Davis Mountains of west Texas, USA. J. Torrey Bot. Soc. 2007, 134, 281–288. [Google Scholar] [CrossRef]
- Viveros-Viveros, H.; Sáenz-Romero, C.; López-Upton, J.; Vargas-Hernández, J.J. Variación genética altitudinal en el crecimiento de plantas de Pinus pseudostrobus Lindl. en campo. Agrociencia 2005, 39, 575–587. [Google Scholar]
- Castellanos-Acuña, D.; Sáenz-Romero, C.; Lindig-Cisneros, R.A.; Sánchez-Vargas, N.M.; Lobbit, P.; Montero-Castro, J.C. Variación altitudinal entre especies y procedencias de Pinus pseudostrobus, P. devoniana y P. leiophylla. Ensayo de vivero. Rev. Chapingo Serie Cienc. For. Ambient. 2013, 19, 399–411. [Google Scholar] [CrossRef]
- Chambel, M.R.; Climent, J.; Alía, R.; Valladares, F. Phenotypic plasticity: A useful framework for understanding adaptation in forest species. Investig. Agrar. Sist. Recur. For. 2005, 14, 334–344. [Google Scholar] [CrossRef]
- McKay, J.K.; Christian, C.E.; Harrison, S.; Rice, K.J. “How local is local?”—A review of practical and conceptual issues in the genetics of restoration. Restor. Ecol. 2005, 13, 432–440. [Google Scholar] [CrossRef]
- IUCN. Afforestation and Reforestation for Climate Change Mitigation: Potentials for Pan-European Action; IUCN Programme Office for Central Europe: Warsaw, Poland, 2004; ISBN 2-8317-0723-4. [Google Scholar]
- Rodriguez-Quilon, I.; Santos-del-Blanco, L.; Serra-Varela, M.J.; Koskela, J.; Gonzalez-Martiınez, S.C.; Alia, R. Capturing neutral and adaptive genetic diversity for conservation in a highly structured tree species. Ecol. Appl. 2016, 26, 2254–2266. [Google Scholar] [CrossRef] [PubMed]
- Nocentini, S.; Buttoud, G.; Ciancio, O.; Corona, P. Managing forests in a changing world: The need for a systemic approach. A review. For. Syst. 2017, 26, 1–15. [Google Scholar] [CrossRef]

 ); and (b) mean of Principal Component 2 for P. pseudostrobus( ).
); and (b) mean of Principal Component 2 for P. pseudostrobus( ).
); and (b) mean of Principal Component 2 for P. pseudostrobus( ).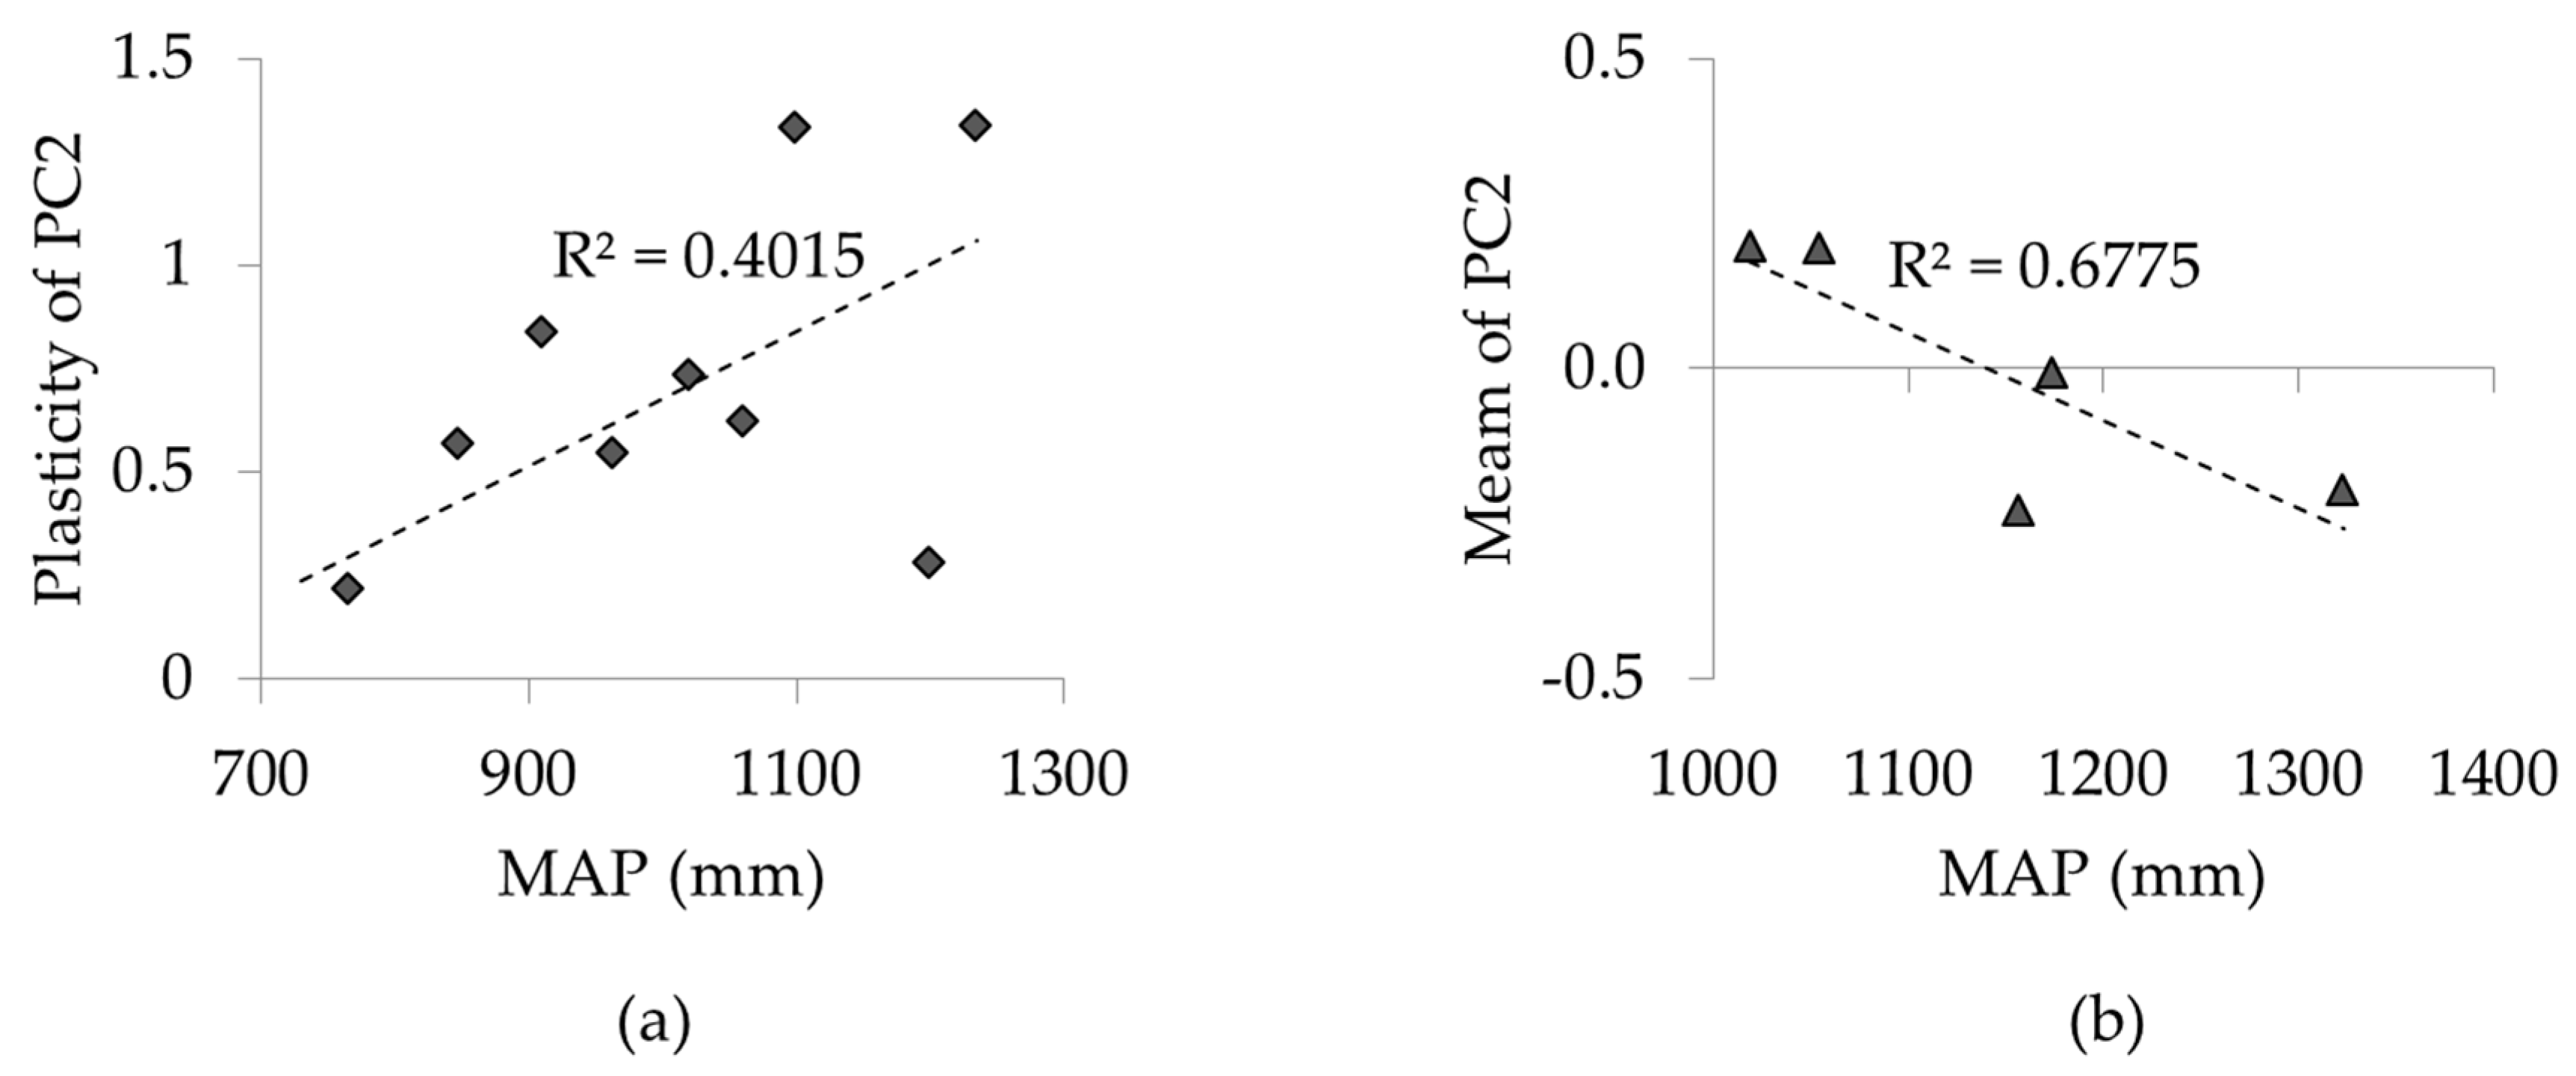
| Code 1 | Population, State | Supplier 2 | Latitude and Longitude | Altitude (m) | MAT 3 (°C) | MAP 4 (mm) |
|---|---|---|---|---|---|---|
| OC01 | Ario de Rosales, Mich. | INIFAP | 19°04′/101°44′ | 1490 | 20.7 | 1112 |
| OC02 | San Ángel Zurumucapio, Mich. | INIFAP | 19°27′/101°54′ | 1700 | 17.0 | 1299 |
| Range 5 | 13.8 to 21.3 | 891 to 1422 | ||||
| PA01 | Casas Blancas, Mich. | Colpos | 19°25′/101°35′ | 2258 | 15.7 | 1060 |
| PA02 | Acaxochitlán, Hgo. | Colpos | 20°06′/98°12′ | 2190 | 13.8 | 962 |
| PA03 | Ahuazotepec, Pue. | Colpos | 20°01′/98°12′ | 2250 | 13.8 | 847 |
| PA04 | Apulco, Hgo. | Colpos | 20°23′/98°22′ | 2200 | 15.2 | 909 |
| PA06 | Huayacocotla, Ver. | Colpos | 20°31′/98°28′ | 2050 | 16.1 | 1099 |
| PA07 | Tlahuelompa, Hgo. | Colpos | 20°37′/98°34′ | 2020 | 16.2 | 1234 |
| PA08 | Tlaxco, Tlax. | Colpos | 19°38′/98°07′ | 2800 | 12.1 | 764 |
| PA09 | Villa Cuauhtémoc, Pue. | Colpos | 19°43′/98°07′ | 2720 | 12.4 | 730 |
| PA11 | Zacualtipán, Hgo. | Colpos | 20°38′/98°38′ | 2030 | 16.1 | 1199 |
| PA12 | Xico, Ver. | Asoc. For. | 19°30′/97°05′ | 2839 | 11.5 | 1019 |
| Range | 11.1 to 17.7 | 615 to 1223 | ||||
| PS01 | Casas Blancas, Mich. | INIFAP | 19°25′/101°36′ | 2244 | 15.7 | 1054 |
| PS02 | Nu. San Juan Parangaricutiro, Mich. | INIFAP | 19°29′/102°19′ | 2245 | 15.2 | 1173 |
| PS03 | Tenango del Valle, Ver. | INIFAP | 19°02′/99°37′ | 2990 | 11.3 | 1156 |
| PS04 | Perote, Ver. | Colpos | 19°33′/97°12′ | 3200 | 9.5 | 1322 |
| PS05 | Xico, Veracruz. | Asoc. For. | 19°30′/97°05′ | 2839 | 11.5 | 1019 |
| Range | 9.0 to 16.9 | 717 to 1415 |
| Trait 2 | W | S | WxS | c | P(S) | B(W) |
|---|---|---|---|---|---|---|
| df | 1 | 2 | 2 | 1 | 14 | 8 |
| HG | 800,680 ** | 174,440 ** | 31,469 ** | - | 13,167 ** | 5394 ** |
| RDM | 588,837 * | 122,126 * | 103,861 ** | 4,820,150 ** | 31,919 ** | 148,087 ** |
| SDM | 1,611,569 ** | 112,624 * | 88,819 ** | 3,649,888 ** | 24,332 ** | 47,780 ** |
| NDM | 1,936,624 ns | 3,957,069 ** | 168,257 ns | 26,807,653 ** | 240,005 ** | 1,031,535 ** |
| TDM | 11,731,955 * | 4,778,621 ** | 936,486 ** | 86,216,460 ** | 461,308 ** | 2,379,984 ** |
| RMF | 0.003 ns | 0.055 * | 0.010 * | 0.022 ** | 0.011 ** | 0.024 ** |
| SMF | 0.214 ** | 0.198 ** | 0.025 ** | 0.020 ** | 0.013 ** | 0.007 ** |
| NMF | 0.167 ** | 0.467 ** | 0.032 ** | 0.086 ** | 0.024 ** | 0.014 ** |
| SLA | 33,146 ** | 72,346 ** | 1693 ns | 33,228 ** | 7498 ** | 3819 ** |
| Trait 2 | W | P | WxP | c | B(W) |
|---|---|---|---|---|---|
| Pinus oocarpa | |||||
| df | 1 | 1 | 1 | 1 | 8 |
| HG | 193,937 ** | 517 ns | 3106 ns | - | 4504 ** |
| RDM | 411,344 ns | 122,364 * | 71,980 ns | 1,543,789 ** | 92,363 ** |
| SDM | 515,777 * | 122,994 ** | 164,325 ** | 1,506,868 ** | 66,208 ** |
| NDM | 1,218,092 ns | 385,868 ns | 601,087 * | 5,944,773 ** | 574,158 ** |
| TDM | 6,067,398 ns | 1,747,874 * | 2,099,484 ** | 24,086,763 ** | 1,575,038 ** |
| RMF | 0.008 ns | 0.001 ns | 0.004 ns | 0.001 ns | 0.010 ns |
| SMF | 0.012 ns | 0.002 ns | 0.005 ns | 0.007 * | 0.003 * |
| NMF | 0.040 * | 0.005 ns | 0.000 ns | 0.013 ns | 0.005 ns |
| SLA | 2.156 ns | 4 ns | 19 ns | 2077 ns | 502 ns |
| P. patula | |||||
| df | 1 | 9 | 9 | 1 | 8 |
| HG | 736,102 ** | 3460 ** | 5617 ** | - | 2882 * |
| RDM | 329,833 ns | 10,358 ns | 16,031 * | 1,319,554 ** | 94,360 ** |
| SDM | 1,239,102 ** | 14,035 ** | 16,812 ** | 691,007 ** | 16,274 ** |
| NDM | 584,235 ns | 85,401 ** | 61,937 ns | 9,253,456 ** | 436,834 ** |
| TDM | 6,153,728 * | 214,427 * | 225,448 ** | 25,668,546 ** | 1,086,400 ** |
| RMF | 0.006 ns | 0.003 ns | 0.002 ns | 0.007 ns | 0.019 ** |
| SMF | 0.372 ** | 0.004 * | 0.003 ns | 0.001 ns | 0.007 ** |
| NMF | 0.280 ** | 0.004 ns | 0.003 ns | 0.003 ns | 0.016 ** |
| SLA | 178,790 ** | 2949 ** | 676 ns | 39,736 ** | 4007 ** |
| P. pseudostrobus | |||||
| df | 1 | 4 | 4 | 1 | 8 |
| HG | 173,685 ** | 34,691 ** | 3742 * | - | 3135 * |
| RDM | 25,352 ns | 75,630 ** | 18,592 ns | 1,940,741 ** | 18,583 ns |
| SDM | 272,247 ** | 4556 ns | 12,154 ns | 1,109122 ** | 18,678 ** |
| NDM | 486,907 ns | 665,570 ** | 175,298 ns | 11,061,214 ** | 353,560 ** |
| TDM | 1,872,890 ns | 924,259 ** | 304,728 ns | 33,341,014 ** | 665,116 ** |
| RMF | 0.023 ns | 0.035 ** | 0.007 * | 0.054 ** | 0.006 ** |
| SMF | 0.075 ** | 0.022 ** | 0.006 * | 0.037 ** | 0.003 ns |
| NMF | 0.013 ns | 0.057 ** | 0.008 ns | 0.180 ** | 0.006 ns |
| SLA | 64,286 ** | 11,042 ** | 2603 * | 345 ns | 1286 ns |
| Trait 1 | P. oocarpa | P. patula | P. pseudostrobus |
|---|---|---|---|
| HG | 73.74 | 57.60 | 60.08 |
| SDM | 43.03 | 48.94 | 35.04 |
| TDM | - | 24.11 | - |
| SMF | - | 32.60 | 26.88 |
| NMF | −7.74 | −10.09 | - |
| SLA | - | 20.30 | 19.92 |
© 2018 by the authors. Licensee MDPI, Basel, Switzerland. This article is an open access article distributed under the terms and conditions of the Creative Commons Attribution (CC BY) license (http://creativecommons.org/licenses/by/4.0/).
Share and Cite
Flores, A.; Climent, J.; Pando, V.; López-Upton, J.; Alía, R. Intraspecific Variation in Pines from the Trans-Mexican Volcanic Belt Grown under Two Watering Regimes: Implications for Management of Genetic Resources. Forests 2018, 9, 71. https://doi.org/10.3390/f9020071
Flores A, Climent J, Pando V, López-Upton J, Alía R. Intraspecific Variation in Pines from the Trans-Mexican Volcanic Belt Grown under Two Watering Regimes: Implications for Management of Genetic Resources. Forests. 2018; 9(2):71. https://doi.org/10.3390/f9020071
Chicago/Turabian StyleFlores, Andrés, José Climent, Valentín Pando, Javier López-Upton, and Ricardo Alía. 2018. "Intraspecific Variation in Pines from the Trans-Mexican Volcanic Belt Grown under Two Watering Regimes: Implications for Management of Genetic Resources" Forests 9, no. 2: 71. https://doi.org/10.3390/f9020071