Disturbance Alters the Relative Importance of Topographic and Biogeochemical Controls on Microbial Activity in Temperate Montane Forests


Abstract
:1. Introduction
2. Materials and Methods
2.1. Verification of Cause of Mortality
2.2. Establishment of Study Plots
2.3. Soil Efflux Measurements
2.4. Soil Sampling, Moisture, and Biogeochemical Analysis
2.5. Potential Exoenzyme Activity
2.6. Terrain Analysis
2.7. Statistical Analyses
3. Results
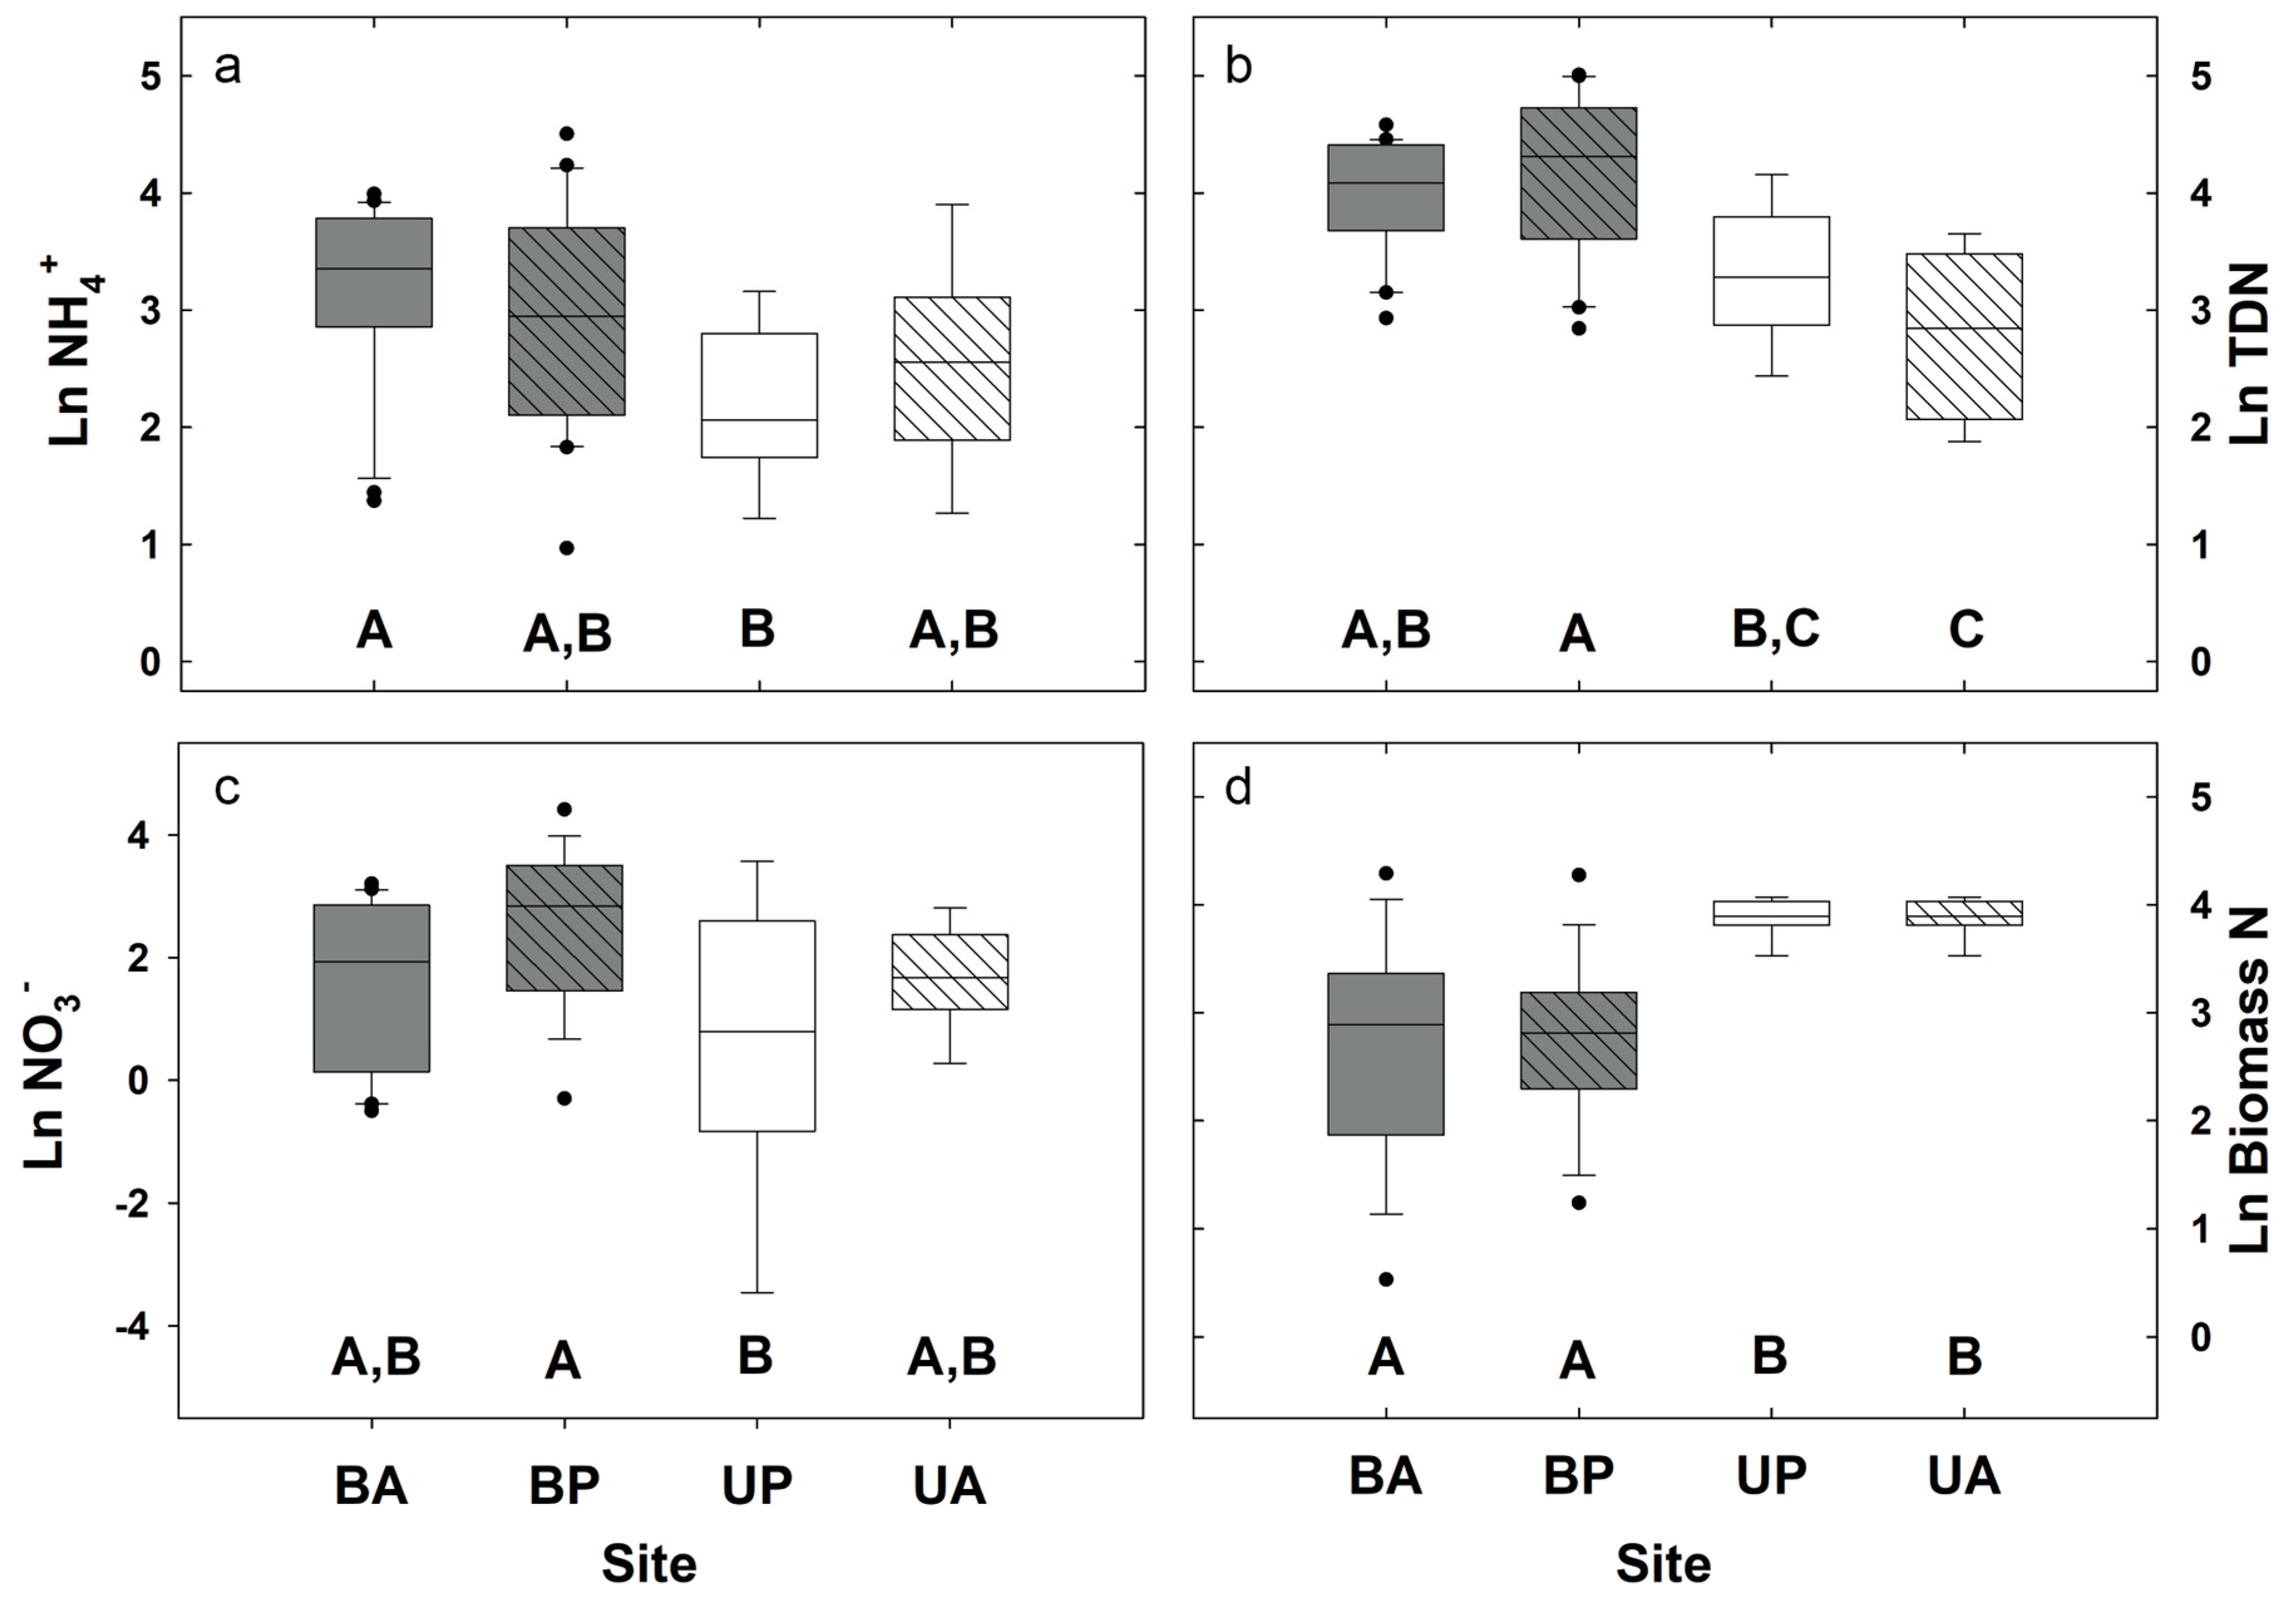
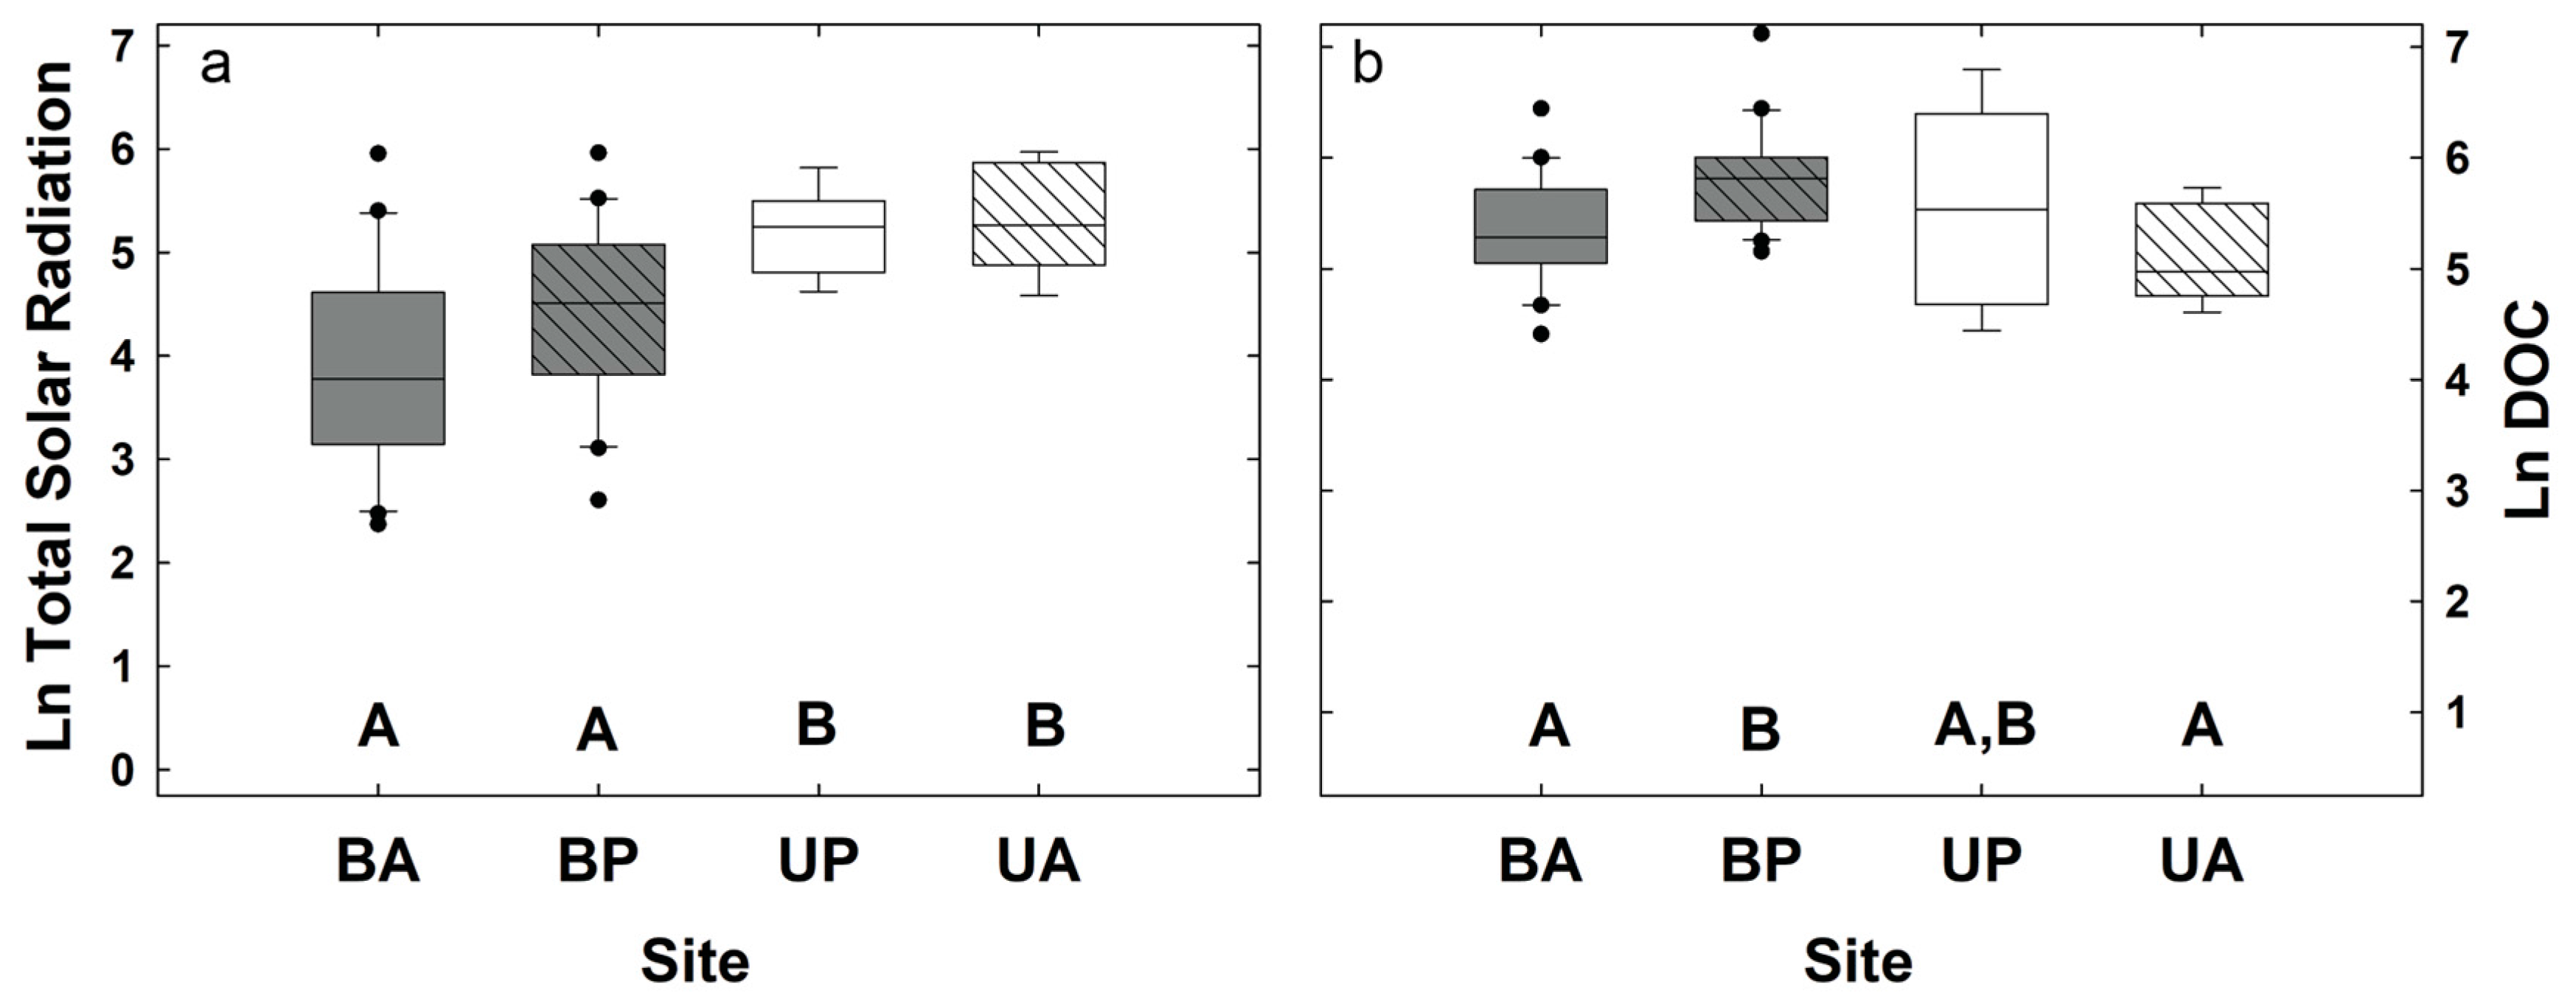
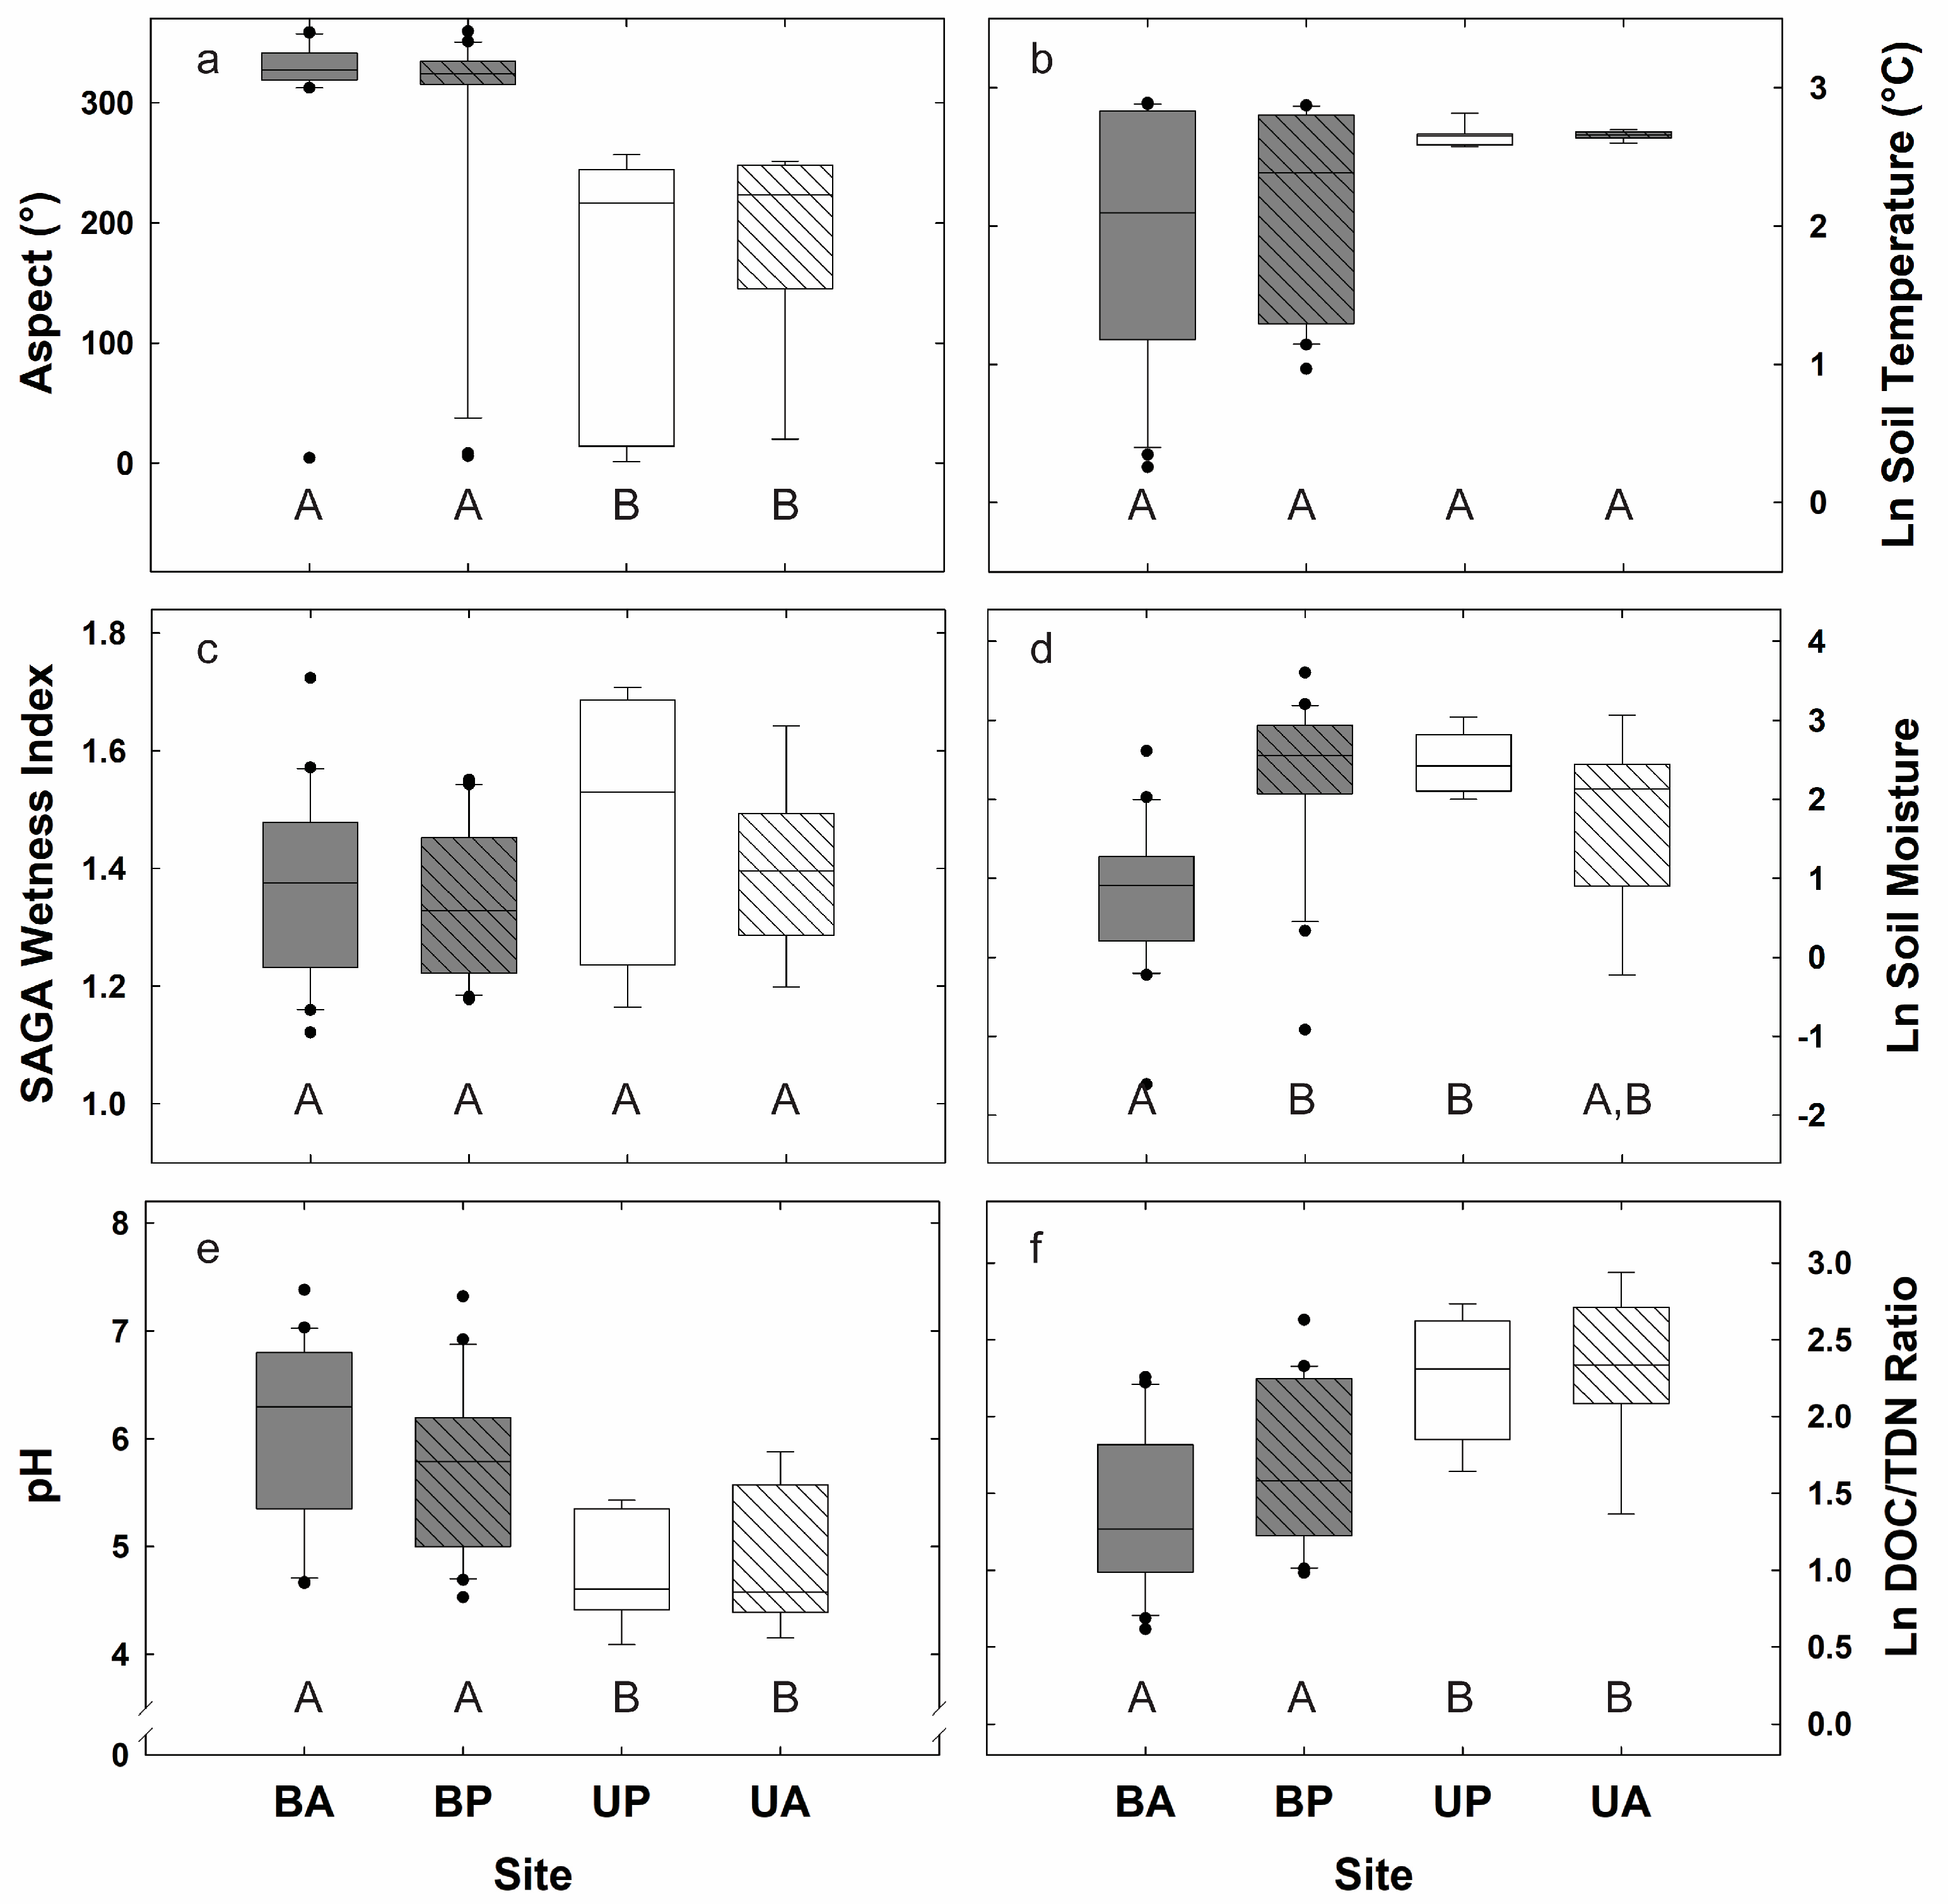
3.1. Biogeochemical and Topographic Relationships by Disturbance Type
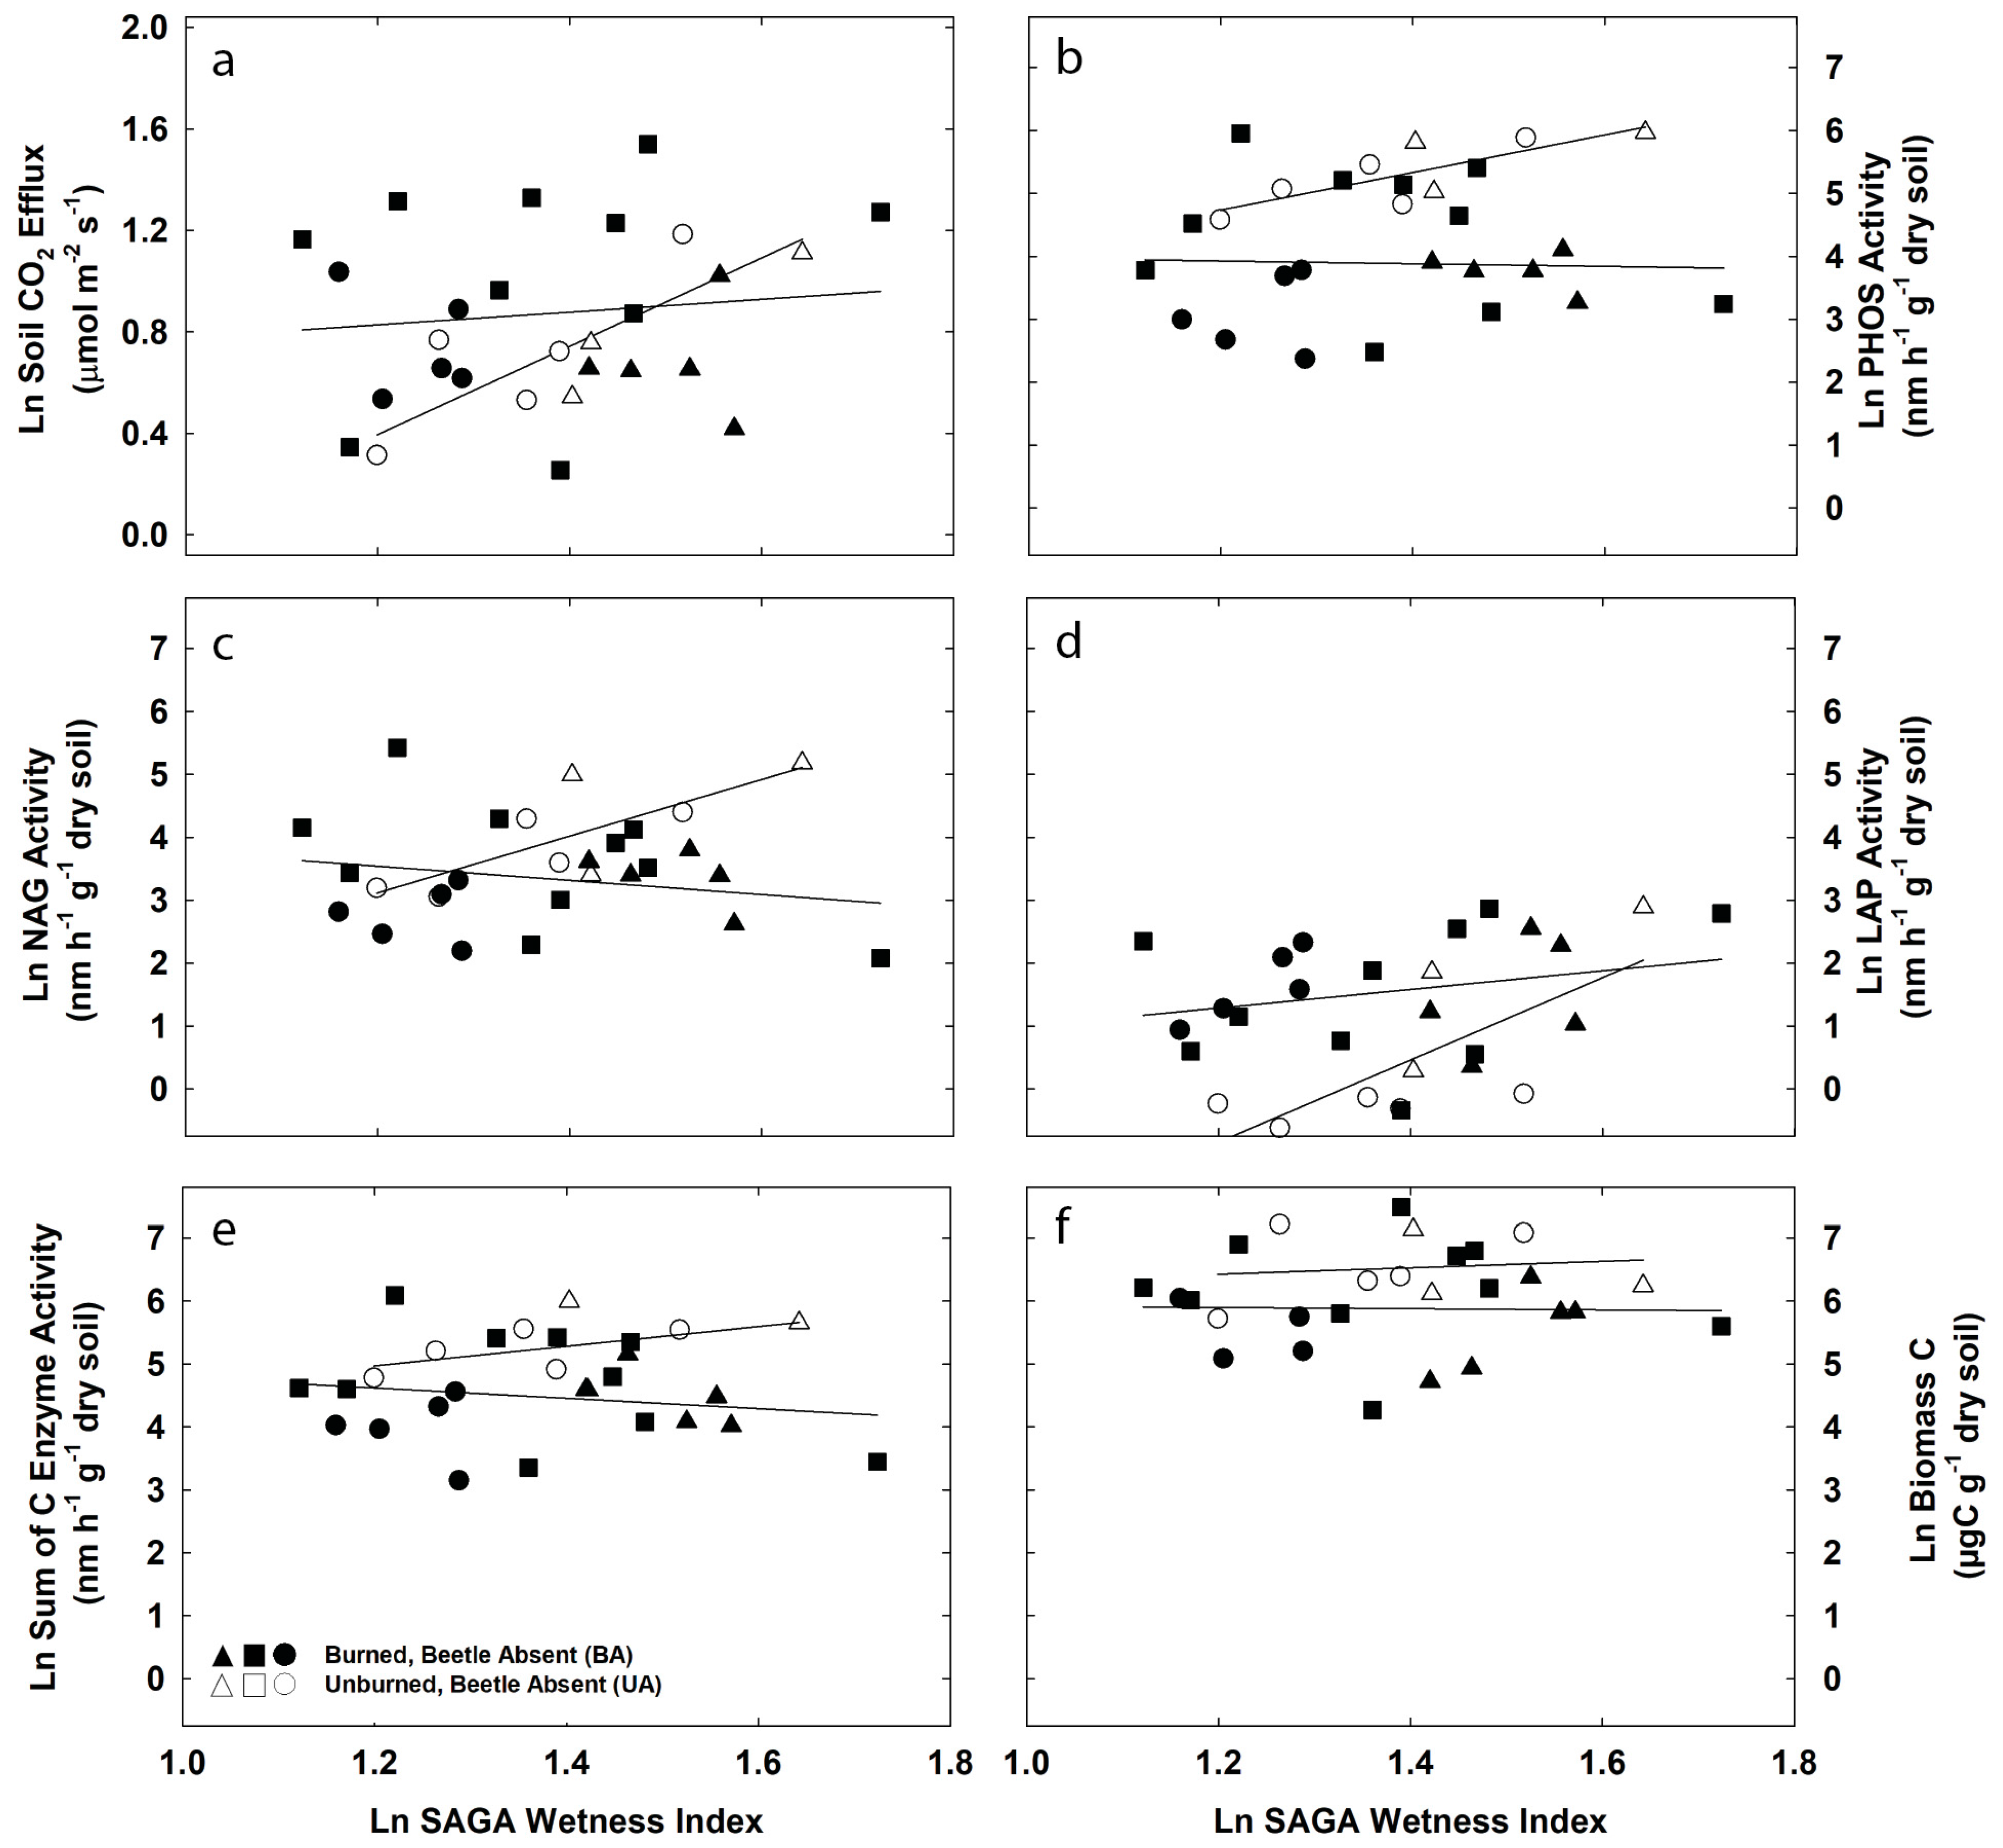
3.2. Topographic Controls on Soil CO2 Efflux and Potential Exoenzyme Activity
3.3. Potential Exoenzyme Activities in Fire-Disturbed Landscapes
4. Discussion
5. Conclusions
Acknowledgments
Author Contributions
Conflicts of Interest
Abbreviations
| α-Glucosidase (AG) | AG |
| β-Glucosidase (BG) | BG |
| carbon | C |
| β-d-cellubiosidase | CB |
| carbon dioxide | CO2 |
| centimeter | cm |
| diameter at breast height | dbh |
| dissolved organic nitrogen | DIN |
| dissolved organic carbon | DOC |
| dissolved organic nitrogen | DON |
| digital terrain models | DYM |
| exoenzyme activity | EEA |
| grams | g |
| infa-red gas analyzers | IRGA |
| Potassium sulphate | K2SO4 |
| kilometers squared | km2 |
| leucine aminopeptidase | LAP |
| Lory State Park and Buckhorn | LSP |
| meters | m |
| molar | M |
| mountain pine beetle | MBP |
| million hectares | Mha |
| microbial biomass carbon | MBC |
| microbial biomass nitrogen | MBN |
| millimeter | mm |
| 4-methylumbelliferone | MUB |
| 7-amino-4methylcoumarin | MUC |
| Nitrogen | N |
| N-acetyl-β-Glucosaminidase | NAG |
| ammonium | NH4+ |
| nanometer | nm |
| nitrate | NO3− |
| Net Primary Productivity | NPP |
| Phosphorus | P |
| Phosphatase | PHOS |
| phosphate | PO43 |
| System for Automated Geoscientific Analyses | SAGA |
| stream power index | SPI |
| soil organic carbin | SOC |
| soil organic matter | SOM |
| Stove Prairie Ranch | SPR |
| total dissolved nitrogen | TDN |
| United Methodist Camp | UMC |
| United States Forest Service | USFS |
| year of death | YOD |
| β-Xylosidase | XYL |
Appendix A

References
- Pacala, S.W.; Hurtt, G.C.; Baker, D.; Peylin, P.; Houghton, R.A.; Birdsey, R.A.; Heath, L.; Sundquist, E.T.; Stallard, R.F.; Ciais, P.; et al. Consistent Land- and Atmosphere-Based U.S. Carbon Sink Estimates. Science 2001, 292. [Google Scholar] [CrossRef] [PubMed]
- Lorenz, K.; Lal, R. Carbon Sequestration in Forest Ecosystems, 1st ed.; Springer: Dordrecht, The Netherlands; Heidelberg, Germany; London, UK; New York, NY, USA, 2010; pp. 1–277. ISBN 978-90-481-3265-2. [Google Scholar]
- Kautz, M.; Meddens, A.J.; Hall, R.J.; Arneth, A. Biotic disturbances in Northern Hemisphere forests—A synthesis of recent data, uncertainties and implications for forest monitoring and modelling. Glob. Ecol. Biogeogr. 2017, 26, 533–552. [Google Scholar] [CrossRef]
- Seidl, R.; Thom, D.; Kautz, M.; Martin-Benito, D.; Peltoniemi, M.; Vacchiano, G.; Wild, J.; Ascoli, D.; Petr, M.; Honkaniemi, J.; et al. Forest disturbances under climate change. Nat. Clim. Chang. 2017, 7, 395–402. [Google Scholar] [CrossRef] [PubMed]
- Westerling, A.L.; Hidalgo, H.G.; Cayan, D.R.; Swetnam, T.W. Warming and Earlier Spring Increase Western U.S. Forest Wildfire Activity. Science 2006, 313, 940–943. [Google Scholar] [CrossRef] [PubMed]
- Dillon, G.K.; Holden, Z.A.; Morgan, P.; Crimmins, M.A.; Heyerdahl, E.K.; Luce, C.H. Both topography and climate affected forest and woodland burn severity in two regions of the western US, 1984 to 2006. Ecosphere 2011, 2, 1–33. [Google Scholar] [CrossRef]
- Meddens, A.J.H.; Hicke, J.A.; Ferguson, C.A. Spatiotemporal patterns of observed bark beetle-caused tree mortality in British Columbia and the western United States. Ecol. Appl. 2012, 22, 1876–1891. [Google Scholar] [CrossRef] [PubMed]
- Brouillard, B.M.; Mikkelson, K.M.; Bokman, C.M.; Berryman, E.M.; Sharp, J.O. Extent of localized tree mortality influences soil biogeochemical response in a beetle-infested coniferous forest. Soil Biol. Biochem. 2017, 114, 309–318. [Google Scholar] [CrossRef]
- Mikkelson, K.M.; Dickenson, E.R.V.; Maxwell, R.M.; McCray, J.E.; Sharp, J.O. Water-quality impacts from climate-induced forest die-off. Nat. Clim. Chang. 2013, 3, 218–222. [Google Scholar] [CrossRef]
- Mikkelson, K.M.; Bearup, L.A.; Maxwell, R.M.; Stednick, J.D.; McCray, J.E.; Sharp, J.O. Bark beetle infestation impacts on nutrient cycling, water quality and interdependent hydrological effects. Biogeochemistry 2013, 115, 1–21. [Google Scholar] [CrossRef]
- Kana, J.; Tahovska, K.; Kopacek, J. Response of soil chemistry to forest dieback after bark beetle infestation. Biogeochemistry 2013, 113, 369–383. [Google Scholar] [CrossRef]
- Xiong, Y.; D’Atri, J.J.; Fu, S.; Xia, H.; Seastedt, T.R. Rapid soil organic matter loss from forest dieback in a subalpine coniferous ecosystem. Soil Biol. Biochem. 2011, 43, 2450–2456. [Google Scholar] [CrossRef]
- Van Miegroet, H.; Olsson, M. Ecosystem Disturbance and Soil Organic Carbon—A Review. In Soil Carbon in Sensitive European Ecosystems: From Science to Land Management; Jandl, R., Rodeghiero, M., Olsson, M., Eds.; John Wiley & Sons, Ltd.: Chichester, UK, 0255. [Google Scholar] [CrossRef]
- Woodall, C.W.; Domke, G.M.; Riley, K.L.; Oswalt, C.M.; Crocker, S.J.; Yohe, G.W. A Framework for Assessing Global Change Risks to Forest Carbon Stocks in the United States. PLoS ONE 2013, 8, e73222. [Google Scholar] [CrossRef] [PubMed]
- Seidl, R.; Schelhaas, M.-J.; Lexer, M.J. Unraveling the drivers of intensifying forest disturbance regimes in Europe. Glob. Chang. Biol. 2011, 17, 2842–2852. [Google Scholar] [CrossRef]
- Tardy, Y.; Bocquier, G.; Paquet, H.; Millot, G. Formation of clay from granite and its distribution in relation to climate and topography. Geoderma 1973, 10, 271–284. [Google Scholar] [CrossRef]
- Caon, L.; Vallejo, V.R.; Ritsema, C.J.; Geissen, V. Effects of wildfire on soil nutrients in Mediterranean ecosystems. Earth-Sci. Rev. 2014, 139, 47–58. [Google Scholar] [CrossRef]
- Rothermel, R.C. How to Predict the Spread and Intensity of Forest and Range Fires; USDA Forest Service, Intermountain Forest and Range Experiment Station General Technical Report 1983, INT-GTR-143; USDA: Washington, DC, USA, 1983.
- Taylor, A.H.; Skinner, C.N. Spatial patterns and controls on historical fire regimes and forest structure in the Klamath Mountains. Ecol. Appl. 2003, 13, 704–719. [Google Scholar] [CrossRef]
- Bigio, E.R.; Swetnam, T.W.; Baisan, C.H. Local-scale and regional climate controls on historical fire regimes in the San Juan Mountains, Colorado. For. Ecol. Manag. 2016, 360, 311–322. [Google Scholar] [CrossRef]
- Nave, L.E.; Vance, E.D.; Swanston, C.W.; Curtis, P.S. Fire effects on temperate forest soil C and N storage. Ecol. Appl. 2011, 21, 1189–1201. [Google Scholar] [CrossRef] [PubMed]
- Guenon, R.; Vennetier, M.; Dupuy, N.; Roussos, S.; Pailler, A.; Gros, R. Trends in recovery of Mediterranean soil chemical properties and microbial activities after infrequent and frequent wildfires. Land Degrad. Dev. 2013, 24, 115–128. [Google Scholar] [CrossRef]
- Certini, G. Effects of fire on properties of forest soils: A review. Oecologia 2005, 143, 1–10. [Google Scholar] [CrossRef] [PubMed]
- Docherty, K.M.; Balser, T.C.; Bohannan, B.J.M.; Gutknecht, J.L.M. Soil microbial responses to fire and interacting global change factors in a California annual grassland. Biogeochemistry 2012, 109, 63–83. [Google Scholar] [CrossRef]
- Ekinci, H.; Kavdir, Y. Changes in soil quality parameters after a wildfire in Gelibolu (Gallipoli) National Park, Turkey. Fresenius Environ. Bull. 2005, 14, 84–91. [Google Scholar]
- Lasanta, A.; Cerda, A. Long-term erosional responses after fire in the Central Spanish Pyrenees: Solute release. Catena 2005, 60, 80–101. [Google Scholar] [CrossRef]
- Santin, C.; Knicker, H.; Fernandez, S.; Menendez-Duarte, R.; Alvarez, M. Wildfires influence on soil organic matter in an Atlantic mountainous region (NW of Spain). Catena 2008, 74, 286–295. [Google Scholar] [CrossRef]
- Turner, M.G.; Smithwick, E.A.H.; Metzger, K.L.; Tinker, D.B.; Romme, W.H. Inorganic nitrogen availability after severe stand-replacing fire in the Greater Yellowstone ecosystem. Proc. Natl. Acad. Sci. USA 2007, 104, 4782–4789. [Google Scholar] [CrossRef] [PubMed]
- Heckman, K.; Campbell, J.; Powers, H.; Law, B.; Swanston, C. The influence of fire on the radiocarbon signature and character of soil organic matter in the Siskiyou National Forest, Oregon, USA. Fire Ecol. 2013, 9, 40–56. [Google Scholar] [CrossRef]
- Iniguez, J.M.; Swetnam, T.W.; Yool, S.R. Topography affected landscape fire history patterns in southern Arizona, USA. For. Ecol. Manag. 2008, 256, 295–303. [Google Scholar] [CrossRef]
- Moore, D.J.P.; Trahan, N.A.; Wiles, P.; Quaife, T.; Stephens, B.B.; Elder, K.; Desai, A.R.; Negron, J.; Monson, R.K. Persistent reduced ecosystem respiration after insect disturbance in high elevation forests. Ecol. Lett. 2013, 16, 731–737. [Google Scholar] [CrossRef] [PubMed]
- Trahan, N.A.; Dynes, E.L.; Pugh, E.; Moore, D.J.; Monson, R.K. Changes in soil biogeochemistry following disturbance by girdling and mountain pine beetles in subalpine forests. Oecologia 2015, 177, 981–995. [Google Scholar] [CrossRef] [PubMed]
- Clow, D.W.; Rhoades, C.; Briggs, J.; Caldwell, M.; Lewis, W.M. Responses of soil and water chemistry to mountain pine beetle induced tree mortality in Grand County, Colorado, USA. Appl. Geochem. 2011, 26, S174–S178. [Google Scholar] [CrossRef]
- Stursova, M.S.; Snajdr, J.; Cajthaml, T.; Barta, J.; Santruckova, H.S.; Baldrian, P. When the forest dies: The response of forest soil fungi to a bark beetle-induced tree dieback. ISME J. 2014, 8, 1920–1931. [Google Scholar] [CrossRef] [PubMed]
- Cullings, K.W.; New, M.H.; Makhija, S.; Parker, V.T. Effects of litter addition on ectomycorrhizal associates of a lodgepole pine (Pinus contorta) stand in Yellowstone National Park. Appl. Environ. Microbiol. 2003, 69, 3772–3776. [Google Scholar] [CrossRef] [PubMed]
- Morehouse, K.; Johns, T.; Kaye, J.; Kaye, M. Carbon and nitrogen cycling immediately following bark beetle outbreaks in southwestern ponderosa pine forests. For. Ecol. Manag. 2008, 255, 2698–2708. [Google Scholar] [CrossRef]
- Zimmermann, L.; Moritz, K.; Kennel, M.; Bittersohl, J. Influence of bark beetle infestation on water quantity and quality in the Grosse Ohe catchment (Bavarian Forest Forest National Park). Silva Gabreta 2000, 4, 51–62. [Google Scholar]
- Huber, C.; Baumgarten, M.; Gottlein, A.; Rotter, V. Nitrogen turnover and nitrate leaching after bark beetle attack in mountainous spruce stands of the Bavarian forest national park. Water Air Soil Pollut. Focus 2004, 4, 391–414. [Google Scholar] [CrossRef]
- Huber, C. Long lasting nitrate leaching after bark beetle attack in the high-lands of the Bavarian forest National Park. J. Environ. Qual. 2005, 34, 1772. [Google Scholar] [CrossRef] [PubMed]
- Knelman, J.E.; Graham, E.B.; Trahan, N.A.; Schmidt, S.K.; Nemergut, D.R. Fire severity shapes plant colonization effects on bacterial community structure, microbial biomass, and soil enzyme activity in secondary succession of a burned forest. Soil Biol. Biochem. 2015, 90, 161–168. [Google Scholar] [CrossRef]
- Knelman, J.E.; Graham, E.B.; Ferrenberg, S.; Lecoeuvre, A.; Labrado, A.; Darcy, J.L.; Nemergut, D.R. Rapid Shifts in Soil Nutrients and Decomposition Enzyme Activity in Early Succession Following Forest Fire. Forests 2017, 8, 347. [Google Scholar] [CrossRef]
- Treu, R.; Karst, J.; Randall, M.; Pec, G.J.; Cigan, P.W.; Simard, S.W.; Cooke, J.E.K.; Erbilgin, N.; Cahill, J.F. Decline of ectomycorrhizal fungi following a mountain pine beetle epidemic. Ecology 2014, 95, 1096–1103. [Google Scholar] [CrossRef] [PubMed]
- Beadle, N. Soil temperatures during forest fires and their effect on the survival of vegetation. J. Ecol. 1940, 28, 180–192. [Google Scholar] [CrossRef]
- Bradstock, R.A.; Auld, T.D. Soil temperatures during experimental bushfires in relation to fire intensity: Consequences for legume germination and fire management in south-eastern Australia. J. Appl. Ecol. 1995, 32, 76–84. [Google Scholar] [CrossRef]
- Hart, S.C.; DeLuca, T.H.; Newman, G.S.; MacKenzie, M.D.; Boyle, S.I. Post-fire vegetative dynamics as drivers of microbial community structure and function in forest soils. For. Ecol. Manag. 2005, 220, 166–184. [Google Scholar] [CrossRef]
- Weber, C.F.; Lockhart, J.S.; Charaska, E.; Aho, K.; Lohse, K.A. Bacterial composition of soils in ponderosa pine and mixed conifer forests exposed to different wildfire burn severity. Soil Biol. Biochem. 2014, 69, 242–250. [Google Scholar] [CrossRef]
- Choromanska, U.; DeLuca, T.H. Microbial activity and nitrogen mineralization in forest mineral soils following heating: Evaluation of post-fire effects. Soil Biol. Biochem. 2002, 34, 263–271. [Google Scholar] [CrossRef]
- Dooley, S.R.; Treseder, K.K. The effect of fire on microbial biomass: A meta-analysis of field studies. Biogeochemistry 2012, 109, 49–61. [Google Scholar] [CrossRef]
- Gonzalez-Perez, J.A.; Gonzalez-Vila, F.J.; Almendros, G.; Knicker, H. The effect of fire on soil organic matter—A review. Environ. Int. 2004, 30, 855–870. [Google Scholar] [CrossRef] [PubMed]
- Ferrenberg, S.; Knelman, J.E.; Jones, J.M.; Beals, S.C.; Bowman, W.D.; Nemergut, D.R. Soil bacterial community structure remains stable over a 5-year chronosequence of insect-induced tree mortality. Front. Microbiol. 2014, 5. [Google Scholar] [CrossRef] [PubMed]
- Mitton, J.B.; Ferrenberg, S.M. Mountain pine beetle develops an unprecedented summer generation in response to climate warming. Am. Nat. 2012, 179, E163–E171. [Google Scholar] [CrossRef] [PubMed]
- Buma, B. Disturbance interactions: Characterization, prediction, and the potential for cascading effects. Ecosphere 2015, 6, 1–15. [Google Scholar] [CrossRef]
- Soil Survey Staff, Natural Resources Conservation Service, United States Department of Agriculture. Web Soil Survey. Available online: https://websoilsurvey.sc.egov.usda.gov/ (accessed on 25 July 2017).
- Braddock, W.A.; O’Connor, J.T.; Curtin, G.C. U.S. Geological Survey GQ-1624, Scale 1:24,000; Geological Survey: Reston, VA, USA, 1989.
- Dynes, E.L. An Ecological Assessment of Mountain Pine Beetle (Dendroctonus ponderosae) and Wildfire Disturbance on Carbon Dynamics in Northwestern Colorado. Master’s Thesis, University of Arizona, Tucson, AZ, USA, 2015. [Google Scholar]
- Stokes, M.A.; Smiley, T.L. An Introduction to Tree-Ring Dating; University of Chicago Press: Chicago, IL, USA, 1968; ISBN 0816516804. [Google Scholar]
- Speer, J.H. Fundamentals of Tree Ring Research; The University of Arizona Press, Arizona Board of Regents: Phoenix, AZ, USA, 2010; ISBN 9780816526840. [Google Scholar]
- Holmes, R.L. Computer-assisted quality control in tree-ring dating and measurement. Tree-Ring Bull. 1983, 43, 51–67. [Google Scholar]
- Rinn, F. TSAP-Win: Time Series Analysis and Presentation for Dendrochronology and Related Applications; Frank Rinn: Heidelberg, Germany, 2003. [Google Scholar]
- Grissino-Mayer, H.D. Evaluating crossdating accuracy: A manual and tutorial for the computer program COFECHA. Tree-Ring Res. 2001, 57, 205–221. [Google Scholar]
- Jones, E.L.; Daniels, L.D. Assessment of Dendrochronological Year-of-Death Estimates Using Permanent Sample Plot Data. Tree-Ring Res. 2012, 68, 3–16. [Google Scholar] [CrossRef]
- Zobitz, J.M.; Moore, D.J.P.; Sacks, W.J.; Monson, R.K.; Bowling, D.R.; Schimel, D.S. Integration of process-based soil respiration models with whole-ecosystem CO2 measurements. Ecosystems 2008, 11, 250–269. [Google Scholar] [CrossRef]
- Weintraub, M.N.; Scott-Denton, L.E.; Schmidt, S.K.; Monson, R.K. The effects of tree rhizodeposition on soil exoenzyme activity, dissolved organic carbon, and nutrient availability in a subalpine forest ecosystem. Oecologia 2007, 154, 327–338. [Google Scholar] [CrossRef] [PubMed]
- Brookes, P.C.; Landman, A.; Pruden, G.; Jenkinson, D.S. Chloroform fumigation and the release of soil nitrogen: A rapid direct extraction method to measure microbial biomass nitrogen in soil. Soil Biol. Biochem. 1985, 17, 837–842. [Google Scholar] [CrossRef]
- Vance, E.D.; Brookes, P.C.; Jenkinson, D.S. An extraction method for measuring soil microbial biomass C. Soil Biol. Biochem. 1987, 19, 703–707. [Google Scholar] [CrossRef]
- Beck, T.; Joergensen, R.G.; Kandeler, E.; Makeschin, F.; Nuss, E.; Oberholzer, H.R.; Scheu, S. An inter-laboratory comparison of ten different ways of measuring soil microbial biomass C. Soil Biol. Biochem. 1997, 29, 1023–1032. [Google Scholar] [CrossRef]
- Wallenstein, M.D.; Haddix, M.L.; Lee, D.D.; Conant, R.T.; Paul, E.A. A litter-slurry technique elucidates the key role of enzyme production and microbial dynamics in temperature sensitivity of organic matter decomposition. Soil Biol. Biochem. 2012, 47, 18–26. [Google Scholar] [CrossRef]
- Gebhardt, M.; Fehmi, J.S.; Rasmussen, C.; Gallery, R.E. Soil amendments alter plant biomass and soil microbial activity in a semi-desert grassland. Plant Soil 2017, 419, 53–70. [Google Scholar] [CrossRef]
- German, D.P.; Weintraub, M.N.; Grandy, A.S.; Lauber, C.L.; Rinkes, Z.L.; Allison, S.D. Optimization of hydrolytic and oxidative enzyme methods for ecosystem studies. Soil Biol. Biochem. 2011, 43, 1387–1397. [Google Scholar] [CrossRef]
- Planchon, O.; Darboux, F. A fast, simple and versatile algorithm to fill the depressions of digital elevation models. Catena 2001, 46, 159–176. [Google Scholar] [CrossRef]
- Conrad, O.; Bechtel, B.; Bock, M.; Dietrich, H.; Fischer, E.; Gerlitz, L.; Wehberg, J.; Wichmann, V.; Böhner, J. System for Automated Geoscientific Analyses (SAGA) v. 2.1.4. Geosci. Model Dev. 2015, 8, 1991–2007. [Google Scholar] [CrossRef]
- Seibert, J.; McGlynn, B.L. A new triangular multiple flow direction algorithm for computing upslope areas from gridded digital elevation models. Water Resour. Res. 2007, 43, W04501. [Google Scholar] [CrossRef]
- Quinn, P.F.; Beven, K.J.; Chevallier, P.; Planchon, O. The prediction of hillslope flow paths for distri-buted hydrological modelling using digital terrain models. Hydrol. Processes 1991, 5, 59–79. [Google Scholar] [CrossRef]
- Quinn, P.F.; Beven, K.J.; Lamb, R. The ln(α/tan β) index: How to calculate it and how to use it within the TOPMODEL framework. Hydrol. Processes 1995, 9, 161–182. [Google Scholar] [CrossRef]
- Moore, I.D.; O’Loughlin, E.M.; Burch, G.J. A contour-based topographic model for hydrological and ecological applications. Earth Surf. Processes Landf. 1988, 13, 305320. [Google Scholar] [CrossRef]
- Gruber, S.; Peckham, S. Land-surface parameters and objects in hydrology. In Geomorphometry: Concepts, Software, Applications; Hengl, T., Reuter, H.I., Eds.; Elsevier: Amsterdam, The Netherlands, 2009; pp. 171–194. [Google Scholar]
- Donnegan, J.A.; Rebertus, A.J. Rates and mechanisms of subalpine forest succession along an environmental gradient. Ecology 1999, 80, 1370–1384. [Google Scholar] [CrossRef]
- Stielstra, C.M.; Lohse, K.A.; Chorover, J.; McIntosh, J.C.; Litvak, M.; Baron-Gafford, G.; Barnard, H.; Brooks, P.D. Climatic and Landscape Influences on Soil Moisture are Primary Determinants of Soil Carbon Fluxes in Seasonally Snow covered Forest Ecosystems. Biogeochemistry 2015, 123, 447–465. [Google Scholar] [CrossRef]
- Riveros-Iregui, D.A.; McGlynn, B.L. Landscape structure control on soil CO2 efflux variability in complex terrain: Scaling from point observations to watershed scale fluxes. J. Geophys. Res. 2009, 114, G02010. [Google Scholar] [CrossRef]
- Berryman, E.M.; Barnard, H.R.; Adams, H.R.; Burns, M.A.; Gallo, E.; Brooks, P.D. Complex terrain alters temperature and moisture limitations of forest soil respiration across a semiarid to subalpine gradient. J. Geophys. Res. Biogeosci. 2015, 120, 707–723. [Google Scholar] [CrossRef]
- Raison, R.J.; McGarity, J.W. Some effects of plant ash on the chemical properties of soils and aqueous suspensions. Plant Soil 1980, 55, 339–352. [Google Scholar] [CrossRef]
- Raison, R.J.; Keith, H.; Khanna, P.K. Effects of fire on the nutrient-supplying capacity of forest soils. FRI Bull. 1990, 159, 39–54. [Google Scholar]
- Soto, B.; Diaz-Fierros, F. Interactions between plant ash leachates and soil. Int. J. Wildland Fire 1993, 3, 207–216. [Google Scholar] [CrossRef]
- Ranalli, A.J. A Summary of the Scientific Literature on the Effects of Fire on the Concentration of Nutrients in Surface Waters (No. USGS-2004-1296); Geological Survey: Reston, VA, USA, 2004.
- Sinsabaugh, R.L.; Lauber, C.L.; Weintraub, M.N.; Ahmed, B.; Allison, S.D.; Crenshaw, C.; Gartner, T.B. Stoichiometry of soil enzyme activity at global scale. Ecol. Lett. 2008, 11, 1252–1264. [Google Scholar] [CrossRef] [PubMed]
- Lauber, C.L.; Hamady, M.; Knight, R.; Fierer, N. Pyrosequencing-based assessment of soil pH as a predic-tor of soil bacterial community structure at the continental scale. Appl. Environ. Microbiol. 2009, 75, 5111–5120. [Google Scholar] [CrossRef] [PubMed]
- Docherty, K.M.; Borton, H.M.; Espinosa, N.; Gebhardt, M.; Gil-Loaiza, J.; Gutknecht, J.L.; Gallery, R.E. Key edaphic properties largely explain temporal and geographic variation in soil microbial communities across four biomes. PLoS ONE 2015, 10, e0135352. [Google Scholar] [CrossRef] [PubMed]
- Tavakkoli, E.; Rengasamy, P.; Smith, E.; McDonald, G.K. The effect of cation-anion interactions on soil pH and solubility of organic carbon. Eur. J. Soil Sci. 2015, 66, 1054–1062. [Google Scholar] [CrossRef]
- Weil, R.R.; Brady, N.C. The Nature and Properties of Soils, 15th ed.; Pearson Education: Columbus, OH, USA, 2016; ISBN 978-0133254488. [Google Scholar]
- Simard, D.G.; Fyles, J.W.; Pare´, D.; Nguyen, T. Impacts of clearcut harvesting and wildfire on soil nutrient status in the Quebec boreal forest. Can. J. Soil Sci. 2001, 81, 229–237. [Google Scholar] [CrossRef]
- Griffin, J.M.; Turner, M.G. Changes to the N cycle following bark beetle outbreaks in two contrasting conifer forest types. Oecologia 2012, 170, 551–565. [Google Scholar] [CrossRef] [PubMed]
- Keville, M.P.; Reed, S.C.; Cleveland, C.C. Nitrogen cycling responses to mountain pine beetle disturbance in a high elevation whitebark pine ecosystem. PLoS ONE 2013, 8, e65004. [Google Scholar] [CrossRef] [PubMed]
- Edburg, S.L.; Hicke, J.A.; Lawrence, D.M.; Thornton, P.E. Simulating coupled carbon and nitrogen dynamics following mountain pine beetle outbreaks in the western United States. J. Geophys. Res. Biogeosci. 2011, 116, G04033. [Google Scholar] [CrossRef]
- Maurer, G.E.; Chan, A.M.; Trahan, N.A.; Moore, D.J.; Bowling, D.R. Carbon isotopic composition of forest soil respiration in the decade following bark beetle and stem girdling disturbances in the Rocky Mountains. Plant Cell Environ. 2016, 39, 1513–1523. [Google Scholar] [CrossRef] [PubMed]
- Harvey, B.J.; Donato, D.C.; Turner, M.G. Recent mountain pine beetle outbreaks, wildfire severity, and postfire tree regeneration in the US Northern Rockies. Proc. Natl. Acad. Sci. USA 2014, 42, 15120–15125. [Google Scholar] [CrossRef] [PubMed]
- Seidl, R.; Schelhaas, M.-J.; Rammer, W.; Verkerk, P.J. Increasing forest disturbances in Europe and their impact on carbon storage. Nat. Clim. Chang. 2014, 4, 806–810. [Google Scholar] [CrossRef] [PubMed]
- Schimel, D.; Braswell, B.H. The role of mid-latitude mountains in the carbon cycle: Global perspective and a Western US case study. In Global Change and Mountain Regions; Springer: Dordrecht, The Netherlands, 2005; pp. 449–456. [Google Scholar]
- Schimel, D.; Kittel, T.G.; Running, S.; Monson, R.; Turnipseed, A.; Anderson, D. Carbon sequestration studied in western US mountains. EOS Trans. Am. Geophys. Union 2002, 83, 445–449. [Google Scholar] [CrossRef]
- Kurz, W.A.; Dymond, C.C.; Stinson, G.; Rampley, G.J.; Neilson, E.T.; Carroll, A.L.; Ebata, T.; Safranyik, L. Mountain pine beetle and forest carbon feedback to climate change. Nature 2008, 452, 987–990. [Google Scholar] [CrossRef] [PubMed]
- Raffa, K.F.; Aukema, B.H.; Bentz, B.J.; Carroll, A.L.; Hicke, J.A.; Turner, M.G.; Romme, W.H. Cross-scale drivers of natural disturbances prone to anthropogenic amplification: The dynamics of bark beetle eruptions. Bioscience 2008, 58, 501–517. [Google Scholar] [CrossRef]
- Hicke, J.A.; Allen, C.D.; Desi, A.R.; Deitze, M.C.; Hall, R.J.; Hodd, E.H.; Kashian, D.M.; Moore, D.; Raffa, K.F.; Sturrock, R.N.; et al. Effects of biotic disturbances on forest carbon cycling in the United States and Canada. Glob. Chang. Biol. 2012, 18, 7–34. [Google Scholar] [CrossRef]
- Allen, C.D.; Macalady, A.K.; Chenchouni, H.; Bachelet, D.; McDowell, N.; Vennetier, M.; Kitzberger, T.; Rigling, A.; Breshears, D.D.; Hogg, E.H.; et al. A global overview of drought and heat-induced tree mortality reveals emerging climate change risks for forests. For. Ecol. Manag. 2010, 259, 660–684. [Google Scholar] [CrossRef]
- Running, S.W.; Nemani, R.R.; Heinsch, F.A.; Zhao, M.S.; Reeves, M.; Hashimoto, H. A continuous satellite-derived measure of global terrestrial primary production. Bioscience 2004, 54, 547–560. [Google Scholar] [CrossRef]
- Anderegg, W.R.L.; Klein, T.; Bartlett, M.; Sack, L.; Pellegrini, A.F.A.; Choat, B.; Jansen, S. Meta-analysis reveals that hydraulic traits explain cross-species patterns of drought-induced tree mortality across the globe. Proc. Natl. Acad. Sci. USA 2016, 113, 5024–5029. [Google Scholar] [CrossRef] [PubMed]
- Shao, P.; Zeng, X.; Moore, D.J.; Zeng, X. Soil microbial respiration from observations and Earth System Models. Environ. Res. Lett. 2013, 8, 034034. [Google Scholar] [CrossRef]
- Bosatta, E.; Agren, G.I. Theoretical analysis of decomposition of heterogeneous substrates. Soil Biol. Biochem. 1985, 17, 601–610. [Google Scholar] [CrossRef]
- Allison, S.D. A trait-based approach for modelling microbial litter decomposition. Ecol. Lett. 2012, 15, 1058–1070. [Google Scholar] [CrossRef] [PubMed]
- Wieder, W.R.; Bonan, G.B.; Allison, S.D. Global soil carbon projections are improved by modelling microbial processes. Nat. Clim. Chang. 2013, 3, 909–912. [Google Scholar] [CrossRef]


| Environmental Control | MicrobialFunction | Undisturbed | Fire | Beetles | Fire & Beetles | ||||
|---|---|---|---|---|---|---|---|---|---|
| r2 | p-Value | r2 | p-Value | r2 | p-Value | r2 | p-Value | ||
| Soil CO2 Efflux | 0.68 | 0.01 | 0.01 | 0.64 | 0.05 | 0.58 | 0.03 | 0.49 | |
| SAGA | PHOS Activity | 0.62 | 0.02 | 0.00 | 0.88 | 0.33 | 0.13 | 0.00 | 0.98 |
| Wetness | Sum of C Activity | 0.20 | 0.27 | 0.03 | 0.46 | 0.01 | 0.79 | 0.01 | 0.67 |
| Index | LAP Activity | 0.53 | 0.04 | 0.07 | 0.27 | 0.50 | 0.05 | 0.04 | 0.39 |
| NAG Activity | 0.58 | 0.03 | 0.05 | 0.36 | 0.14 | 0.36 | 0.00 | 0.97 | |
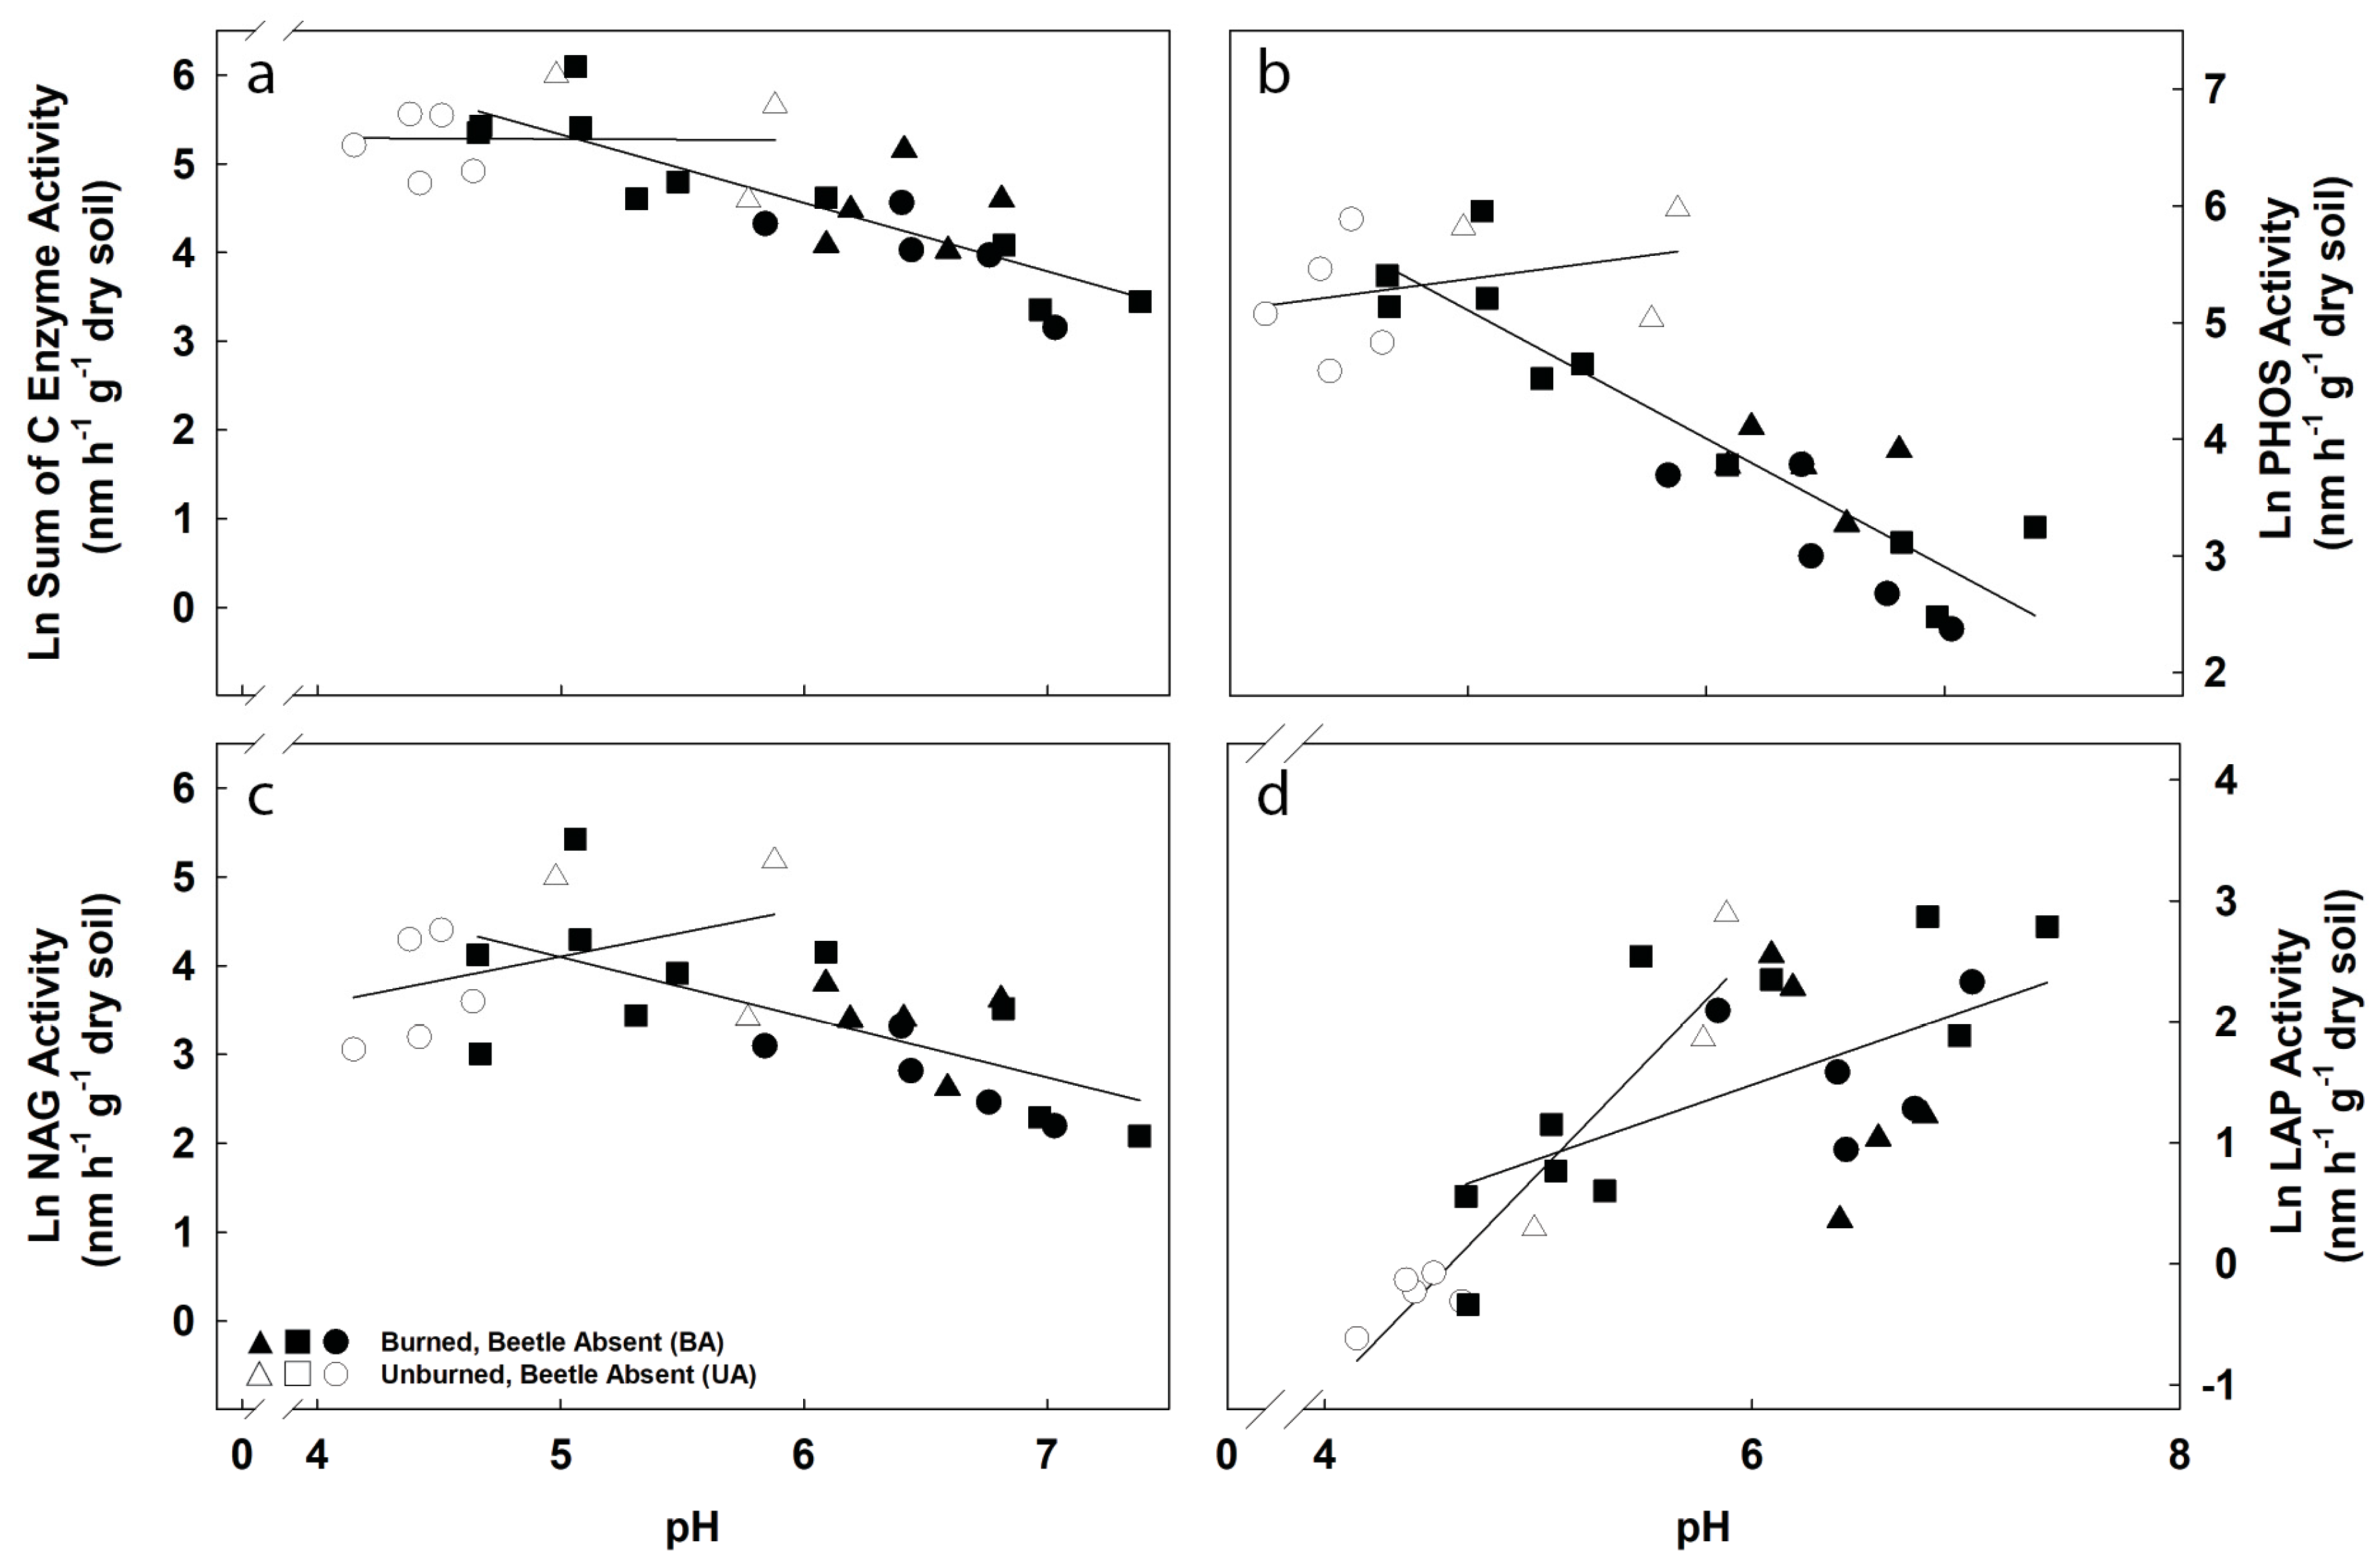
| Soil CO2 Efflux | 0.13 | 0.38 | 0.04 | 0.39 | 0.26 | 0.20 | 0.00 | 0.80 | |
| PHOS Activity | 0.11 | 0.42 | 0.80 | <0.01 | 0.18 | 0.27 | 0.11 | 0.15 | |
| pH | Sum of C Activity | 0.00 | 0.97 | 0.69 | <0.01 | 0.11 | 0.41 | 0.02 | 0.52 |
| LAP Activity | 0.92 | <0.01 | 0.30 | 0.01 | 0.64 | 0.02 | 0.76 | <0.01 | |
| NAG Activity | 0.19 | 0.29 | 0.45 | <0.01 | 0.05 | 0.59 | 0.00 | 0.93 | |
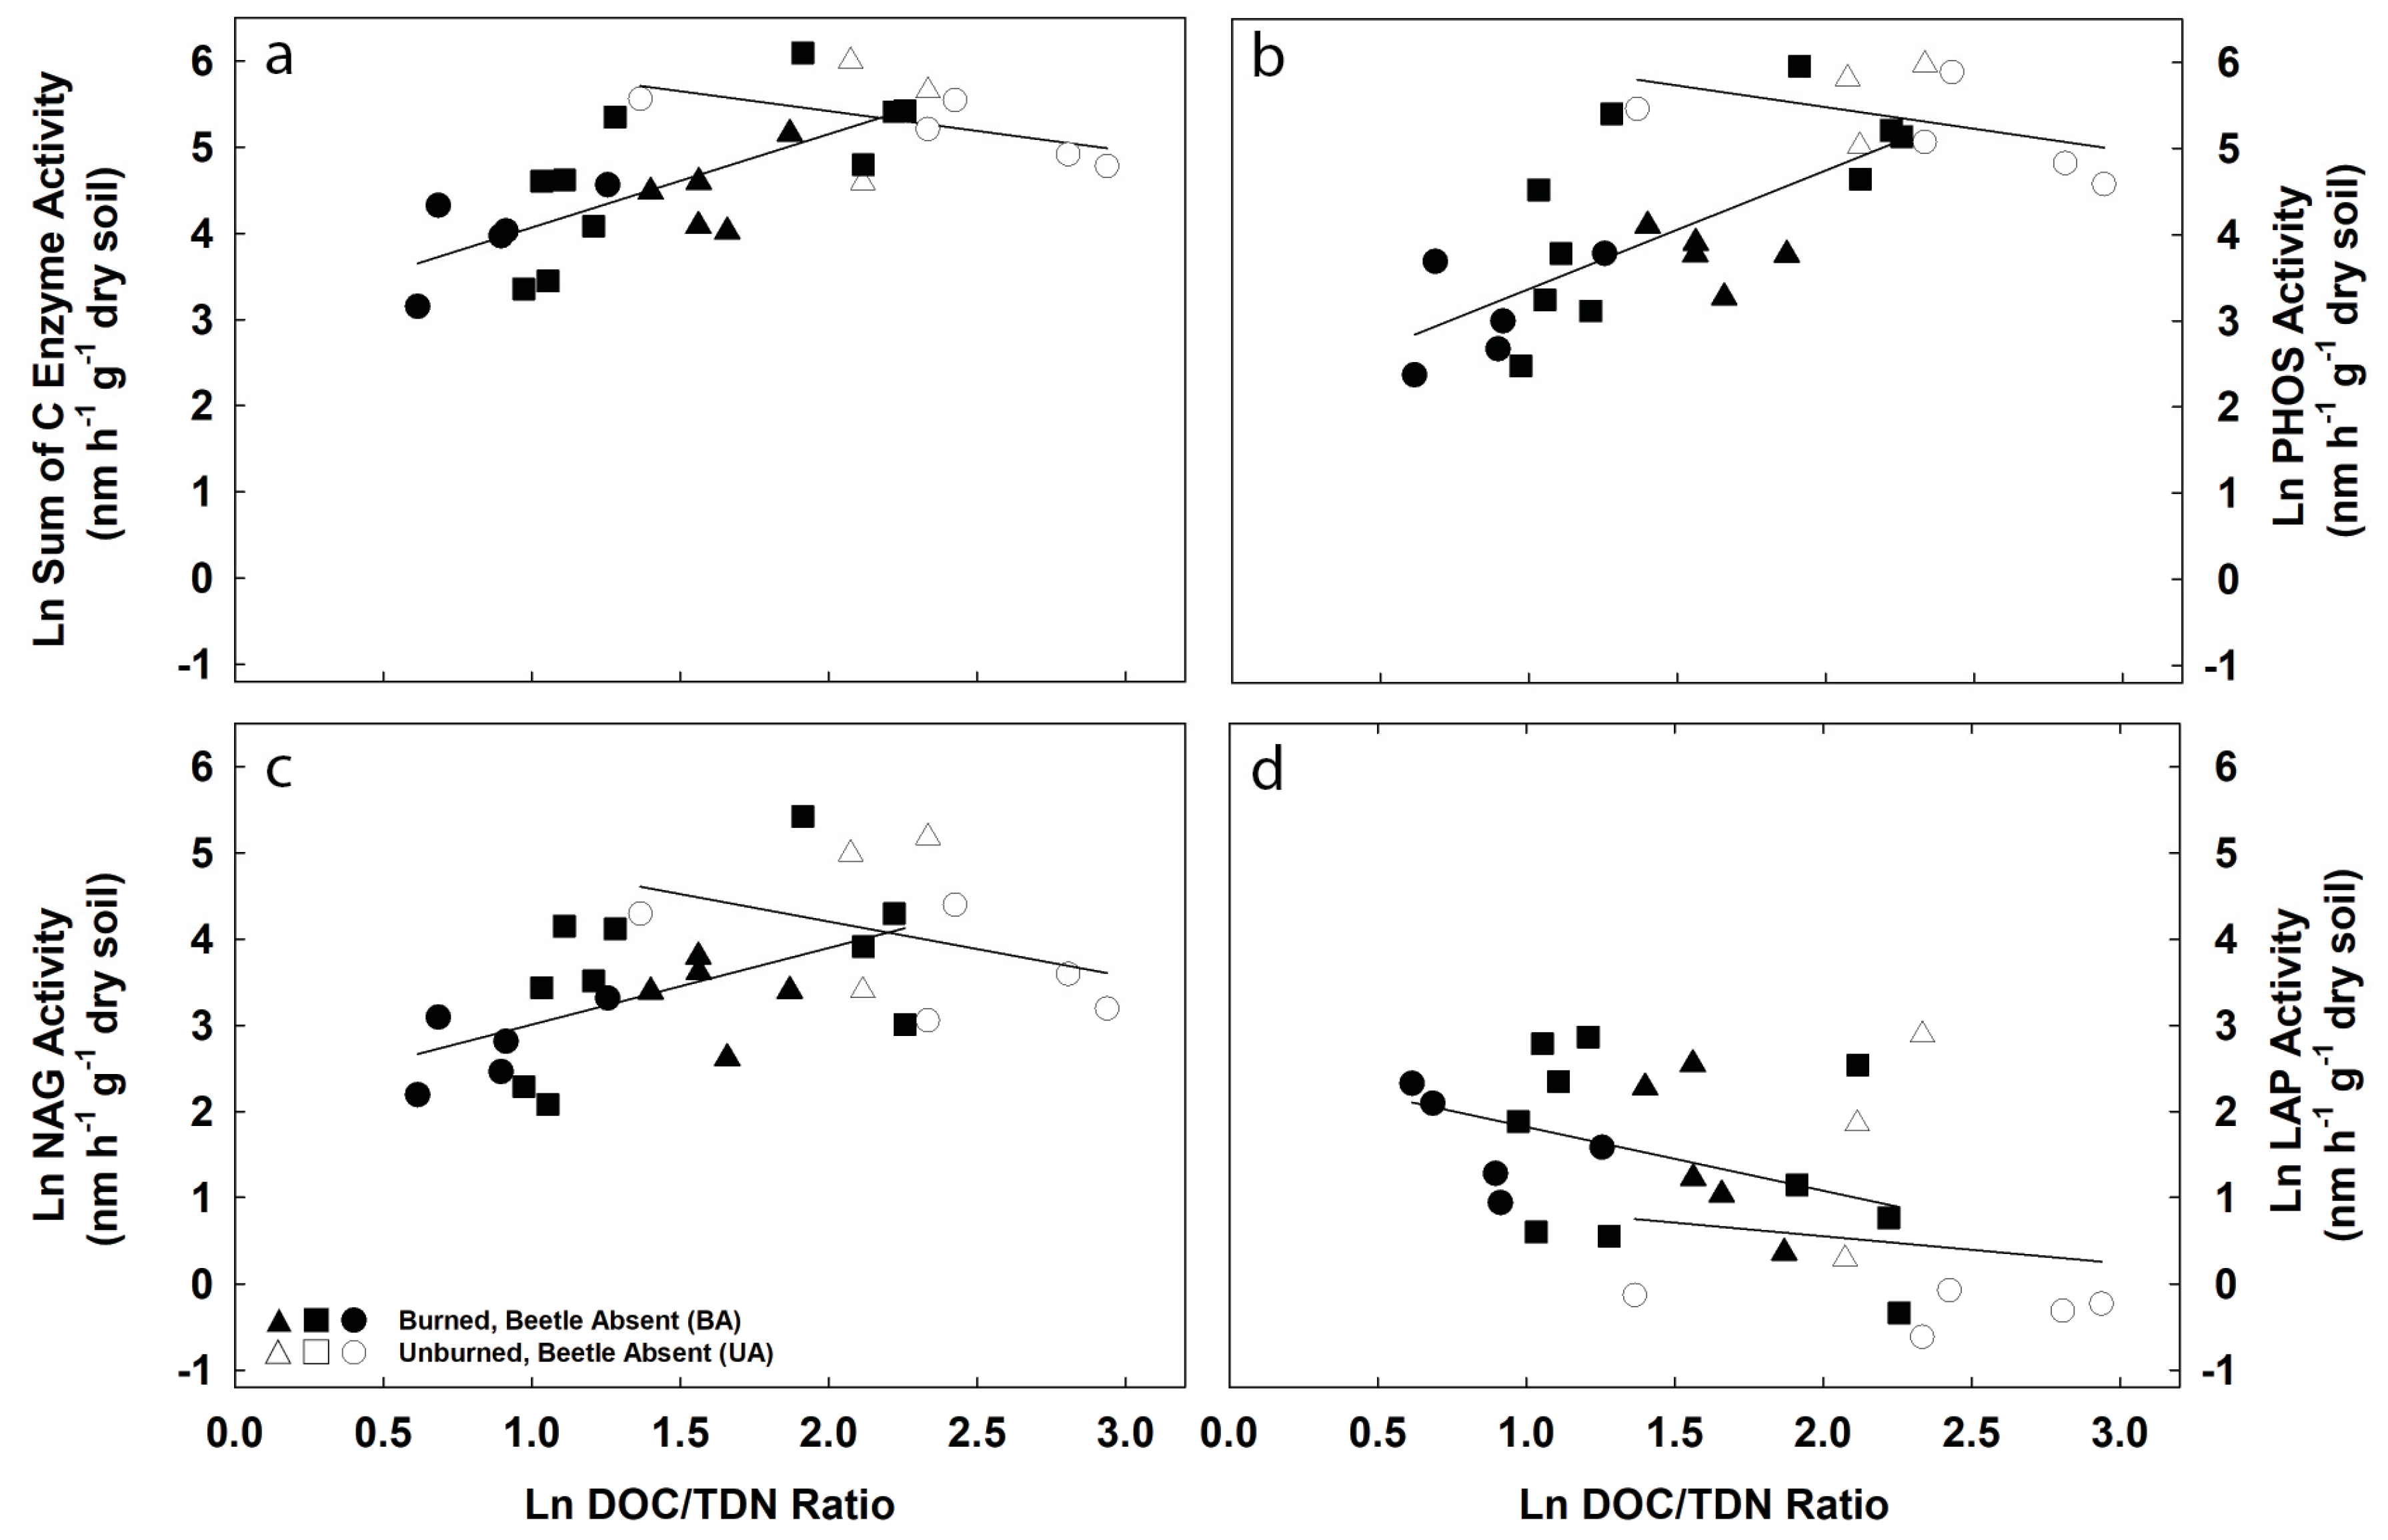
| Soil CO2 Efflux | 0.00 | 0.95 | 0.00 | 0.83 | 0.00 | 0.89 | 0.28 | 0.02 | |
| PHOS Activity | 0.21 | 0.25 | 0.47 | <0.01 | 0.48 | 0.06 | 0.26 | 0.02 | |
| DOC/TDN | Sum of C Activity | 0.21 | 0.26 | 0.51 | <0.01 | 0.02 | 0.74 | 0.25 | 0.02 |
| LAP Activity | 0.02 | 0.77 | 0.16 | 0.08 | 0.06 | 0.55 | 0.05 | 0.34 | |
| NAG Activity | 0.14 | 0.36 | 0.29 | 0.01 | 0.52 | 0.05 | 0.23 | 0.03 | |
© 2018 by the authors. Licensee MDPI, Basel, Switzerland. This article is an open access article distributed under the terms and conditions of the Creative Commons Attribution (CC BY) license (http://creativecommons.org/licenses/by/4.0/).
Share and Cite
Lybrand, R.A.; Gallery, R.E.; Trahan, N.A.; Moore, D.J.P. Disturbance Alters the Relative Importance of Topographic and Biogeochemical Controls on Microbial Activity in Temperate Montane Forests. Forests 2018, 9, 97. https://doi.org/10.3390/f9020097
Lybrand RA, Gallery RE, Trahan NA, Moore DJP. Disturbance Alters the Relative Importance of Topographic and Biogeochemical Controls on Microbial Activity in Temperate Montane Forests. Forests. 2018; 9(2):97. https://doi.org/10.3390/f9020097
Chicago/Turabian StyleLybrand, Rebecca A., Rachel E. Gallery, Nicole A. Trahan, and David J. P. Moore. 2018. "Disturbance Alters the Relative Importance of Topographic and Biogeochemical Controls on Microbial Activity in Temperate Montane Forests" Forests 9, no. 2: 97. https://doi.org/10.3390/f9020097