Tree-Stump Detection, Segmentation, Classification, and Measurement Using Unmanned Aerial Vehicle (UAV) Imagery


Division of Forest and Forest Resources, Norwegian Institute for Bioeconomy Research (NIBIO), Høgskoleveien 8, 1433 Ås, Norway
*
Author to whom correspondence should be addressed.
Forests 2018, 9(3), 102; https://doi.org/10.3390/f9030102
Submission received: 25 January 2018
/
Revised: 14 February 2018
/
Accepted: 26 February 2018
/
Published: 27 February 2018
(This article belongs to the Special Issue Advances in Precision Forestry)
Abstract
:Unmanned aerial vehicles (UAVs) are increasingly used as tools to perform a detailed assessment of post-harvest sites. One of the potential use of UAV photogrammetric data is to obtain tree-stump information that can then be used to support more precise decisions. This study developed and tested a methodology to automatically detect, segment, classify, and measure tree-stumps. Among the potential applications for single stump data, this study assessed the possibility (1) to detect and map root- and butt-rot on the stumps using a machine learning approach, and (2) directly measure or model tree stump diameter from the UAV data. The results revealed that the tree-stumps were detected with an overall accuracy of 68–80%, and once the stump was detected, the presence of root- and butt-rot was detected with an accuracy of 82.1%. Furthermore, the root mean square error of the UAV-derived measurements or model predictions for the stump diameter was 7.5 cm and 6.4 cm, respectively, and with the former systematically under predicting the diameter by 3.3 cm. The results of this study are promising and can lead to the development of more cost-effective and comprehensive UAV post-harvest surveys.
1. Introduction
1.1. Background
The increasing need of precise information in forestry has rapidly led to an increment in the application of Unmanned Aerial Vehicles (UAVs) in data acquisition for forest managers [1,2]. UAVs, in combination with photogrammetric methods, have been successfully used for assessing forested areas for pre- [2] and post-harvest assessment [3,4,5,6,7]. In post-harvest assessment, [3,5,8] explored the possibilities of using UAV-borne photogrammetric three-dimensional (3D) data for quantifying soil disturbance from forest machinery. When compared to ground-based solutions [9], UAVs that are equipped with imaging sensors represent a more efficient tool to acquire highly detailed and spatially continuous 3D data. Thus, UAVs represent an important tool for post-harvest assessment, especially when increasing the requirements for environmental monitoring and the reporting of post-harvest sites [3]. Furthermore, because of the small dimensions, scattered distribution, and difficult access of harvest sites, UAVs may be particularly attractive for the assessment of these sites [3]. Until now, studies using UAVs for post-harvest assessment have used UAV data for a single purpose, e.g., assessing soil displacement, quantifying timber theft [7], or estimating forest transpiration [6]. In the future, it would be desirable to derive multiple levels of information from single UAVs acquisitions. The development of multipurpose UAV post-harvest applications could provide a more comprehensive site assessment, while increasing the cost-effectiveness of using UAVs.
Some of the most evident features on a post-harvest site are tree stumps, as they are relatively uniform, their surface is generally brighter than the surrounding area, and they typically protrude (10–40 cm) above ground level. These distinct characteristics suggest that UAVs may be used to retrieve information on the distribution and characteristics of tree stumps. Jaskierniak, et al. [6] first suggested the use of UAV orthomosaics to assess stumps’ characteristics. In their specific case, UAV imagery was used to manually detect tree stumps and measure sapwood area as a proxy variable to estimate annual transpiration in eucalyptus forests. The first attempt to automate the stump detection was made by Samiappan, et al. [7], who adopted image pattern recognition methods for this purpose with the objective of detecting and measuring tree stumps for the quantification of illegal logging. In addition to the abovementioned applications, improved information on tree-stumps may be useful for a number of others applications, such as: (1) detecting, quantifying, and mapping the presence of root- and butt-rot that is caused by pathogens. Root- and butt-rot is frequently transmitted from the stumps and root network to the next tree generation [10,11,12]. Information on the spatial extent of root- and butt-rot can be valuable in designing regeneration strategies that ensure that more resistant species are planted in areas with a significant presence of such pathogens [13,14]; (2) estimation of tree-stump height and fibre losses [15], and in modelling below-ground biomass left on site [16]; (3) better understanding of the spatial variability in stand productivity and transpiration for use in development of forest growth models, such as shown by Jaskierniak, et al. [6]; and, (4) supporting better georeferencing of individual tree positional data from forest harvesters. The spatial matching of variables such as UAV-derived and harvester-measured tree-stump diameter could in fact enable the assignment of an accurate position to the harvester head, providing high precision single-tree data [17,18]. The limited literature on the use of UAVs for post-harvest assessment is not commensurate with the perceived opportunities, indicating that there is potential in the development of methods to use these data to extract additional types of information.
1.2. Aim
The primary aim of this study was to develop and test the accuracy of automatic tree-stump detection and segmentation algorithm using UAV imagery and derived 3D products. The secondary objectives were to assess the possibility to (i) detect and map the presence of root- and butt-rot presence in the stumps, and (ii) directly measure and/or model tree-stump diameter.
2. Materials
2.1. Study Area
The study area consisted of one forest stand of 4.5 ha located in south-eastern Norway. The stand had been harvested in February 2017, using a cut-to-length (CTL) system for the harvest and extraction of timber. Logging residues had been left on site, or piled on the machine trails to reduce soil disturbance where necessary. No special consideration related to the study was made during the harvesting operations.
2.2. Field Data
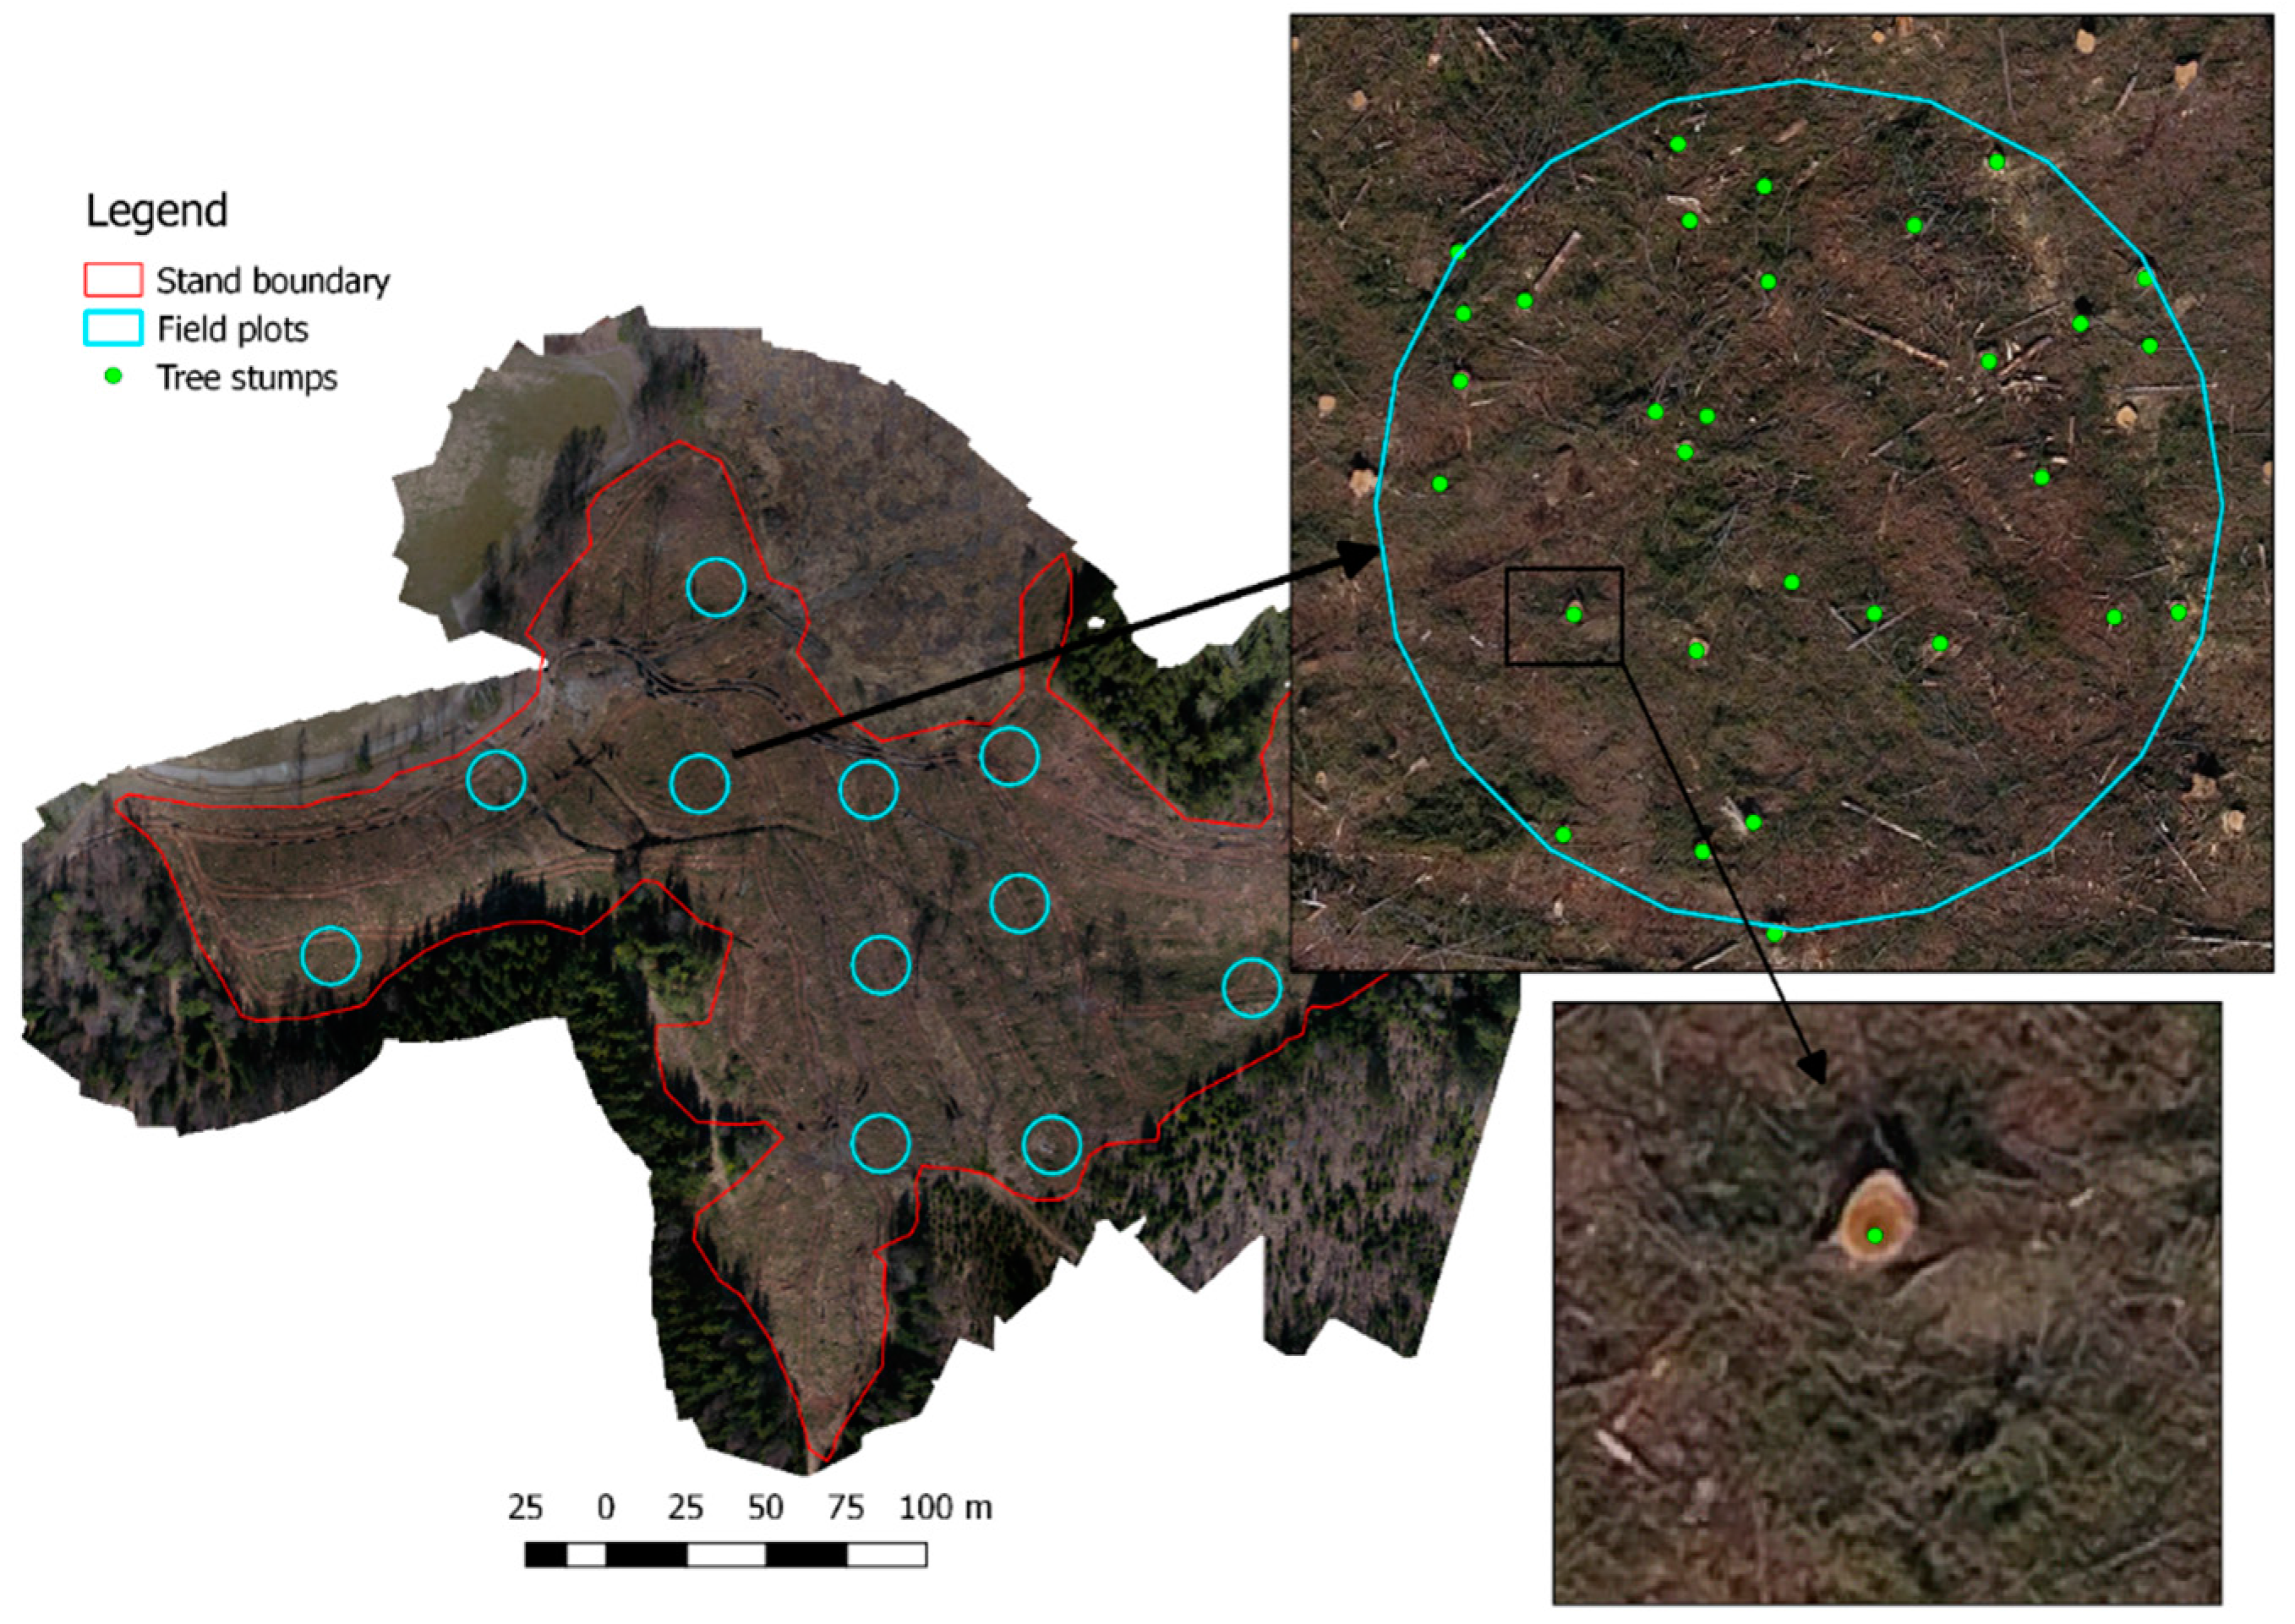
A field campaign was conducted in spring-summer 2017 to acquire single tree-stump field data. A systematic clustered sampling design was adopted. A total of 11 field plots were systematically selected at the vertices of a 57 m × 57 m grid that was generated based on the extent of the stand (Figure 1). The systematic design was adopted to ensure a uniform coverage of the stand. The field plots were circular and with a radius of 8.92 m (area = 250 m2), and covered a total area of 0.275 ha, or 6.1% of the stand area. Within each plot, every tree-stump was measured. The total sample size (i.e., single tree-stumps) was 265 tree-stumps.
The position of the centre of the field plot was measured using a Topcon GR5 GNSS receiver fitted with cellular communication for Real Time Kinematic (RTK) correction live via the GSM network. Furthermore, for each tree-stump the measurements included: (a) GNSS positioning of the centre of each tree-stump; (b) two diameters in the north-south (N-S) and east-west (E-W) directions, respectively; (c) the presence or absence of root- and butt-rot; (d) tree-stump occlusion classification (non-obscured tree-stumps or tree-stumps that were partially or fully obscured by logging residuals); and, (e) tree-stump damage classification (undamaged tree-stumps or tree-stumps damaged by machinery).
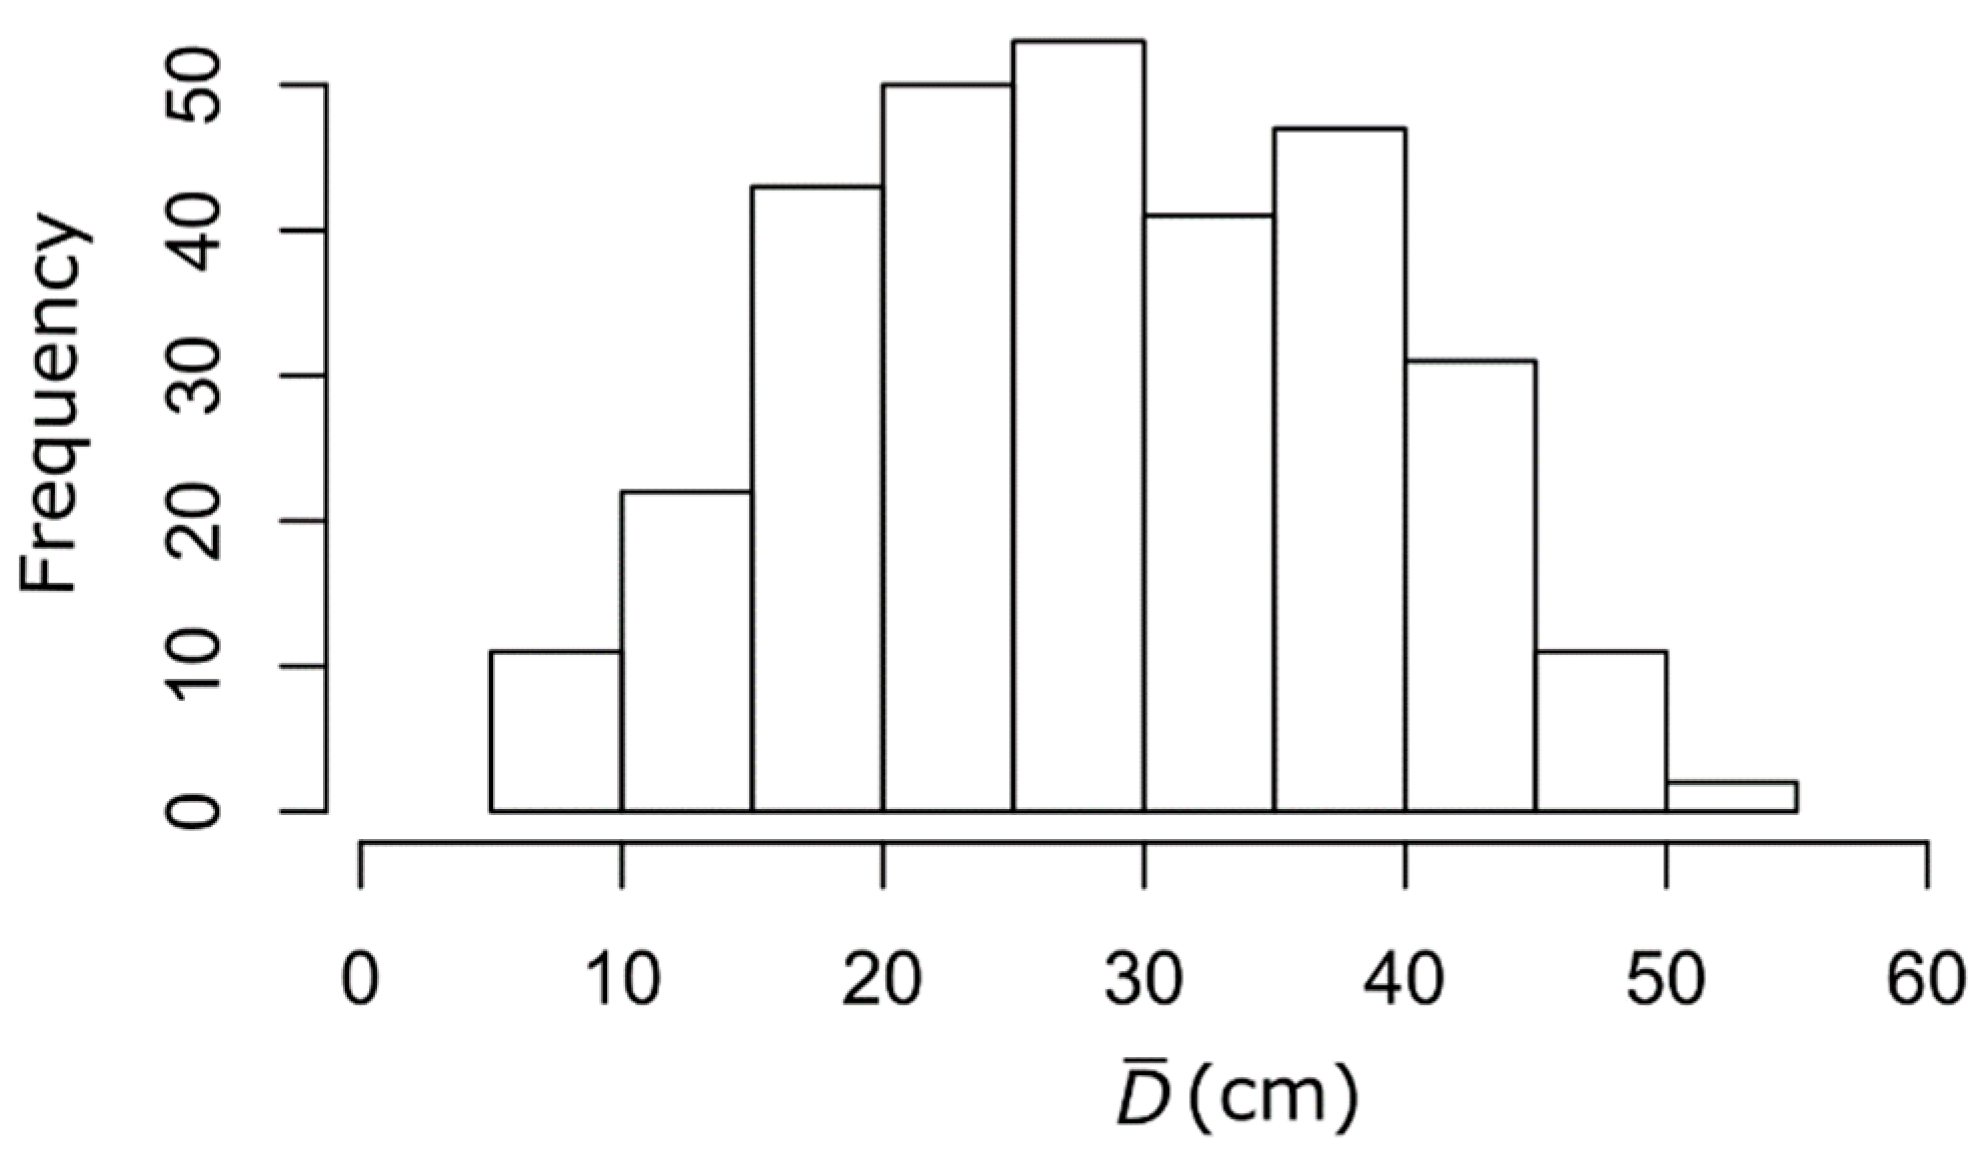
Requirements on the northing and easting GNSS accuracy of the estimate of the position of the centre of the tree-stumps dimensions was at single centimetre level when obtaining a fix. The two cross-sectional diameters were measured using a measuring tape and were later averaged to obtain the tree-stump mean diameter (; cm). Figure 2 provides an overview of the distribution for the measured plots.
The presence or absence of root- and butt-rot, tree-stump occlusion, and tree-stump damage were visually assessed. The presence of root- and butt-rot in the stump was assessed based on discoloration and presence of wood decay. The proportion of tree-stumps among the different classes are presented in Table 1.
Figure 3 offers a visual comparison of the different classes adopted for the classification of the tree-stumps.
2.3. Remotely Sensed Data
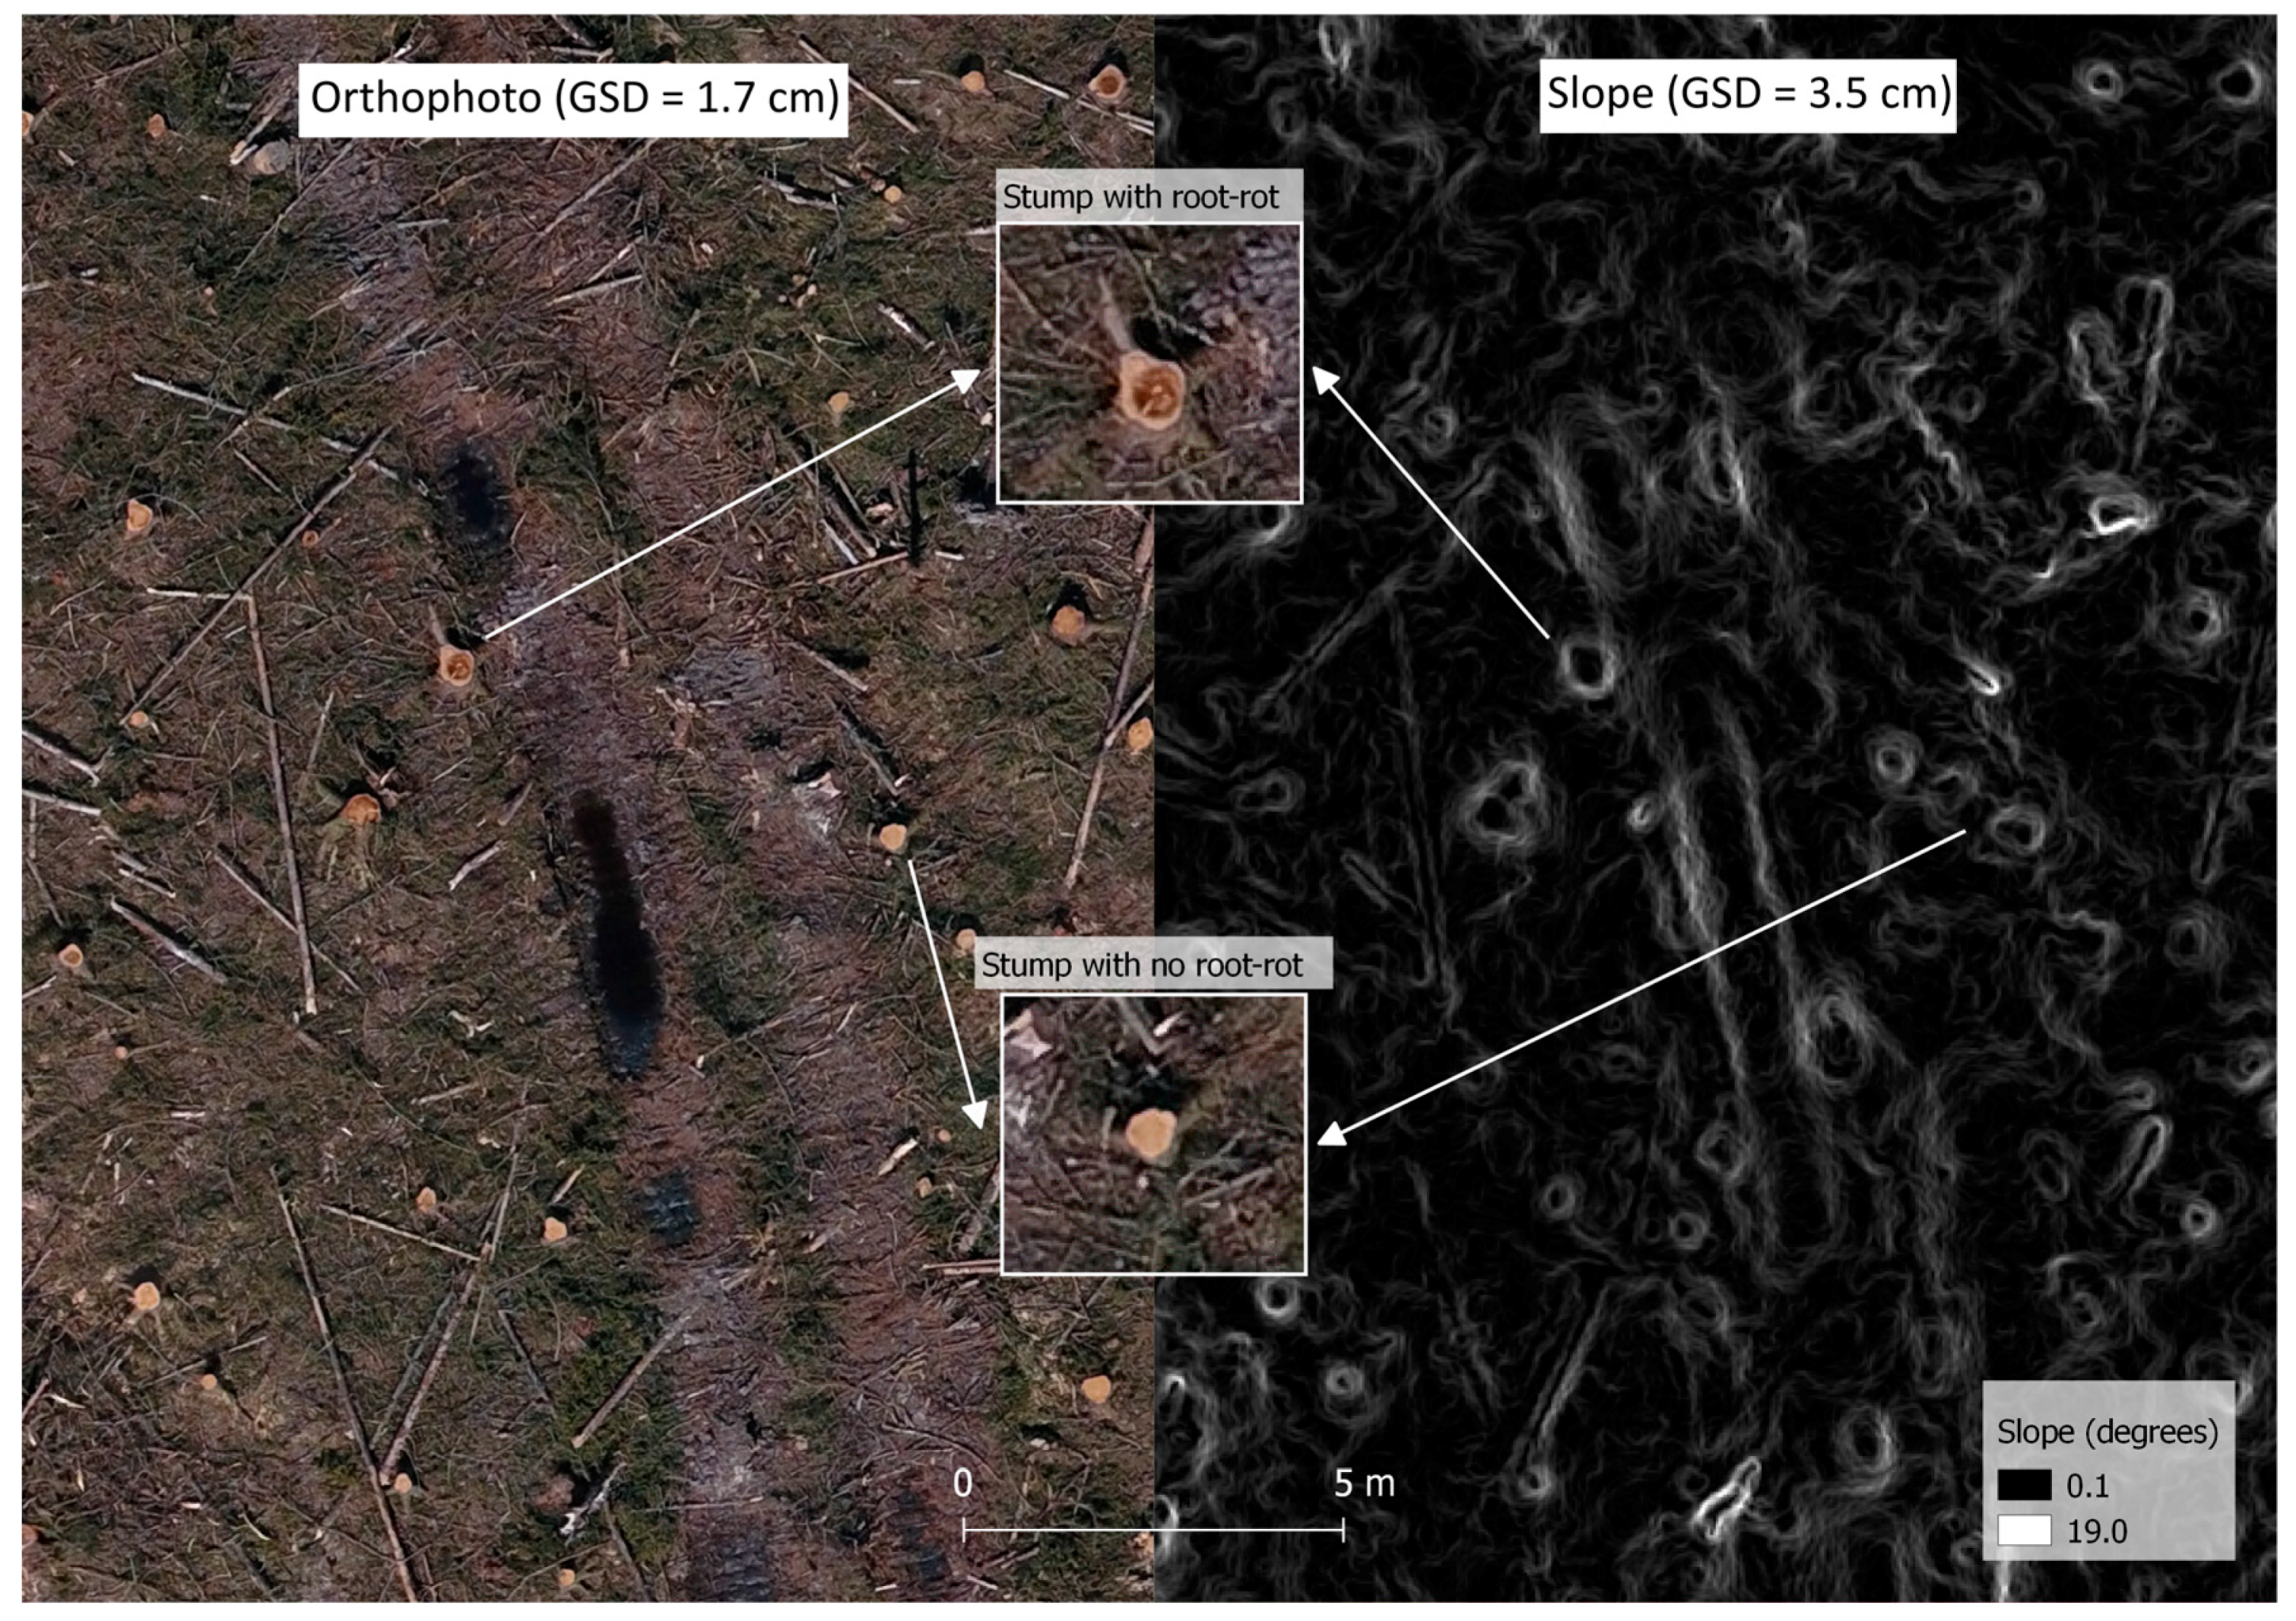
UAV imagery was acquired wall-to-wall for the stand of interest on 23 April 2017 within a single flight lasting about eight minutes that conducted in open-sky conditions in the middle of the data (12:00 a.m.). By performing the UAV imagery acquisition shortly after the harvest, the effects of natural discoloration of the tree-stumps over time were reduced, hence ensuring large contrast between the tree-stumps and the background and between healthy wood and root- and butt-rot (see Figure 4). UAV imagery was acquired using the integrated camera on a DJI Phantom 4 quadcopter (DJI, Shenzhen, China), which is fitted with a 1/2.3-inch complementary metal-oxide semiconductor (CMOS) sensor with 12.4 mega pixels [19]. The UAV flights were conducted at an average altitude of 40 m above ground, resulting in a ground sampling distance of 1.7 cm. The flight altitude was determined by the need of high resolution data to detect tree-stumps, while clearing retention trees and ensuring the coverage of the entire stand within a single flight. The effective overlap between the images was 3.9, meaning that each point on the ground was visible on average in approximately four images.
Photogrammetric processing of the UAV imagery was performed using Agisoft Photoscan (version 1.3.3, Agisoft, Saint Petersburg, Russia) [20]. Five ground control points were measured using the Topcon RTK GNSS (Topcon, Tokyo, Japan), and were marked in the field. These were then used in Photoscan to ensure an accurate geolocation and avoid distortion in the resulting models. The dense point cloud was generated using high quality settings with aggressive filtering in order to obtain a high resolution digital surface model (DSM) with minimal noise. The photogrammetric processing resulted in the export of two raster products, namely the DSM and a three-band (i.e., red, green, and blue) orthophoto at a resolution of 3.5 cm and 1.7 cm, respectively. Figure 4 provides some visual insight in the high spatial resolution characterizing these data.
3. Method
The following sub-sections describe in detail the steps adopted to detect, segment, classify, and measure tree-stumps. The parametrization of the proposed method was mostly performed according to a trial and error approach. Thus, some of the used values may be unique to the study area, and therefore require some tuning when applying the algorithm to new data. The entire methodology was developed using R software [21], using commonly used geospatial packages, such as ‘sp’ [22], ‘rgdal’ [23], and ‘raster’ [24].
3.1. Detection and Segmentation
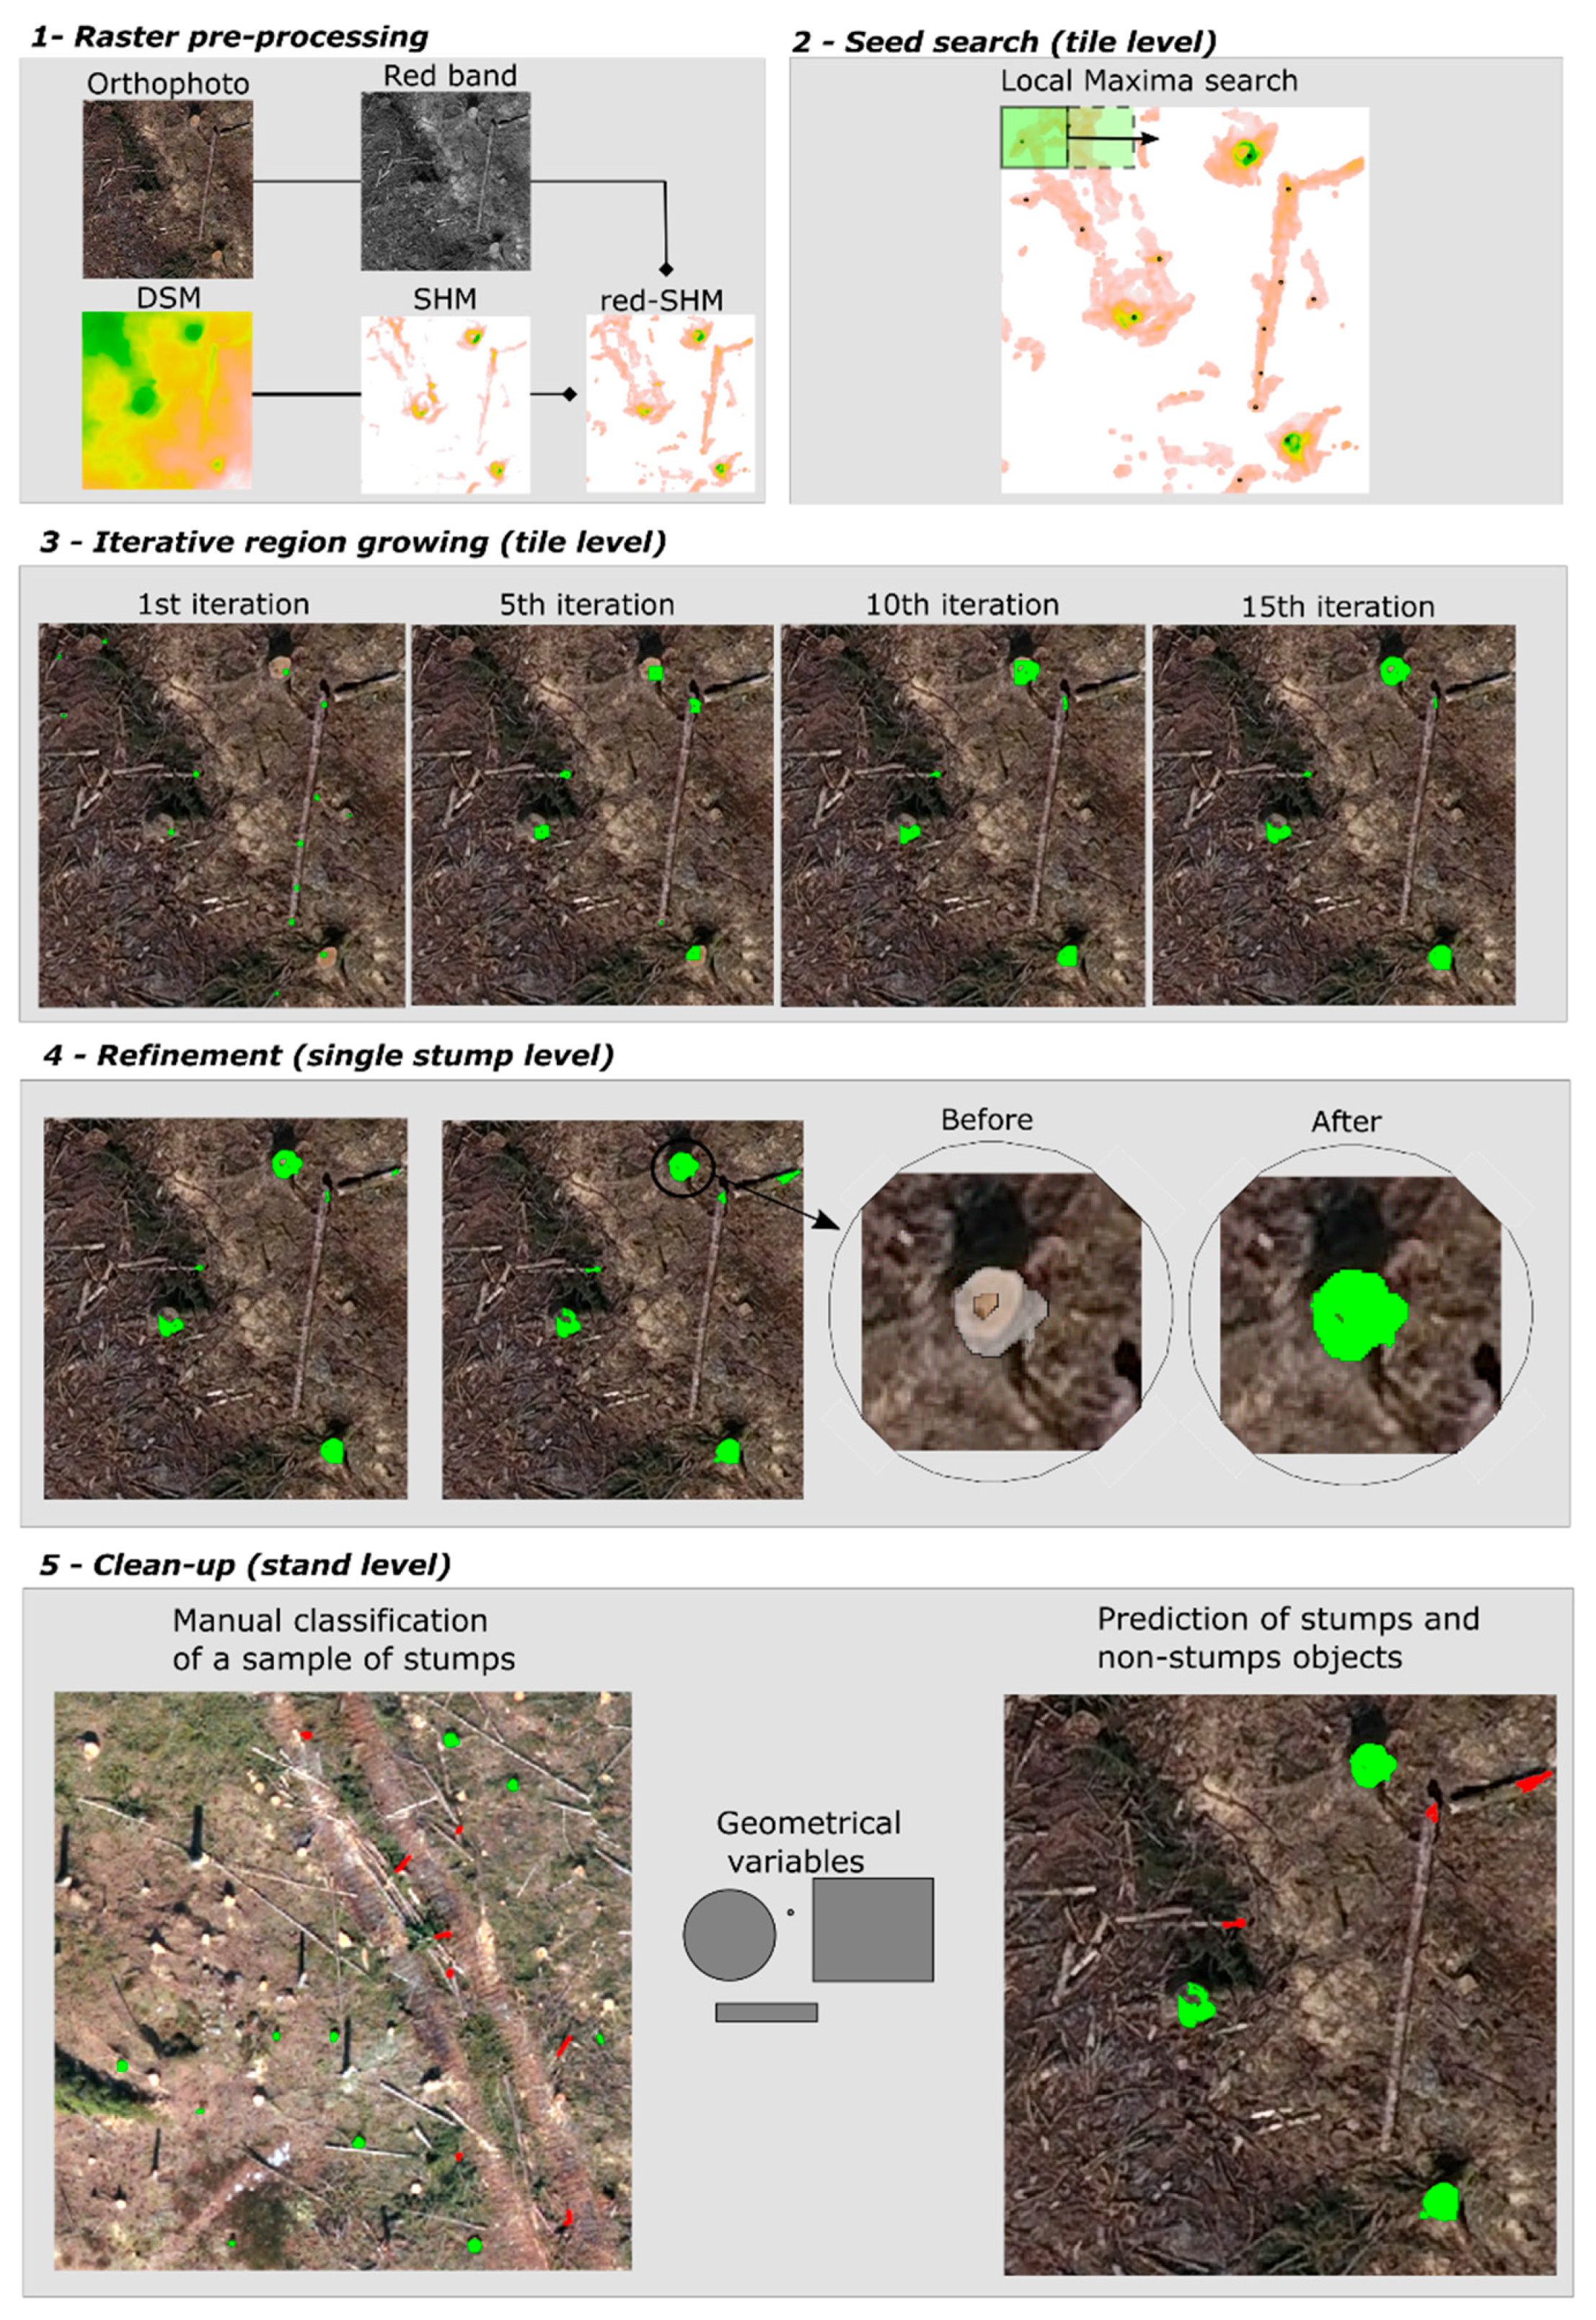
Raster pre-processing: the input data consisted of UAV-derived orthophoto and DSM. A digital terrain model (DTM) was initially generated from the DSM based on a local minima filter of size 22.5 cm × 25.5 cm. The DTM was then subtracted from the DSM, thus obtaining the stump height model (SHM), which is a digital elevation model representing the height of any object above the ground, including objects tree-stumps. Pixels with a height above ground of less than 2 cm or larger than 1 m were discarded from any further analysis. The red band of the orthophoto and the SHM were then combined through a multiplication, thus generating a raster representing simultaneously the spectral and 3D information. Throughout this study, this raster will be referred as red-SHM. Finally, this raster was tessellated into 100 m2 square tiles and further processing was then performed at tile level.
Seed search: the tree-stump detection was first initialized by searching for seeds through a local maxima search using the focal function implemented in the R package ‘raster’ [24] on the red-SHM and with a moving window of size 93.5 cm × 93.5 cm. The choice of this window size was determined as the one allowing for the detection of most stumps in preliminary tests. Even though it generally resulted in an over-detection, the seeds that were not stump were automatically removed in the following step.
Iterative region growing: once the tree-stump seeds were located, an iterative region growing procedure was performed for of all of the seeds simultaneously within each single 100 m2 tile. At each iteration, a buffer of size equal to the raster resolution (i.e., 1.7 cm) was computed for all of the seeds, and within this, all of the pixels with red-SHM values >15th percentile of all the tree-stump segments within the tile were considered valid for defining the tree-stump in the next iteration. While this region growing resulted in the production of stump polygons, it also resulted in the removal of part of the original seeds that were not representing stumps. This was the case for those seed buffers that had red-SHM values < 15th percentile of the whole set of polygons within the tile. The remaining pixels were discarded from further growth. The low percentile was defined by a trial-and-error approach as the most suitable since larger values led to excessively conservative growth. Furthermore, within each growth iteration, the occurrence of small isolated polygons was reduced by removing any polygon that was not intersecting the original tree-stump polygon as these were generally representing scattered woody debris. The total number of iterations was set to 15 to correspond to a maximum growth in radius to 25.5 cm, which corresponds well with the maximum radius that was measured in the field (i.e., 23.2 cm), while limiting the possibility to grow in regions outside the tree-stumps.
Refinement: after the simultaneous segmentation of all tree-stumps within the tile, some of the tree-stumps still presented anomalies in their shape, with portions of the tree-stump not being correctly segmented. Thus, a tree-stump level refinement step was performed by thresholding pixels within a varying buffer size proportional to the polygon area (buffer radius = radius of a circumference with same area of the tree-stump segment). Within each buffer, all of the pixels that had red-band values smaller than the 90th percentile, and slope larger than the 90th percentile of the respective variables were discarded from the raster. This thresholding aimed at removing those pixels that were not representing stumps because they were not meeting the stump definition as objects with flat surface (slope threshold) and brighter (red-band threshold) than the immediate surroundings. The choice of a conservative threshold (90th percentile) was driven by the need of discarding only those pixels that were surely not part of a stump. The remaining pixels were then aggregated into refined polygons.
Clean up: The resulting tree-stump segmentation resulted in most of the tree-stumps being segmented, however the described procedure produced a number of polygons that were clearly not tree-stumps. These consisted mostly of logging residues and rocks. Thus, in the final step, the tree-stump segments were classified to tree-stump or non-tree-stump objects at stand level. This was performed by using the random forest algorithm implemented in the R software, ‘randomForest’ package [25]. A total of 31 explanatory variables were extracted for each segment, including: spectral, dimensional, and geometrical variables. Out of all the segmented tree-stumps, a sample of 500 randomly selected and manually classified tree-stumps was used as training data for a random forest classifier. The classifier was then applied to classify the whole set of segments and those segments that were not classified as tree-stumps were discarded from any further analysis.
Figure 5 provides a schematic representation of the described steps adopted for the detection and segmentation of the tree tree-stumps.
The tree-stump detection was then validated by comparison with field measured tree-stumps. A correct match was defined if a segmented polygon was within 1 m from a field measured tree-stump. The overall classification accuracy, omission error, and commission error were assessed for four different strata in the stand: (1) All of the stumps in the stand independent of condition; (2) Only clearly visible stumps, obtained by removing occluded stumps from the dataset; (3) Only undamaged stumps where damaged tree-stump class was removed from the dataset observations; and, (4) only visible and non-damaged stumps that were defined by removing the occluded and damaged tree-stump classes from the dataset.
Furthermore, for stratum 1, the detection accuracy was also assessed for six 10 cm wide tree-stump classes (i.e., 0 cm–10 cm, …, 50 cm–60 cm).
3.2. Machine Learning Random Forest Classification
A machine learning random forest classification was adopted for classifying the tree-stumps, according to the presence or not of root- and butt-rot. For this purpose, only the first strata was analysed. Due to the small number of tree-stumps with root- and butt-rot in the field data (34 or 13% of the total number), the field data was integrated with 137 manually classified tree-stumps with root- and butt-rot presence. This resulted in a more balanced dataset composed of a total of 309 tree-stumps out of which 156 had presence of root- and butt-rot.
A total of 17 explanatory variables were extracted for each single tree-stump segment. These included spectral variables obtained from the orthophoto, including: band (red, green, and blue) mean values and standard deviation. Textural variables (mean and standard deviation of mean, variance, homogeneity, contrast, dissimilarity, and entropy) were also computed from the red band using the ‘glcm’ package in R [26].
The out-of-bag data (oob) from the random forest was used for validation
3.3. Diameter Measurement and Modelling
Additional variables were extracted from the segmented stumps. Among these, the dimensional variables included: area (cm2), perimeter (cm), length (polygon length in the y axis; cm), width (polygon length in the x axis; cm), and ellipse diameter (diameter of the circumference with area equal to that of an ellipse fitted to the vertexes of the polygon; cm). Furthermore, the geometrical variables included: asymmetry index (length to width ratio), roundness index (area to perimeter ratio), and compactness index (ratio between the area and the area of circle with same perimeter).
The ellipse diameter was then used as the direct measurement of , while the model predicted value of was obtained by fitting a univariate linear model linking field measured and the ellipse diameter.
The direct measurement and the model predictions were then assessed by independent validation and leave one out cross validation (loocv), respectively. The presence of random and systematic errors were assessed by the root mean square error (), the mean difference (), and their respective values as percentage of the mean ( and ).
4. Results
4.1. Tree-Stump Detection
The assessment of the accuracy of tree-stump detection revealed that, depending on the stratum considered, the tree-stumps were detected with an overall accuracy ranging from 67.9% (stratum 1) to 79.9% (stratum 4). The omission errors decreased from 32.1% in stratum 1 to 25.7%, 28.2%, and 20.1% when tree-stumps that were either covered, damaged, or covered and damaged were removed from the sample in strata 2, 3, and 4, respectively. An opposite trend was observed for the commission errors which increased from 26.0% to 34.7% going from stratum 1 to 4. Figure 6 summarizes the overall accuracy, omission, and commission errors for the different strata that were adopted in this study.
When looking at the detection accuracy for different tree-stump diameter () classes (see Table 2) in stratum 1, the overall accuracy increased steadily when increasing the tree-stump diameter from a minimum of 28.6% to a maximum of 100% for the classes in the ranges 0 cm–10 cm and 50 cm–60 cm, respectively.
4.2. Root- and Butt-Rot Machine Learning Classification
The five most important variables according to the random forest variable importance ranking were spectral and textural variables. More specifically, in order of importance, they were: the mean of the blue band, the mean variance, the standard deviation of the variance, the standard deviation of the blue band, and the average of the mean. The results regarding the detection of tree-stumps with root- and butt-rot revealed that for the stratum 1, a total of 19 tree-stumps or 56% of the number of measured tree-stumps with root- and butt-rot were correctly detected. For the tree-stumps without root- and butt-rot, the detection rate increased to 70% of the total number of field measured tree-stumps with no root- and butt-rot.
The confusion matrix obtained through loocv for the classification of the presence or absence of root- and butt-rot on the tree-stumps (Table 3) revealed an overall accuracy and kappa value of 78.3% and 0.6%, respectively. The class-specific classification accuracy for tree-stumps without and with root- and butt-rot was 74.5% (114 out of 153) and 82.1% (128 out of 156), respectively.
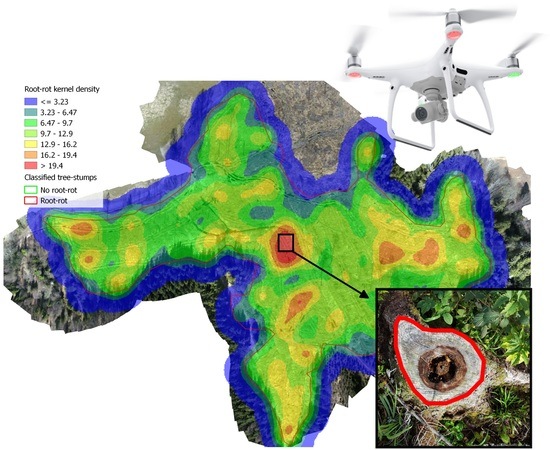
A heatmap of the stumps classified with root- and butt-rot was obtained by applying the trained random forest classifier to all of the stumps that were segmented within the stand (Figure 7). This represents an example of a further output from the proposed analysis, which could be used in better understanding the cause and distribution patterns of root- and butt-rot.
4.3. Diameter Direct Measurement and Modelling
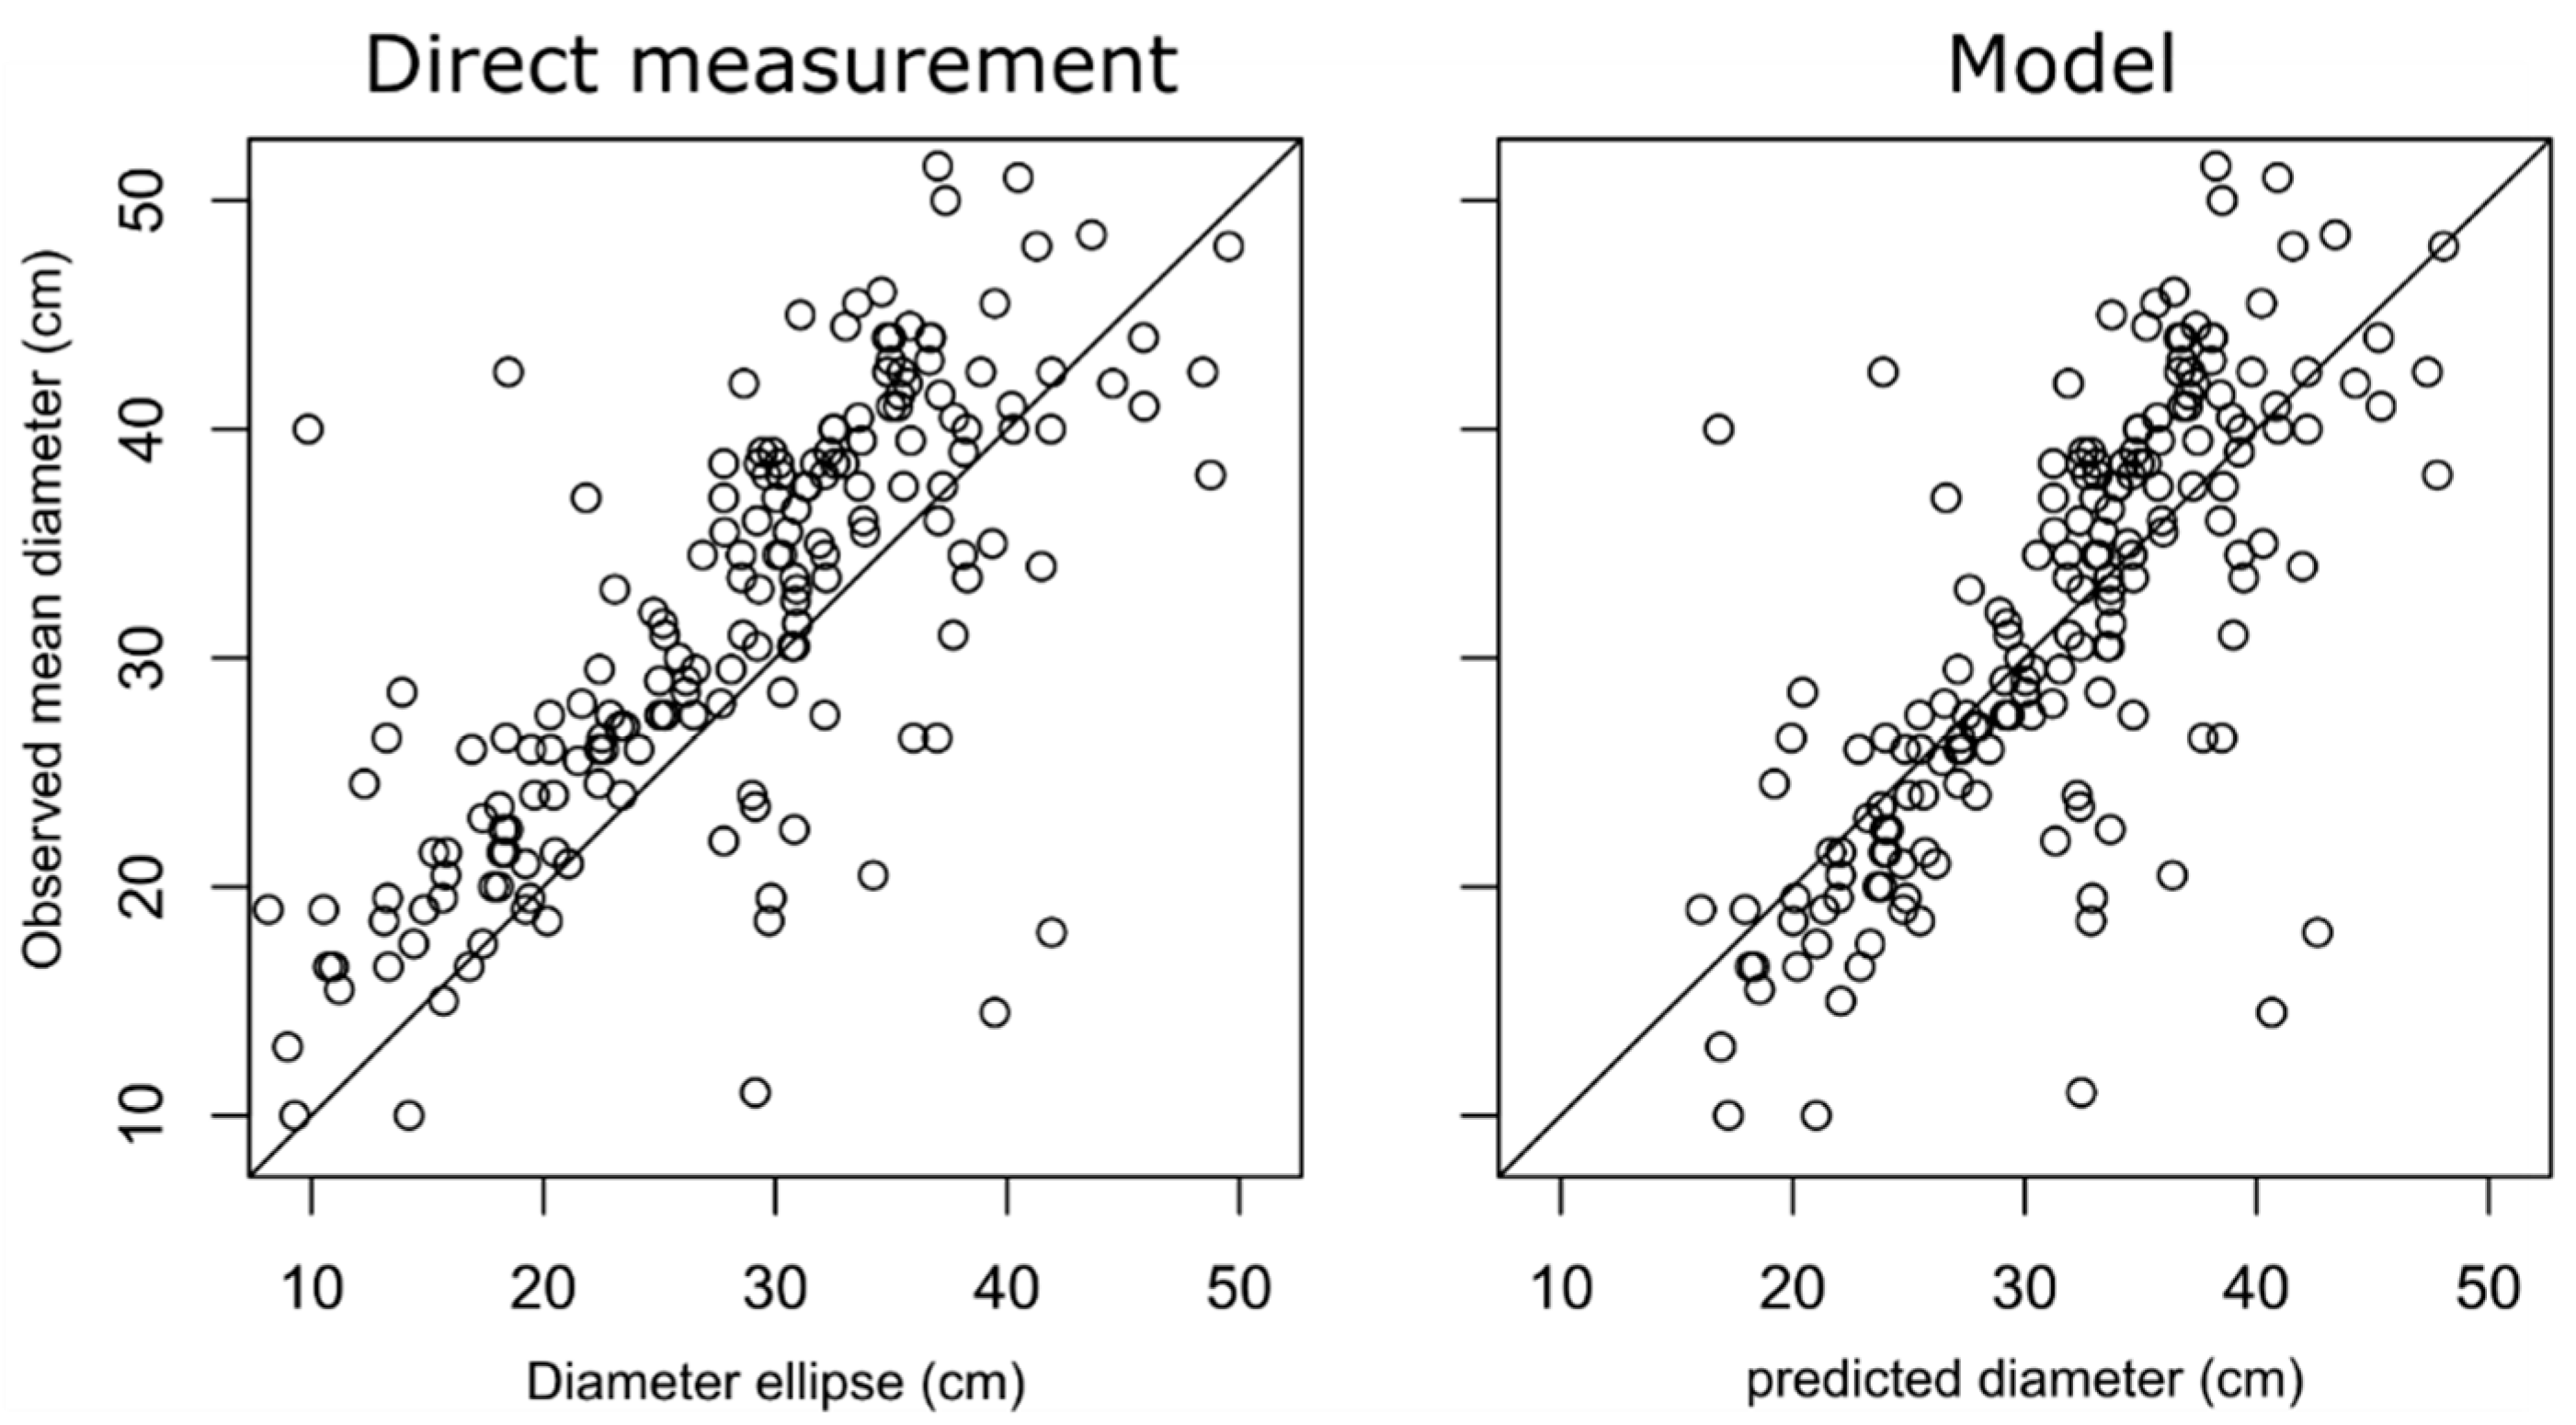
The results concerning the direct measurement of the tree-stump diameter showed that the most correlated variable was the ellipse diameter (Pearson’s correlation coefficient = 0.74). Thus, this variable was used for the direct measurement, as well as for the modelling approach. As shown in Table 4, the direct measurement approach had a of 7.5 cm (23.6% of the mean), while this diminished to 5.4 cm in the modelling approach. The difference between the two methods was more pronounced when comparing the . The direct measurement method systematically under-estimated the tree-stump by approximately 3.3 cm and that difference was significant (p-value < 0.000), whereas the modelling approach was not affected by significant systematic error (p-value = 0.99). Such a difference between the two methods was also clearly visible in the scatterplots shown in Figure 8.
5. Discussion
This study introduced a methodology for the use of UAV imagery in post-harvest site assessment to obtain tree-stump information. This represents a case where UAVs are possibly currently the only remote sensing data acquisition platform allowing for the retrieval of such detailed information with acceptable levels of accuracy at specific points in time following the harvest. Until now, only very few studies used tree-stump information obtained from UAV data, however the possibility to retrieve it cost-effectively could lead to the development of applications where its use could be beneficial on a wider scale. Thus, this paper also proposed some of these applications, providing insights on the potential of UAV-derived tree-stump information.
This paper deals with a relatively new research area, hence the detection accuracy and diameter measurement results can only be compared with those of the one known study by Samiappan, et al. [7]. The overall accuracy of the proposed detection method for stratum 1 was of 67.9%, where all of the harvesting residues are retained on site. When looking at the other strata, the detection accuracy increased up to 79.9% in stratum 4 (visible and non-damaged stumps) where the stumps are not driven on. The remaining strata represented intermediate conditions between strata 1 and 4 both in terms of disturbance to the stumps (i.e., damage and occlusion), as well as for the detection rates, which decreased with an increase in disturbance. It can be expected that the proposed methods may not work well in cases where substantial parts of the trees are left standing (i.e., selective harvest or thinning), as some of the tree stumps would be occluded by the canopy. The values that were obtained for the overall accuracy were comparable to those that were reported by Samiappan, et al. [7] who found values in the range 41.0–77.3%. Nevertheless, in their study, the omission (16.3–20.4%) and commission errors (12.8–79.5%) were slightly lower than those that were found in this study (20.1–32.1% and 26.0–34.7% for omission and commission errors, respectively). The omission errors were mainly caused by severe discoloration or non-visibility of the tree-stump surface, while the commission errors were mainly caused by the detection of a number of non-tree-stump objects, such as logging residuals and rocks. Omission error increased with decreasing stump diameter, indicating that higher resolution cameras than the one that was used here (12.4 megapixels) might improve detection. Both omission and commission errors were possibly attributable to the large variability present in the spectral information. The intermediate random forest classification step was a drawback of the proposed methodology as it introduces a manual step in an otherwise automated routine. Nevertheless, in an operational application, the input training data for the random forest could be derived from a tree-stump machine-learning library built on previously acquired datasets, thus removing the need for this manual step.
It is also important to acknowledge that this study presented the results that were obtained in a single stand covered within a single UAV flight, thus under uniform light and atmospheric conditions. Because of the large variations in light, azimuth, and atmospheric conditions that can characterize different UAV image based data acquisition, the methods that were proposed in this study may require some tuning when applied to new datasets. Some of these negative effects could be alleviated by image processing and better understanding of the most suitable conditions for different UAV applications.
In an attempt to provide some indications on the potential applications for which UAV-derived tree-stump information could be used, this study evaluated the possibility to classify root- and butt-rot and measure tree-stump diameter. Despite a relatively low detection rate of tree-stumps with root- and butt-rot (56%), this study proved that once the tree-stump was detected it could be classified with root- and butt-rot rather accurately (82.1%). These results are encouraging for spatially characterizing the presence of rot (see Figure 7), thus providing improved information of the spatial extent of root- and butt-rot within a stand. Such information can potentially be used in designing regeneration strategies that where species are planted in different areas of the stand, and consequently reducing the spread of the root from the stumps and roots to the newly established trees.
The results that were obtained for tree-stump measurement revealed that despite a rather similar between the direct measurement (7.50 cm; 23.6% of the mean) and modelling methods (6.4 cm; 20.2% of the mean), the former was affected by a significant systematic error () of 3.3 cm (10.7% of the mean). It is important to note that because of the irregular shape of the tree-stumps, the field reference diameter may have been affected by errors since it was calculated as the mean of the two cross-sectional diameters in the N-S and E-W directions. These two measures may not be enough to describe the diameter variations at tree-stump level. Thus, future field campaigns should rather focus on measuring the actual basal area through the use of automatically scaled and segmented tree-stump images. Overall, the smaller and the lack of systematic errors in the modelling method, suggested this to be a more suitable approach. Thus, further effort should be dedicated to obtaining more precise diameter measurements by using circle-fitting methods that allow for outlier removal, such as the random sample consensus (RANSAC) algorithm [27]. A more accurate diameter estimate could potentially be matched with the harvester recorded felling cut diameter, potentially complementing or solving the challenge of single-tree location [17,18].
The contribution of this study lies in the introduction of novel levels of information obtainable from post-harvest UAV imagery. If on one hand, the results were encouraging, it is important to confirm and improve these results on a variety of stands and using different detection and segmentation algorithms. In particular, it would be beneficial to compare the performances of the proposed method against image pattern recognition algorithms [7]. Among the outputs from the proposed methodology, the possibility of mapping the presence and distribution of root- and butt-rot within a stand merits further investigation. [7] The retrieval of such information has been economically unfeasible up-to-date. However, the possibility to generate root- and butt-rot distribution maps with relatively inexpensive methods may prove to be valuable in supporting a more precise decision making in forestry. Further research should also shed new light on the relationships between the presence of root- and butt-rot and micro-climatic and micro-topographic conditions. Such relationships could then enable the estimation and mapping of root- and butt-rot at a landscape level.
6. Conclusions
Overall, this study showed that UAVs may provide accurate information on tree-stump location, categorical properties, and dimensions. Despite the need of further improvement and the validation of the proposed algorithm, the results were encouraging for further application. The results were reasonably accurate and when seen in combination with other uses of the same UAV data (e.g., soil disturbance or harvest residue availability), the proposed method could provide a more comprehensive assessment of post-harvest sites while increasing the cost-effectiveness of using UAVs.
Acknowledgments
This research was funded by the Research Council of Norway, PRECISION project (project number ES604162).
Author Contributions
S.P., B.T., and R.A. conceived the idea of this study, S.P. and B.T. performed the field and UAV data acquisition, S.P. performed the experiment and wrote the paper, B.T. and R.A. provided comments on the paper.
Conflicts of Interest
The authors declare no conflict of interest. The founding sponsors had no role in the design of the study; in the collection, analyses, or interpretation of data; in the writing of the manuscript, and in the decision to publish the results.
References
- Tang, L.; Shao, G. Drone remote sensing for forestry research and practices. J. For. Res. 2015, 26, 791–797. [Google Scholar] [CrossRef]
- Puliti, S.; Ørka, H.; Gobakken, T.; Næsset, E. Inventory of small forest areas using an unmanned aerial system. Remote Sens. 2015, 7, 9632. [Google Scholar] [CrossRef] [Green Version]
- Pierzchała, M.; Talbot, B.; Astrup, R. Estimating soil displacement from timber extraction trails in steep terrain: Application of an unmanned aircraft for 3d modelling. Forests 2014, 5, 1212. [Google Scholar] [CrossRef]
- Goodbody, T.R.H.; Coops, N.C.; Tompalski, P.; Crawford, P.; Day, K.J.K. Updating residual stem volume estimates using als- and uav-acquired stereo-photogrammetric point clouds. Int. J. Remote Sens. 2017, 38, 2938–2953. [Google Scholar] [CrossRef]
- Talbot, B.; Rahlf, J.; Astrup, R. An operational uav-based approach for stand-level assessment of soil disturbance after forest harvesting. Scand. J. For. Res. 2017, 1–10. [Google Scholar] [CrossRef]
- Jaskierniak, D.; Kuczera, G.; Benyon, R.G.; Lucieer, A. Estimating tree and stand sapwood area in spatially heterogeneous southeastern australian forests. J. Plant Ecol. 2016, 9, 272–284. [Google Scholar] [CrossRef]
- Samiappan, S.; Turnage, G.; McCraine, C.; Skidmore, J.; Hathcock, L.; Moorhead, R. Post-logging estimation of loblolly pine (pinus taeda) stump size, area and population using imagery from a small unmanned aerial system. Drones 2017, 1, 4. [Google Scholar] [CrossRef]
- Nevalainen, P.; Salmivaara, A.; Ala-Ilomäki, J.; Launiainen, S.; Hiedanpää, J.; Finér, L.; Pahikkala, T.; Heikkonen, J. Estimating the rut depth by uav photogrammetry. Remote Sens. 2017, 9, 1279. [Google Scholar] [CrossRef]
- Pierzchała, M.; Talbot, B.; Astrup, R. Measuring wheel ruts with close-range photogrammetry. Forestry 2016, 89, 383–391. [Google Scholar] [CrossRef]
- Stenlid, J. Controlling and predicting the spread of heterobasidion annosum from infected stumps and trees of picea abies. Scand. J. For. Res. 1987, 2, 187–198. [Google Scholar] [CrossRef]
- Peri, T.; Korhonen, K.; Sairanen, A. Occurrence of heterobasidion annosum in pure and mixed spruce stands in southern finland. Scand. J. For. Res. 1990, 5, 113–125. [Google Scholar] [CrossRef]
- Lygis, V.; Vasiliauskas, R.; Stenlid, J. Planting betula pendula on pine sites infested by heterobasidion annosum: Disease transfer, silvicultural evaluation, and community of wood-inhabiting fungi. Can. J. For. Res. 2004, 34, 120–130. [Google Scholar] [CrossRef]
- Piri, T. Early development of root rot in young norway spruce planted on sites infected by heterobasidion in southern finland. Can. J. For. Res. 2003, 33, 604–611. [Google Scholar] [CrossRef]
- Möykkynen, T.; Pukkala, T. Effect of planting scots pine around norway spruce stumps on the spread of heterobasidion coll. For. Pathol. 2011, 41, 212–220. [Google Scholar] [CrossRef]
- Ackerman, P.; Pulkki, R. Fibre volume losses of eight softwood clearfell harvesting systems in South Africa. South. For. J. For. Sci. 2012, 74, 133–149. [Google Scholar] [CrossRef]
- Lehtonen, A.; Mäkipää, R.; Heikkinen, J.; Sievänen, R.; Liski, J. Biomass expansion factors (befs) for scots pine, norway spruce and birch according to stand age for boreal forests. For. Ecol. Manag. 2004, 188, 211–224. [Google Scholar] [CrossRef]
- Lindroos, O.; Ringdahl, O.; La Hera, P.; Hohnloser, P.; Hellström, T.H. Estimating the position of the harvester head—A key step towards the precision forestry of the future? Croat. J. For. Eng. 2015, 36, 147–164. [Google Scholar]
- Hauglin, M.; Hansen, E.H.; Næsset, E.; Busterud, B.E.; Gjevestad, J.G.O.; Gobakken, T. Accurate single-tree positions from a harvester: A test of two global satellite-based positioning systems. Scand. J. For. Res. 2017, 32, 774–781. [Google Scholar] [CrossRef]
- DJI. Phantom 4 User Manual v1.6, DJI: Shenzhen, China, 2017.
- Agisoft. Agisoft Photoscan User Manual: Professional Edition, Version 1.3, Agisoft: St. Petersburg, Russia, 2017.
- Team, R.C. R: A Language and Environment for Statistical Computing; The R Foundation for Statistical Computing: Vienna, Austria, 2013. [Google Scholar]
- Pebesma, E.; Bivand, R.; Rowlingson, B.; Gomez-Rubio, V.; Hijmans, R.; Sumner, M.; MacQueen, D.; Lemon, J.; O’Brien, J. Sp: Classes and Methods for Spatial Data. Available online: https://cran.r-project.org/web/packages/sp/index.html (accessed on 20 December 2017).
- Bivand, R.; Keitt, T.; Rowlingson, B.; Pebesma, E.; Sumner, M.; Hijmans, R.; Rouault, E. Rgdal: Bindings for the ‘Geospatial’ Data Abstraction Library. Available online: https://cran.r-project.org/web/packages/rgdal/index.html (accessed on 20 December 2017).
- Hijmans, R.; van Etten, J.; Cheng, J.; Mattiuzzi, M.; Sumner, M.; Greenberg, J.A.; Lamigueiro, O.P.; Bevan, A.; Racine, E.B.; Shortridge, A.; et al. Raster: Geographic Data Analysis and Modeling. Available online: https://cran.r-project.org/web/packages/raster/index.html (accessed on 20 December 2017).
- Liaw, A.; Wiener, M. Classification and regression by randomforest. R News 2002, 2, 18–22. [Google Scholar]
- Zvoleff, A. Package ‘Glcm’. Available online: https://cran.r-project.org/web/packages/glcm/index.html (accessed on 20 December 2017).
- Fischler, M.A.; Bolles, R.C. Random sample consensus: A paradigm for model fitting with applications to image analysis and automated cartography. Commun. ACM 1981, 24, 381–395. [Google Scholar] [CrossRef]
Figure 1.
Overview of the sampling design for field data acquisition with a detail on a single field plot. The orthomosaic displayed in the background was the one derived from the Unmanned Aerial Vehicles (UAV) photogrammetric processing (i.e., ground sampling distance = 1.7 cm).
Figure 1.
Overview of the sampling design for field data acquisition with a detail on a single field plot. The orthomosaic displayed in the background was the one derived from the Unmanned Aerial Vehicles (UAV) photogrammetric processing (i.e., ground sampling distance = 1.7 cm).

Figure 2.
Mean tree-stump diameter distribution for the tree-stumps measured in the field.

Figure 3.
Different classes used for the field-based classification of the tree-stumps. Note that the covered tree-stump was visible only after the manual removal of the logging residuals over it.
Figure 3.
Different classes used for the field-based classification of the tree-stumps. Note that the covered tree-stump was visible only after the manual removal of the logging residuals over it.
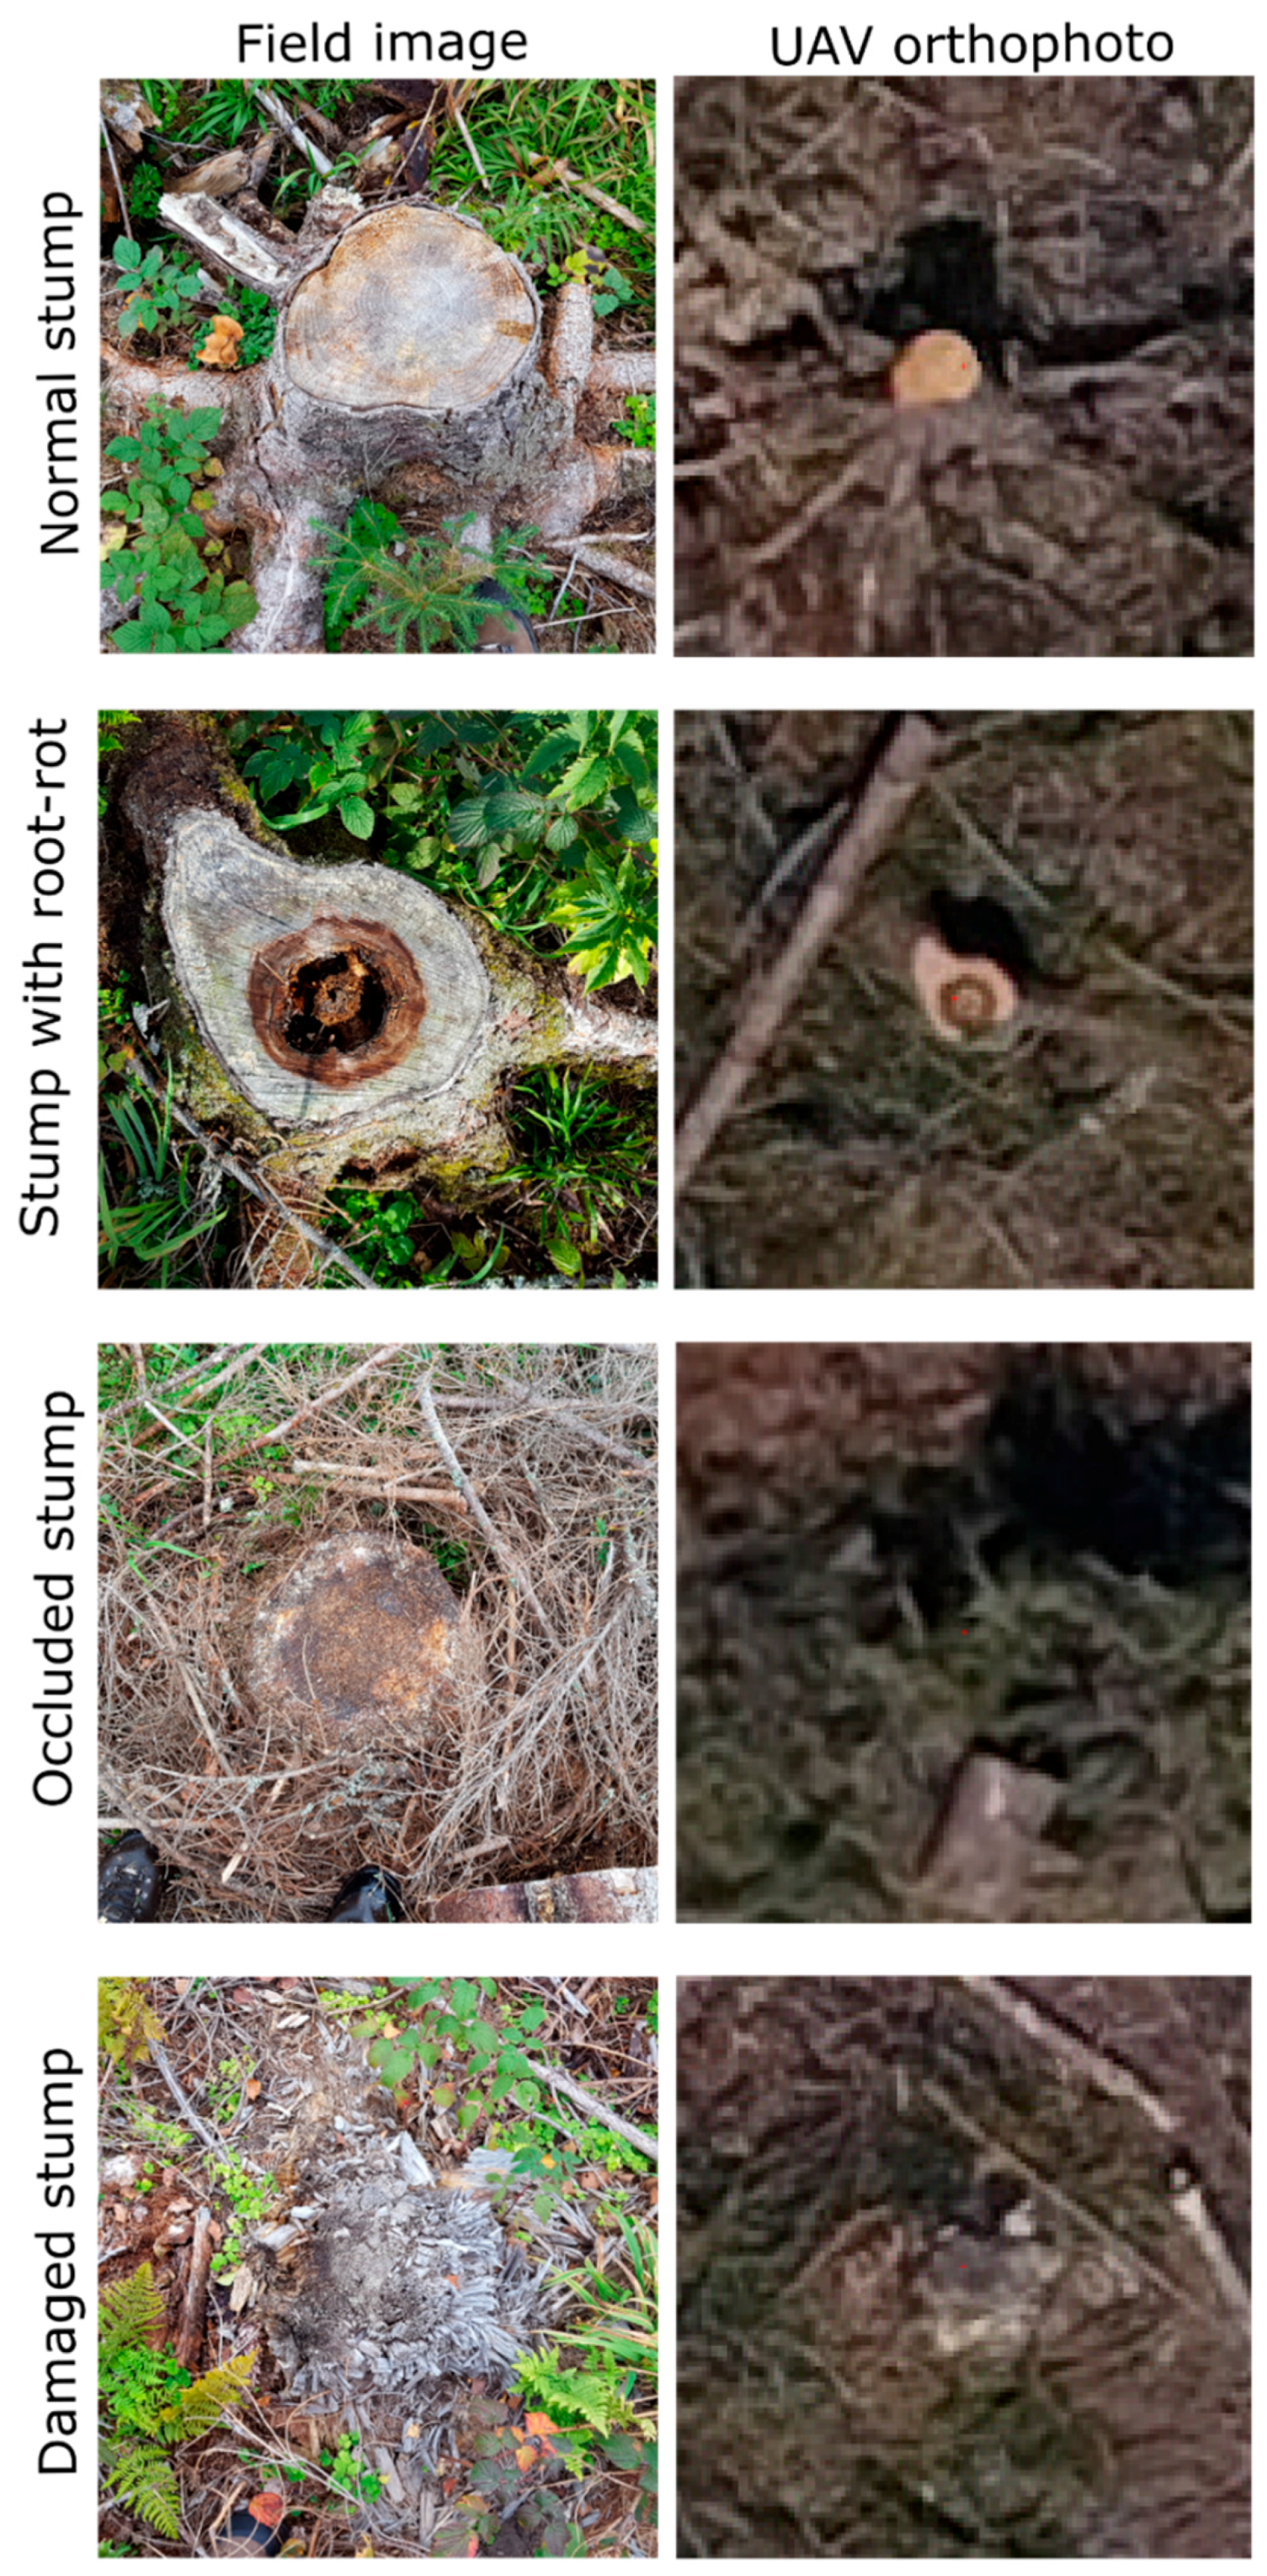
Figure 4.
Overview of the UAV data used for the purpose of this study: on the left the orthophoto with ground sampling distance (GSD) of 1.7 cm, and on the right the slope raster of GSD = 3.5 cm that was derived from the digital surface model. The slope raster is included exclusively for visualization purposes as it clearly shows the shape of the tree-stumps.

Figure 5.
Schematic representation of the step adopted in the proposed algorithm for tree-stump detection and segmentation. The example is provided for one of the 100 m2 tiles that were initially clipped. Throughout steps 1 to 4, the green polygons represent potential tree-stumps while in step 5 they represent the final detected tree-stumps, while the red polygons represent non-tree-stump objects. A detailed description of the different steps is provided in Section 3.1.

Figure 6.
Summary of the tree-stump detection validation, including the overall accuracy, omission, and commission errors for the four different strata.
Figure 6.
Summary of the tree-stump detection validation, including the overall accuracy, omission, and commission errors for the four different strata.
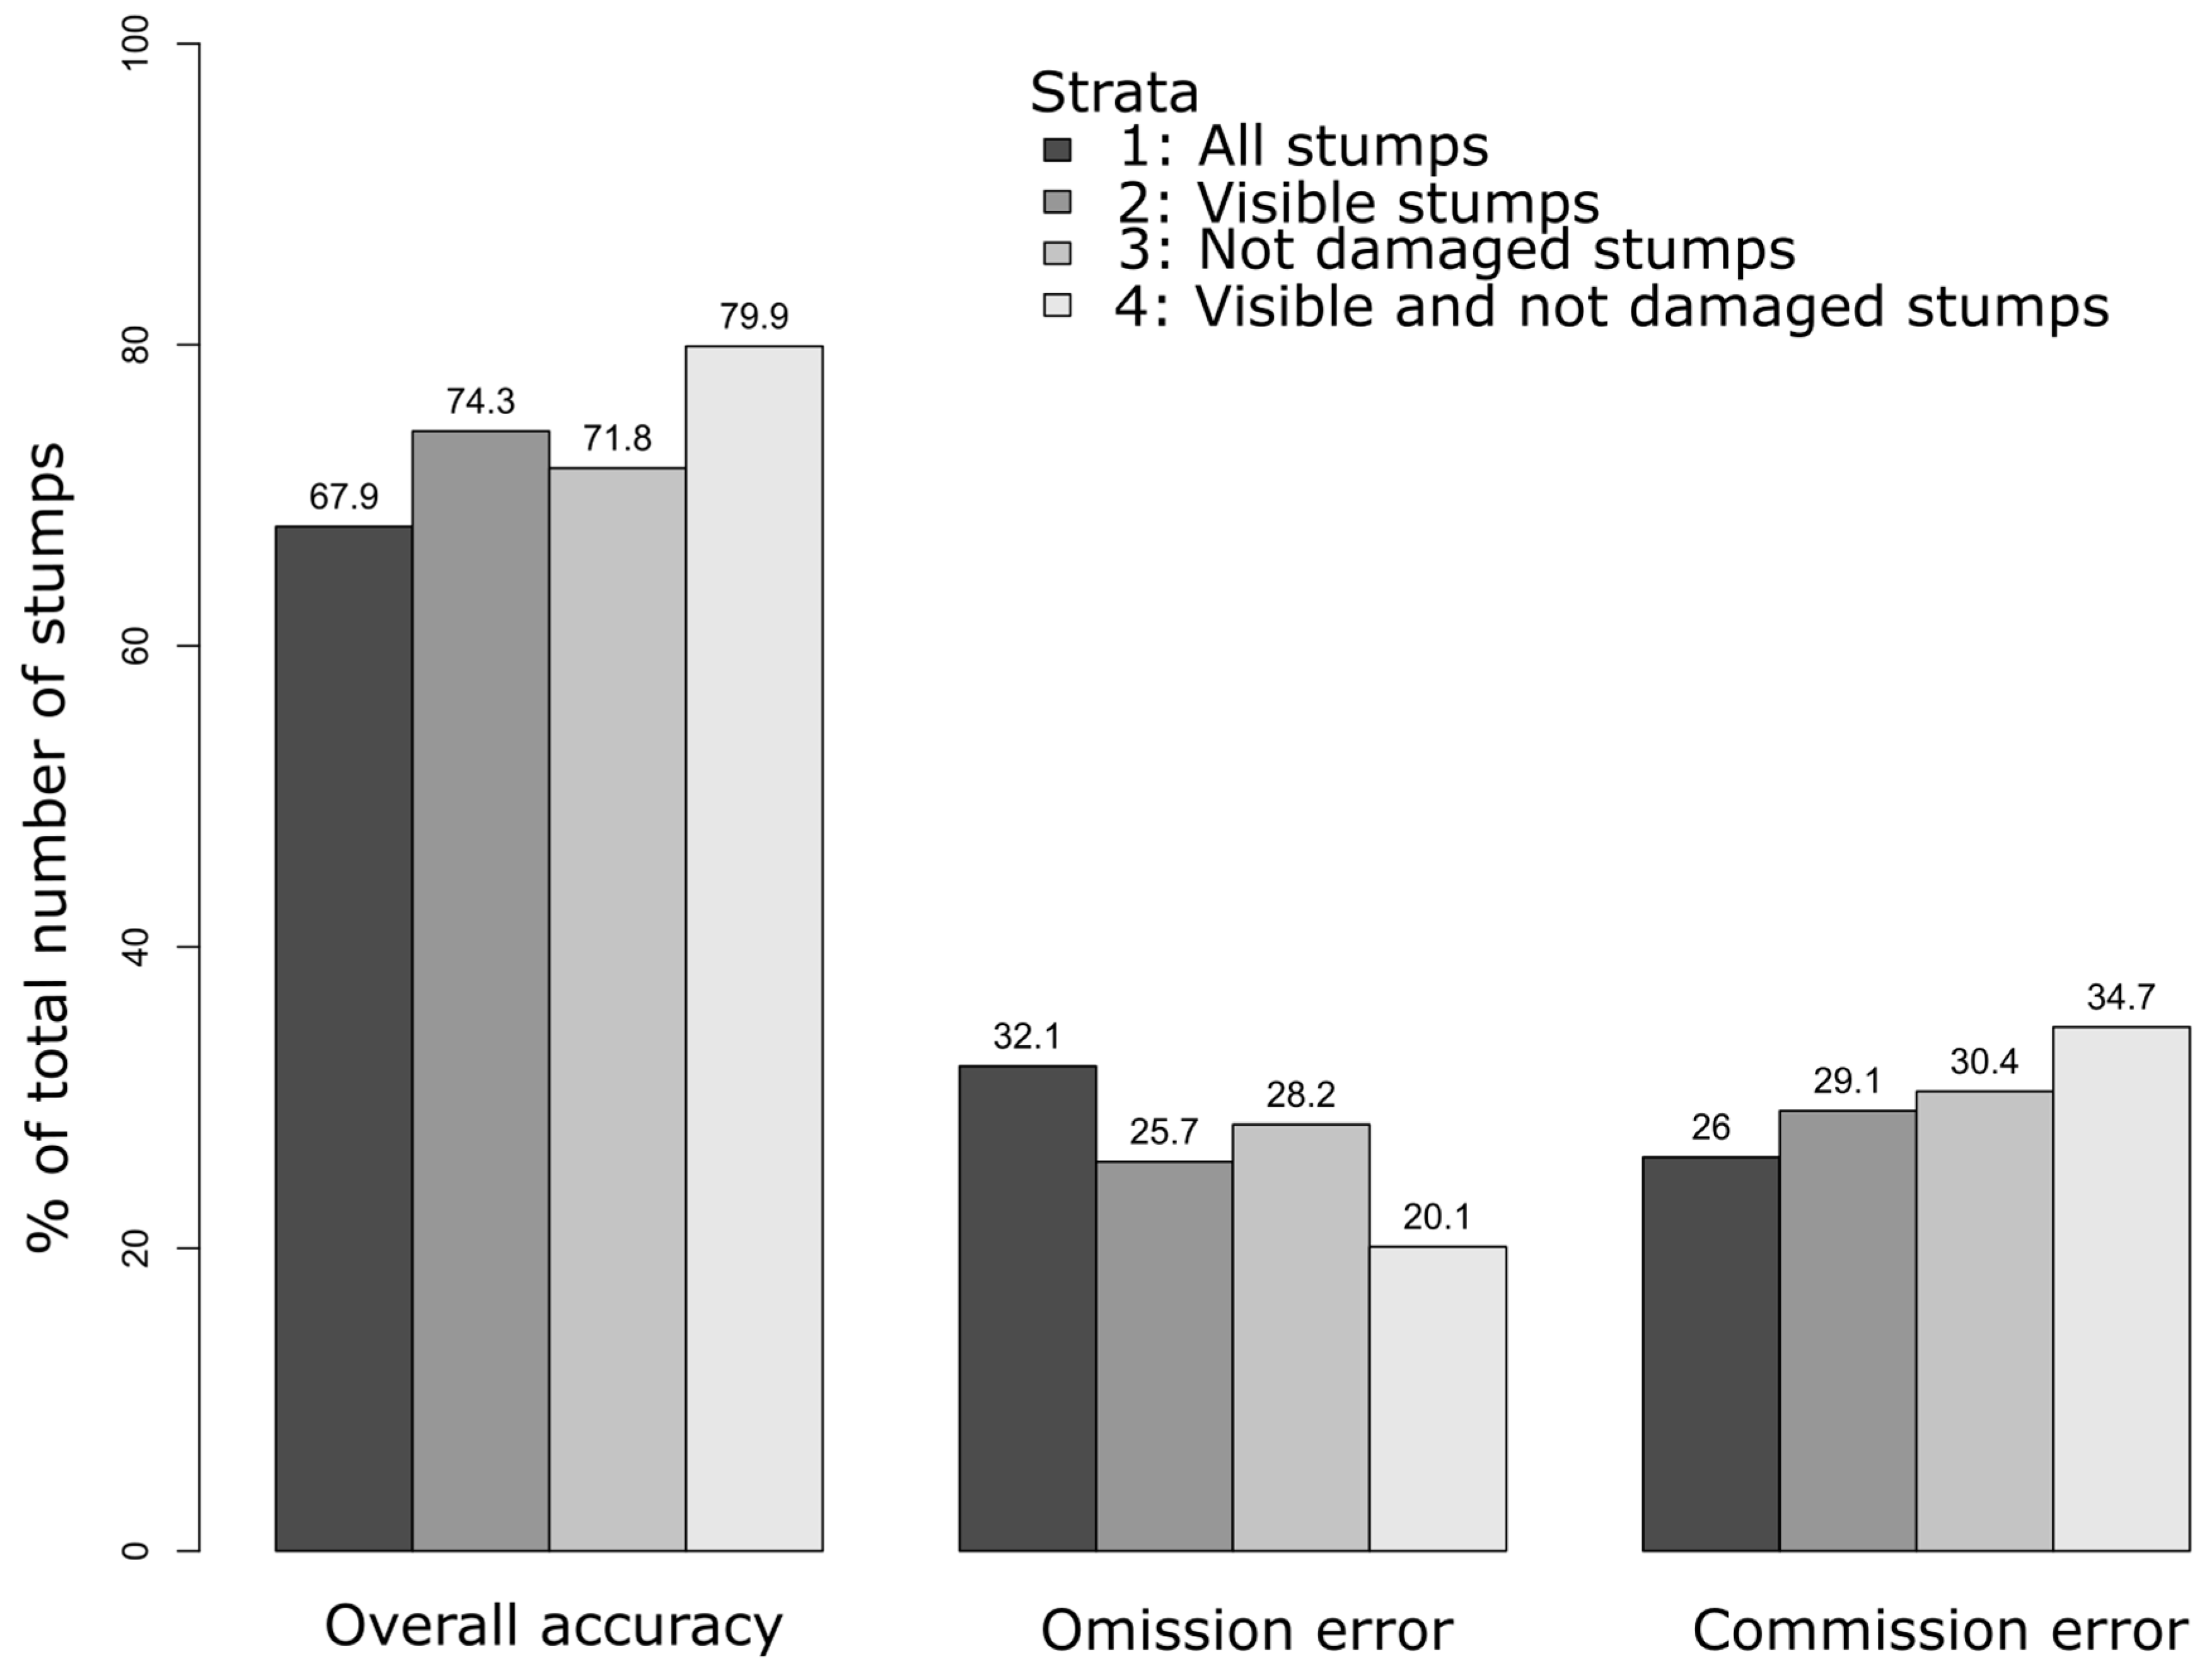
Figure 7.
Heat map of the stumps with presence of root- and butt-rot calculated using kernel density. The warmer colours represent areas with largest density of stumps with root- and butt-rot, while the colder colours represent areas where it is less prevalent.
Figure 7.
Heat map of the stumps with presence of root- and butt-rot calculated using kernel density. The warmer colours represent areas with largest density of stumps with root- and butt-rot, while the colder colours represent areas where it is less prevalent.
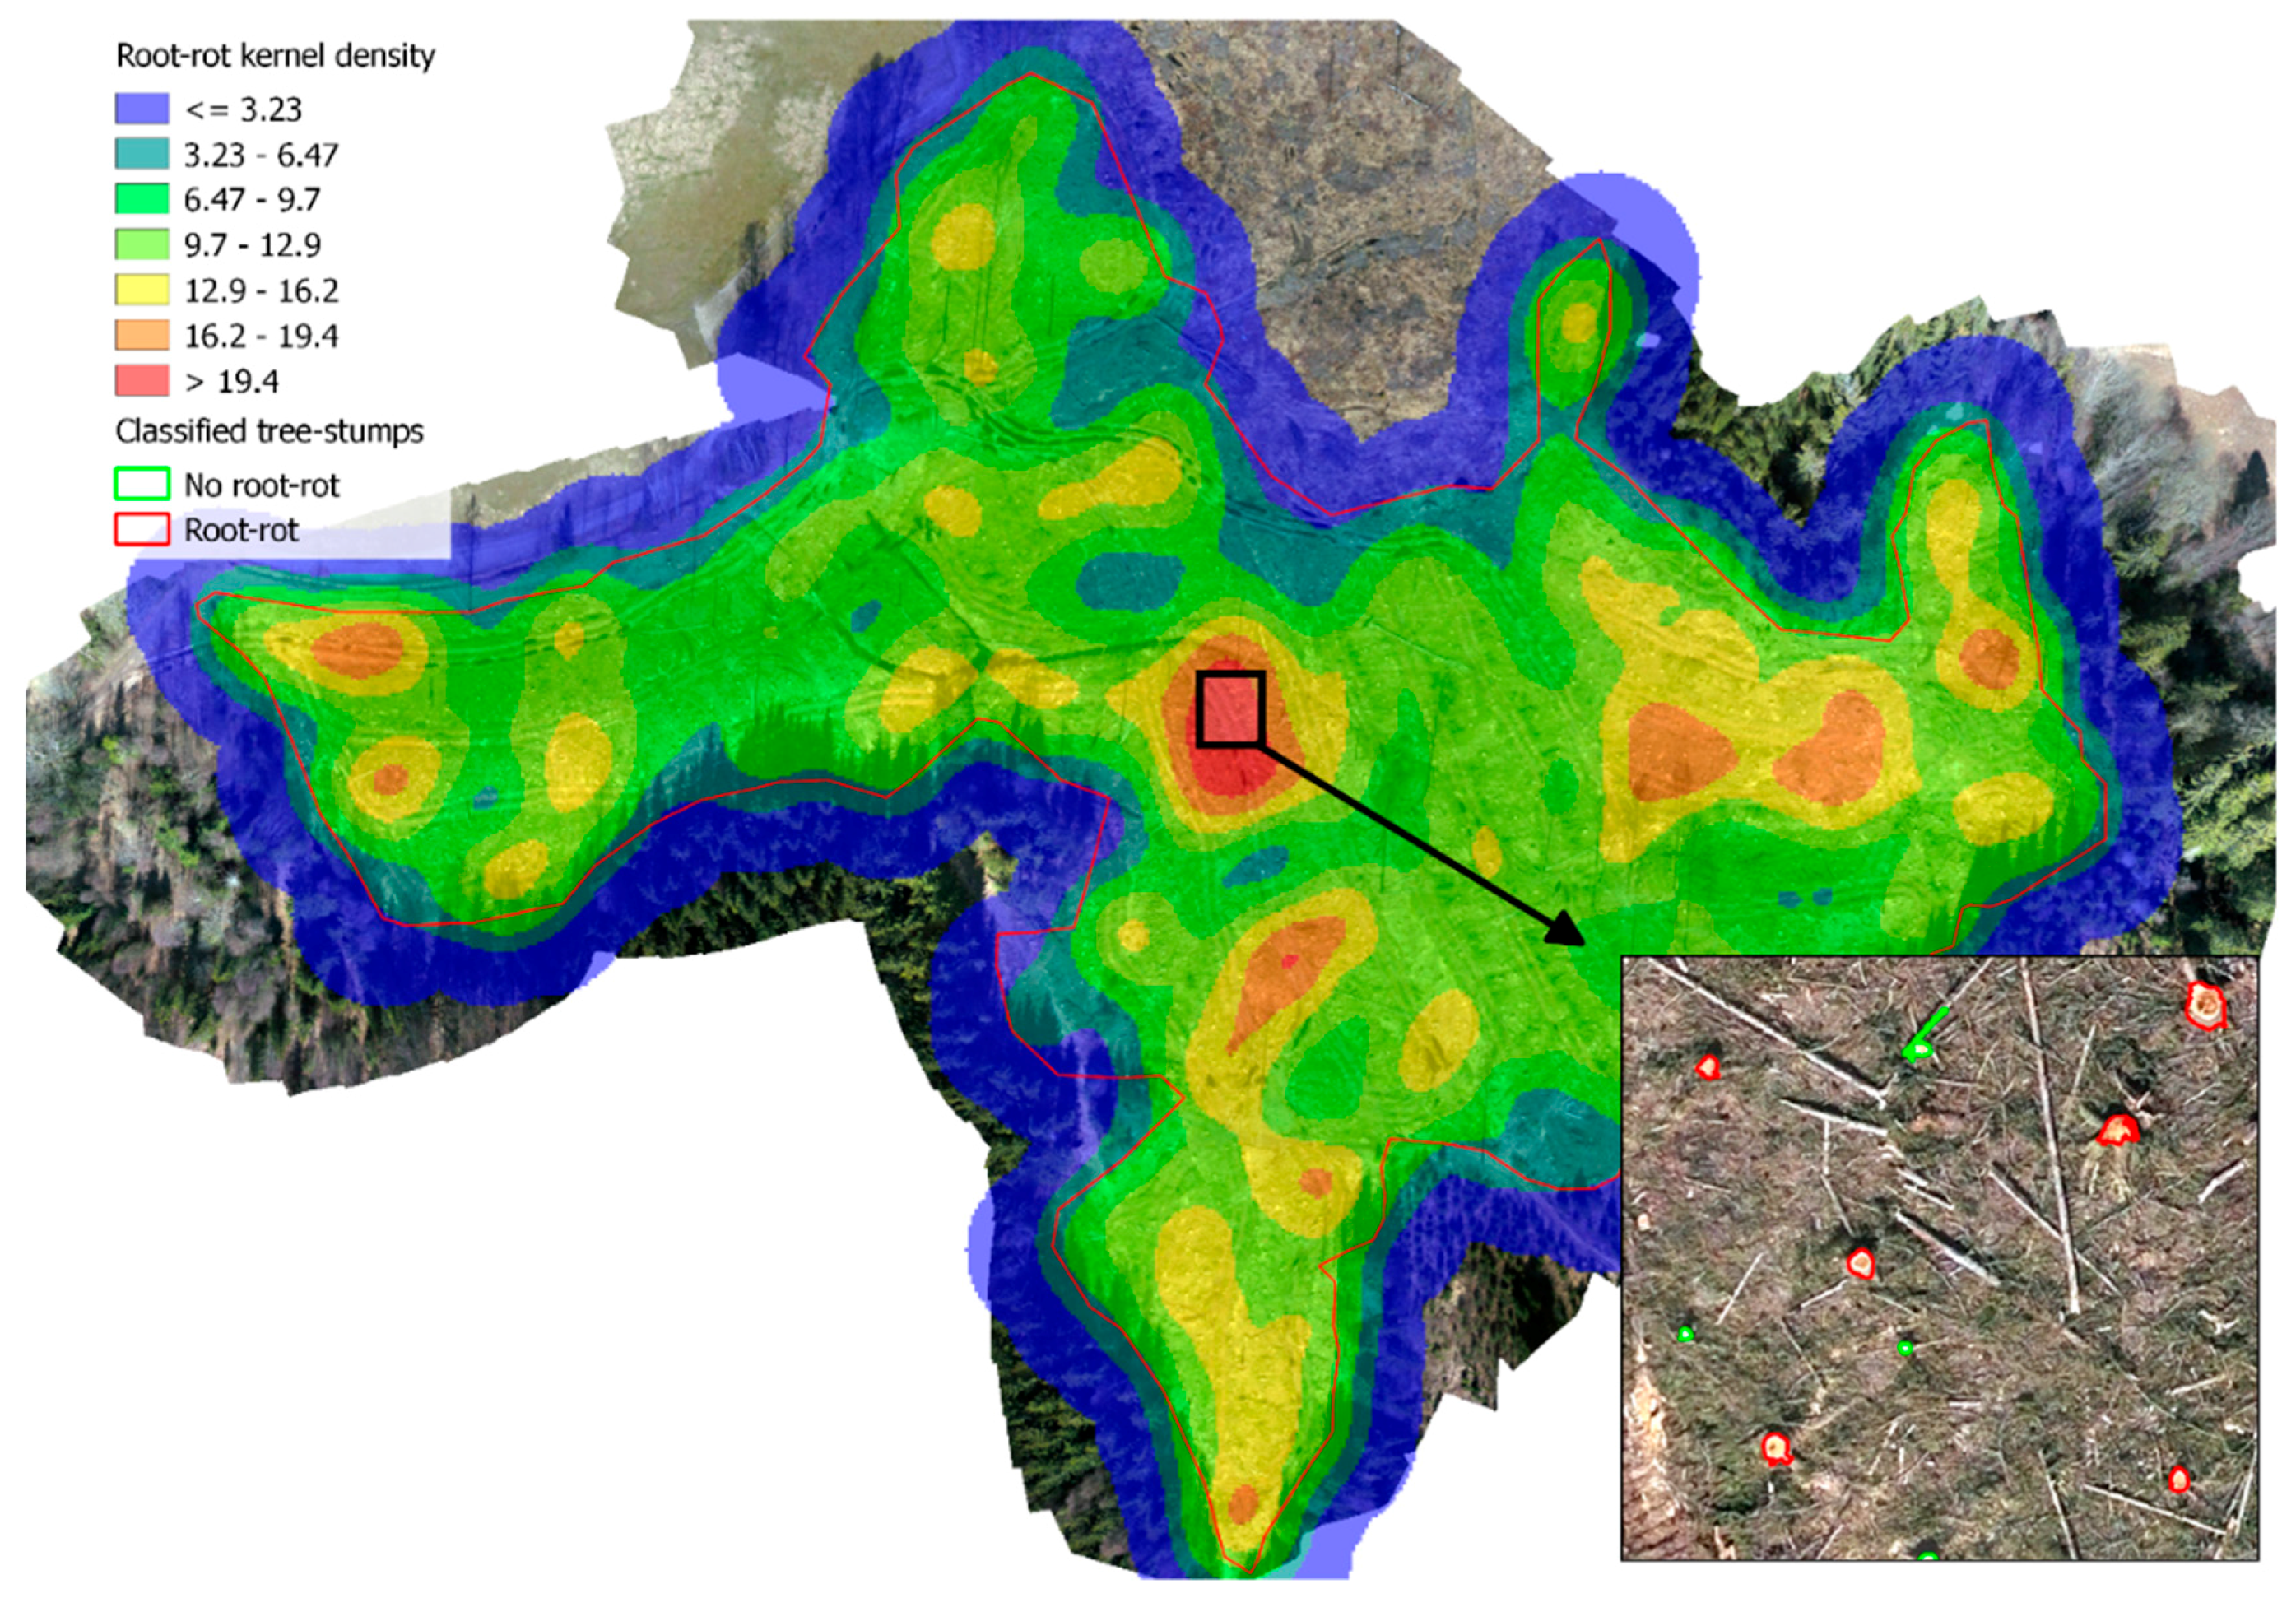
Figure 8.
Scatterplots of the mean between two field measured cross-sectional diameters () against the diameters obtained either through direct measurement (left panel) or through a diameter model (right panel). For the direct measurement method, the x-axis represented the diameter of the circumference with area equal to an ellipse fitted to the vertices of the segmented polygons (Diameter ellipse). For the modelling method, the x-axis represented the loocv predicted diameter.


Table 1.
Summary of the field-defined tree-stump classes in terms of number of tree-stumps (n) and percentage of the total number (%).
Table 1.
Summary of the field-defined tree-stump classes in terms of number of tree-stumps (n) and percentage of the total number (%).
| Variable | Rot Presence | Stump Occlusion | Damage | |||
|---|---|---|---|---|---|---|
| Absent | Present | Not Occluded | Occluded | Intact | Damaged | |
| n | 231 | 34 | 237 | 28 | 227 | 38 |
| % | 87% | 13% | 89% | 11% | 86% | 14% |
Table 2.
Accuracy assessment for the tree-stump detection according to six different 10 cm wide classes for stratum 1.
Table 2.
Accuracy assessment for the tree-stump detection according to six different 10 cm wide classes for stratum 1.
| Class. (cm) | Measured (n) | Detected (n) | Omitted (n) | Overall Accuracy (%) | Omission Error (%) |
|---|---|---|---|---|---|
| 0–10 | 7 | 2 | 5 | 28.6 | 71.4 |
| 10–20 | 49 | 25 | 24 | 51.0 | 49.0 |
| 20–30 | 87 | 54 | 33 | 62.1 | 37.9 |
| 30–40 | 79 | 63 | 16 | 79.7 | 20.3 |
| 40–50 | 41 | 34 | 7 | 82.9 | 17.1 |
| 50–60 | 2 | 2 | 0 | 100.0 | 0.0 |
Table 3.
Confusion matrix for the classification of presence or absence of root- and butt-rot on the tree-stumps.
Table 3.
Confusion matrix for the classification of presence or absence of root- and butt-rot on the tree-stumps.
| No. Rot | Root- and Butt-Rot | Classification Accuracy | |
|---|---|---|---|
| No rot | 114 | 39 | 74.5% |
| Root- and butt-rot | 28 | 128 | 82.1% |
| Overall Accuracy | 78.3% |
Table 4.
Summary of the accuracy assessment of the measurement of the mean diameter using either the direct measurement approach or the modelling approach. The results are reported for , , and their respective values as percentage of the mean observed mean diameter (, ).
Table 4.
Summary of the accuracy assessment of the measurement of the mean diameter using either the direct measurement approach or the modelling approach. The results are reported for , , and their respective values as percentage of the mean observed mean diameter (, ).
| Measurement Method | (cm) | (cm) | ||
|---|---|---|---|---|
| Direct measurement | 7.5 | 23.6% | 3.3 | 10.7% |
| Model | 6.4 | 20.2% | −0.004 | −0.013% |
© 2018 by the authors. Licensee MDPI, Basel, Switzerland. This article is an open access article distributed under the terms and conditions of the Creative Commons Attribution (CC BY) license (http://creativecommons.org/licenses/by/4.0/).
Share and Cite
MDPI and ACS Style
Puliti, S.; Talbot, B.; Astrup, R. Tree-Stump Detection, Segmentation, Classification, and Measurement Using Unmanned Aerial Vehicle (UAV) Imagery. Forests 2018, 9, 102. https://doi.org/10.3390/f9030102
AMA Style
Puliti S, Talbot B, Astrup R. Tree-Stump Detection, Segmentation, Classification, and Measurement Using Unmanned Aerial Vehicle (UAV) Imagery. Forests. 2018; 9(3):102. https://doi.org/10.3390/f9030102
Chicago/Turabian StylePuliti, Stefano, Bruce Talbot, and Rasmus Astrup. 2018. "Tree-Stump Detection, Segmentation, Classification, and Measurement Using Unmanned Aerial Vehicle (UAV) Imagery" Forests 9, no. 3: 102. https://doi.org/10.3390/f9030102
Note that from the first issue of 2016, this journal uses article numbers instead of page numbers. See further details here.