Article

Predicting Shifts in the Suitable Climatic Distribution of Walnut (Juglans regia L.) in China: Maximum Entropy Model Paves the Way to Forest Management

Research Center for Engineering Ecology and Nonlinear Science, North China Electric Power University, Beijing 102206, China
*
Author to whom correspondence should be addressed.
Forests 2018, 9(3), 103; https://doi.org/10.3390/f9030103
Submission received: 15 November 2017 / Revised: 20 February 2018 / Accepted: 26 February 2018 / Published: 28 February 2018
(This article belongs to the Special Issue Forest Sustainable Management)

Abstract

:
Cultivation of woody oil plants in environmentally suitable habitats is a successful ecological solution for oil development and forest management. In this study, we predicted the influences of future climate change on the potentially suitable climatic distribution of an important woody oil plant species (walnut; Juglans regia L.) in China based on given climate change scenarios and the maximum entropy (MaxEnt) model. The MaxEnt model showed that the minimum temperature of the coldest month and annual precipitation were the most important determinant variables limiting the geographical distribution of J. regia. We have found that the current suitable environmental habitat of J. regia is mainly distributed in central and southwestern China. Results of the MaxEnt model showed that global warming in the coming half-century may lead to an increase in the area size of environmentally suitable habitats for J. regia in China, indicating more lands available for artificial cultivation and oil production. However, those suitable habitat gains may be practically inaccessible due to over-harvest and urban development, and effective management strategies are urgently needed to establish those forests. This research will provide theoretical suggestions for the protection, cultivation management, and sustainable utilization of J. regia resources to face the challenge of global climate change.

1. Introduction

Global climate change is occurring at an unprecedented rate. Average temperatures have increased by 0.85 °C in the last century and are predicted to continue to increase by a minimum of 0.3–1.7 °C to a maximum of 2.6–4.8 °C by 2100 [1]. Climate has significantly affected the growth and reproduction of plants and has therefore become a dominating variable determining the geographical distribution of plant species [2,3,4]. Due to the threat of global warming, the lack of rational utilization, and the lack of effective protection on wild plant resources, some important economic plant species have sharply contracted their geographical distribution, or even gone extinct [5]. Artificial cultivation is one of the most effective tools to conserve and restore those economically important plants in order to face the challenge of global climate change [6]. Meanwhile, artificial cultivation will also meet the market demand for those plant resources [7]. However, successful artificial cultivation of high-quality plants depends on both good germplasm resources and suitable environmental conditions [8,9]. Accordingly, identifying the suitable environmental habitats for the target plant species as affected by global climate change has great economic and ecological value.
Species distribution models (SDMs) are powerful tools to assess the current and future potential geographical distributions of target species, relying on the statistical correlation between species existence and corresponding environmental variables [10,11,12,13]. Among SDMs, the maximum entropy (MaxEnt) model is the most popular one to simulate species distribution based on species presence-only records, which are usually readily available from digital specimen museums and published literature [14,15,16]. The MaxEnt model has been widely used to evaluate the relationship between species distribution and determinant variables and to predict the response of species geographical distribution to global climate change [17,18,19,20]. Many studies have found that the MaxEnt model typically outperforms other methods in terms of high predictive accuracy and high tolerance to extremely small sample size [21,22,23].
Commonly known as the walnut, Juglans regia L. is a deciduous tree species belonging to the genus Juglans and family Juglandaceae, and is ranked first among the four nut types in the world [24]. It is widely disseminated in Asia, North and South America, Europe, South Africa, Australia, and New Zealand [25]. J. Regia originated in China and has a long history of cultivation [26]. Moreover, China is the largest consumer of vegetable oil in the world, with an annual consumption of 30 million tons [27]. However, nearly seventy percent of the vegetable oil consumption in China depends on imports [27]. Accordingly, J. Regia has gained attention as an important local woody oil plant species in China, which can be used as the raw material to develop the local woody oil industry [28]. Therefore, it is necessary and important to predict how global climate change will impact the potentially suitable climatic distribution of J. regia in China.
Here, we predicted the current and future suitable climatic distributions of J. regia given global climate change using the MaxEnt model. We aimed to (i) explore the relative importance of environmental variables on the geographical range of J. regia; (ii) evaluate the ecological niches and environmental tolerance of J. regia; (iii) delineate the environmentally suitable habitat maps for J. regia; (iv) indicate the habitat change of J. regia responding to global climate change; and (v) ultimately provide the theoretical basis for protective strategy formulation and cultivation management of this woody oil plant species.

2. Materials and Methods

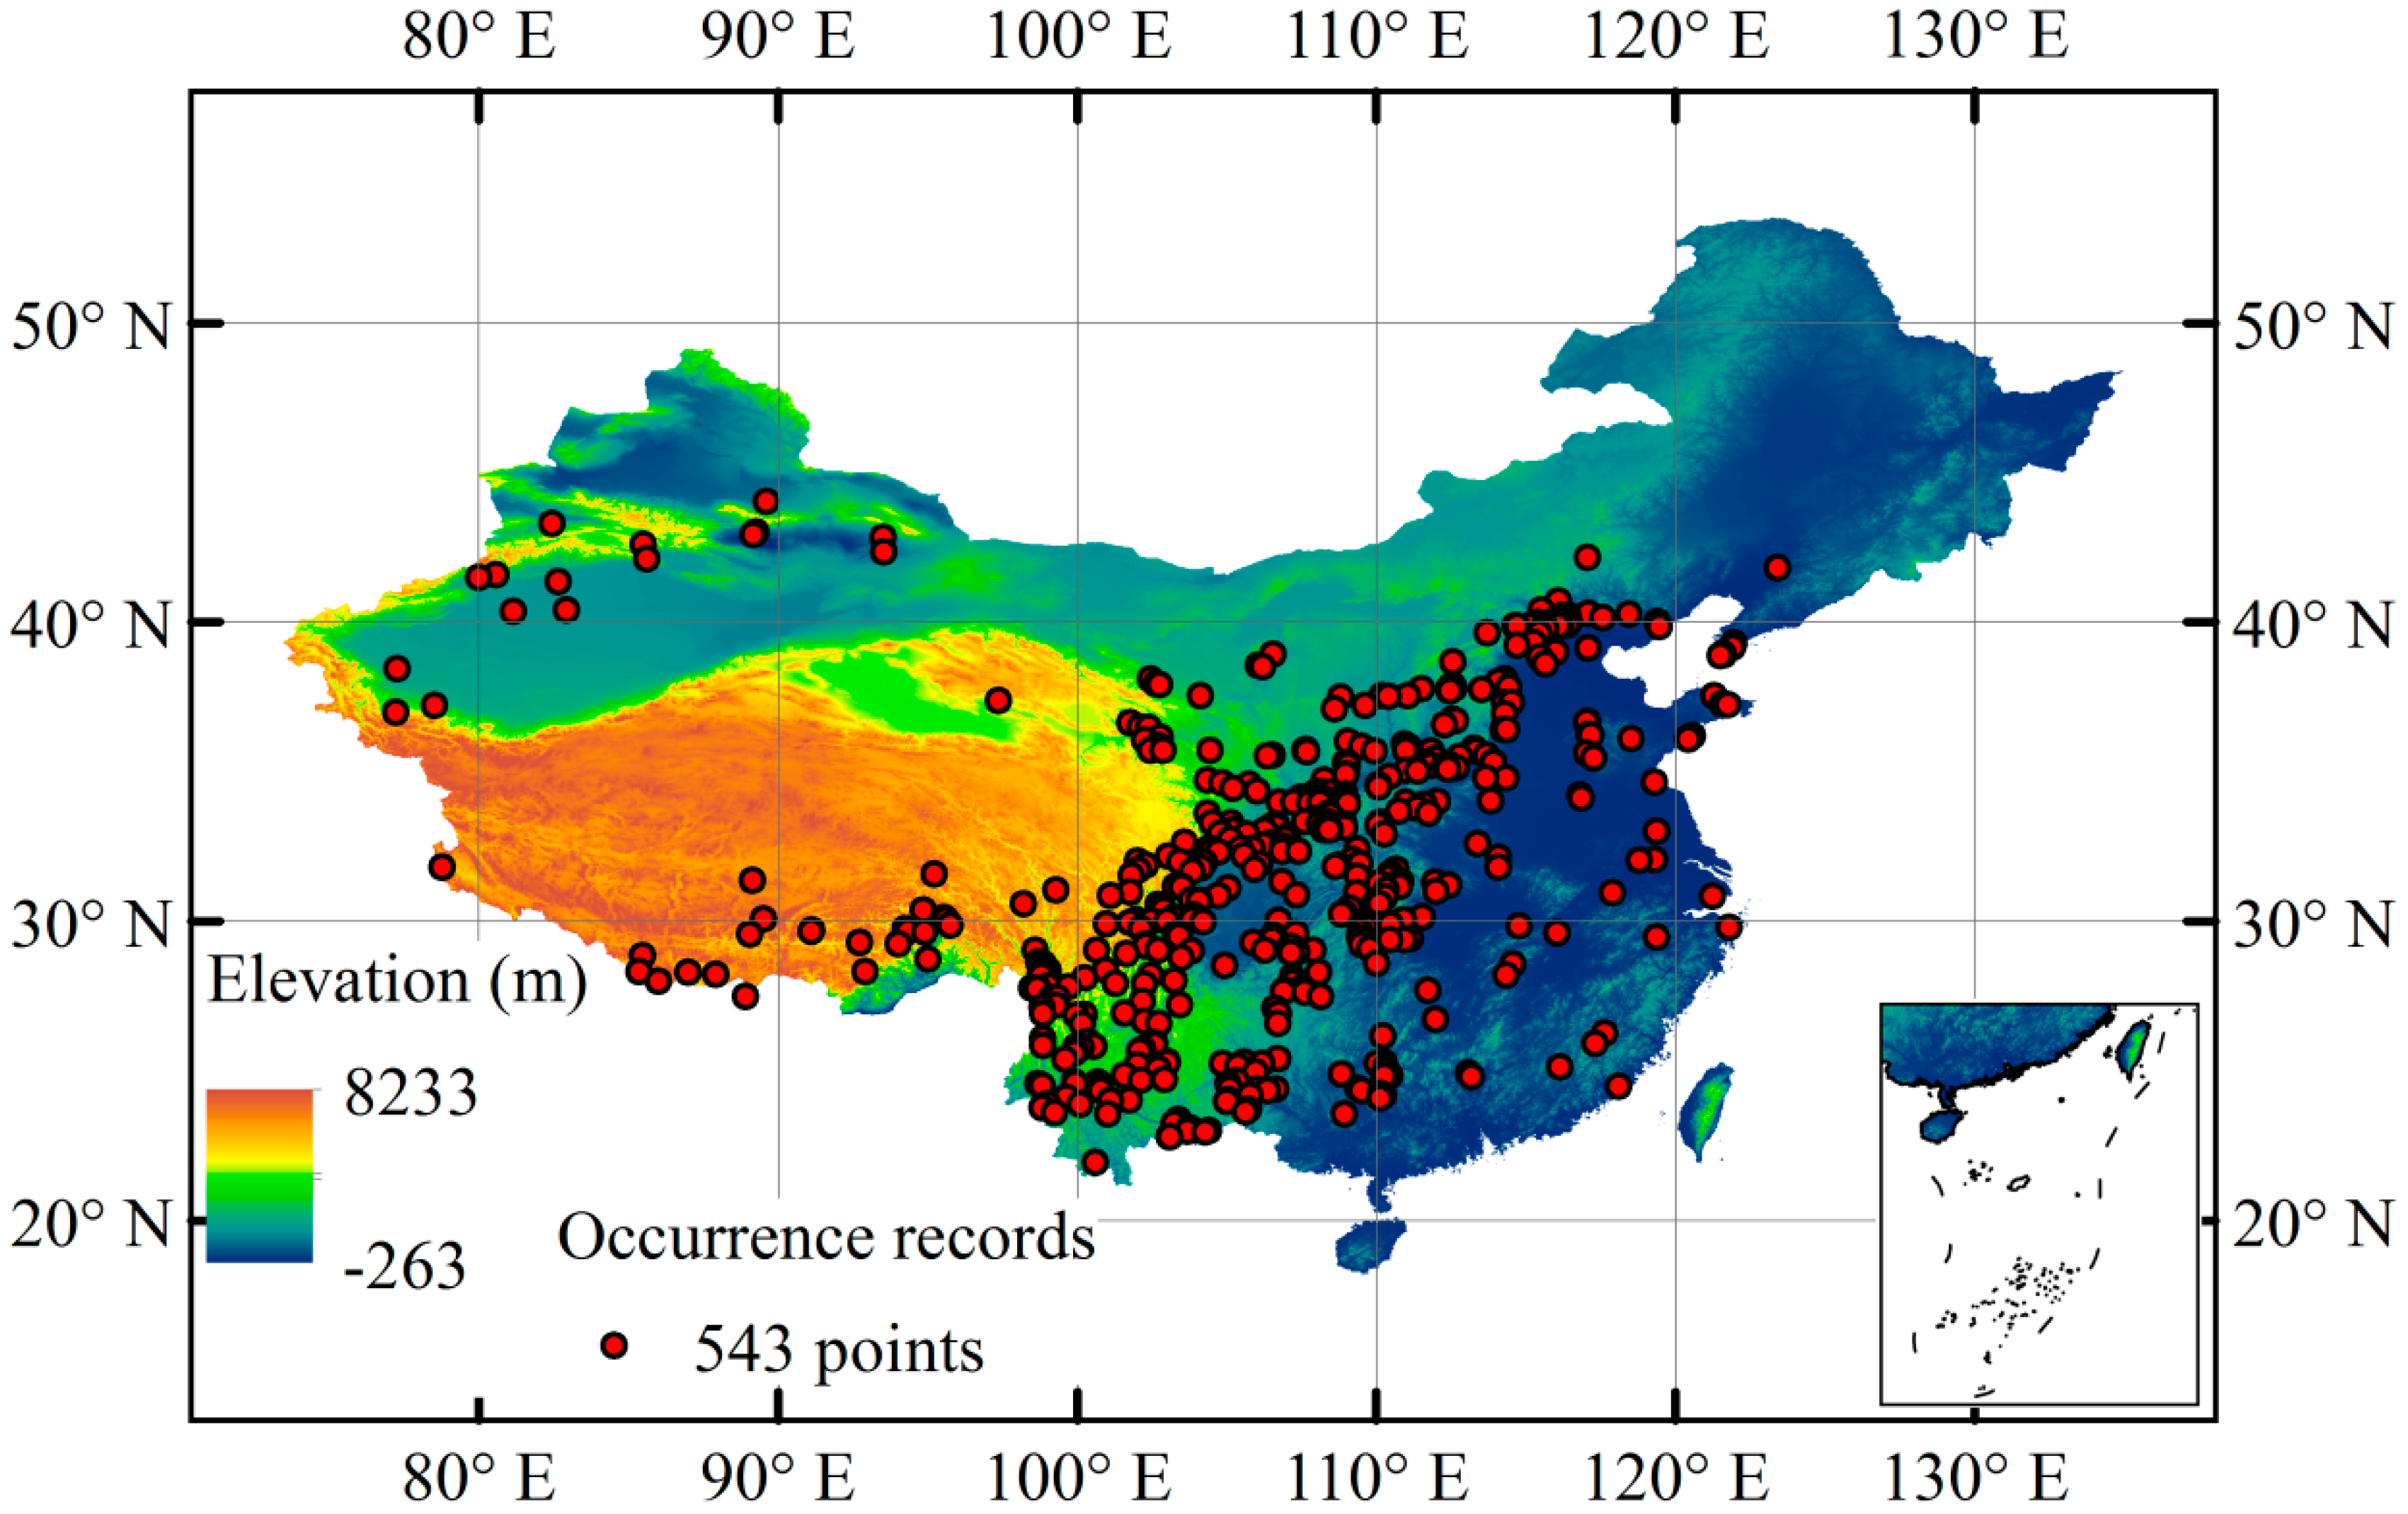
2.1. Species Occurrence Records

We collected the specimen records of J. regia from the Chinese Virtual Herbarium (CVH) [29] and the Global Biodiversity Information Facility (GBIF) [30]. Cultivated records were identified based on the specimen label and then removed to avoid anthropogenic disturbance. To match the spatial resolution of environmental variables (~1 × 1 km, detailed below), we performed spatial filtering of presence points on a 1 km2 grid. Finally, we obtained 543 occurrence points of J. regia in China at a spatial resolution of 1 km (Figure 1; Appendix A).

2.2. Environmental Variables

We selected 33 environmental variables—16 bioclimatic, 3 topographical, and 14 soil variables—to model the potentially suitable environmental distribution of J. regia (Table 1). Bioclimatic variables were downloaded from the global database WorldClim (http://www.worldclim.org/) at a spatial resolution of 30 arcseconds (ca. 1 × 1 km) [31]. Raster layers in WorldClim were obtained by spatial interpolation on monthly values of temperature and precipitation ranging over the time period from 1950 to 2000 from numerous weather stations around the world [31]. WorldClim provided 19 bioclimatic variables, but only 16 variables were used in this study because 3 variables—isothermality (Bio3), precipitation of the driest month (Bio14), precipitation seasonality (Bio15)—are clearly biased when projected to past and future scenarios, and thus must be excluded [32,33]. We also extracted the elevation variable from WorldClim and calculated a topographical variable (i.e., aspect) based on elevation in ArcGIS 10.3 (ESRI, Redlands, CA, USA). Then, the elevation variable was projected in a meter coordinate system and another topographical variable (i.e., slope) was calculated based on elevation in ArcGIS 10.3. Soil variables were obtained from the Harmonized World Soil Database (HWSD) (http://www.iiasa.ac.at/web/home/research/researchPrograms/water/HWSD.html), which contains raster data layers on key soil properties at the spatial resolution of 30 arcseconds [34].
To predict the potentially suitable environmental distribution and suitable habitat change under future climate change, we collected projected bioclimatic variables from low to high representative concentration pathways (RCP 2.6, RCP 4.5, RCP 6.0, and RCP 8.5) for 2041–2060 and 2061–2080. We chose the BCC-CSM1.1 (Beijing Climate Centre–Climate System Modelling 1.1; available from www.worldclim.com) as it is one of the most widely used general circulation models (GCMs) in the Asia region [35,36]. We assumed that the 3 topographical and 14 soil variables remain unchanged in the coming 70 years.

2.3. Correlation Analysis and Principal Component Analysis

The Pearson correlation coefficients (r) among the 16 bioclimatic variables, 3 topographical variables, and 14 soil variables were calculated in ArcGIS 10.3 (band collection statistics tool). If a pair of variables were strongly correlated (|r| ≥ 0.8), one of the variables was removed to avoid the violation of statistical assumptions and avoid model predictions induced by multicollinearity among environmental variables [37,38]. To select the remaining variables, we conducted principal component analysis (PCA) to reveal the relative importance of each variable for the potentially suitable environmental distribution of J. regia based on its 543 occurrence points. The variables showing the higher ecological importance for J. regia were retained in the following analysis.

2.4. MaxEnt Models

MaxEnt 3.3.3. was used to project the potentially suitable environmental distribution of J. regia [39]. In MaxEnt 3.3.3k, we set the number of random background points as 10,000. We randomly selected 80% of J. regia occurrence points to train the MaxEnt model and the remaining points to validate the model. Five replicates were run to carry out the MaxEnt model. We used Jackknife to evaluate the relative importance of each environmental variable. The area under the receiver operating characteristic curve (AUC) was used to estimate the accuracy of the model predictions [40,41].
The MaxEnt model generated continuous probability values for the presence of J. regia, ranging from 0 to 1. To delineate the presence/absence map of J. regia, those continuous probability values were converted to the binary prediction (i.e., a pixel is considered as either suitable or not for the presence of J. regia) based on a threshold probability value. This threshold probability was determined according to the ‘maximum training sensitivity plus specificity’ criterion. This criterion optimizes the trade-off between sensitivity and specificity using the training data and, therefore, has been recognized as one of the best threshold selection methods [42,43,44]. This presence/absence map was then used to analyze the spatial range changes of J. regia.
To delineate the pattern of predicted habitat change, we defined ‘habitat gain’ where a habitat is not suitable for J. regia under the current climate conditions, but becomes suitable under the future climate. If some habitat is suitable for J. regia under the current climate, but no longer suitable under the future climate, we called it ‘habitat loss’. If a suitable habitat under the current climate is still suitable for J. regia under the future climate, we defined it as ‘unchanged’. The centroids of suitable habitats were also calculated under current and future conditions, and were helpful as they clearly show the shift of the suitable habitat responding to global climate change.

3. Results

3.1. Model Evaluation and Variables’ Contribution

We found weak correlations among topographical variables. Therefore, three topographical variables were retained in the MaxEnt model. The bioclimatic and soil variables showing the higher ecological importance for J. regia are shown in Table A1 and Table A2. Finally, we obtained 19 variables to be incorporated in the MaxEnt software: maximum temperature of the warmest month (MTWM), minimum temperature of the coldest month (MTCM), temperature annual range (TAR), annual precipitation (AP), elevation, slope, aspect, topsoil bulk density (t_bulk_den), subsoil bulk density (s_bulk_den), topsoil clay fraction (t_clay), topsoil gravel content (t_gravel), subsoil gravel content (s_gravel), topsoil pH (H2O) (t_ph_h20), topsoil sodicity (ESP, exchangeable sodium percentage) (t_esp), subsoil sodicity (ESP, exchangeable sodium percentage) (s_esp), topsoil sand fraction (t_sand), subsoil sand fraction (s_sand), topsoil silt fraction (t_silt), and subsoil silt fraction (s_silt).
The MaxEnt model for J. regia showed a reliable prediction with an AUC of 0.843 (± 0.008), greater than the 0.5 of a random model. MTCM contributed most to the model, followed by AP and TAR (Table 1). Those three variables cumulatively contributed 83.6% to the geographical distribution of J. regia in China. In particular, the cumulative contributions of bioclimatic, topographical, and soil variables were 85.6%, 8.7%, and 5.7%, respectively.

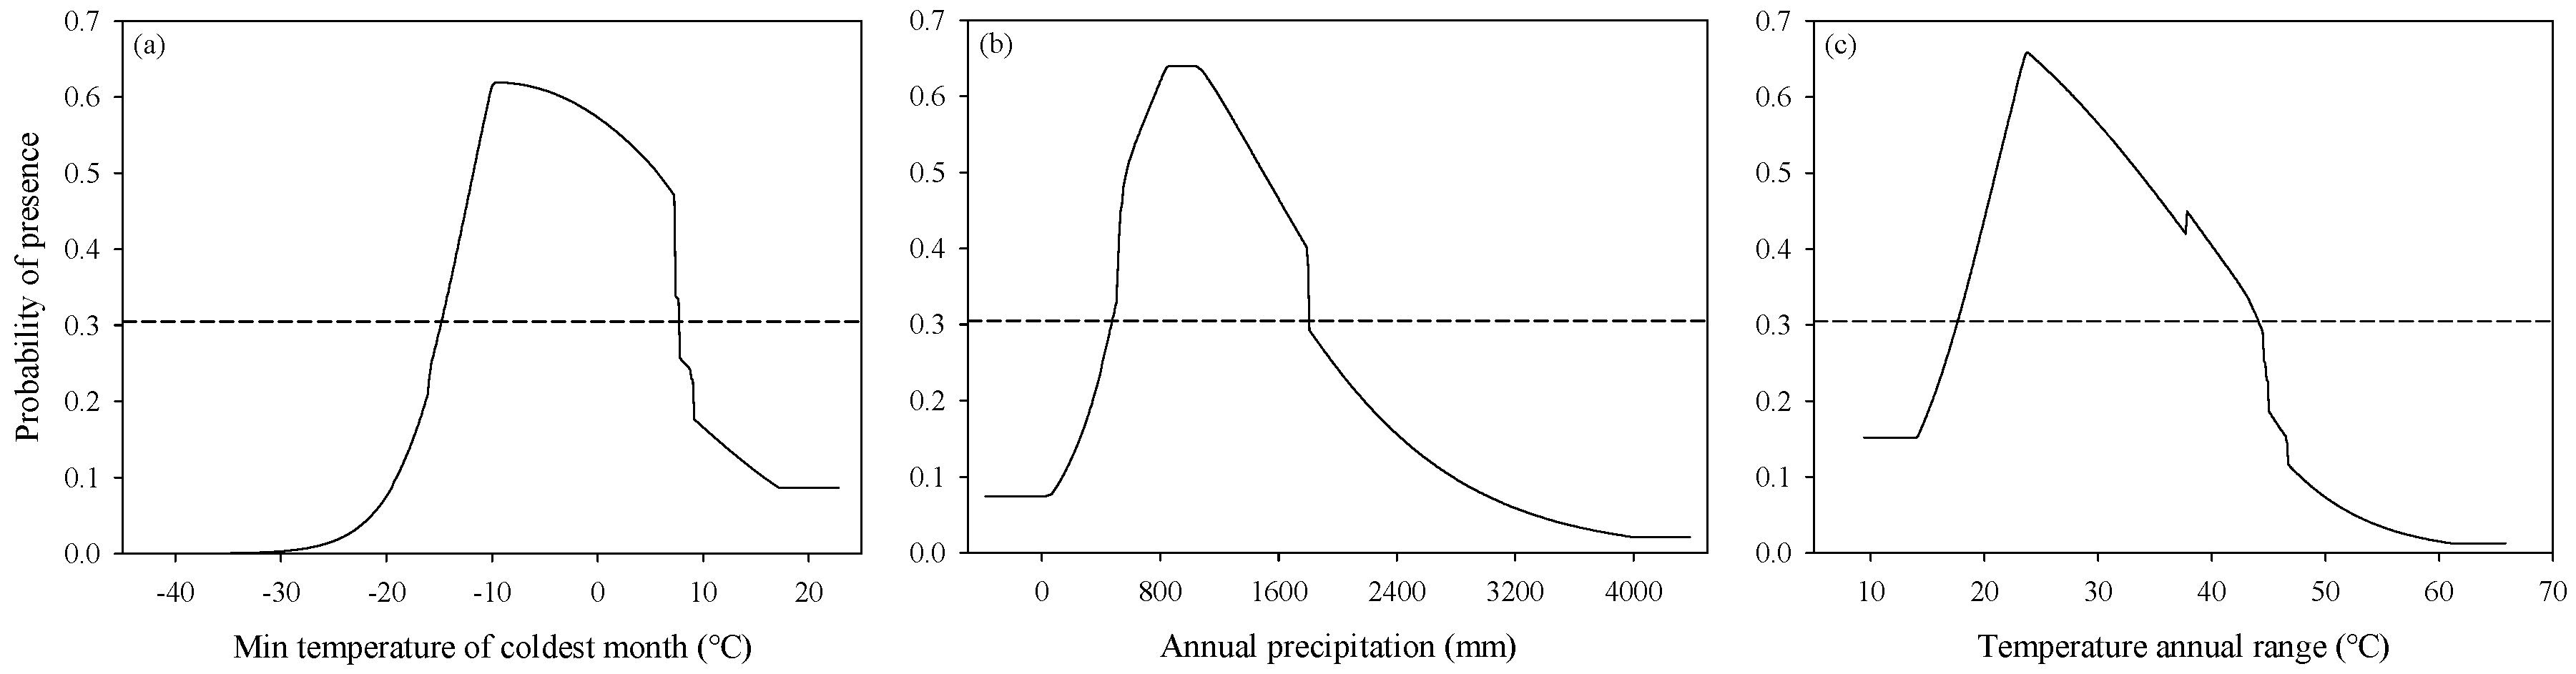
3.2. Response of Variables to Suitability

Response curves illustrate how the probability of J. regia presence changes as each environmental variable changes (Figure 2). The habitat suitability of J. regia is hump-shaped with increasing MTCM, AP, and TAR. We obtained the threshold probability (i.e., 0.31) indicative of J. regia presence based on the rule of maximum training sensitivity plus specificity. MTCM ranging from –14.8 °C to 7.7 °C, AP ranging from 480 mm to 1804 mm, and TAR ranging from 17.7 °C to 44.1 °C are suitable for the distribution of J. regia.

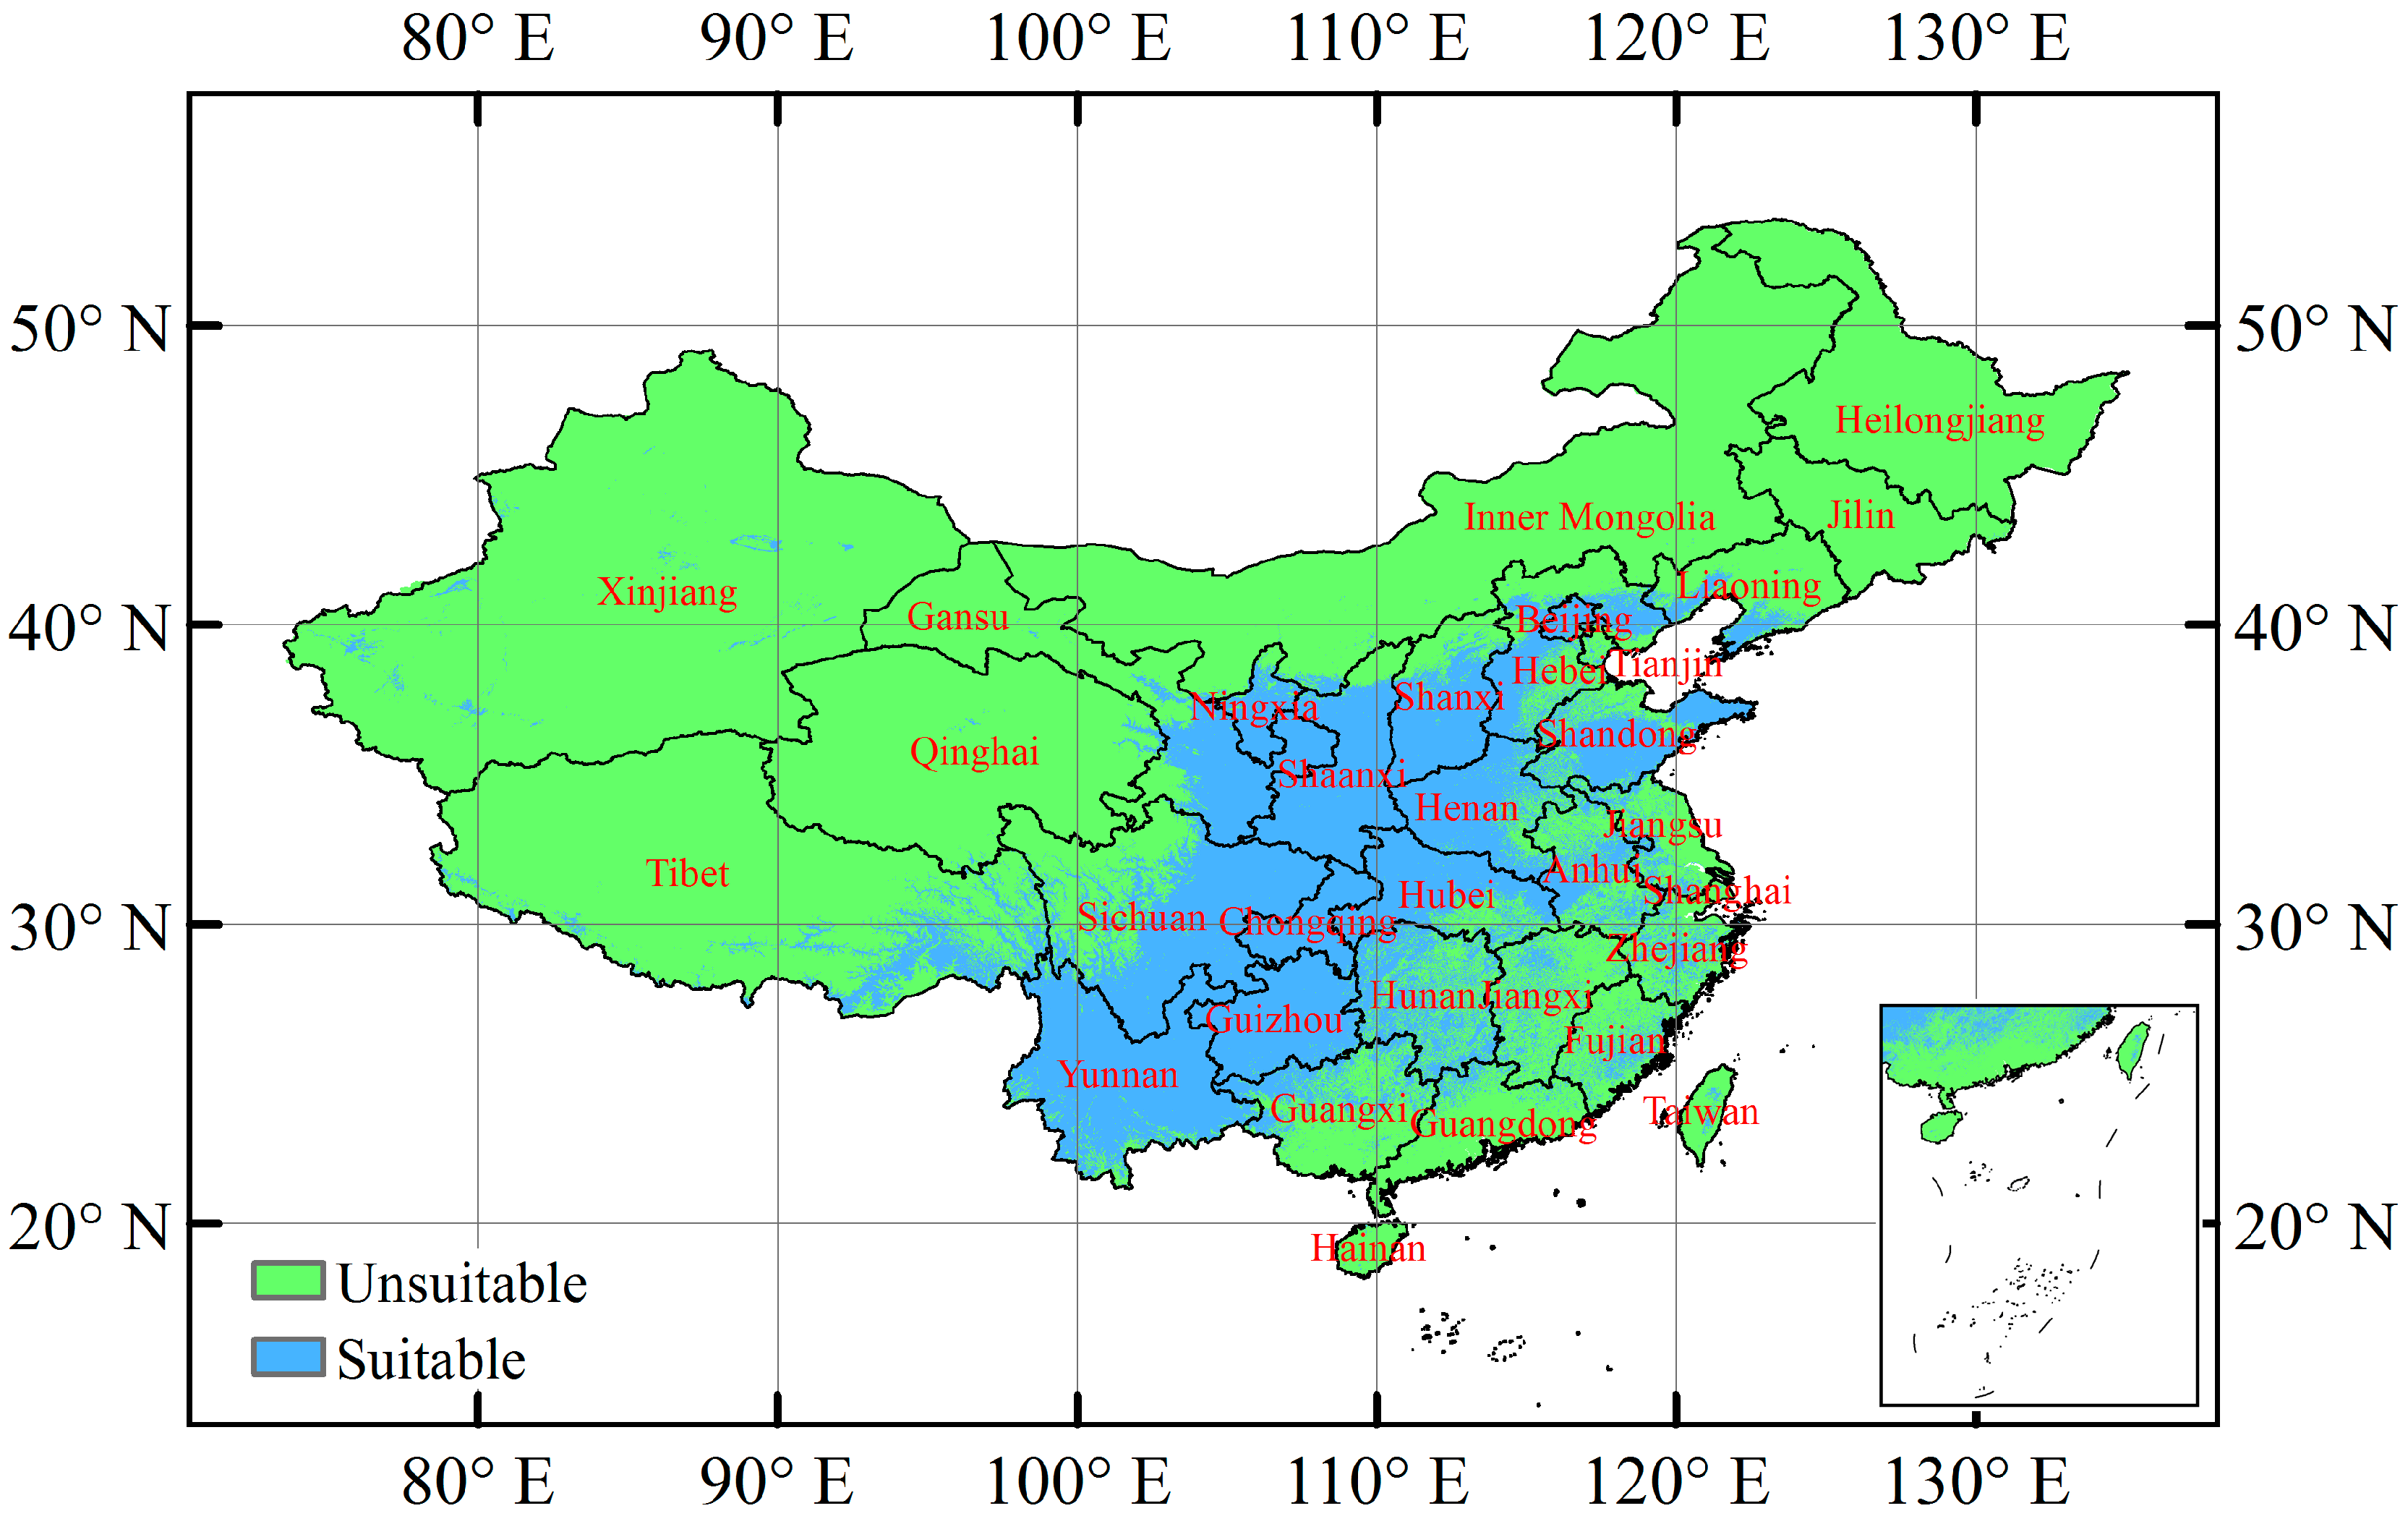
3.3. Current Potentially Suitable Climatic Distribution

The predicted potentially suitable climatic distribution of J. regia based on observed occurrences and current environmental conditions projected by the MaxEnt model is shown in Figure 3. The results show that the suitable habitats are primarily located in central and southwestern China, mainly including Beijing, Hebei, Ningxia, Shaanxi, Shanxi, Shandong, Henan, Chongqing, Hubei, Yunnan, Guizhou, southern Liaoning, southern Gansu, and eastern Sichuan.

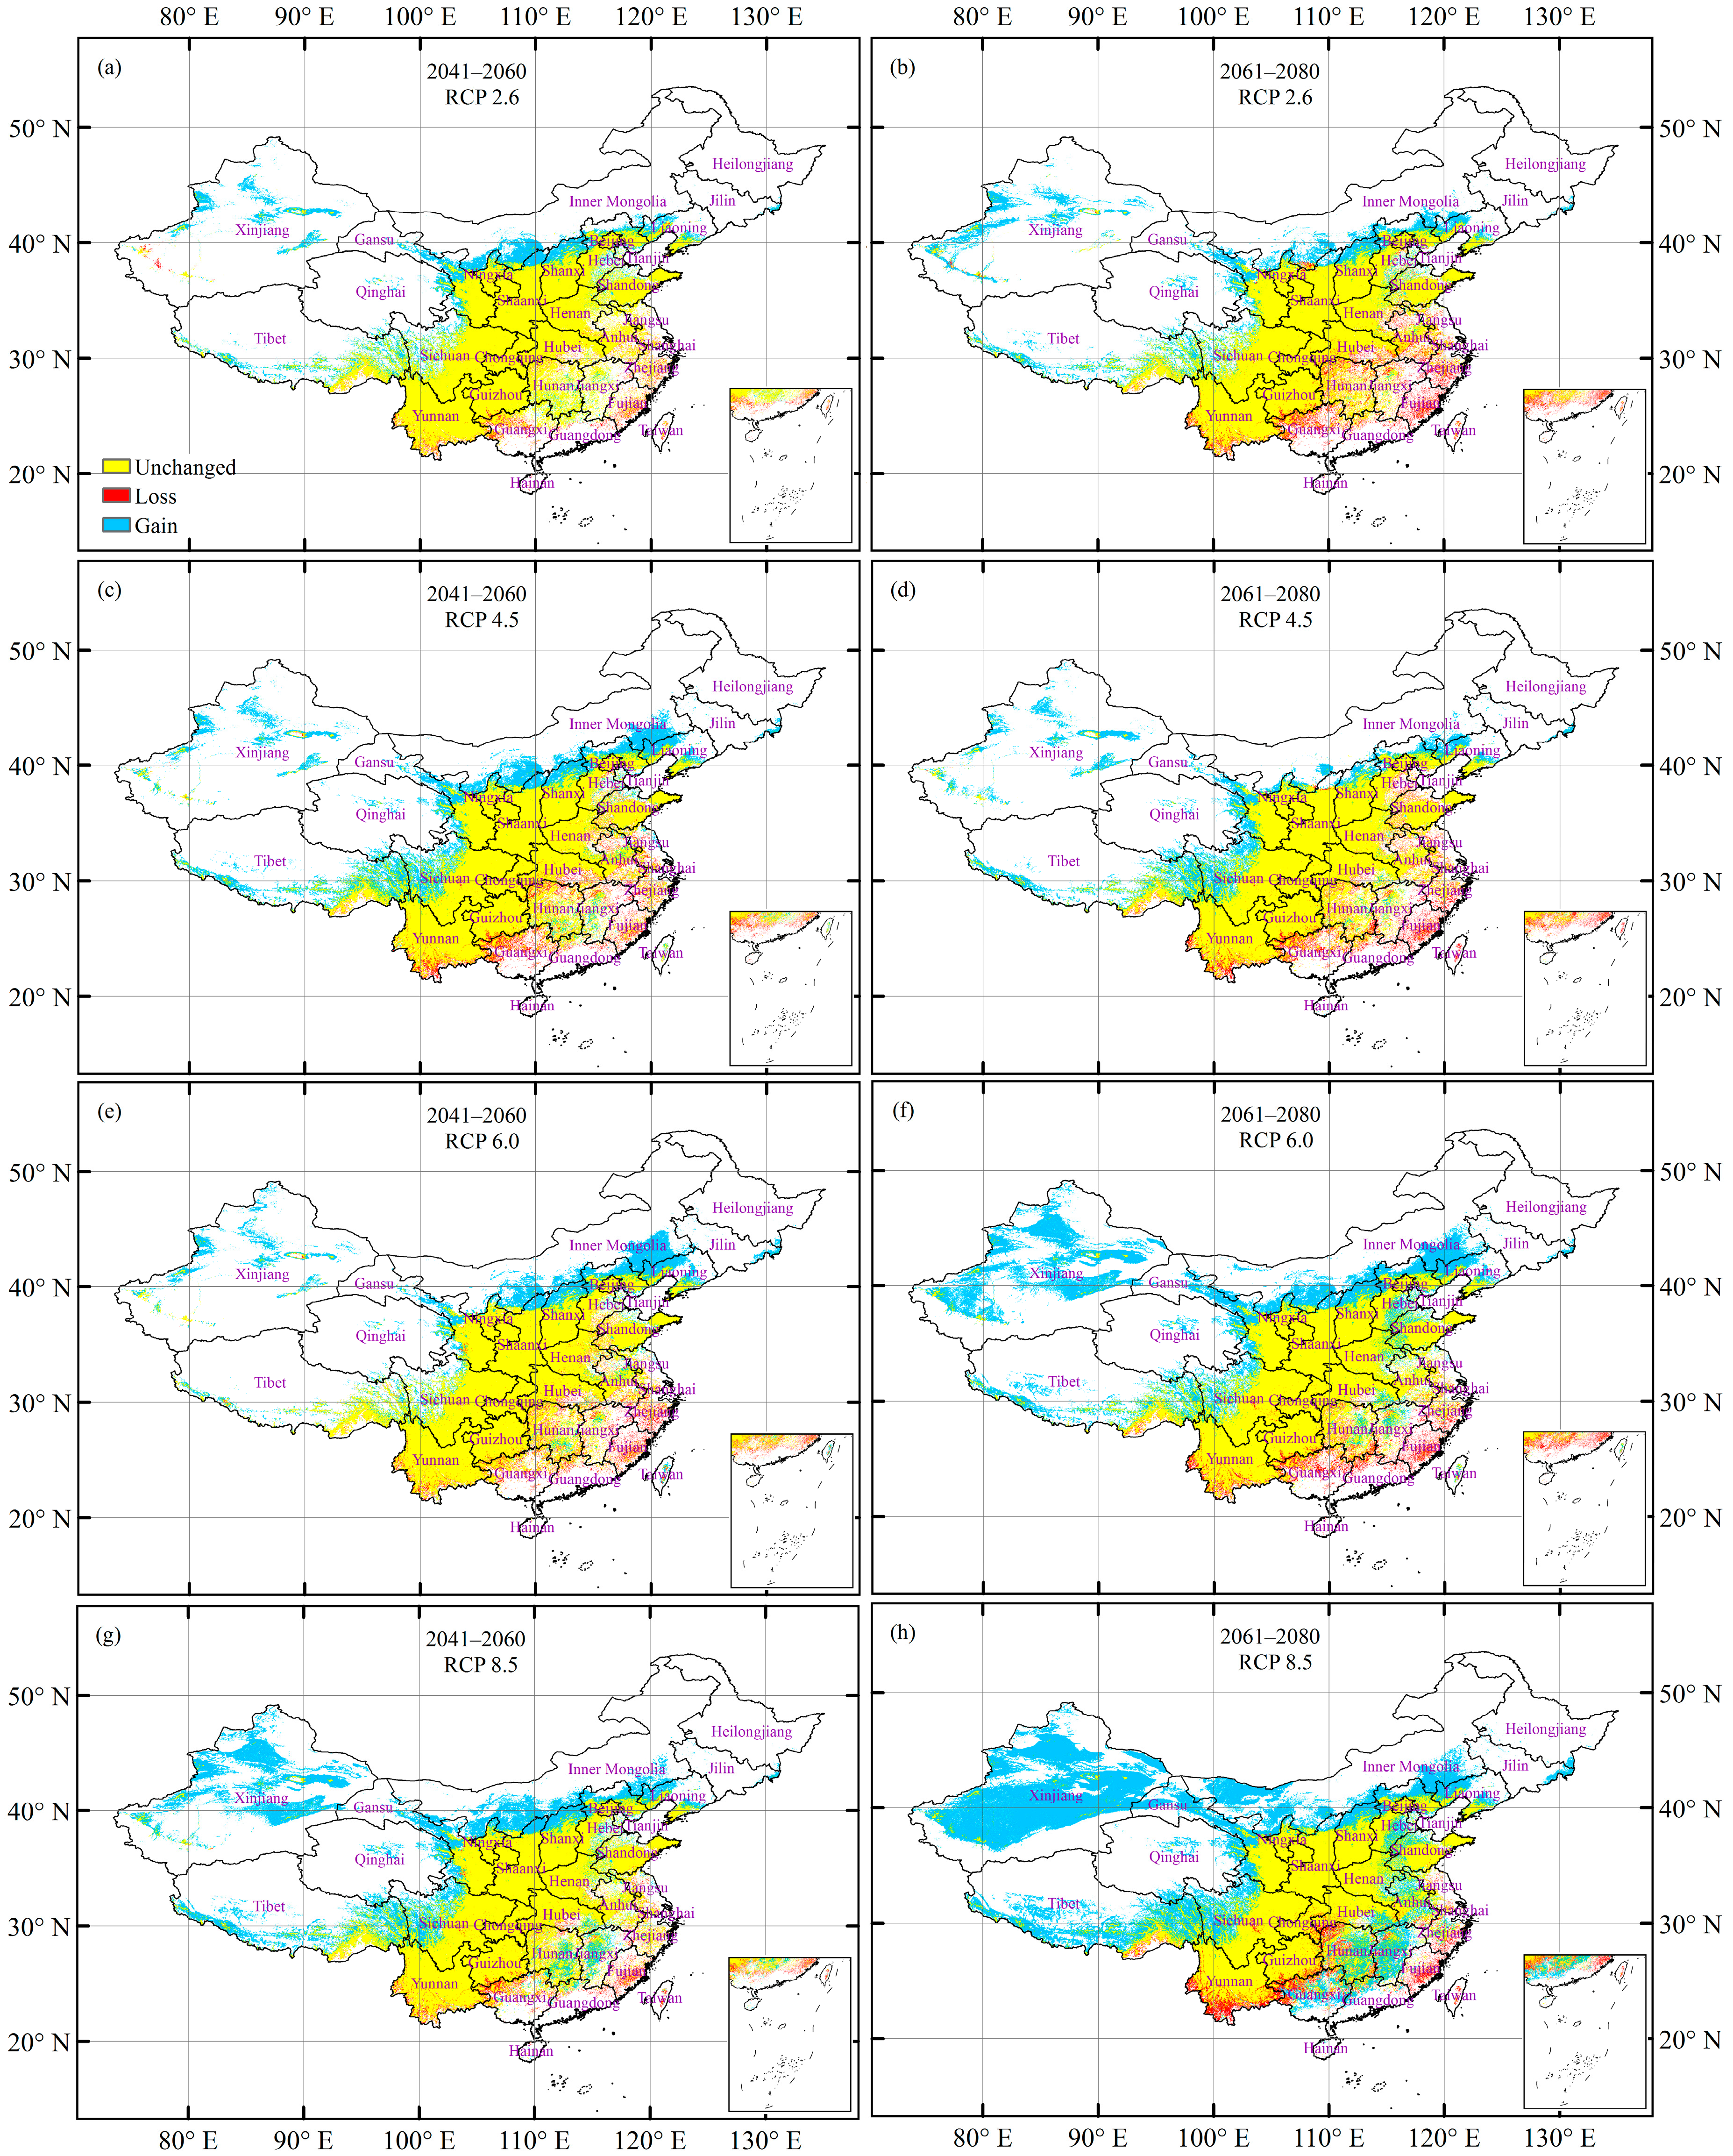
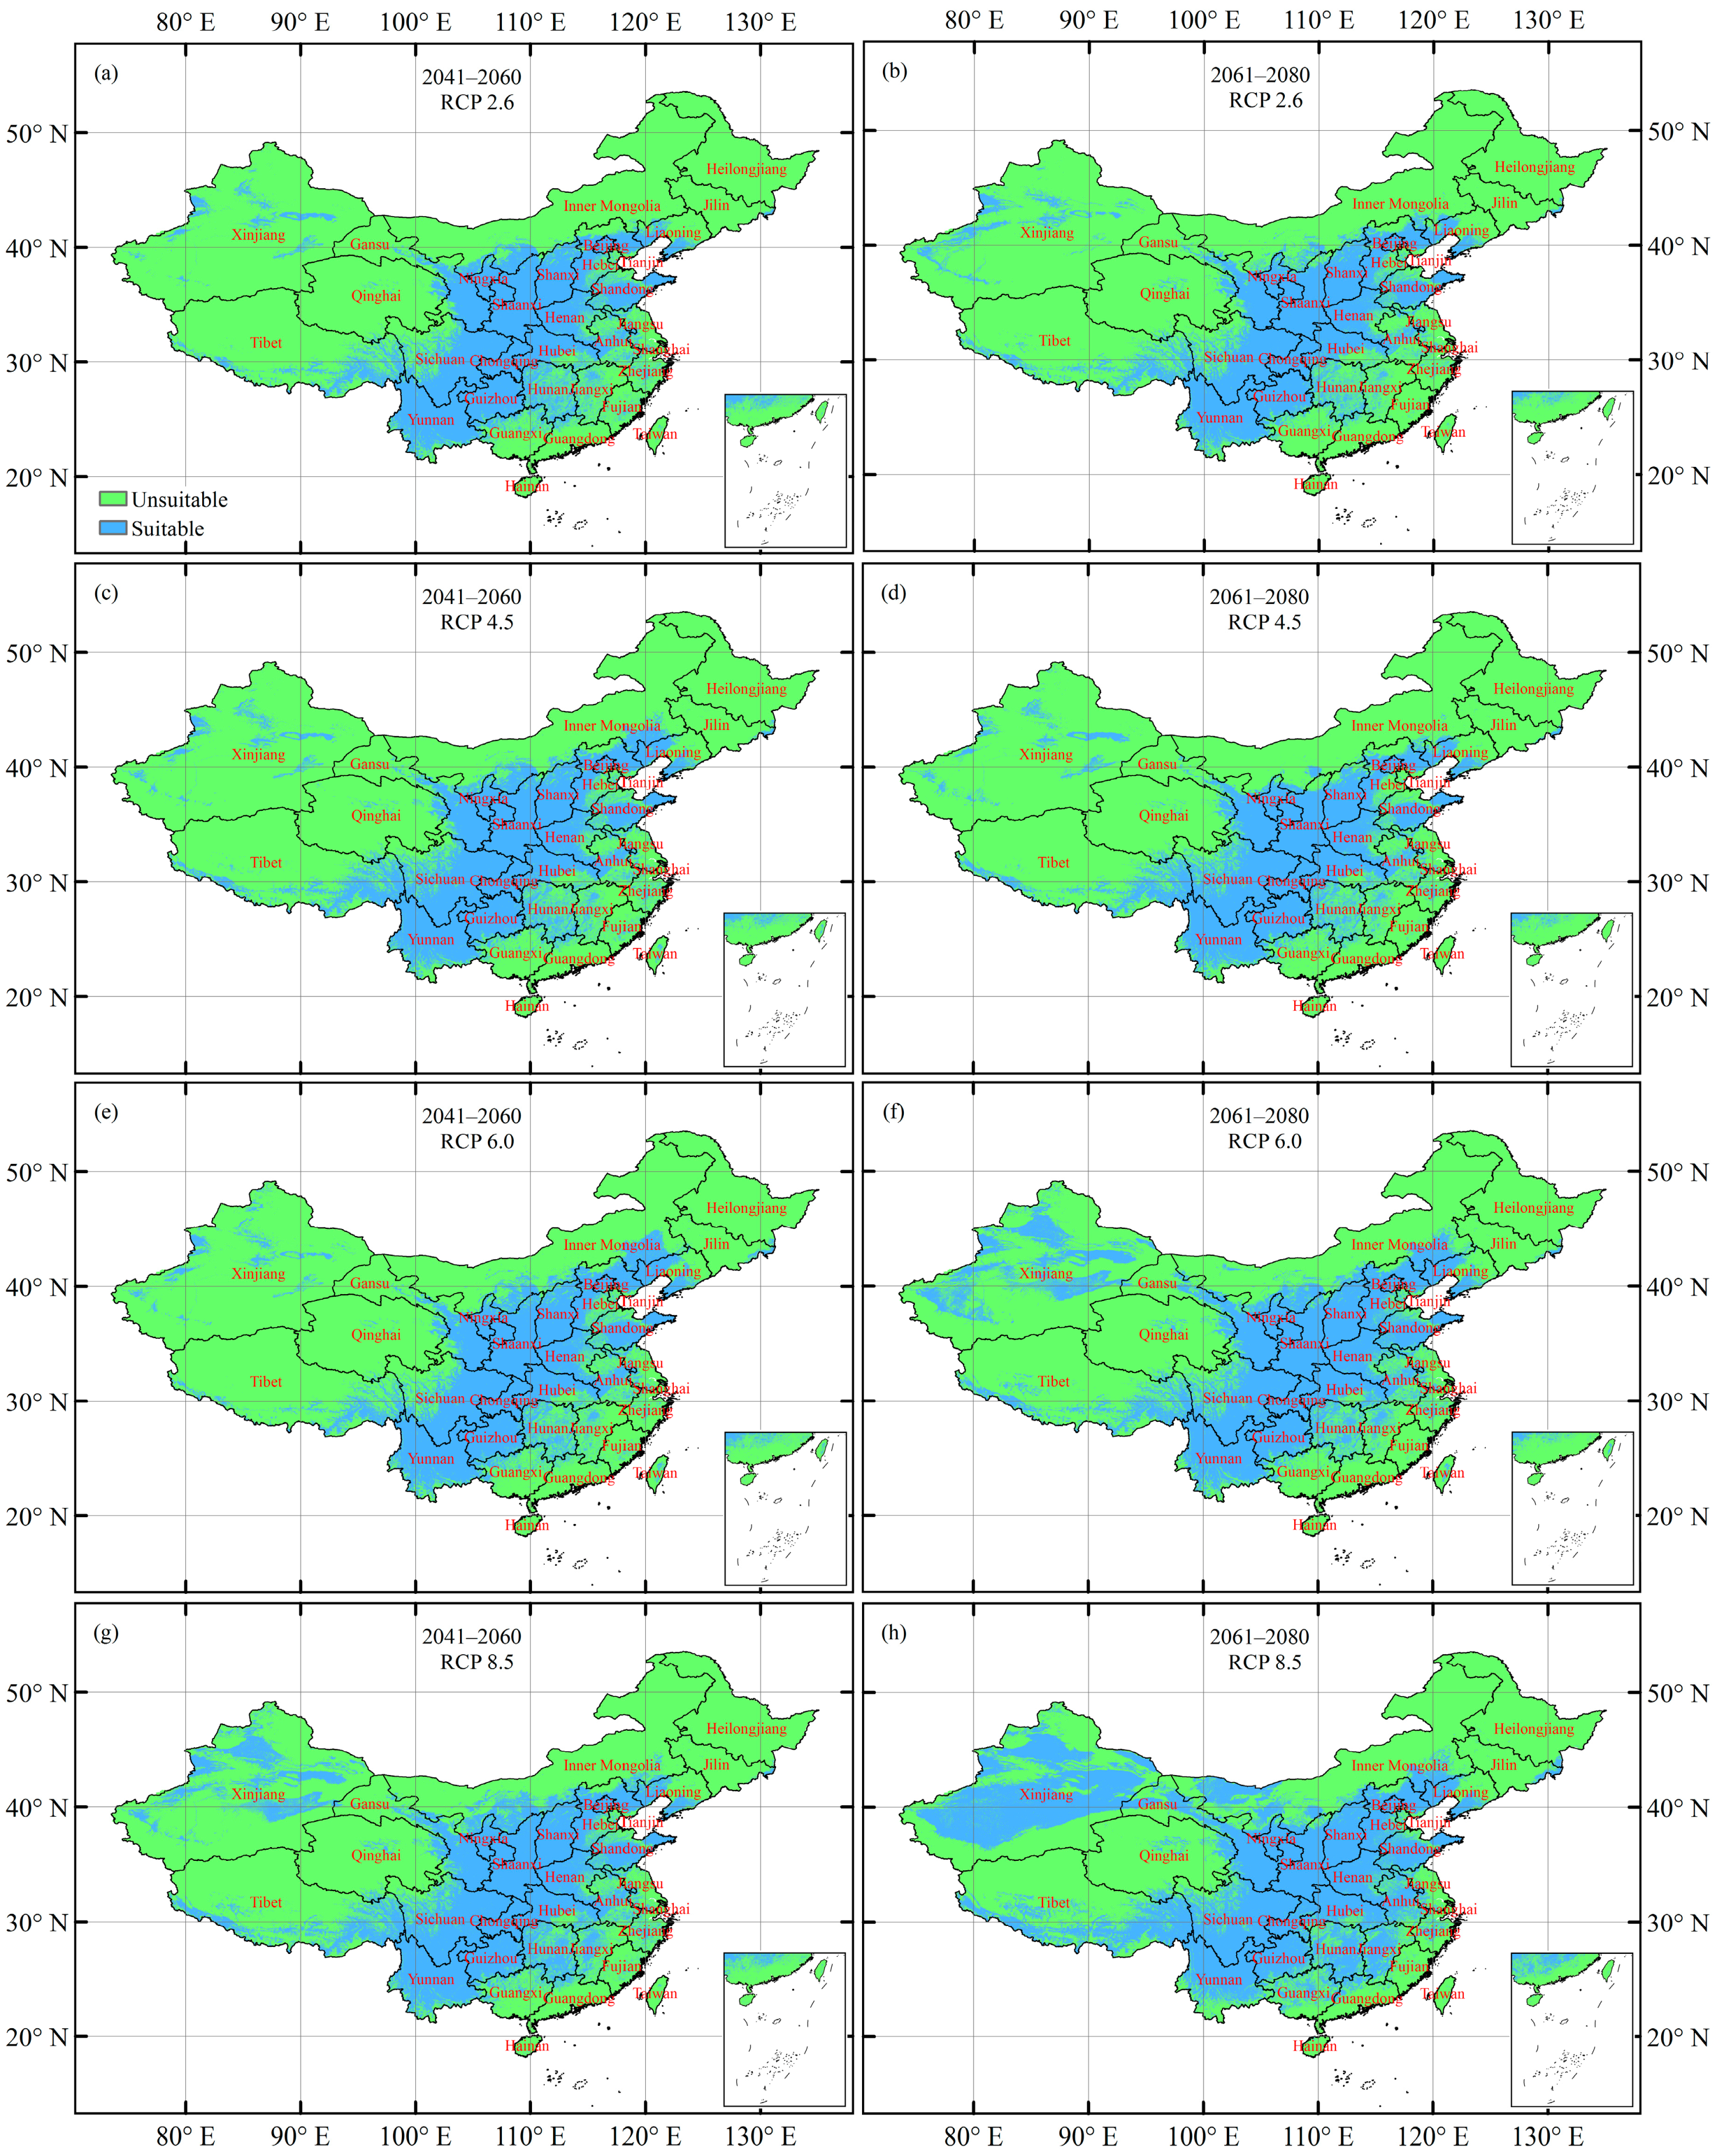
3.4. Future Potentially Suitable Climatic Distribution

The predicted future potentially suitable climatic distributions of J. regia under RCP 2.6, RCP 4.5, RCP 6.0, and RCP 8.5 climate change scenarios for 2041–2060 and 2061–2080 are shown in Figure 4. The results show that the suitable habitats under future climate change scenarios are mainly distributed in central, southwestern, and northwestern China. For the period of 2041–2060, the suitable habitats are mainly located in Beijing, Hebei, Ningxia, Shaanxi, Shanxi, Shandong, Henan, Sichuan, Chongqing, Hubei, Anhui, Yunnan, Guizhou, Hunan, southwestern Liaoning, southern Gansu, and southeastern Tibet under RCP 2.6, RCP 4.5, and RCP 6.0 (Figure 4a,c,e), and increase considerably in northwestern and southeastern China (mainly including Xinjiang, Zhejiang, and Jiangxi) under RCP 8.5 (Figure 4g). For the period of 2061–2080, the area size of suitable habitats for J. Regia continues to significantly increase in northwestern China (mainly including Xinjiang and the west of Inner Mongolia) under RCP 2.6, RCP 4.5, RCP 6.0, and RCP 8.5 (Figure 4b,d,f,h). Overall, the area size of suitable habitats for J. regia gradually increases along the climate scenario gradient (from RCP 2.6 to RCP 8.5) in the period of 2061–2080 (Table 2).

3.5. Future Changes in the Climatically Suitable Habitat Area

Most (90.6–96.7%) of the suitable habitat area for J. regia under different future climate scenarios remains unchanged (Figure 5, Table 2). The results show that the suitable habitat area increases in central and western China (mainly including Xinjiang, southern Inner Mongolia, central Gansu, northern Shaanxi, northern Shanxi, northern Hebei, southwestern Liaoning, and northwestern Sichuan), while decreasing a little in southeastern China (mainly including Zhejiang, Fujian, Hunan, northern Guangxi, and southern Yunnan) (Figure 5). Under RCP 2.6, RCP 6.0, and RCP 8.5, the gain in suitable habitat area increases from the period of 2041–2060 to the period of 2061–2080 (RCP 2.6: from 16.8% to 19.8%; RCP 6.0: from 20.5% to 43.7%; RCP 8.5: from 40.6% to 82.5%). Under all future climate scenarios, the loss of suitable habitat area increases from the period of 2041–2060 to the period of 2061–2080 (RCP 2.6: from 3.3% to 9.4%; RCP 4.5: from 7.7% to 8.4%; RCP 6.0: from 6.7% to 7.5%; RCP 8.5: from 4.7% to 8.9%). Thus, the suitable habitat area of J. regia expands along the temporal gradient (from the period of 2041–2060 to 2061–2080) under both RCP 6.0 and RCP 8.5, while contracting under both RCP 2.6 and RCP 4.5.

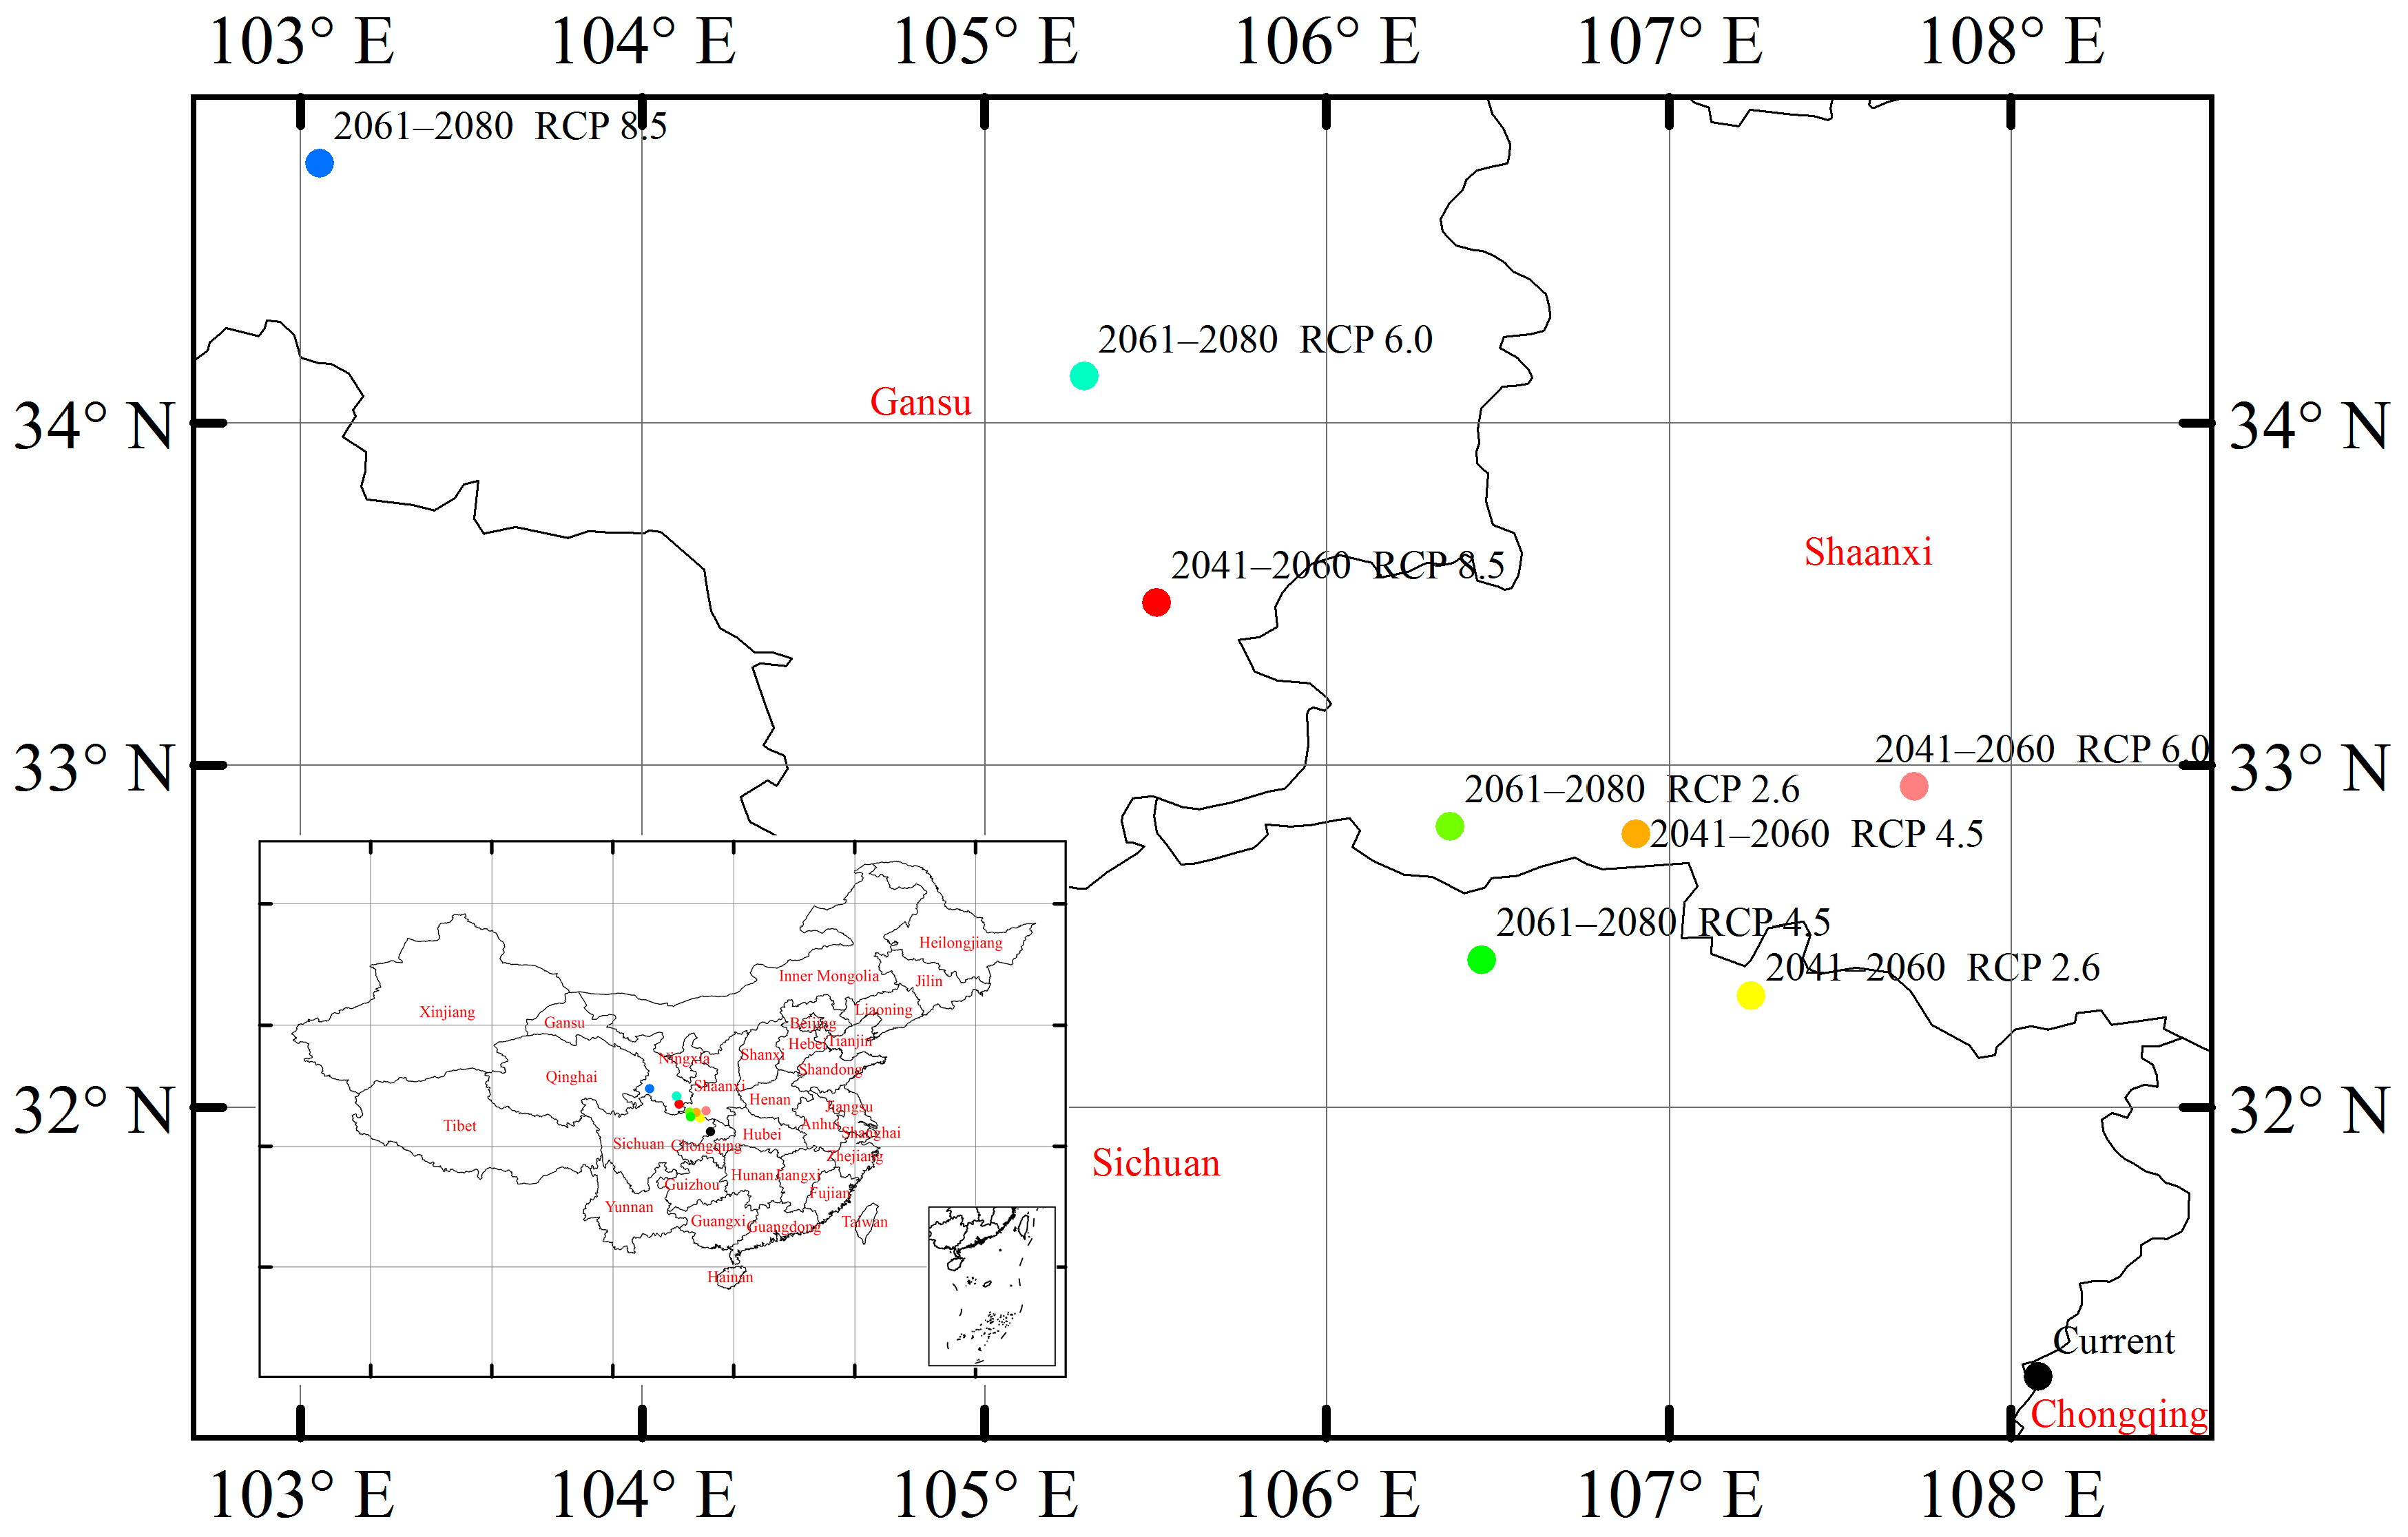
3.6. Suitable Climatic Habitat Shift

The centroid of the current suitable habitat for J. regia is located in eastern Sichuan (Figure 6). Under RCP 2.6, the centroid shifts to a northwestern position by the period of 2041–2060, and then to a further northwest position by the period of 2061–2080. Under both RCP 6.0 and RCP 8.5, the shift of the centroid retained this northwest tendency. Overall, the distributional shift of climatically suitable habitats expressed a northwest tendency along the temporal gradient (from current to the period of 2041–2060 and then to 2061–2080) (Figure 6).

4. Discussion

This study was the first to explore the impacts of global climate change on the geographical range and environmentally suitable habitat of the woody oil plant species J. regia in China using MaxEnt modeling. Evaluating the impacts of global climate change scenarios on the potential distributions of economically or ecologically essential species will be helpful to understanding the relationships between species niches and the corresponding environment, identifying priority cultivation areas of target species, and setting up effective strategies for species conservation and resource utilization [45,46,47,48]. MaxEnt has been commonly implemented for many species to predict potential distribution [49,50,51,52,53]. The results show that the MaxEnt model for J. regia provided an AUC value of 0.843, indicating a reliable prediction, which is consistent with previous studies [54,55,56].
The MaxEnt model showed that the geographical distribution of J. regia was mostly explained by bioclimatic variables, while the effects of topographical and soil variables were rather small. Previous studies have also confirmed the dominant role of climate in the natural distribution of plants [57,58]. Studies on two other cultivated plant species (Scutellaria baicalensis and Tricholoma matsutake) have also found that topographical and soil variables only had a small effect on their distributions [46,56]. MTCM and AP were the most important bioclimatic variables determining the geographical distribution of J. regia and collectively explained 76.5% of the distribution. J. regia can tolerate a cold environment, but is better suited to humid and warm environments [59]. The habitat suitability of J. regia showed a hump-shaped pattern along the MTCM gradient because the fruits do not mature properly when the effectively accumulated temperature is excessively low or high [59]. The suitable habitats of J. regia predicted under current climate conditions were dominated by humid regions in China (i.e., central and southwestern China), indicating that J. Regia favors humid environments.
The MaxEnt model has predicted that J. regia is potentially distributed from 75° E to 124° E, 22° N to 44° N in China under current conditions, consistent with previous findings [60]. Our predictions showed that the potentially suitable climatic distribution of J. regia will expand under all future climate scenarios, indicating that more suitable habitats will be available for the artificial cultivation of J. regia in the future. However, J. regia still faces a threat of reduction without proper protection, because the future abundance of J. regia will greatly rely on human use. On one hand, J. regia will face a potentially large harvesting probability at different distribution locations, as the market demand of J. regia is rather great in China due to the rich nutrients and oil provided by J. regia. On the other hand, the area size of the environmentally suitable habitat available for the cultivation of J. regia will gradually decrease because of urban development and other social causes. Therefore, future study should incorporate harvesting, land use change, and biotic interactions in the geographical distribution simulation for J. Regia. Additionally, future study can use an entropy and mutual information index—an important concept developed by Shannon in the context of information theory [61]—as an alternative way to define principal variables assessing J. regia distribution.
Our predictions also show that J. regia has a high risk of habitat loss in the low latitudes under future climate change, similar to previous findings on bioenergy crops in Europe [62]. More attention and additional protective measures should be placed on the low latitudes. For example, the Chinese government should set nature conservation areas covering the suitable habitats, and reduce human interference in these areas. Our projection reveals that future climate change will cause shifts in the potentially suitable climatic distribution of J. Regia. However, relatively stable distribution sites of woody oil plants are essential for the sustainable supply of feedstocks for oil production [63,64]. Therefore, this distribution shift should attract special interest from ecologists.

5. Conclusions

J. regia is an important woody oil plant species, and there is urgent demand for its appropriate protection and management. In this study, we developed a habitat suitability model based on the maximum entropy (MaxEnt) theory to evaluate the environmental variables determining the geographical distribution of J. regia and to predict potentially suitable climatic distributions given current and future climate conditions. Our results have shown that J. regia will expand its suitable habitat area size but will face a high risk of habitat loss in the low latitudes in response to global climate change. These results will be valuable to identifying environmentally suitable sites for the reintroduction, cultivation, and management of J. regia.

Acknowledgments

We acknowledge with great appreciation the support provided by the National Special Water Programs (grant Nos. 2017ZX07101-002, 2015ZX07203-011, 2015ZX07204-007, and 2009ZX07210-009), the Department of Environmental Protection of Shandong Province (SDHBPJ-ZB-08), the Chinese Natural Science Foundation (grant No. 39560023), and the Fundamental Research Funds for the Central Universities (grant No. 2017MS065).

Author Contributions

H.Z. designed the outline of this paper. T.X. collected the data. X.X. completed the calculation using the MaxEnt model. X.X. and J.Y. wrote the paper. Y.X. and Y.T. analyzed data and gaveadvice in the discussion.

Conflicts of Interest

The authors declare no conflict of interest.

Appendix A

Table A1. Loading factors of 16 bioclimatic variables used in the principal component analysis.
VariablePC1PC2PC3
Bio10.282–0.234–0.214
Bio2–0.199≈0–0.276
Bio4–0.196–0.3740.246
Bio50.102–0.491≈0
Bio60.316≈0–0.171
Bio7–0.239–0.3250.137
Bio80.149–0.444–0.153
Bio90.302≈0–0.248
Bio100.152–0.460≈0
Bio110.308≈0–0.272
Bio120.307≈00.206
Bio130.274≈0≈0
Bio160.2930.114≈0
Bio170.239≈00.526
Bio180.2790.134
Bio190.232≈00.530
PC: principal component calculated from principal component analysis on 16 bioclimatic variables of 543 Juglans regia occurrence points. Descriptions of these variables are given in Table 1.
Table A2. Loading factors of 14 soil variables used in the principal component analysis.
VariablePC1PC2PC3
t_bulk_den–0.389–0.11≈0
s_bulk_den–0.422≈0–0.185
t_clay–0.210.341–0.444
s_clay–0.210.341–0.444
t_gravel≈0–0.1120.137
s_gravel–0.177≈0≈0
t_ph_h20–0.343≈00.301
s_ph_h20–0.419≈0≈0
t_esp–0.106–0.1510.243
s_esp≈0≈00.242
t_sand–0.15–0.557–0.142
s_sand–0.263–0.447–0.197
t_silt–0.2020.3180.468
s_silt–0.3210.3110.239
PC: principal component calculated from principal component analysis on 14 soil variables of 543 Juglans regia occurrence points. Descriptions of these variables are given in Table 1.
Table A3. Pearson correlation coefficients (r) among four bioclimatic variables calculated using the Band Collection Statistics tool in ArcGIS 10.3.
VariableBio5Bio6Bio7
Bio60.530
Bio70.128–0.773
Bio120.2860.758–0.673
Table A4. Pearson correlation coefficients (r) among 12 soil variables calculated using the Band Collection Statistics tool in ArcGIS 10.3.
Variablet_bulk_dens_bulk_dent_clayt_gravels_gravelt_ph_h20t_esps_espt_sands_sandt_silt
s_bulk_den0.415
t_clay0.1810.648
t_gravel0.177–0.320–0.277
s_gravel0.1750.5500.3410.364
t_ph_h200.7070.3450.108–0.0330.023
t_esp0.0830.1890.141–0.0840.0640.305
s_esp0.0580.1920.176–0.220–0.0200.2950.772
t_sand0.460–0.021–0.4510.273–0.0270.132–0.051–0.109
s_sand0.3630.7480.133–0.1750.3990.2190.1270.0980.535
t_silt0.251-0.0160.1210.0170.0030.4400.0570.145–0.534–0.479
s_silt0.2410.7320.603–0.3110.3990.4290.1970.232–0.5220.1900.569

References

  1. IPCC. IPCC Climate Change 2013: The Physical Science Basis. Working Group I Contribution to the Fifth Assessment Report of the Intergovernmental Panel on Climate Change—Summary for Policymakers; IPCC: Geneva, Switzerland, 2013. [Google Scholar]
  2. Despland, E.; Houle, G. Climate influences on growth and reproduction of Pinus banksiana (Pinaceae) at the limit of the species distribution in eastern North America. Am. J. Bot. 1997, 84, 928–937. [Google Scholar] [CrossRef] [PubMed]
  3. Lenoir, J.; Gégout, J.C.; Marquet, P.A.; De, R.P.; Brisse, H. A significant upward shift in plant species optimum elevation during the 20th century. Science 2008, 320, 1768–1771. [Google Scholar] [CrossRef] [PubMed]
  4. Bertrand, R.; Lenoir, J.; Piedallu, C.; Riofríodillon, G.; De, R.P.; Vidal, C.; Pierrat, J.C.; Gégout, J.C. Changes in plant community composition lag behind climate warming in lowland forests. Nature 2011, 479, 517. [Google Scholar] [CrossRef] [PubMed]
  5. Dion, P.-P.; Bussières, J.; Lapointe, L. Sustainable leaf harvesting and effects of plant density on wild leek cultivation plots and natural stands in Southern Quebec, Canada. Agrofor. Syst. 2016, 90, 979–995. [Google Scholar] [CrossRef]
  6. Lu, C.Y.; Gu, W.; Dai, A.H.; Wei, H.Y. Assessing habitat suitability based on geographic information system (GIS) and fuzzy: A case study of Schisandra sphenanthera Rehd. et Wils. in Qinling Mountains, China. Ecol. Model. 2012, 242, 105–115. [Google Scholar] [CrossRef]
  7. Guo, Y.; Wei, H.; Lu, C.; Gao, B.; Gu, W. Predictions of potential geographical distribution and quality of Schisandra sphenanthera under climate change. PeerJ 2016, 4, e2554. [Google Scholar] [CrossRef] [PubMed]
  8. Hakl, J.; Fuksa, P.; Konečná, J.; Pacek, L.; Tlustoš, P. Effect of applied cultivation technology and environmental conditions on lucerne farm yield in the Central Europe. Plant Soil Environ. 2014, 60, 475–480. [Google Scholar] [CrossRef]
  9. Lamb, J.F.S.; Jung, H.-J.G.; Riday, H. Growth environment, harvest management and germplasm impacts on potential ethanol and crude protein yield in alfalfa. Biomass Bioenergy 2014, 63, 114–125. [Google Scholar] [CrossRef]
  10. Anderson, R.P. A framework for using niche models to estimate impacts of climate change on species distributions. Ann. N. Y. Acad. Sci. 2013, 8–28. [Google Scholar] [CrossRef] [PubMed]
  11. Martin, Y.; Titeux, N. Testing instead of assuming the importance of land use change scenarios to model species distributions under climate change. Glob. Ecol. Biogeogr. 2013, 22, 1204–1216. [Google Scholar] [CrossRef]
  12. Qin, Z.; Zhang, J.E.; Ditommaso, A.; Wang, R.L.; Liang, K.M. Predicting the potential distribution of Lantana camara L. under RCP scenarios using ISI-MIP models. Clim. Chang. 2016, 134, 193–208. [Google Scholar] [CrossRef]
  13. Wang, H.H.; Wonkka, C.L.; Grant, W.E.; Rogers, W.E. Potential range expansion of Japanese honeysuckle (Lonicera japonica thunb.) in southern U.S. forestlands. Forests 2012, 3, 573–590. [Google Scholar] [CrossRef]
  14. Wang, W.; Tang, X.; Zhu, Q.; Pan, K.; Hu, Q.; He, M.; Li, J. Predicting the impacts of climate change on the potential distribution of major native non-food bioenergy plants in China. PLoS ONE 2014, 9, 1–11. [Google Scholar] [CrossRef] [PubMed]
  15. Yuan, H.-S.; Wei, Y.-L.; Wang, X.-G. Maxent modeling for predicting the potential distribution of Sanghuang, an important group of medicinal fungi in China. Fungal Ecol. 2015, 17, 140–145. [Google Scholar] [CrossRef]
  16. Li, G.; Xu, G.; Guo, K.; Du, S. Mapping the global potential geographical distribution of black locust (Robinia Pseudoacacia L.) using herbarium data and a maximum entropy model. Forests 2014, 5, 2773–2792. [Google Scholar] [CrossRef]
  17. Xu, X.; Zhang, H.; Xie, T.; Xu, Y.; Zhao, L.; Tian, W. Effects of climate change on the potentially suitable climatic geographical range of Liriodendron chinense. Forests 2017, 8, 399. [Google Scholar] [CrossRef]
  18. Rundel, P.W. Modeled shifts in Polylepis species ranges in the Andes from the Last Glacial Maximum to the present. Forests 2017, 8, 232. [Google Scholar]
  19. Deb, J.C.; Phinn, S.; Butt, N.; Mcalpine, C.A. Climatic-induced shifts in the distribution of Teak (Tectona grandis) in tropical Asia: Implications for forest management and planning. Environ. Manag. 2017, 60, 422–435. [Google Scholar] [CrossRef] [PubMed]
  20. Dai, G.; Yang, J.; Huang, C.; Sun, C.; Jia, L.; Ma, L. The effects of climate change on the development of tree plantations for biodiesel production in China. Forests 2017, 8, 207. [Google Scholar] [CrossRef]
  21. Hernandez, P.A.; Graham, C.H.; Master, L.L.; Albert, D.L. The effect of sample size and species characteristics on performance of different species distribution modeling methods. Ecography 2006, 29, 773–785. [Google Scholar] [CrossRef]
  22. Pearson, R.G.; Raxworthy, C.J.; Nakamura, M.; Peterson, A.T. Predicting species distributions from small numbers of occurrence records: A test case using cryptic geckos in Madagascar. J. Biogeogr. 2007, 34, 102–117. [Google Scholar] [CrossRef]
  23. Merow, C.; Smith, M.J.; Silander, J.A. A practical guide to MaxEnt for modeling species’ distributions: What it does, and why inputs and settings matter. Ecography 2013, 36, 1058–1069. [Google Scholar] [CrossRef]
  24. Zhang, Y.; Yuan, S.; Wang, X.; Feng, B.; Zhang, R.; Han, J. Analysis and reflection on development strategy of walnut processing industry in China. Trans. Chin. Soc. Agric. Eng. 2015, 31, 1–8, (in Chinese with English abstract). [Google Scholar]
  25. Crews, C.; Hough, P.; Godward, J.; Brereton, P.; Lees, M.; Guiet, S.; Winkelmann, W. Study of the main constituents of some authentic walnut oils. J. Agric. Food Chem. 2005, 53, 4853–4860. [Google Scholar] [CrossRef] [PubMed]
  26. Xi, R.T. The textual research on the origin of Chinese walnut (Juglans regia L.). J. Hebei Univ. Agric. 1990, 13, 89–94, (in Chinese with English abstract). [Google Scholar]
  27. USDA-FAS. Oilseeds: World Markets and Trade, 07-10-2015. 2015. Available online: http://usda.mannlib.cornell.edu/usda/fas/oilseed-trade//2010s/2015/oilseed-trade-07-10-2015.pdf.
  28. Yuan, S.J. Developing situation and countermeasures of Shaanxi walnut industry. Shaanxi For. 2009, 6, 10, (In Chinese with English abstract). [Google Scholar]
  29. Chinese Virtual Herbarium. Available online: http://www.cvh.ac.cn/ (accessed on 24 July 2017).
  30. Global Biodiversity Information Facility. Available online: http://www.gbif.org/ (accessed on 24 July 2017).
  31. Hijmans, R.J.; Cameron, S.E.; Parra, J.L.; Jones, P.G.; Jarvis, A. Very high resolution interpolated climate surfaces for global land areas. Int. J. Climatol. 2005, 25, 1965–1978. [Google Scholar] [CrossRef]
  32. Varela, S.; Lima-Ribeiro, M.S.; Terribile, L.C. A short guide to the climatic variables of the last glacial maximum for biogeographers. PLoS ONE 2015, 10, e0129037. [Google Scholar] [CrossRef] [PubMed]
  33. Bedia, J.; Herrera, S.; Gutiérrez, J.M. Dangers of using global bioclimatic datasets for ecological niche modeling. Limitations for future climate projections. Glob. Planet. Chang. 2013, 107, 1–12. [Google Scholar] [CrossRef]
  34. Fischer, G.; Nachtergaele, F.; Prieler, S.; Van Velthuizen, H.T.; Verelst, L.; Wiberg, D. Global Agro-Ecological Zones Assessment for Agriculture (GAEZ 2008); IIASA: Laxenburg, Austria; FAO: Rome, Italy, 2008. [Google Scholar]
  35. Xin, X.; Zhang, L.; Zhang, J.; Wu, T.; Fang, Y. Climate change projections over East Asia with BCC_CSM1.1, climate model under RCP scenarios. J. Meteorol. Soc. Japan 2013, 91, 413–429. [Google Scholar] [CrossRef]
  36. Rana, S.K.; Rana, H.K.; Ghimire, S.K.; Shrestha, K.K.; Ranjitkar, S. Predicting the impact of climate change on the distribution of two threatened Himalayan medicinal plants of Liliaceae in Nepal. J. Mt. Sci. 2017, 14, 558–570. [Google Scholar] [CrossRef]
  37. Heikkinen, R.K.; Luoto, M.; Araújo, M.B.; Virkkala, R.; Thuiller, W.; Sykes, M.T. Methods and uncertainties in bioclimatic envelope modelling under climate change. Prog. Phys. Geogr. 2006, 30, 751–777. [Google Scholar] [CrossRef]
  38. Yang, X.Q.; Kushwaha, S.P.S.; Saran, S.; Xu, J.; Roy, P.S. Maxent modeling for predicting the potential distribution of medicinal plant, Justicia adhatoda L. in Lesser Himalayan foothills. Ecol. Eng. 2013, 51, 83–87. [Google Scholar]
  39. Phillips, S.J.; Anderson, R.P.; Schapire, R.E. Maximum entropy modeling of species geographic distributions. Ecol. Model. 2006, 190, 231–259. [Google Scholar] [CrossRef]
  40. Elith, J.; Graham, C.H.; Anderson, R.P.; Dudík, M.; Ferrier, S.; Guisan, A.; Hijmans, R.J.; Huettmann, F.; Leathwick, J.R.; Lehmann, A.; et al. Novel methods improve prediction of species’ distributions from occurrence data. Ecography 2006, 29, 129–151. [Google Scholar] [CrossRef]
  41. Phillips, S.J.; Dudík, M. Modeling of species distributions with Maxent: New extensions and a comprehensive evaluation. Ecography 2008, 31, 161–175. [Google Scholar] [CrossRef]
  42. Manel, S.; Williams, H.C.; Ormerod, S.J. Evaluating presence-absence models in ecology: The need to account for prevalence. J. Appl. Ecol. 2001, 38, 921–931. [Google Scholar] [CrossRef]
  43. Jiménez-Valverde, A.; Lobo, J.M. Threshold criteria for conversion of probability of species presence to either—or Presence—Absence. Acta Oecol. 2007, 31, 361–369. [Google Scholar] [CrossRef]
  44. Aguirre-Gutiérrez, J.; Kissling, W.D.; Carvalheiro, L.G.; WallisDeVries, M.F.; Franzén, M.; Biesmeijer, J.C. Functional traits help to explain half-century long shifts in pollinator distributions. Sci. Rep. 2016, 6. [Google Scholar] [CrossRef] [PubMed]
  45. Davies, T.J.; Purvis, A.; Gittleman, J.L. Quaternary climate change and the geographic ranges of mammals. Am. Nat. 2009, 174, 297–307. [Google Scholar] [CrossRef] [PubMed]
  46. Zhang, L.; Cao, B.; Bai, C.; Li, G.; Mao, M. Predicting suitable cultivation regions of medicinal plants with Maxent modeling and fuzzy logics: A case study of Scutellaria baicalensis in China. Environ. Earth Sci. 2016, 75, 1–12. [Google Scholar] [CrossRef]
  47. Pearce, J.; Lindenmayer, D. Bioclimatic analysis to enhance reintroduction biology of the endangered Helmeted Honeyeater (Lichenostomus melanops cassidix) in Southeastern Australia. Restor. Ecol. 1998, 6, 238–243. [Google Scholar] [CrossRef]
  48. Aguilar-Soto, V.; Melgoza-Castillo, A.; Villarreal-Guerrero, F.; Wehenkel, C.; Pinedo-Alvares, C. Modeling the potential distribution of Picea chihuahuana Martínez, an endangered species at the Sierra Madre Occidental, Mexico. Forests 2015, 6, 692–707. [Google Scholar] [CrossRef]
  49. Nabout, J.C.; Magalhães, M.R.; Ma, D.A.G.; Da, C.H. The impact of global climate change on the geographic distribution and sustainable harvest of Hancornia speciosa Gomes (Apocynaceae) in Brazil. Environ. Manag. 2016, 57, 1–8. [Google Scholar] [CrossRef] [PubMed]
  50. Elith, J.; Phillips, S.J.; Hastie, T.; Dudík, M.; Chee, Y.E.; Yates, C.J. A statistical explanation of MaxEnt for ecologists. Divers. Distrib. 2011, 17, 43–57. [Google Scholar] [CrossRef]
  51. Noulèkoun, F.; Chude, S.; Zenebe, A.; Birhane, E. Climate change impacts on Faidherbia albida (Delile) A. Chev. distribution in dry lands of Ethiopia. Afr. J. Ecol. 2017, 55, 233–243. [Google Scholar]
  52. Narouei-Khandan, H.A. Ensemble Models to Assess the Risk of Exotic Plant Pathogens in a Changing Climate. Ph.D. Thesis, Lincoln University: Lincoln, New Zealand, 2014. [Google Scholar]
  53. Huang, J.; Li, G.; Li, J.; Zhang, X.; Yan, M.; Du, S. Projecting the Range Shifts in Climatically Suitable Habitat for Chinese Sea Buckthorn under Climate Change Scenarios. Forests 2017, 9, 9. [Google Scholar] [CrossRef]
  54. Ray, D.; Behera, M.D.; Jacob, J. Indian Brahmaputra valley offers significant potential for cultivation of rubber trees under changed climate. Curr. Sci. 2014, 107, 461–469. [Google Scholar]
  55. Yi, Y.J.; Cheng, X.; Yang, Z.F.; Zhang, S.H. Maxent modeling for predicting the potential distribution of endangered medicinal plant (H. riparia Lour) in Yunnan, China. Ecol. Eng. 2016, 92, 260–269. [Google Scholar] [CrossRef]
  56. Guo, Y.; Li, X.; Zhao, Z.; Wei, H.; Gao, B.; Wei, G. Prediction of the potential geographic distribution of the ectomycorrhizal mushroom Tricholoma matsutake under multiple climate change scenarios. Sci. Rep. 2017, 7, 46221. [Google Scholar] [CrossRef] [PubMed]
  57. Pearson, R.G.; Dawson, T.P. Predicting the impacts of climate change on the distribution of species: Are bioclimate envelope models useful? Glob. Ecol. Biogeogr. 2003, 12, 361–371. [Google Scholar] [CrossRef]
  58. Kelly, A.E.; Goulden, M.L. Rapid shifts in plant distribution with recent climate change. Proc. Natl. Acad. Sci. USA 2008, 105, 11823–11826. [Google Scholar] [CrossRef] [PubMed]
  59. Han, H.; Luo, C.; Zhu, Y.; Wu, W.; Zhang, Q.; Du, G. Planting regionalization and ecological adaptability of walnut in Sichuan province. J. West China For. Sci. 2012, 3, 2, (in Chinese with English abstract). [Google Scholar]
  60. Xi, S. Gene resources of Juglans and genetic improvement of Juglans regia in China. Sci. Silvae Sin. 1987, 23, 342–350, (in Chinese with English abstract). [Google Scholar]
  61. Arellano-Valle, R.B.; Contreras-Reyes, J.E.; Genton, M.G. Shannon entropy and mutual information for multivariate skew-elliptical distributions. Scand. J. Stat. 2013, 40, 42–62. [Google Scholar] [CrossRef]
  62. Tuck, G.; Glendining, M.J.; Smith, P.; House, J.I.; Wattenbach, M. The potential distribution of bioenergy crops in Europe under present and future climate. Biomass Bioenergy 2006, 30, 183–197. [Google Scholar] [CrossRef]
  63. Evans, J.M.; Fletcher, R.J.; Alavalapati, J. Using species distribution models to identify suitable areas for biofuel feedstock production. GCB Bioenergy 2010, 2, 63–78. [Google Scholar] [CrossRef]
  64. Trabucco, A.; Achten, W.M.J.; Bowe, C.; Aerts, R.; Orshoven, J.; Van Norgrove, L.; Muys, B. Global mapping of Jatropha curcas yield based on response of fitness to present and future climate. GCB Bioenergy 2010, 2, 139–151. [Google Scholar] [CrossRef]
Figure 1. Spatial distribution of occurrence records of Juglans regia and elevation in China.
Forests 09 00103 g001
Figure 2. The response curves of three main variables contributing to the habitat suitability of Juglans regia. (a) Min temperature of the coldest month (°C); (b) annual precipitation (mm); (c) temperature annual range (°C). Dashed lines represent the threshold probability (0.31) indicative of species presence.
Forests 09 00103 g002
Figure 3. Current suitable climatic distribution of Juglans regia in China.
Forests 09 00103 g003
Figure 4. Potentially suitable climatic distribution of Juglans regia under different climate change scenarios in China. (a) Period of 2041–2060 in the representative concentration pathway (RCP) 2.6 climate scenario; (b) period of 2061–2080 in the RCP 2.6 climate scenario; (c) period of 2041–2060 in the RCP 4.5 climate scenario; (d) period of 2061–2080 in the RCP 4.5 climate scenario; (e) period of 2041–2060 in the RCP 6.0 climate scenario; (f) period of 2061–2080 in the RCP 6.0 climate scenario; (g) period of 2041–2060 in the RCP 8.5 climate scenario; (h) period of 2061–2080 in the RCP 8.5 climate scenario.
Forests 09 00103 g004
Figure 5. Changes in the climatically suitable habitat of Juglans regia under different climate change scenarios around the world. (a) Period of 2041–2060 in the RCP 2.6 climate scenario; (b) period of 2061–2080 in the RCP 2.6 climate scenario; (c) period of 2041–2060 in the RCP 4.5 climate scenario; (d) period of 2061–2080 in the RCP 4.5 climate scenario; (e) period of 2041–2060 in the RCP 6.0 climate scenario; (f) period of 2061–2080 in the RCP 6.0 climate scenario; (g) period of 2041–2060 in the RCP 8.5 climate scenario; (h) period of 2061–2080 in the RCP 8.5 climate scenario.
Forests 09 00103 g005
Figure 6. Shifts in the climatically suitable habitat of Juglans regia under different climate change scenarios around the world. Dots indicate the centroids of the suitable habitats of Juglans regia under current climate and different future climate scenarios.
Forests 09 00103 g006
Table 1. Environmental variables used in this study and their percentage contribution.
CategoryVariableDescriptionUnitContribution (%)
ClimateBio1Annual Mean Temperature°C
Bio2Mean Diurnal Range (Mean of monthly (max temp − min temp))°C
Bio4Temperature Seasonality (standard deviation × 100)°C
Bio5Max Temperature of Warmest Month°C2.0
Bio6Min Temperature of Coldest Month°C63.9
Bio7Temperature Annual Range (Bio5 − Bio6)°C7.1
Bio8Mean Temperature of Wettest Quarter°C
Bio9Mean Temperature of Driest Quarter°C
Bio10Mean Temperature of Warmest Quarter°C
Bio11Mean Temperature of Coldest Quarter°C
Bio12Annual Precipitationmm12.6
Bio13Precipitation of Wettest Monthmm
Bio16Precipitation of Wettest Quartermm
Bio17Precipitation of Driest Quartermm
Bio18Precipitation of Warmest Quartermm
Bio19Precipitation of Coldest Quartermm
TopographyElevationm5.1
Slope°2.8
Aspectrad0.8
Soilt_bulk_denTopsoil Bulk Densitykg/dm30.9
s_bulk_denSubsoil Bulk Densitykg/dm30.5
t_clayTopsoil Clay Fraction%1.7
s_claySubsoil Clay Fraction%
t_gravelTopsoil Gravel Content%0.3
s_gravelSubsoil Gravel Content%0.0
t_ph_h20Topsoil pH (H2O)−log(H+)0.3
s_ph_h20Subsoil pH (H2O)−log(H+)
t_espTopsoil Sodicity (ESP, exchangeable sodium percentage)%0.4
s_espSubsoil Sodicity (ESP, exchangeable sodium percentage)%0.2
t_sandTopsoil Sand Fraction%0.2
s_sandSubsoil Sand Fraction%0.1
t_siltTopsoil Silt Fraction%0.5
s_siltSubsoil Silt Fraction%0.6
The 19 variables selected through the multicollinearity test were used in MaxEnt modeling.
Table 2. Predicted changes in the climatically suitable habitat area (%) of Juglans regia under different climate change scenarios around the world.
Future Climate Change ScenarioUnchangedLossGainTotal change (= Gain − Loss) 1
Period of 2041–2060RCP 2.696.73.316.813.4
RCP 4.592.37.725.718.0
RCP 6.093.36.720.513.7
RCP 8.595.34.740.635.8
Period of 2061–2080RCP 2.690.69.419.810.4
RCP 4.591.68.419.210.7
RCP 6.092.57.543.736.2
RCP 8.591.18.982.573.6
1 Positive values indicate suitable habitat area expansion.

