Predictors of Microhabitat Frequency and Diversity in Mixed Mountain Forests in South-Western Germany


1
Department of Forest Nature Conservation, Forest Research Institute of Baden-Württemberg (FVA), Wonnhaldestraße 4, D-79100 Freiburg, Germany
2
Chair of Silviculture, Institute of Forest Sciences, Faculty of Environment and Natural Resources, University of Freiburg, Tennenbacherstr. 4, D-79106 Freiburg, Germany
*
Author to whom correspondence should be addressed.
Forests 2018, 9(3), 104; https://doi.org/10.3390/f9030104
Submission received: 30 January 2018
/
Revised: 21 February 2018
/
Accepted: 26 February 2018
/
Published: 28 February 2018
(This article belongs to the Special Issue Old Growth Temperate and Boreal Forests: Processes, Functions, and Dynamics)
Abstract
:Tree-related microhabitats are an important determinant of forest biodiversity. Habitat trees, which typically provide many microhabitats such as hollows, crown dead wood, etc., are therefore selected to maintain those structural attributes within managed forests. To what extent the occurrence of microhabitats on potential habitat trees may be predicted from common tree attributes is a question of high practical relevance. Until now, most studies have attempted to predict the quantity of microhabitats at the tree or forest stand level. In our study, we aimed at explaining microhabitat occurrence from a qualitative perspective by considering their diversity. Tree diameter at breast height (dbh), tree species, and canopy class were useful predictors of microhabitat diversity. Microhabitat diversity on broadleaved trees was on average higher than in conifers of the same diameter. In contrast to microhabitat quantity, microhabitat diversity saturated towards higher dbh levels. Microhabitat diversity in beech trees of lower tree canopy classes was found to be surprisingly high. Habitat trees support not only more, but also more diverse, microhabitats in comparison to crop trees. Considering these findings on microhabitat distribution, the selection of habitat trees within Central European mixed mountain forests can be significantly improved.
1. Introduction
The structural and biological diversity of central European forests have been altered by human activities over time [1,2]. Forest management interventions intended to foster timber production have changed the tree species composition and substantially shortened natural forest life cycles. Thus, all plants, animal species, fungi, and slime moulds depending on specific old-growth attributes have been strongly affected by forestry [3,4,5,6]. Old-growth structures provide habitats and niches that are required by a large number of forest dwelling species [7]. In the Central European landscape, the area of strict forest reserves, which could provide natural forest development with all its features, is rather limited [8,9]. However, to compensate for the lack of old-growth forests in the landscape and to maintain old-growth dependent species in managed forests, the frequency of habitats typical for late successional phases can be substantially increased through forest management [10]. In practice, this can be realized, for example, by the retention of dead wood and habitat trees [10,11]. The retention of habitat trees is a key element in forestnature conservation concepts in many European countries [12]. Once selected, habitat trees can develop naturally until their natural death [13]. Major selection criteria for habitat trees are tree species, dimension, and tree vitality (often expressed as tree canopy class [14], as well as the occurrence of key structures such as, e.g., woodpecker cavities, large nests, and mould cavities [13,15,16]. These key structures are commonly named tree-related microhabitats or simply microhabitats [17,18,19,20]. Since different species are directly linked to certain microhabitat types (e.g., [13,21], microhabitat diversity at a stand scale is essential to maintain forest biodiversity. For example, large cavities are relatively rare but highly important microhabitats since they are relevant for several forest taxa such as birds, insects, bats, and other mammals [22,23,24,25,26,27].
The relation between the occurrence of microhabitats and tree attributes and forest stand characteristics has been studied to some extent [17,18,19,28,29]. The main factors that have been identified as influencing the frequency of microhabitats are tree diameter at breast height (dbh), stand specific management history, and tree species identity and vitality (Table 1). It was found that deciduous trees provide generally more microhabitats than conifers [18,28]. Especially pedunculate and sessile oak (Quercus petraea, Q. robur) appear to be richer in microhabitats than European beech (Fagus sylvatica), silver fir (Abies alba), or Norway spruce (Picea abies) [18]. The number of microhabitats per tree increases with increasing dbh [18,25,28,30]. Therefore, some microhabitat types are missing from small diameter classes [19,31]. In European beech, the number of microhabitats was found to increase with decreasing tree vitality [28]. Independent of tree species and above a minimum dbh, significantly more microhabitats occur on dead trees when compared to living ones [18,25].
However, in most previous studies, only the quantity of microhabitats was considered. One study that considered microhabitat diversity calculated the Shannon-Diversity-Index at the plot scale in native European beech forests in Central Europe [29]. In that study, plot-level microhabitat diversity varied between landowner types, with small-scale private forests providing the highest number and diversity of microhabitats. We are not aware of any study that determined both the amount and diversity of microhabitats at the single tree level.
In this study, we investigated the amount and diversity of microhabitats at the scale of single trees. Our aim was to fill a substantial knowledge gap by taking a qualitative approach to microhabitats by considering their diversity. We hypothesized that a qualitative approach to tree microhabitats using a diversity index leads to a broader understanding of factors affecting microhabitats at the scale of a single tree. In other words, we aimed to test whether microhabitat diversity is driven by the same factors that are influencing the number of microhabitats. Further, we analyzed to what extent microhabitats may be predicted by the easily recordable variable ‘canopy class’. We hypothesized that in lower canopy classes, the microhabitat provision of trees is driven by vitality and not by dbh. Habitat trees are mainly selected by remarkable attributes or dimensions. Therefore, we hypothesize that habitat trees bear not only more, but also more diverse, microhabitats in comparison to crop trees that have been tended for future harvesting.
2. Materials and Methods
2.1. Study Site
Data were collected in the southern Black Forest, south-western Germany (47°72′ N, 8°2′ E). The elevation of the mountain range, where our study stands were located, ranged from 890 m to 1020 m a.s.l. Annual precipitation in this area is around 1840 mm [38] and the mean annual temperature ranges between 5.5 and 6.0 °C [39]. The vegetation period (days with temperature above 10 °C) lasts 143 days starting in May until September [39]. Soils are mainly cambisols which developed on gneiss and magmatites [40]. Dominating forest types are mixed mountain forests composed of European beech (Fagus sylvatica L.; from now on beech), silver fir (Abies alba Mill.; from now on fir), Norway spruce (Picea abies H. Karst.; from now on spruce), and sycamore maple (Acer pseudoplatanus L.; from now on maple) [41]. These forests are often managed as selection forests, ranging from individual tree selection (Plenterforests) to group shelterwoods (Femelschlag) [42].
2.2. Inventory and Definition of Tree Microhabitats
For this study, we surveyed 353 of roughly 500 habitat trees which had been selected in this study region in 2007 [44,45]. Selection criteria for habitat trees were tree cavities, nests, epiphytes, crown deadwood, and tree size. The location of each tree was recorded along with tree attributes like tree status (alive/dead) and diameter at breast height (dbh). These tree attributes were collected to assess relationships between tree attributes and microhabitat characteristics, as well as microhabitat frequency and quality. Additionally, we determined the tree canopy class of each tree using the classification after Kraft [14]: class 1 = predominant; class 2 = dominant; class 3 = partly dominant; class 4 = dominated; class 5 = suppressed. Although it was not invented for habitat tree selection processes, this classification is well known in forestry, easy to apply, and therefore a field-tested variable. For canopy class 5, there were no habitat trees, thus no data available. Data collection was conducted in early spring 2016 and hence relatively long before bud break, which ensured a good sight into the tree crowns.
Microhabitats were inventoried by using a catalog of 64 different microhabitat types and classes ([45,46], summarized in Table A1). For countable microhabitats (e.g., woodpecker cavities or witches’ brooms), we recorded the number of observations. For uncountable microhabitats (e.g., epiphytes), we recorded the presence (refers to 1) or absence (refers to 0). To avoid bias from observer effects (see [46,47]), the microhabitat inventory was conducted by only one person.
In order to compare regular crop trees and habitat trees, we additionally inventoried microhabitats on 324 crop trees in the way described above. Crop tree selection was based on a random plot design (qgis-function ’random points’). On 50 plots with a 15 m radius, we inventoried all trees above 30 cm dbh. We used this dbh threshold in order to guarantee the comparability of both tree groups.
Finally, we assembled two data sets: the habitat tree data for the entire project area and the crop tree data for sample plots. We used habitat tree data for microhabitat modeling and the testing of new predictors. For the comparison between habitat and crop trees, we used the crop tree data and the associated habitat tree data collected in the same forest stands.
2.3. Data Analysis and Statistics
In our analysis, we considered two response variables: The established variable ‘number of microhabitats’ was the sum of all inventoried microhabitats on each tree, and the new variable ‘microhabitat diversity’. For considering ‘microhabitat diversity’ at the single tree level, we calculated ‘microhabitat diversity’ by counting the number of present microhabitat types (Table A1). In order to weigh the different frequencies of microhabitats, we calculated diversity indices as described by Shannon [47,48], using the following equation:
with pi representing the share of one microhabitat type within all microhabitats that were registered for a single tree [48,49]. All analyses were carried out with the R software [49,50]. For all tests, significance was considered when the associated critical value (p) was less than 0.05.
H’ = −∑pi·ln pi
We modeled the response of ‘number of microhabitats’ to several predictors with generalized linear mixed models (GLMM, [50,51]) using the glmer function in the lme4 R package [51,52]. Since ‘number of microhabitats’ was count data, we used a Poisson distribution for modeling. Although this modeling approach was taken in previous studies [18,29], it was required as a direct reference to compare predictors of microhabitat density and diversity. Predictors were ‘dbh’, ‘tree species’, ‘canopy class’, and additionally interactions among these variables. For modeling the response variable ‘microhabitat diversity’, we applied a linear mixed-effects model (LMER) since residuals of those models were normally distributed (Lilliefors normality test p > 0.05). Considering natural variation within our data, we added a random ‘soil-type’ effect to our models. Spatial autocorrelation of the response variables was tested using the correlog function in the ncf R package [52,53]. Neither ‘number of microhabitats’ data nor ‘microhabitat diversity’ data showed autocorrelation. All continuous predictors had been scaled. We used several predictor combinations to find the best model by comparing them with the Akaike information criterion (AIC). Because of a high correlation between ‘dbh’ and ‘tree canopy class’ (r = 0.88, p < 0.01), we did not use these two predictors together in the same model. Analyzing the predictor effects of the best model, we performed a multi-comparison Tukey test using the glht function in the multcomp R package [53,54]. Model visualization was applied by the visreg function of the visreg R package [54,55]. We excluded Norway spruce data from statistical analysis since we found no trees below the canopy class two. Further, we found no sycamore maple crop trees and therefore did not consider crop tree data of this species for modeling.
To facilitate the consideration of our findings in practical forestry, we used 20-cm-diameter classes instead of continuous dbh-values.
3. Results
3.1. Occurrence of Microhabitat Categories
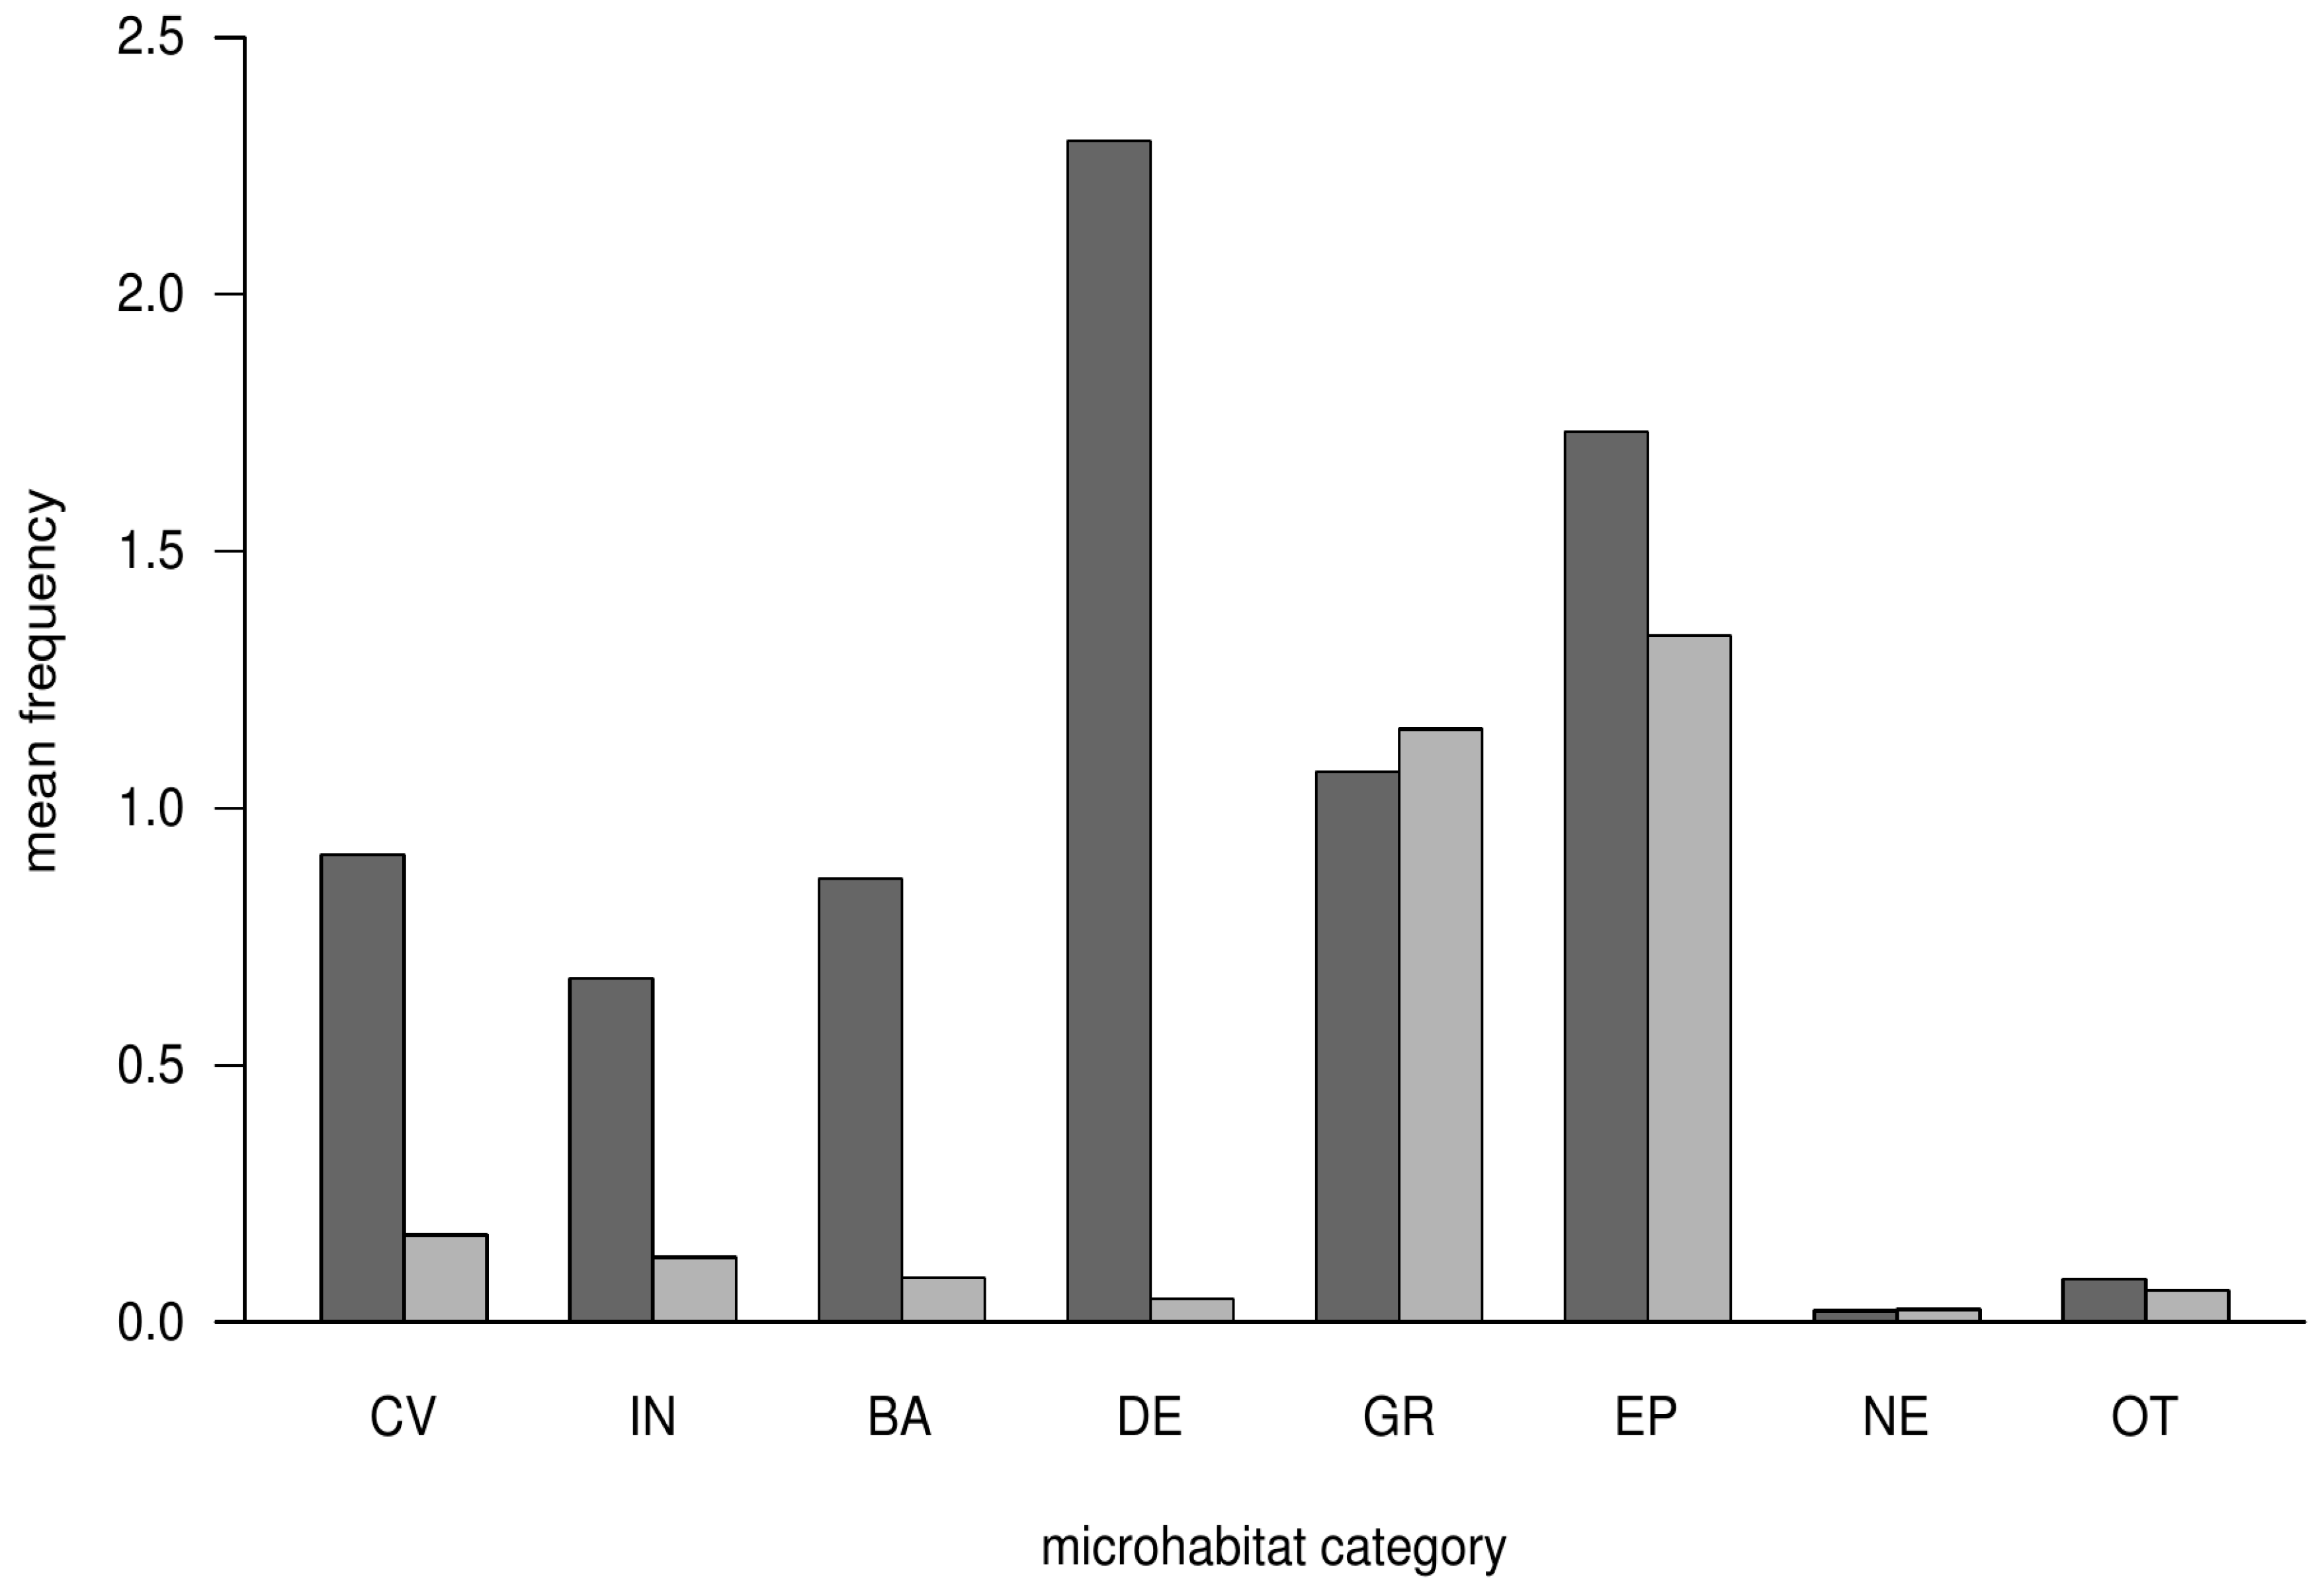
The occurrence of microhabitat categories differed between habitat trees and crop trees (Figure 1). On crop trees, the most frequent microhabitat-categories were related to deformations and growth forms, as well as epiphytes. For these two categories, we observed a frequency above one on crop trees, with 1.1 for deformation-related microhabitats and 1.3 for epiphytes. All other microhabitat categories had a frequency of less than 0.2 for crop trees. On habitat trees, rare microhabitat categories (cavities, injuries, bark) occurred three to four times more frequently than on crop trees (Figure 1). Deadwood-related microhabitats were the most frequent microhabitat category (frequency = 2.3) on habitat trees. This category was scarcely found on crop trees (frequency = 0.1). Nests and other microhabitat categories occurred rarely on habitat and crop trees (frequency < 0.1, Figure 1). In general, microhabitats like woodpecker cavities or perennial fungi were very rare and only found on habitat trees (Table A2).
3.2. Modeling of Microhabitats
We excluded Norway spruce data from statistical analysis since we found no trees below the canopy class two. Further, we found no sycamore maple crop trees. All of the following results are based on habitat tree data of beech, fir, and maple.
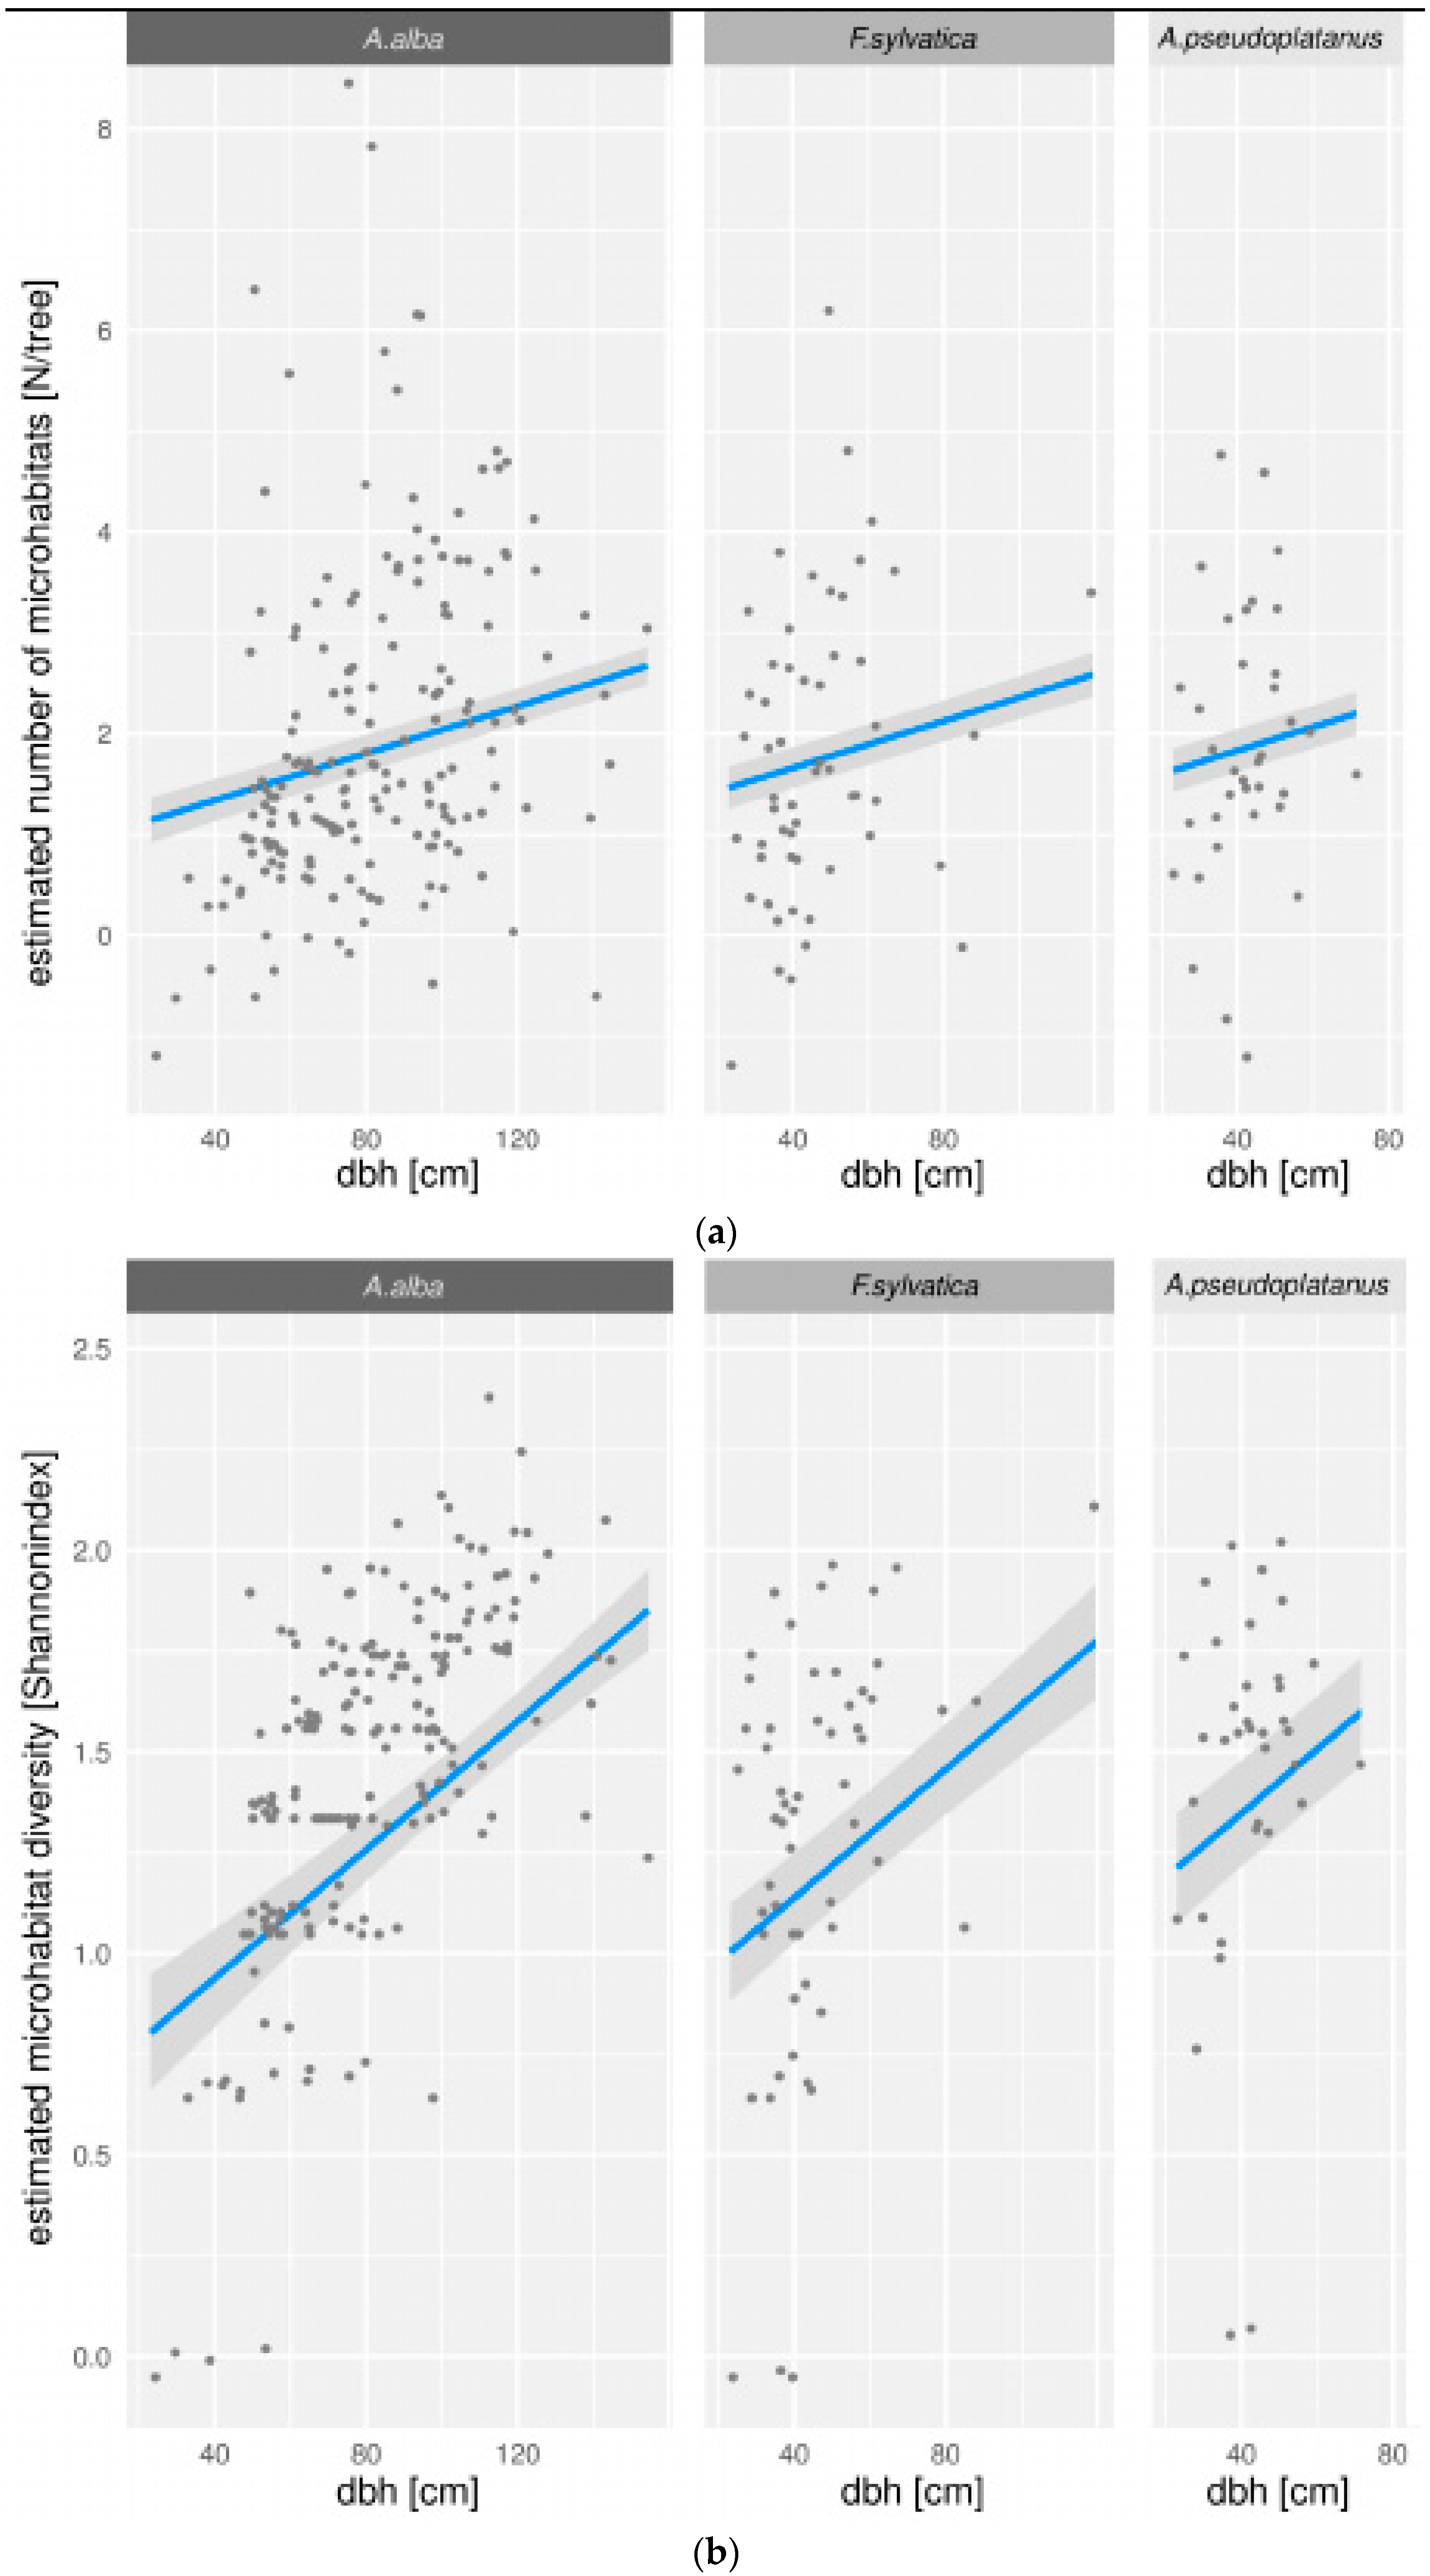
In contrast to previous approaches (e.g., [29]), we followed a simpler approach to microhabitat modeling using variables which could be recorded easily in the field. In this way, we could analyze the effects of each variable on model quality and its predicting quality directly. The LMER for the prediction of ‘microhabitat diversity’ with the lowest AIC comprised the predictors ‘dbh’ and ‘tree species’ (Table 2). Subsequent post-hoc analysis showed that microhabitat diversity was positively and highly significantly linked to dbh (p < 0.001). Further, the analysis of the predictor ‘tree species’ showed that maple had the highest impact, followed by beech and fir (Figure A1). All three tree species had significantly different impacts on microhabitat diversity. Predictions of microhabitat diversity for trees of 40 cm dbh resulted in a diversity-index value of 1.44 for maple, 1.21 for beech, and 1.03 for fir (Figure A1). Adding an interaction term to the model or replacing ‘dbh’ as the predictor with ‘tree canopy class’ did not increase the model quality (Table 2). In general, there were two major changes in model quality: Firstly, when ‘tree canopy class’ was added, AIC decreased by roughly 36.5; secondly, when ‘dbh’ was added to the model, AIC decreased by 35.6.
As for microhabitat diversity, the best GLMER for the number of microhabitats per tree comprised the predictors ‘dbh’ and ‘tree species’ (Table 2).
3.3. Microhabitat Number and Diversity
For this study, we considered 299 living and 10 dead habitat trees, as well as 238 living crop trees (Table 3). Concerning the habitat tree data, the most frequent living tree species was silver fir with a mean dbh of 81.8 cm (±25.3) and an average of 8.5 microhabitats per tree. European beech had a mean dbh of 47.5 cm (±19.7) and an average of 6.5 microhabitats per tree. The third tree species was sycamore maple with a mean dbh of 42.0 cm (±10.5) and an average of 7.0 microhabitats per tree.
The comparison of dead and living trees was only feasible for fir owing to the low number of observations in the other species. Here, we were able to inventory 10 dead habitat trees holding 9.7 microhabitats per tree on average. This was not significantly higher than the average number on living firs (8.5 microhabitats/tree; p = 0.64). However, the average microhabitat diversity of dead firs (H’ = 0.64) was significantly lower compared to that of living ones (H’ = 1.48; Welch Two Sample t-test p < 0.01). This difference between live and dead firs could not be attributed to differences in tree dimensions.
The crop trees supported, on average, less than half the number of microhabitats in comparison to habitat trees. Similarly, the maximum number of microhabitats per tree for crop trees was about a third of the maximum number of microhabitats found in habitat trees. Mean microhabitat diversity of crop trees was reduced by 40% when compared to the mean microhabitat diversity of habitat trees (Table 3).
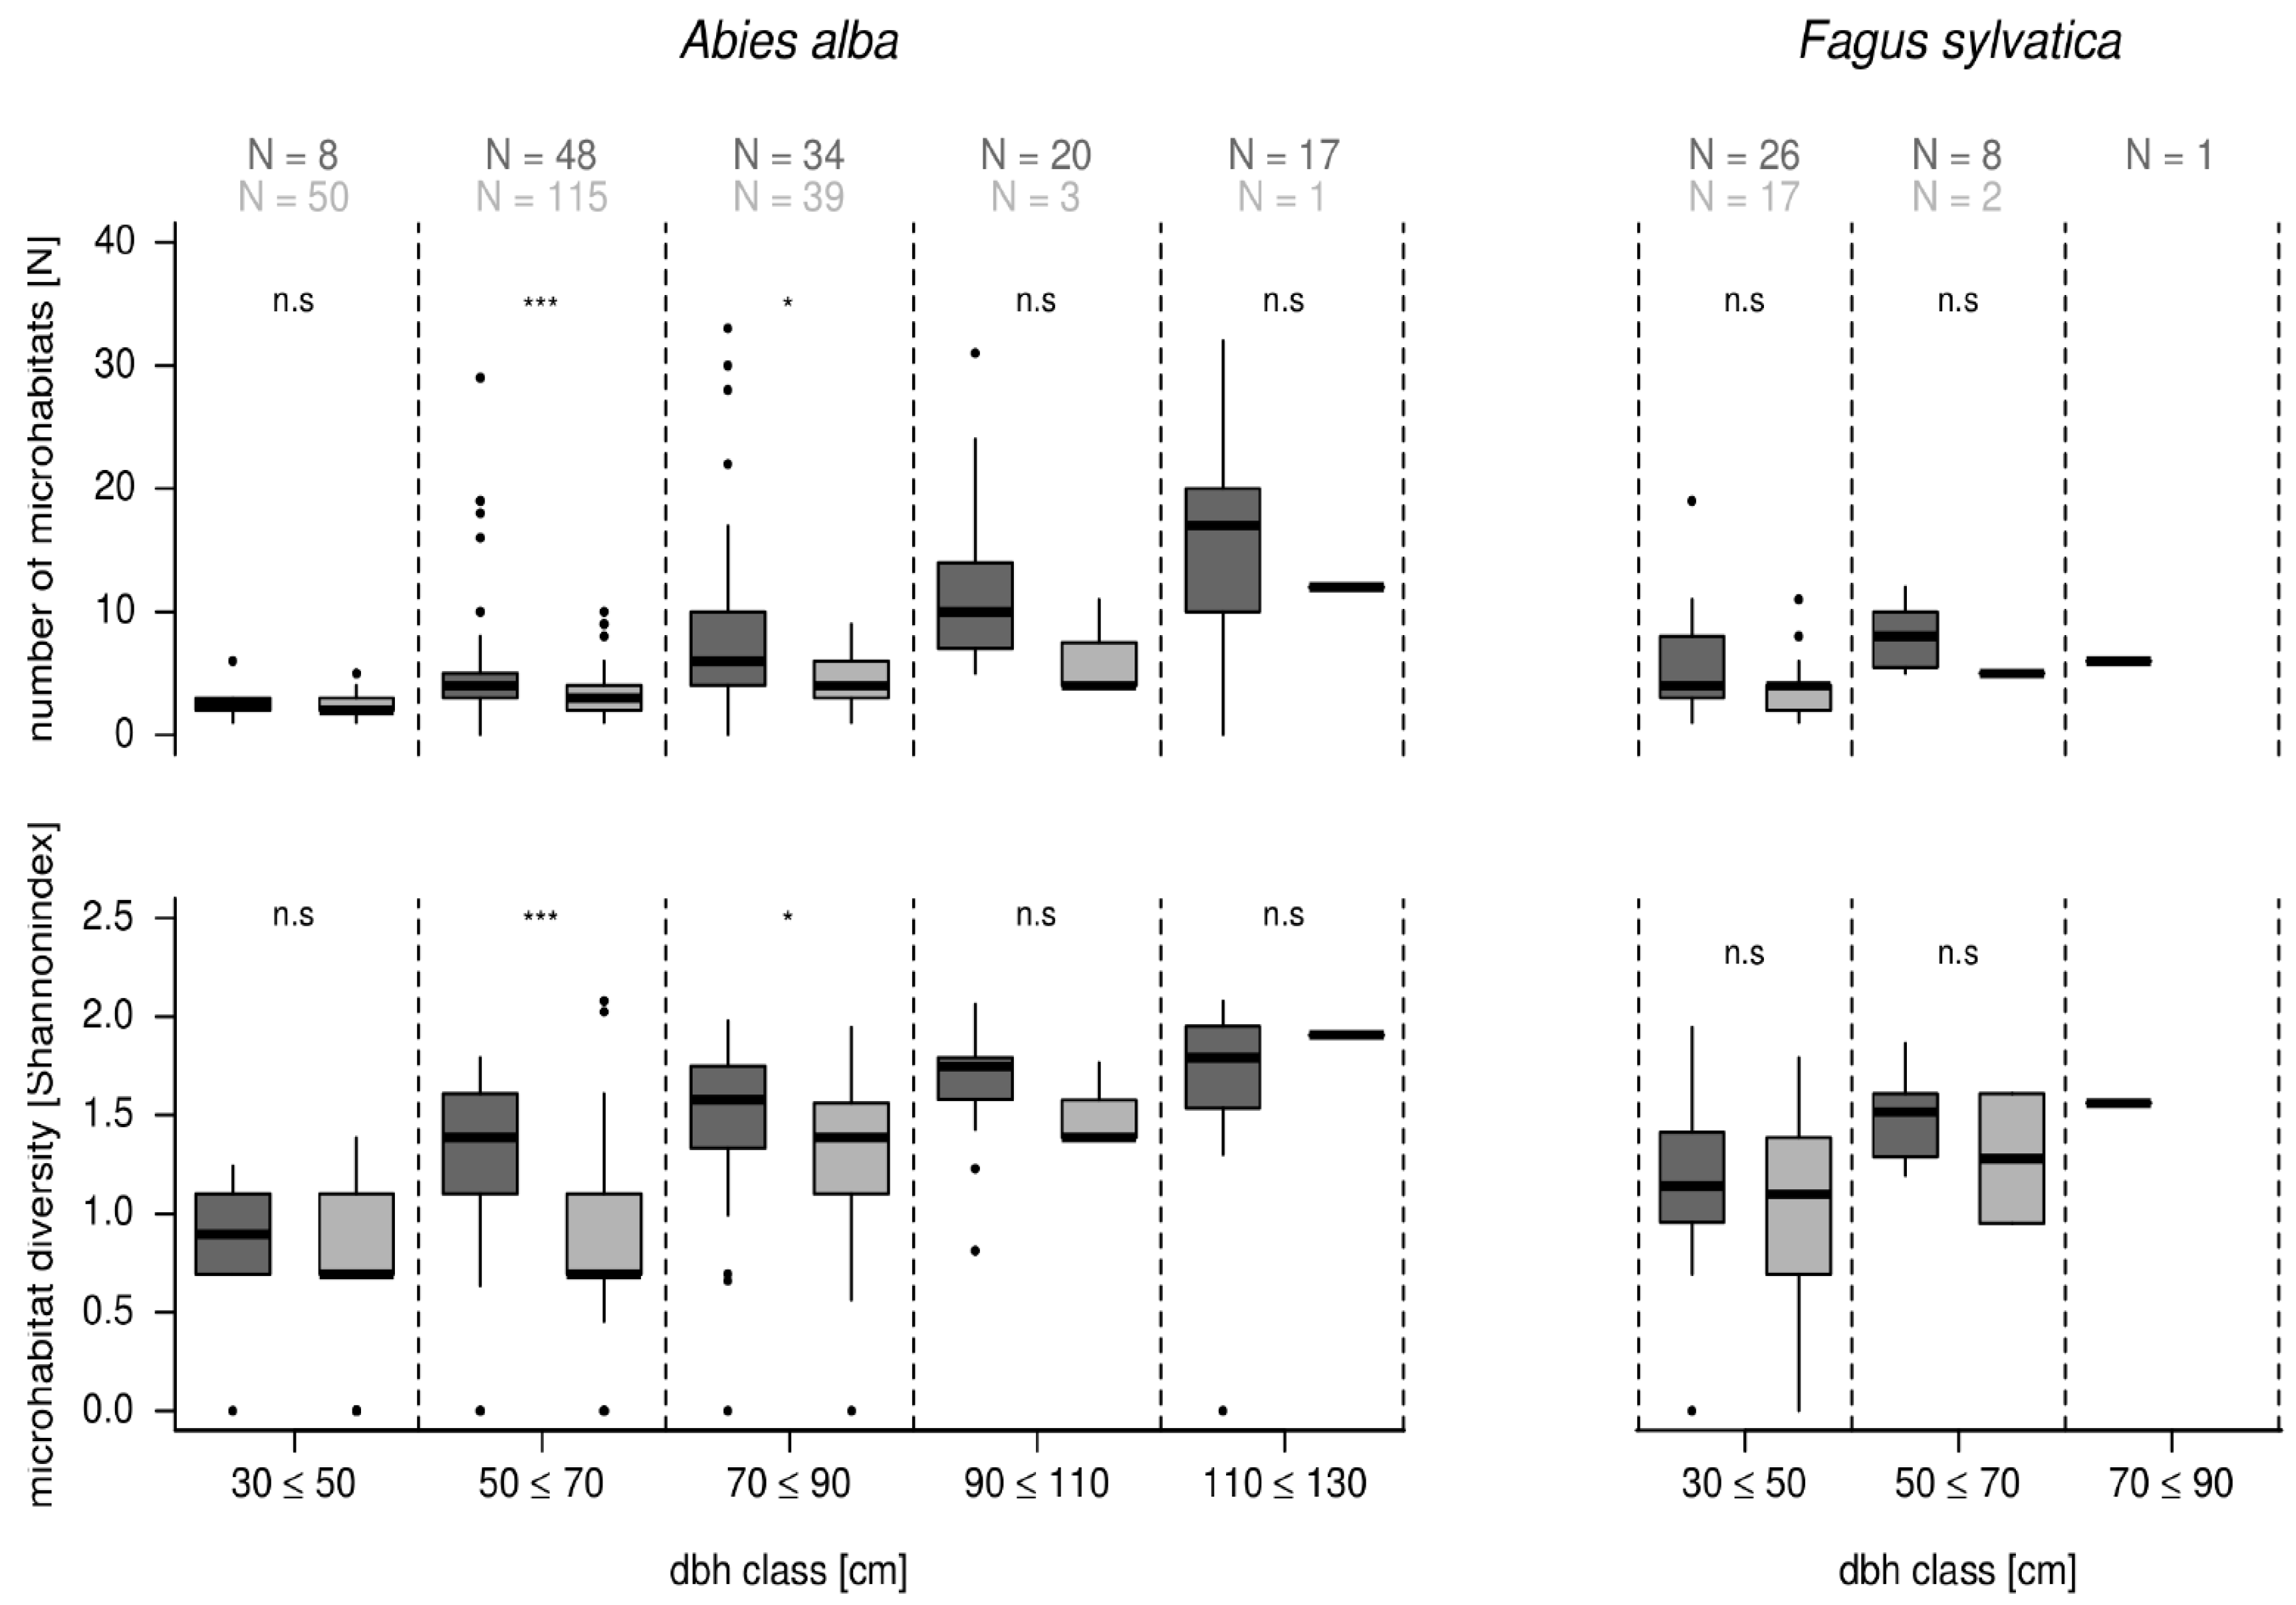
For habitat trees, the number of microhabitats per tree increased with dbh for both beech and fir. However, it increased more steeply for beech (Figure 2). In the highest dbh classes, the average number of microhabitats for beech (dbh > 70) was 14 (±9.1) and reached 15 microhabitats per tree (±6.6) in fir (dbh > 110).
Diversity of microhabitats per tree significantly increased with dbh, but only in lower dbh classes (Figure 2). In larger dbh classes, the best-fit curve for microhabitat diversity saturated. Microhabitat diversity was generally higher in beech than in fir. In the highest dbh classes, mean microhabitat diversity in beech (dbh > 70) was 1.9 (±0.58) and reached 1.8 (±0.29) in fir (dbh > 110) (Figure 2).
In maple, we found no significant correlations between dbh and the number of microhabitats per tree (r = 0.31, p = 0.06) or microhabitat diversity (r = 0.20, p = 0.24).
In addition to dbh, microhabitats were also influenced by the tree canopy class. Additionally, the occurrence of microhabitats in relation to the tree canopy class differed between tree species. For beech, the mean number of microhabitats decreased by half from class 1 to 3 (Figure 3a). However, it increased from class 3 (partly dominant) to class 4 (dominated), which reached the same level as class 1. In firs, we observed an even stronger decrease from canopy class 1 to 3 by 80%. For maple, we found a positive but non-significant trend for the number of microhabitats with decreasing canopy class (Figure 3a).
In fir habitat trees, microhabitat diversity decreased from canopy class 1 to 3. All microhabitats which occurred on class 3 fir habitat trees also occurred on firs of class 1 or 2 (Table A3). In beech habitat trees, microhabitat diversity declined from class 1 to class 2 and to class 3. This decrease was only significant when comparing class 1 and class 3 for beech (Figure 3b). On class 1 and 2 beech habitat trees, we found decayed sapwood or trunk cleavages which did not occur in lower canopy classes (Table A3). Surprisingly, microhabitat diversity in beech also increased significantly from canopy class 3 to class 4 (p < 0.01), which reached the level of class 1 and 2. In contrast to other canopy classes, we found microhabitats like mould cavities without ground contact or clefts (Table A3) on canopy class 4 habitat trees. For maple, the microhabitat diversity slightly increased with decreasing tree canopy class (Figure 3b).
3.4. Comparison of Microhabitats in Habitat Trees and Crop Trees
For this analysis, we considered all living habitat and crop trees located in the fir dominated forest stands of our project area. The following results are based on beech and fir data, since those were the most frequent tree species.
Number and diversity of microhabitats on habitat trees increased with larger dbh classes at a higher rate than on crop trees (Figure 4). For fir, we found no significant difference in microhabitat number or diversity in the smallest dbh class (30–50 cm). In dbh class 50–70 cm and 70–90 cm of fir trees, habitat trees had significantly more, and more diverse, microhabitats. This difference was also found in larger dbh classes of fir trees. However, it was not significant because of the limited sample size of fir crop trees in larger dbh classes. On beech trees, we found no significant differences for microhabitat number or diversity between habitat and crop trees of the same dimension (Figure 4).
4. Discussion
Owing to the detailed and standardized recording of microhabitats following the ‘catalog of tree microhabitats’ [45,46], the presented study contains valuable information about the microhabitat potential of beech, fir, and maple. So far, all species have received little scientific attention in this regard. In addition, some previous studies were less detailed or applied different definitions of microhabitats (e.g., [18,25,29]). Our qualitative analysis confirms the importance of certain variables (species, dbh) for the occurrence of microhabitats. In addition, also considering the diversity of microhabitats (in our case by using the Shannon-Diversity-Index) appears to be a suitable complement to the mere frequency of microhabitats, since rare microhabitats receive more weight in this metric. The analysis considering tree canopy classes provides additional information for some species, which is relevant in practical forestry.
4.1. What Are the Benefits of the Qualitative Perspective on Microhabitats?
In accordance with other studies, positive relationships between dbh classes and the number of microhabitats per tree were found for both beech and fir [19,25,29]. The relationships between microhabitat diversity and dbh, which showed a saturation pattern at higher dbh-classes, have not been described previously (Figure 2). While the frequency of microhabitats increased with larger dbh classes, microhabitat diversity only increased until a certain tree size. Thus, tree species specific dbh thresholds, above which microhabitat diversity stopped increasing significantly, could be determined. In our study, these thresholds are 70 cm dbh for beech and 90 cm dbh for fir. For beech trees, several critical dbh levels concerning microhabitats had been identified previously (70 cm [33]; 42, 60, 73, and 89 cm [19]) and resulted in a recommendation to protect beech trees above a 90 cm dbh [19].
In addition, dbh thresholds for the occurrence of different microhabitat categories (cavities with mould, empty cavities, saproxylic fungi, dendrothelms, missing bark, cracks, sap runs) had been identified for beech and fir [19]. In previous calculations [19], the diversity of microhabitats in one metric was not assessed. We found that microhabitat diversity was generally higher in beech than in silver fir trees of the same dbh class. Likewise, lower dbh thresholds were found for the occurrence of the same number of microhabitat categories in European beech than in silver fir [31].
Previous studies found that the number of microhabitats on snags in mountain forests was significantly higher in comparison to living trees [18,32]. This is totally in line with our results. The difference between microhabitat diversity and number of microhabitats is especially prominent when comparing living and dead firs. We observed an increase in quantity (number of microhabitats) but a significant decrease in quality (microhabitat diversity) from living to dead firs. This means that dead firs support fewer types of microhabitats in comparison to living firs. This result indicates a variable life time, limited persistence, and some kind of succession of microhabitats. In dead and decaying trees, the microhabitat composition changes fundamentally. We found that bark cracks and pockets and saproxylic fungi occurred more often on silver fir snags than on living silver firs (Table A4), which is in accordance with other findings [18,19]. This qualitative change of the microhabitat composition of living and dead firs suggests an important role of habitat trees within the forest ecosystem to provide structural features regarding time and microhabitat type compared to standing dead trees or even lying dead wood. Significant differences in microhabitat densities between strict forest reserves and managed forests [30] confirm the importance of trees left to their natural development for providing biodiversity-related attributes in forests.
To our surprise, we observed a significant increase in microhabitat diversity from ‘partly dominant’ to ‘dominated’ beech trees (Figure 3). In agreement with previous studies [18,19,28], we found a clear dependency between beech vitality and the occurrence of microhabitats. This means that the decreasing vitality of beech trees from canopy class 3 to 4 is related to an increase in the number and diversity of microhabitats. We assume that at that point, tree vitality is replacing dbh as the primary driver for microhabitat development. This assumption is supported by our findings in regard to sycamore maple, as we observed the same tendency of increasing microhabitat frequency and diversity with decreasing tree canopy class (Figure 3). Considering our limited sample size and the lack of literature on maple, we assume that this could be a species-specific attribute.
The benefit of a qualitative perspective on microhabitats using a diversity index is that it facilitates determining the factors driving microhabitat diversity. As habitat trees—in contrast to crop trees—are typically selected with the aim to provide as many, and as many diverse, microhabitats as possible over a large timespan, their selection criteria should be optimized. The saturation of microhabitat diversity we observed for beech and fir in higher dbh classes helps to determine critical values and derive minimum dbh levels for optimal habitat tree selection.
4.2. Are Tree Characteristics Suitable for Microhabitat Assessment?
In addition to dbh and tree species, the tree canopy classes (in our case the classification after Kraft [14]) could be considered for explaining the presence or absence of microhabitats. Thus, we compared models considering dbh or tree canopy classes in order to test which of these two predictors led to more reliable results. Although the canopy class merges the two important variables dbh and vitality, it did not lead to better modeling results when predicting microhabitats. This could be caused by the non-linear relationship between microhabitats and canopy class (Figure 3). Since there is no literature considering microhabitats in relation to tree canopy classes, we are not able to compare our findings with those of other studies.
Our findings clearly confirm dbh as a robust predictor for microhabitat occurrences and an adequate habitat tree selection criterion. This is reflected in applied forest management concepts that often define ‘over-sized’ trees exceeding 100 cm dbh to be suitable habitat trees (e.g., [55,56,57]) as they play an important and multifaceted role in ecosystems [57,58,59].
Interestingly, some guidelines of German state forest services explicitly exclude trees in the canopy classes 4 and 5 from the habitat tree selection process [56,57,59,60]. This may be reasonable considering the low vitality and therefore the expected short lifespan of those trees. However, our results suggest that beech and maple trees of canopy class 4 could substantially contribute to a diverse microhabitat occurrence within forest stands, since we found microhabitats which occurred only in this canopy class (Table A3). Likewise, fungi, especially perennial polypores (e.g., Fomes fometarius or Fomitopsis pinicola), reduce tree vitality and therefore the longevity of trees [60,61]. In our study, fungi were primarily found on smaller habitat trees (Table A3). Thus, there is no indication of the reduced longevity of large diameter habitat trees owing to fungal attack.
The consideration of microhabitats in habitat tree selection resultsin a continuous and persistent supply of various tree-related habitats (Figure 1 and Figure 4). Furthermore, some microhabitats are likely to indicate the presence of others. The occurrence of, e.g., cavities, was related to co-occurrence of dendrothelms, cracks, and saproxylic fungi [19]. This suggests that there are key microhabitats which are appropriate indicators for trees with high microhabitat diversity. Thus, key microhabitats are suitable criteria for habitat tree selection. Other microhabitats such as epiphytes or growth-form-related microhabitats which occurred with similar frequencies on habitat and crop trees are probably driven by other factors such as site conditions and tree genetic properties.
Habitat trees or groups of habitat trees play a crucial role in the forest matrix as habitats for species relying on old-growth forest attributes [62]. Hence our results regarding microhabitat features of habitat trees are of high relevance for practical habitat tree selection. However, our study also shows that the habitat value of crop trees should not be underestimated. When scaled to a forest stand or the landscape, the overall number of microhabitats provided by crop trees exceeds all microhabitats on habitat trees simply by the fact that there are many more crop trees than habitat trees. However, their lifetime is determined by management so that the time is likely too short for the development of some key microhabitats (especially cavities [63]).
5. Conclusions and Recommendations for Forest Managers
To enhance biodiversity conservation, integrative management actions such as the retention of habitat trees need to be effective and efficient. Therefore, trees that provide the highest frequency and diversity of microhabitats should be preferably selected as habitat trees. According to our results, species-specific thresholds, which have so far not been applied, may be set at 90 cm dbh for fir and 70 cm dbh for beech. Above these diameters, microhabitat diversity stopped increasing significantly. Unfortunately, we cannot give any recommendation for sycamore maple due to our small sample size.
For the practical use of our results in mixed montane forests, we recommend selecting ‘(pre)dominant’ beech and fir individuals as habitat trees. These are likely to provide numerous and highly diverse microhabitats. If they show no signs of reduced vitality (e.g., crown dieback, fungi), they could persist over a large timespan and hence maintain microhabitats. In addition, ‘dominated’ and ‘suppressed’ beech and maple trees should also be retained, since they tend to support other microhabitats (e.g., clefts, mould cavities) more than ‘dominating’ trees.
Acknowledgments
Expenses for the fieldwork had been funded by ‘Förderung forstliche Forschung’ of the Ministerium für Ländlichen Raum und Verbraucherschutz Baden-Württemberg. We thank the forester Peter Herbst and his colleagues for their help and support during the fieldwork. J. Bauhus and P. Pyttel are supported by the DFG-funded research training group “Conservation of Biodiversity in Multiple-Use Forests of Central Europe; GRK 2123/1”.
Author Contributions
J.B. and J.S. conceived the original research idea. All authors contributed to the experimental design. J.G. was responsible for the data collection. J.G. and P.P. analyzed the data. All authors wrote the paper.
Conflicts of Interest
The authors declare no conflict of interest.
Appendix A

Table A1.
Catalogue of the inventoried microhabitats with the code, description, and criteria for each structure (after [45,46]).
| Microhabitat Group | Code | Type | |
|---|---|---|---|
| Cavities | Woodpecker cavities | CV11 | Ø = 4 cm |
| CV12 | Ø = 5–6 cm | ||
| CV13 | Ø > 10 cm | ||
| CV14 | Ø ≥ 10 cm (feeding hole) | ||
| CV15 | Woodpecker “flute“/cavity string | ||
| Trunk and mould cavities | CV21 | Ø ≥ 10 cm (ground contact) | |
| CV22 | Ø ≥ 30 cm (ground contact) | ||
| CV23 | Ø ≥ 10 | ||
| CV24 | Ø ≥ 30 | ||
| CV25 | Ø ≥ 30 cm/semi-open | ||
| CV26 | Ø ≥ 30 cm/open top | ||
| Branch holes | CV31 | Ø ≥ 5 cm | |
| CV32 | Ø ≥ 10 cm | ||
| CV33 | Hollow branch, Ø ≥ 10 cm | ||
| Dendrotelms and water-filled holes | CV41 | Ø ≥ 3 cm/trunk base | |
| CV42 | Ø ≥ 15 cm/trunk base | ||
| CV43 | Ø ≥ 5 cm/crown | ||
| CV44 | Ø ≥ 15 cm/crown | ||
| Insect galleries and bore holes | CV51 | Gallery with single small bore holes | |
| CV52 | Large bore hole, Ø ≥ 2cm | ||
| Injuries and wounds | Bark loss/exposed sapwood | IN11 | Bark loss 25–600 cm², decay stage < 3 |
| IN12 | Bark loss > 600 cm², decay stage < 3 | ||
| IN13 | Bark loss 25–600 cm², decay stage = 3 | ||
| IN14 | Bark loss > 600 cm², decay stage = 3 | ||
| Exposed heartwood/trunk and crown breakage | IN21 | Broken trunk, Ø ≥ 20 cm at the broken end | |
| IN22 | Broken tree crown/fork, exposed wood ≥ 300 cm² | ||
| IN23 | Broken limb, Ø ≥ 20 cm at the broken end | ||
| IN24 | Splintered stem, Ø ≥ 20 cm at the broken end | ||
| Cracks and scars | IN31 | Length ≥ 30 cm, width > 1 cm, depth > 10 cm | |
| IN32 | Length ≥ 100 cm, width > 1 cm, depth > 10 cm | ||
| IN33 | Lightning scar | ||
| IN34 | Fire scar, ≥ 600 cm² | ||
| Bark | Bark | BA11 | Bark shelter, width > 1 cm, depth > 10 cm, height > 10 cm |
| BA12 | Bark pocket, width > 1 cm, depth > 10 cm, height > 10 cm | ||
| BA21 | Coarse bark | ||
| Dead wood | Dead branches and limbs/crown deadwood | DE11 | Ø 10–20 cm, ≥ 50 cm, sun exposed |
| DE12 | Ø > 20 cm, ≥ 50 cm, sun exposed | ||
| DE13 | Ø 10–20 cm, ≥ 50 cm, not sun exposed | ||
| DE14 | Ø > 20 cm, ≥ 50 cm, not sun exposed | ||
| DE15 | Dead top, Ø ≥ 10 cm | ||
| Deformation/growth form | Root buttress cavities | GR11 | Ø ≥ 5 cm |
| GR12 | Ø ≥ 10 cm | ||
| GR13 | Trunk cleavage, length ≥ 30 cm | ||
| Witches broom | GR21 | Witches broom, Ø > 50 cm | |
| GR22 | Water sprout | ||
| Cancers and burrs | GR31 | Cancerous growth, Ø > 20 cm | |
| GR32 | Decayed canker, Ø > 20 cm | ||
| Epiphytes | Fruiting bodies fungi | EP11 | Annual polypores, Ø > 5 cm |
| EP12 | Perennial polypores, Ø > 10 cm | ||
| EP13 | Pulpy agaric, Ø > 5 cm | ||
| EP14 | Large ascomycetes, Ø > 5 cm | ||
| Myxomycetes | EP21 | Myxomycetes, Ø > 5 cm | |
| Epiphytic crypto- and phanerogams | EP31 | Epiphytic bryophytes, coverage > 25% | |
| EP32 | Epiphytic foliose and fruticose lichens, coverage > 25% | ||
| EP33 | Lianas, coverage > 25% | ||
| EP34 | Epiphytic ferns, >5 fronds | ||
| EP35 | Mistletoe | ||
| Nests | Nests | NE11 | Large vertebrate nest, Ø > 80 cm |
| NE12 | Small vertebrate nest, Ø > 10 cm | ||
| NE21 | Invertebrate nest | ||
| Other | Sap and resin run | OT11 | Sap flow, >50 cm |
| OT12 | Resin flow and pockets, >50 cm | ||
| Microsoil | OT21 | Crown microsoil | |
| OT22 | Bark microsoil | ||
Table A2.
Microhabitat frequency on crop trees and habitat trees. For microhabitat codes, see Table A1.
Table A2.
Microhabitat frequency on crop trees and habitat trees. For microhabitat codes, see Table A1.
| Microhabitat | Frequency | |
|---|---|---|
| Crop Trees | Habitat Trees | |
| CV11 | 0 | 0.016 |
| CV12 | 0 | 0.012 |
| CV13 | 0 | 0 |
| CV14 | 0 | 0.097 |
| CV15 | 0 | 0 |
| CV21 | 0 | 0.103 |
| CV22 | 0 | 0.009 |
| CV23 | 0.003 | 0.009 |
| CV24 | 0 | 0 |
| CV25 | 0 | 0.003 |
| Cv26 | 0 | 0 |
| CV31 | 0.077 | 0.231 |
| CV32 | 0.009 | 0.04 |
| CV33 | 0 | 0.003 |
| CV41 | 0.003 | 0.012 |
| CV42 | 0 | 0 |
| CV43 | 0.006 | 0.037 |
| CV44 | 0 | 0.012 |
| CV51 | 0.071 | 0.318 |
| CV52 | 0 | 0.006 |
| IN11 | 0.08 | 0.274 |
| IN12 | 0.009 | 0.022 |
| IN13 | 0.015 | 0.006 |
| IN14 | 0.003 | 0.003 |
| IN21 | 0.003 | 0.047 |
| IN22 | 0.003 | 0.025 |
| IN23 | 0.009 | 0.274 |
| IN24 | 0 | 0 |
| IN31 | 0 | 0.003 |
| IN32 | 0.003 | 0.012 |
| IN33 | 0 | 0.003 |
| IN34 | 0 | 0 |
| BA11 | 0.003 | 0.199 |
| BA12 | 0 | 0 |
| BA21 | 0.083 | 0.664 |
| DE11 | 0.022 | 1.056 |
| DE12 | 0.003 | 0.234 |
| DE13 | 0.019 | 0.788 |
| DE14 | 0 | 0.181 |
| DE15 | 0.003 | 0.04 |
| GR11 | 0.574 | 0.221 |
| GR12 | 0.204 | 0.087 |
| GR13 | 0.003 | 0.012 |
| GR21 | 0.293 | 0.181 |
| GR22 | 0.025 | 0.445 |
| GR31 | 0.003 | 0.022 |
| GR32 | 0.052 | 0.103 |
| EP11 | 0.003 | 0.009 |
| EP12 | 0 | 0.009 |
| EP13 | 0 | 0.003 |
| EP14 | 0 | 0.003 |
| EP21 | 0 | 0.003 |
| EP31 | 0.543 | 0.85 |
| EP32 | 0.784 | 0.819 |
| EP33 | 0 | 0 |
| EP34 | 0.003 | 0.034 |
| EP35 | 0.003 | 0 |
| NE11 | 0 | 0.016 |
| NE12 | 0.025 | 0.006 |
| NE21 | 0 | 0 |
| OT11 | 0.009 | 0.009 |
| OT12 | 0.031 | 0.037 |
| OT21 | 0.003 | 0.016 |
| OT22 | 0.019 | 0.022 |
Table A3.
Microhabitat frequencies on Abies alba and Fagus sylvatica in regard to canopy and dbh classes. For microhabitat codes, see Table A1.
Table A3.
Microhabitat frequencies on Abies alba and Fagus sylvatica in regard to canopy and dbh classes. For microhabitat codes, see Table A1.
| Micro-Habitat | Abies alba | Fagus sylvatica | ||||||||||||||||
|---|---|---|---|---|---|---|---|---|---|---|---|---|---|---|---|---|---|---|
| Canopy Class | dbh Class [cm] | Canopy Class | dbh Class [cm] | |||||||||||||||
| 1 | 2 | 3 | 4 | 30–50 | 50–70 | 70–90 | 90–110 | 110–130 | 1 | 2 | 3 | 4 | 30–50 | 50–70 | 70–90 | 90–110 | 110–130 | |
| CV11 | 0.013 | 0.029 | 0 | 0 | 0 | 0.031 | 0 | 0 | 0.015 | 0 | 0 | 0 | 0 | 0 | 0 | 0 | 0 | 0 |
| CV12 | 0.013 | 0 | 0 | 0 | 0 | 0 | 0.031 | 0 | 0 | 0 | 0 | 0 | 0 | 0 | 0 | 0 | 0 | 0 |
| CV13 | 0 | 0 | 0 | 0 | 0 | 0 | 0 | 0 | 0 | 0 | 0 | 0 | 0 | 0 | 0 | 0 | 0 | 0 |
| CV14 | 0.032 | 0.029 | 0 | 0 | 0 | 0.031 | 0.062 | 0 | 0 | 0 | 0.2 | 0 | 0 | 0.062 | 0 | 0 | 0 | 0 |
| CV15 | 0 | 0 | 0 | 0 | 0 | 0 | 0 | 0 | 0 | 0 | 0 | 0 | 0 | 0 | 0 | 0 | 0 | 0 |
| CV21 | 0.152 | 0 | 0 | 0 | 0 | 0.015 | 0.108 | 0.138 | 0.108 | 0.083 | 0.1 | 0.048 | 0.182 | 0.077 | 0 | 0 | 0.015 | 0 |
| CV22 | 0.006 | 0 | 0 | 0 | 0 | 0 | 0 | 0.015 | 0 | 0 | 0 | 0.048 | 0 | 0.015 | 0 | 0 | 0 | 0 |
| CV23 | 0.006 | 0 | 0 | 0 | 0 | 0 | 0 | 0 | 0.015 | 0 | 0 | 0 | 0.091 | 0 | 0.015 | 0 | 0 | 0 |
| CV24 | 0 | 0 | 0 | 0 | 0 | 0 | 0 | 0 | 0 | 0 | 0 | 0 | 0 | 0 | 0 | 0 | 0 | 0 |
| CV25 | 0.006 | 0 | 0 | 0 | 0 | 0 | 0 | 0 | 0.015 | 0 | 0 | 0 | 0 | 0 | 0 | 0 | 0 | 0 |
| CV26 | 0 | 0 | 0 | 0 | 0 | 0 | 0 | 0 | 0 | 0 | 0 | 0 | 0 | 0 | 0 | 0 | 0 | 0 |
| CV31 | 0.013 | 0 | 0 | 0 | 0 | 0 | 0.031 | 0 | 0 | 0.5 | 1.2 | 0.19 | 0.909 | 0.323 | 0.277 | 0.031 | 0.015 | 0.031 |
| CV32 | 0.013 | 0.029 | 0 | 0 | 0 | 0.015 | 0 | 0.015 | 0.015 | 0.333 | 0.1 | 0 | 0.182 | 0.031 | 0.062 | 0 | 0.015 | 0.015 |
| CV33 | 0 | 0 | 0 | 0 | 0 | 0 | 0 | 0 | 0 | 0 | 0 | 0 | 0 | 0 | 0 | 0 | 0 | 0 |
| CV41 | 0 | 0.029 | 0 | 0 | 0 | 0.015 | 0 | 0 | 0 | 0 | 0.05 | 0.048 | 0 | 0.031 | 0 | 0 | 0 | 0 |
| CV42 | 0 | 0 | 0 | 0 | 0 | 0 | 0 | 0 | 0 | 0 | 0 | 0 | 0 | 0 | 0 | 0 | 0 | 0 |
| CV43 | 0 | 0 | 0 | 0 | 0 | 0 | 0 | 0 | 0 | 0.583 | 0.15 | 0 | 0.091 | 0.031 | 0.046 | 0 | 0.062 | 0.031 |
| CV44 | 0 | 0 | 0 | 0 | 0 | 0 | 0 | 0 | 0 | 0.083 | 0.05 | 0 | 0.091 | 0.015 | 0.015 | 0 | 0 | 0.015 |
| CV51 | 0.494 | 0.343 | 0 | 0 | 0.015 | 0.231 | 0.354 | 0.446 | 0.338 | 0 | 0.15 | 0.048 | 0.091 | 0.046 | 0.015 | 0.015 | 0 | 0 |
| CV52 | 0.013 | 0 | 0 | 0 | 0 | 0 | 0.031 | 0 | 0 | 0 | 0 | 0 | 0 | 0 | 0 | 0 | 0 | 0 |
| IN11 | 0.19 | 0.171 | 0 | 0 | 0.015 | 0.169 | 0.108 | 0.2 | 0.062 | 0.917 | 0.2 | 0.143 | 0.455 | 0.123 | 0.092 | 0.046 | 0.077 | 0.015 |
| IN12 | 0.013 | 0 | 0 | 0 | 0 | 0 | 0.015 | 0 | 0.015 | 0.083 | 0.1 | 0 | 0.091 | 0.015 | 0.031 | 0 | 0.015 | 0 |
| IN13 | 0 | 0 | 0 | 0 | 0 | 0 | 0 | 0 | 0 | 0 | 0.05 | 0 | 0 | 0 | 0.015 | 0 | 0 | 0 |
| IN14 | 0 | 0 | 0 | 0 | 0 | 0 | 0 | 0 | 0 | 0.083 | 0 | 0 | 0 | 0 | 0 | 0 | 0.015 | 0 |
| IN21 | 0.057 | 0.057 | 0 | 0 | 0.015 | 0.015 | 0.046 | 0.062 | 0.031 | 0 | 0.05 | 0 | 0.091 | 0.015 | 0.015 | 0 | 0 | 0 |
| IN22 | 0 | 0 | 0 | 0 | 0 | 0 | 0 | 0 | 0 | 0.083 | 0.05 | 0.095 | 0.182 | 0.077 | 0 | 0 | 0.015 | 0 |
| IN23 | 0.076 | 0 | 0 | 0 | 0 | 0 | 0.031 | 0.046 | 0.108 | 2.083 | 0.6 | 0.381 | 0.636 | 0.354 | 0.246 | 0.046 | 0.092 | 0.062 |
| IN24 | 0 | 0 | 0 | 0 | 0 | 0 | 0 | 0 | 0 | 0 | 0 | 0 | 0 | 0 | 0 | 0 | 0 | 0 |
| IN31 | 0 | 0 | 0 | 0 | 0 | 0 | 0 | 0 | 0 | 0 | 0 | 0 | 0 | 0 | 0 | 0 | 0 | 0 |
| IN32 | 0.006 | 0 | 0 | 0 | 0 | 0 | 0.015 | 0 | 0 | 0 | 0 | 0 | 0.091 | 0.015 | 0 | 0 | 0 | 0 |
| IN33 | 0.006 | 0 | 0 | 0 | 0 | 0 | 0.015 | 0 | 0 | 0 | 0 | 0 | 0 | 0 | 0 | 0 | 0 | 0 |
| IN34 | 0 | 0 | 0 | 0 | 0 | 0 | 0 | 0 | 0 | 0 | 0 | 0 | 0 | 0 | 0 | 0 | 0 | 0 |
| BA11 | 0.133 | 0.057 | 0 | 0 | 0 | 0.062 | 0.215 | 0.077 | 0 | 0.167 | 0.15 | 0.048 | 0.091 | 0.031 | 0.046 | 0 | 0.031 | 0 |
| BA12 | 0 | 0 | 0 | 0 | 0 | 0 | 0 | 0 | 0 | 0 | 0 | 0 | 0 | 0 | 0 | 0 | 0 | 0 |
| BA21 | 0.93 | 0.629 | 0.333 | 0 | 0.077 | 0.738 | 0.723 | 0.662 | 0.415 | 0 | 0 | 0 | 0 | 0 | 0 | 0 | 0 | 0 |
| DE11 | 1.563 | 0.886 | 0 | 0 | 0 | 0.4 | 1.446 | 1.154 | 1.277 | 1.5 | 0.5 | 0.476 | 0.455 | 0.338 | 0.215 | 0.031 | 0.031 | 0.046 |
| DE12 | 0.184 | 0.971 | 0 | 0 | 0 | 0.231 | 0.431 | 0.015 | 0.292 | 0.417 | 0 | 0 | 0 | 0.046 | 0 | 0 | 0.031 | 0 |
| DE13 | 1.089 | 0.914 | 0 | 0 | 0 | 0.415 | 0.846 | 0.769 | 1.108 | 1.167 | 0.5 | 0.048 | 0 | 0.123 | 0.169 | 0.031 | 0.062 | 0 |
| DE14 | 0.266 | 0.229 | 0 | 0 | 0 | 0 | 0.323 | 0.031 | 0.415 | 0.167 | 0 | 0.048 | 0 | 0.015 | 0 | 0 | 0.031 | 0 |
| DE15 | 0.044 | 0 | 0 | 0 | 0 | 0 | 0 | 0.031 | 0.077 | 0 | 0.05 | 0.048 | 0 | 0.015 | 0.015 | 0 | 0 | 0 |
| GR11 | 0.222 | 0.143 | 0 | 0 | 0 | 0.077 | 0.185 | 0.215 | 0.138 | 0.917 | 0.35 | 0.143 | 0.273 | 0.154 | 0.108 | 0 | 0.062 | 0.046 |
| GR12 | 0.108 | 0.029 | 0 | 0 | 0 | 0.031 | 0.077 | 0.092 | 0.077 | 0.25 | 0.05 | 0 | 0 | 0.015 | 0.015 | 0 | 0.031 | 0 |
| GR13 | 0.013 | 0 | 0 | 0 | 0 | 0 | 0.015 | 0 | 0.015 | 0.167 | 0 | 0 | 0 | 0 | 0.031 | 0 | 0 | 0 |
| GR21 | 0.354 | 0.057 | 0 | 0 | 0 | 0 | 0.077 | 0.246 | 0.569 | 0 | 0 | 0 | 0 | 0 | 0 | 0 | 0 | 0 |
| GR22 | 0.899 | 0.029 | 0 | 0 | 0.015 | 0.169 | 0.662 | 0.908 | 0.446 | 0 | 0 | 0 | 0 | 0 | 0 | 0 | 0 | 0 |
| GR31 | 0.025 | 0 | 0 | 0 | 0 | 0 | 0 | 0 | 0.062 | 0 | 0.05 | 0 | 0.091 | 0.015 | 0.015 | 0 | 0 | 0 |
| GR32 | 0.177 | 0.114 | 0 | 0 | 0 | 0.169 | 0.123 | 0.123 | 0.077 | 0 | 0 | 0 | 0.091 | 0.015 | 0 | 0 | 0 | 0 |
| EP11 | 0.013 | 0 | 0 | 0 | 0 | 0.031 | 0 | 0 | 0 | 0 | 0 | 0.048 | 0 | 0.015 | 0 | 0 | 0 | 0 |
| EP12 | 0 | 0 | 0 | 0 | 0 | 0 | 0 | 0 | 0 | 0.25 | 0 | 0 | 0 | 0.046 | 0 | 0 | 0 | 0 |
| EP13 | 0 | 0 | 0 | 0 | 0 | 0 | 0 | 0 | 0 | 0 | 0 | 0 | 0 | 0 | 0 | 0 | 0 | 0 |
| EP14 | 0.006 | 0 | 0 | 0 | 0 | 0 | 0 | 0 | 0.015 | 0 | 0 | 0 | 0 | 0 | 0 | 0 | 0 | 0 |
| EP21 | 0 | 0 | 0 | 0 | 0 | 0 | 0 | 0 | 0 | 0 | 0 | 0 | 0 | 0 | 0 | 0 | 0 | 0 |
| EP31 | 0.911 | 0.914 | 0.667 | 0 | 0.2 | 0.815 | 0.785 | 0.585 | 0.354 | 0.833 | 1 | 0.857 | 0.818 | 0.585 | 0.215 | 0.031 | 0.031 | 0.015 |
| EP32 | 0.949 | 0.943 | 0.333 | 1 | 0.185 | 0.831 | 0.769 | 0.677 | 0.385 | 0.75 | 0.7 | 0.524 | 0.545 | 0.369 | 0.154 | 0.046 | 0.031 | 0.015 |
| EP33 | 0 | 0 | 0 | 0 | 0 | 0 | 0 | 0 | 0 | 0 | 0 | 0 | 0 | 0 | 0 | 0 | 0 | 0 |
| EP34 | 0.019 | 0.029 | 0 | 0 | 0 | 0 | 0.031 | 0.015 | 0.015 | 0.25 | 0.05 | 0 | 0.182 | 0.015 | 0.031 | 0 | 0.046 | 0 |
| EP35 | 0 | 0 | 0 | 0 | 0 | 0 | 0 | 0 | 0 | 0 | 0 | 0 | 0 | 0 | 0 | 0 | 0 | 0 |
| NE11 | 0.032 | 0 | 0 | 0 | 0 | 0 | 0.046 | 0.015 | 0.015 | 0 | 0 | 0 | 0 | 0 | 0 | 0 | 0 | 0 |
| NE12 | 0.013 | 0 | 0 | 0 | 0 | 0.015 | 0 | 0 | 0.015 | 0 | 0 | 0 | 0 | 0 | 0 | 0 | 0 | 0 |
| NE21 | 0 | 0 | 0 | 0 | 0 | 0 | 0 | 0 | 0 | 0 | 0 | 0 | 0 | 0 | 0 | 0 | 0 | 0 |
| OT11 | 0.006 | 0 | 0 | 0 | 0 | 0 | 0.015 | 0 | 0 | 0.167 | 0 | 0 | 0 | 0 | 0.031 | 0 | 0 | 0 |
| OT12 | 0.006 | 0.029 | 0 | 0 | 0 | 0.015 | 0 | 0.015 | 0 | 0 | 0 | 0 | 0 | 0 | 0 | 0 | 0 | 0 |
| OT21 | 0.006 | 0.029 | 0 | 0 | 0 | 0 | 0.015 | 0 | 0.015 | 0.083 | 0 | 0 | 0 | 0 | 0 | 0 | 0.015 | 0 |
| OT22 | 0.006 | 0 | 0 | 0 | 0 | 0.015 | 0 | 0 | 0 | 0 | 0.05 | 0.095 | 0.182 | 0.062 | 0.015 | 0 | 0 | 0 |
Table A4.
Microhabitat frequencies for living and dead Abies alba habitat trees. For microhabitat codes, see Table A1.
Table A4.
Microhabitat frequencies for living and dead Abies alba habitat trees. For microhabitat codes, see Table A1.
| Microhabitat | Tree Status | |
|---|---|---|
| Alive | Dead | |
| CV1 * | 0.056 | 0.500 |
| CV2 * | 0.137 | 0.100 |
| CV3 * | 0.025 | 0 |
| CV4 * | 0.005 | 0 |
| CV5 * | 0.467 | 0.700 |
| IN1 * | 0.193 | 0.500 |
| IN2 * | 0.117 | 0.100 |
| IN3 * | 0.010 | 0 |
| BA1 * | 0.117 | 6.900 |
| BA21 | 0.863 | 0.200 |
| DE11, 12 | 1.731 | n.a. |
| DE13, 14 | 1.289 | n.a. |
| DE15 | 0.036 | n.a. |
| GR1 * | 0.305 | 0.100 |
| GR2 * | 1.020 | 0 |
| GR3 * | 0.183 | 0.100 |
| EP1 * | 0.015 | 0.300 |
| EP21 | 0 | 0 |
| EP31 | 0.904 | 0 |
| EP32 | 0.939 | 0.100 |
| EP3 * | 0.020 | 0 |
| NE11 | 0 | 0 |
| NE12 | 0.036 | 0 |
| NE21 | 0 | 0 |
| OT11 | 0.005 | 0 |
| OT12 | 0.010 | 0 |
* indicates that microhabitat types were summarized into categories (e.g. CV1* refers to the group of woodpecker cavities which is encoded with CV11, CV12, CV13, CV14 and CV15).
Figure A1.
Visualization of the best models for predicting the tree-level number of microhabitats (a) and microhabitat diversity (b). The blue line is a linear regression curve with a confidence band showing the impact of dbh on the response variable for each tree species.
Figure A1.
Visualization of the best models for predicting the tree-level number of microhabitats (a) and microhabitat diversity (b). The blue line is a linear regression curve with a confidence band showing the impact of dbh on the response variable for each tree species.
References
- Bengtsson, J.; Nilsson, S.G.; Franc, A.; Menozzi, P. Biodiversity, disturbances, ecosystem function and management of European forests. For. Ecol. Manag. 2000, 132, 39–50. [Google Scholar] [CrossRef]
- Vandekerkhove, K.; De Keersmaeker, L.; Menke, N.; Meyer, P.; Verschelde, P. When nature takes over from man: Dead wood accumulation in previously managed oak and beech woodlands in North-Western and Central Europe. For. Ecol. Manag. 2009, 258, 425–435. [Google Scholar] [CrossRef]
- Scherzinger, W. Naturschutz im Wald: Qualitätsziele einer Dynamischen Waldentwicklung; 36 Tabellen; Ulmer: Stuttgart, Germany, 1996; ISBN 978-3-8001-3356-7. [Google Scholar]
- Paillet, Y.; BergèS, L.; HjäLtéN, J.; óDor, P.; Avon, C.; Bernhardt-RöMermann, M.; Bijlsma, R.-J.; De Bruyn, L.; Fuhr, M.; Grandin, U.; et al. Biodiversity Differences between Managed and Unmanaged Forests: Meta-Analysis of Species Richness in Europe. Conserv. Biol. 2010, 24, 101–112. [Google Scholar] [CrossRef] [PubMed]
- Purahong, W.; Hoppe, B.; Kahl, T.; Schloter, M.; Schulze, E.-D.; Bauhus, J.; Buscot, F.; Krüger, D. Changes within a single land-use category alter microbial diversity and community structure: Molecular evidence from wood-inhabiting fungi in forest ecosystems. J. Environ. Manag. 2014, 139, 109–119. [Google Scholar] [CrossRef] [PubMed]
- Keren, S.; Diaci, J. Comparing the Quantity and Structure of Deadwood in Selection Managed and Old-Growth Forests in South-East Europe. Forests 2018, 9, 76. [Google Scholar] [CrossRef]
- Winter, S.; Brambach, F. Determination of a common forest life cycle assessment method for biodiversity evaluation. For. Ecol. Manag. 2011, 262, 2120–2132. [Google Scholar] [CrossRef]
- Bollmann, K.; Bergamini, A.; Senn-Irlet, B.; Nobis, M.; Duelli, P.; Scheidegger, C. Konzepte, Instrumente und Herausforderungen bei der Förderung der Biodiversität im Wald | Concepts, instruments and challenges for the conservation of biodiversity in the forest. Schweiz. Z. Forstwes. 2009, 160, 53–67. [Google Scholar] [CrossRef]
- Kraus, D.; Krumm, F. Integrative Approaches as an Opportunity for the Conservation of Forest Biodiversity; European Forest Institute: Joensuu, Finland, 2013; ISBN 978-952-5980-07-3. [Google Scholar]
- Bauhus, J.; Puettmann, K.; Messier, C. Silviculture for old-growth attributes. For. Ecol. Manag. 2009, 258, 525–537. [Google Scholar] [CrossRef] [Green Version]
- Ranius, T.; Caruso, A.; Jonsell, M.; Juutinen, A.; Thor, G.; Rudolphi, J. Dead wood creation to compensate for habitat loss from intensive forestry. Biol. Conserv. 2014, 169, 277–284. [Google Scholar] [CrossRef]
- Rosenvald, R.; Lõhmus, A. For what, when, and where is green-tree retention better than clear-cutting? A review of the biodiversity aspects. For. Ecol. Manag. 2008, 255, 1–15. [Google Scholar] [CrossRef]
- Bütler, R.; Lachat, T.; Larrieu, L.; Paillet, Y. Habitat trees: Key elements for forest biodiversity. In Integrative Approaches as an Opportunity for the Conservation of Forest Biodiversity; European Forest Institute: Joensuu, Finland, 2013; p. 284. ISBN 978-952-5980-07-3. [Google Scholar]
- Kraft, G. Beiträge zur Lehre von den Durchforstungen, Schlagstellungen und Lichtungshieben; Klindworth: Hannover, Germany, 1884. [Google Scholar]
- Lonsdale, D. Ancient and Other Veteran Trees: Further Guidance on Management; Tree Council: London, UK, 2013; ISBN 978-0-904853-09-4. [Google Scholar]
- Horák, J. Insect ecology and veteran trees. J. Insect Conserv. 2017, 21, 1–5. [Google Scholar] [CrossRef]
- Winter, S.; Möller, G.C. Microhabitats in lowland beech forests as monitoring tool for nature conservation. For. Ecol. Manag. 2008, 255, 1251–1261. [Google Scholar] [CrossRef]
- Vuidot, A.; Paillet, Y.; Archaux, F.; Gosselin, F. Influence of tree characteristics and forest management on tree microhabitats. Biol. Conserv. 2011, 144, 441–450. [Google Scholar] [CrossRef]
- Larrieu, L.; Cabanettes, A. Species, live status, and diameter are important tree features for diversity and abundance of tree microhabitats in subnatural montane beech–fir forests1This article is one of a selection of papers from the International Symposium on Dynamics and Ecological Services of Deadwood in Forest Ecosystems. Can. J. For. Res. 2012, 42, 1433–1445. [Google Scholar] [CrossRef]
- Regnery, B.; Paillet, Y.; Couvet, D.; Kerbiriou, C. Which factors influence the occurrence and density of tree microhabitats in Mediterranean oak forests? For. Ecol. Manag. 2013, 295, 118–125. [Google Scholar] [CrossRef]
- Ouin, A.; Cabanettes, A.; Andrieu, E.; Deconchat, M.; Roume, A.; Vigan, M.; Larrieu, L. Comparison of tree microhabitat abundance and diversity in the edges and interior of small temperate woodlands. For. Ecol. Manag. 2015, 340, 31–39. [Google Scholar] [CrossRef]
- Ranius, T. Influence of stand size and quality of tree hollows on saproxylic beetles in Sweden. Biol. Conserv. 2002, 103, 85–91. [Google Scholar] [CrossRef]
- Bernicchia, A. Polyporaceae s.l; Fungi Europaei; Edizioni Candusso: Alassio, Italy, 2005; ISBN 978-88-901057-5-3. [Google Scholar]
- Fritz, Ö.; Heilmann-Clausen, J. Rot holes create key microhabitats for epiphytic lichens and bryophytes on beech (Fagus sylvatica). Biol. Conserv. 2010, 143, 1008–1016. [Google Scholar] [CrossRef]
- Regnery, B.; Couvet, D.; Kubarek, L.; Julien, J.-F.; Kerbiriou, C. Tree microhabitats as indicators of bird and bat communities in Mediterranean forests. Ecol. Indic. 2013, 34, 221–230. [Google Scholar] [CrossRef]
- Bouget, C.; Larrieu, L.; Brin, A. Key features for saproxylic beetle diversity derived from rapid habitat assessment in temperate forests. Ecol. Indic. 2014, 36, 656–664. [Google Scholar] [CrossRef]
- Parisi, F.; Lombardi, F.; Sciarretta, A.; Tognetti, R.; Campanaro, A.; Marchetti, M.; Trematerra, P. Spatial patterns of saproxylic beetles in a relic silver fir forest (Central Italy), relationships with forest structure and biodiversity indicators. For. Ecol. Manag. 2016, 381, 217–234. [Google Scholar] [CrossRef]
- Winter, S.; Höfler, J.; Michel, A.K.; Böck, A.; Ankerst, D.P. Association of tree and plot characteristics with microhabitat formation in European beech and Douglas-fir forests. Eur. J. For. Res. 2014, 134, 335–347. [Google Scholar] [CrossRef]
- Johann, F.; Schaich, H. Land ownership affects diversity and abundance of tree microhabitats in deciduous temperate forests. For. Ecol. Manag. 2016, 380, 70–81. [Google Scholar] [CrossRef]
- Paillet, Y.; Archaux, F.; Boulanger, V.; Debaive, N.; Fuhr, M.; Gilg, O.; Gosselin, F.; Guilbert, E. Snags and large trees drive higher tree microhabitat densities in strict forest reserves. For. Ecol. Manag. 2017, 389, 176–186. [Google Scholar] [CrossRef]
- Larrieu, L.; Cabanettes, A.; Brin, A.; Bouget, C.; Deconchat, M. Tree microhabitats at the stand scale in montane beech–fir forests: Practical information for taxa conservation in forestry. Eur. J. For. Res. 2014, 133, 355–367. [Google Scholar] [CrossRef]
- Kiehne, J. Das Marteloskop Rosskopf als Grundlage zur Beurteilung von Betriebswirtschaftlichen und Naturschutzfachlichen Aspekten im Bergmischwald. Master’s Thesis, Albert-Ludwigs-Universität, Freiburg im Breisgau, Germany, 2015. [Google Scholar]
- Larrieu, L.; Cabanettes, A.; Delarue, A. Impact of silviculture on dead wood and on the distribution and frequency of tree microhabitats in montane beech-fir forests of the Pyrenees. Eur. J. For. Res. 2012, 131, 773–786. [Google Scholar] [CrossRef]
- Winter, S. Ermittlung von Struktur-Indikatoren zur Abschätzung des Einflusses Forstlicher Bewirtschaftung auf die Biozönosen von Tiefland-Buchenwäldern. Ph.D. Thesis, Technische Universität Dresden, Dresden, Germany, 2005. [Google Scholar]
- Larrieu, L.; Cabanettes, A.; Gouix, N.; Burnel, L.; Bouget, C.; Deconchat, M. Development over time of the tree-related microhabitat profile: The case of lowland beech–oak coppice-with-standards set-aside stands in France. Eur. J. For. Res. 2016. [Google Scholar] [CrossRef]
- Schürg, R. Das Marteloskop Mooswald als Grundlage zur Beurteilung von Betriebswirtschaftlichen und Naturschutzfachlichen Aspekten in Ehemaligen Eichen-Mittelwäldern. Master’s Thesis, Albert-Ludwigs-Universität, Freiburg im Breisgau, Germany, 2015. [Google Scholar]
- Michel, A.K.; Winter, S.; Linde, A. The effect of tree dimension on the diversity of bark microhabitat structures and bark use in Douglas-fir (Pseudotsuga menziesii var. menziesii). Can. J. For. Res. 2011, 41, 300–308. [Google Scholar] [CrossRef]
- Köppler, D. Landschaften und Vegetation des Oberen Hotzenwalds. Mittelungen Badischen Landesver. Für Naturkunde Naturschutz EV 2002, 18, 45–65. [Google Scholar]
- Schuhwerk, F. Naturnahe Vegetation im Hotzenwald (Südöstlicher Schwarzwald). Ph.D. Thesis, University Regensburg, Regensburg, Germany, 1988. [Google Scholar]
- Schreiner, A.; Gschopf, R. Zur Geologie und Morphologie des Hotzenwaldes. Mittelungen Badischen Landesver. Für Naturkunde Naturschutz EV 2002, 18, 29–44. [Google Scholar]
- VFS—Verein für Forstliche Standortskunde und Forstpflanzenzüchtung—Regionale Gliederung. Available online: http://www.vfs-freiburg.de/html/seiten/text.phtml?nav=121&lang=de (accessed on 18 January 2018).
- Jürgen Bauhus, P.P. Managed Forests. In Routledge Handbook of Forest Ecology; Routledge: Abingdon, UK, 2015. [Google Scholar]
- Körner, H.; Reichelt, G. Der Hotzenwald: Beiträge zur Natur und Kultur einer Landschaft im Südschwarzwald; Mitteilungen des Badischen Landesvereins für Naturkunde und Naturschutz; Lavori: Freiburg im Breisgau, Germany, 2003; ISBN 978-3-935737-44-9. [Google Scholar]
- Tribukait, F.; Matt-Willmatt, H.; Baumhof-Pregitzer, M.; Suchant, R.; von Sengbusch, P. Full of LIFE—Results from the Oberer Hotzenwald LIFE Nature Project; State Administration for Nature Conservation Baden-Württemberg: Freiburg, Germany, 2011.
- Tribukait, F. EU-LIFE-Projekt Oberer Hotzenwald; State Administration for Nature Conservation Baden-Württemberg: Freiburg, Germany, 2011; p. 74.
- Kraus, D.; Bütler, R.; Krumm, F.; Lachat, T.; Larrieu, L.; Mergner, U.; Paillet, Y.; Rydkvist, T.; Schuck, A.; Winter, S. Catalogue of Tree Microhabitats—Reference Field List; European Forest Institute—Regional Office EFICENT: Freiburg, Germany, 2016. [Google Scholar]
- Paillet, Y.; Coutadeur, P.; Vuidot, A.; Archaux, F.; Gosselin, F. Strong observer effect on tree microhabitats inventories: A case study in a French lowland forest. Ecol. Indic. 2015, 49, 14–23. [Google Scholar] [CrossRef]
- Shannon, C.E. A Mathematical Theory of Communication. Bell Syst. Tech. J. 1948, 27, 623–656. [Google Scholar] [CrossRef]
- Spellerberg, I.F.; Fedor, P.J. A tribute to Claude Shannon (1916–2001) and a plea for more rigorous use of species richness, species diversity and the ‘Shannon-Wiener’ Index: On species richness and diversity. Glob. Ecol. Biogeogr. 2003, 12, 177–179. [Google Scholar] [CrossRef]
- R Core Team. R: A Language and Environment for Statistical Computing; R Foundation for Statistical Computing: Vienna, Austria, 2016. [Google Scholar]
- Bolker, B.M.; Brooks, M.E.; Clark, C.J.; Geange, S.W.; Poulsen, J.R.; Stevens, M.H.H.; White, J.-S.S. Generalized linear mixed models: A practical guide for ecology and evolution. Trends Ecol. Evol. 2009, 24, 127–135. [Google Scholar] [CrossRef] [PubMed]
- Bates, D.; Mächler, M.; Bolker, B.; Walker, S. Fitting Linear Mixed-Effects Models Using lme4. J. Stat. Softw. 2015, 67, 1–48. [Google Scholar] [CrossRef]
- Bjornstad, O.N. ncf: Spatial Nonparametric Covariance Functions, R Package Version 1.1-7; Available online: https://CRAN.R-project.org/package=ncf (accessed on 12 October 2017).
- Hothorn, T.; Bretz, F.; Westfall, P. Simultaneous Inference in General Parametric Models. Biom. J. 2008, 50, 346–363. [Google Scholar] [CrossRef] [PubMed]
- Breheny, P.; Burchett, W. visreg: Visualization of Regression Models. 2016. Available online: https://cran.r-project.org/web/packages/visreg/visreg.pdf (accessed on 12 April 2017).
- Bayrische Staatsforsten. AöR Naturschutzkonzept der Bayrischen Staatsforsten; Bayrische Staatsforsten: Regensburg, Germany, 2009. [Google Scholar]
- Landesbetrieb Forst Baden-Württemberg. Alt- und Totholzkonzept Baden-Württemberg. 2010. Available online: http://www.naturschutz.landbw.de/servlet/is/67652/Alt-_und_Totholzkonzept.pdf?command=downloadContent&filename=Alt-_und_Totholzkonzept.pdf (accessed on 12 October 2017).
- Lutz, J.A.; Larson, A.J.; Freund, J.A.; Swanson, M.E.; Bible, K.J. The Importance of Large-Diameter Trees to Forest Structural Heterogeneity. PLoS ONE 2013, 8, e82784. [Google Scholar] [CrossRef] [PubMed]
- Lindenmayer, D.B.; Laurance, W.F. The ecology, distribution, conservation and management of large old trees: Ecology and management of large old trees. Biol. Rev. 2017, 92, 1434–1458. [Google Scholar] [CrossRef] [PubMed]
- Ministerium für Ernährung, Landwirtschaft, Forsten und Fischerei. Richtlinie zur Sicherung von Alt- und Totholzanteilen im Wirtschaftswald mit Erläuternder Einführung; Ministerium für Ernährung, Landwirtschaft, Forsten und Fischerei: Schwerin, Germany, 2002.
- Schmidt, O.; Czeschlik, D. Wood and Tree Fungi: Biology, Damage, Protection, and Use; Springer: Berlin, Germany, 2006; ISBN 978-3-540-32138-5. [Google Scholar]
- Lindenmayer, D.; Franklin, J.F. Conserving forest Biodiversity: A Comprehensive Multiscaled Approach; Island Press: Washington, DC, USA, 2002; ISBN 978-1-55963-934-7. [Google Scholar]
- Ranius, T.; Niklasson, M.; Berg, N. Development of tree hollows in pedunculate oak (Quercus robur). For. Ecol. Manag. 2009, 257, 303–310. [Google Scholar] [CrossRef]
Figure 1.
Mean frequency of occurring microhabitat categories on habitat trees (dark gray) and crop trees (light gray). Microhabitat categories: CV = cavities; IN = injuries and wounds; BA = bark pockets; DE = crown deadwood; GR = peculiarly growth form; EP = epiphytes; NE = nests; OT = others (e.g., resin flow).

Figure 2.
Number and diversity of microhabitats in habitat trees of the most frequent tree species Abies alba and Fagus sylvatica in relation to dbh classes. Different letters indicate significant differences between dbh classes. To facilitate the consideration of our findings in practical forestry, we used 20-cm-diameter classes instead of continuous dbh values.
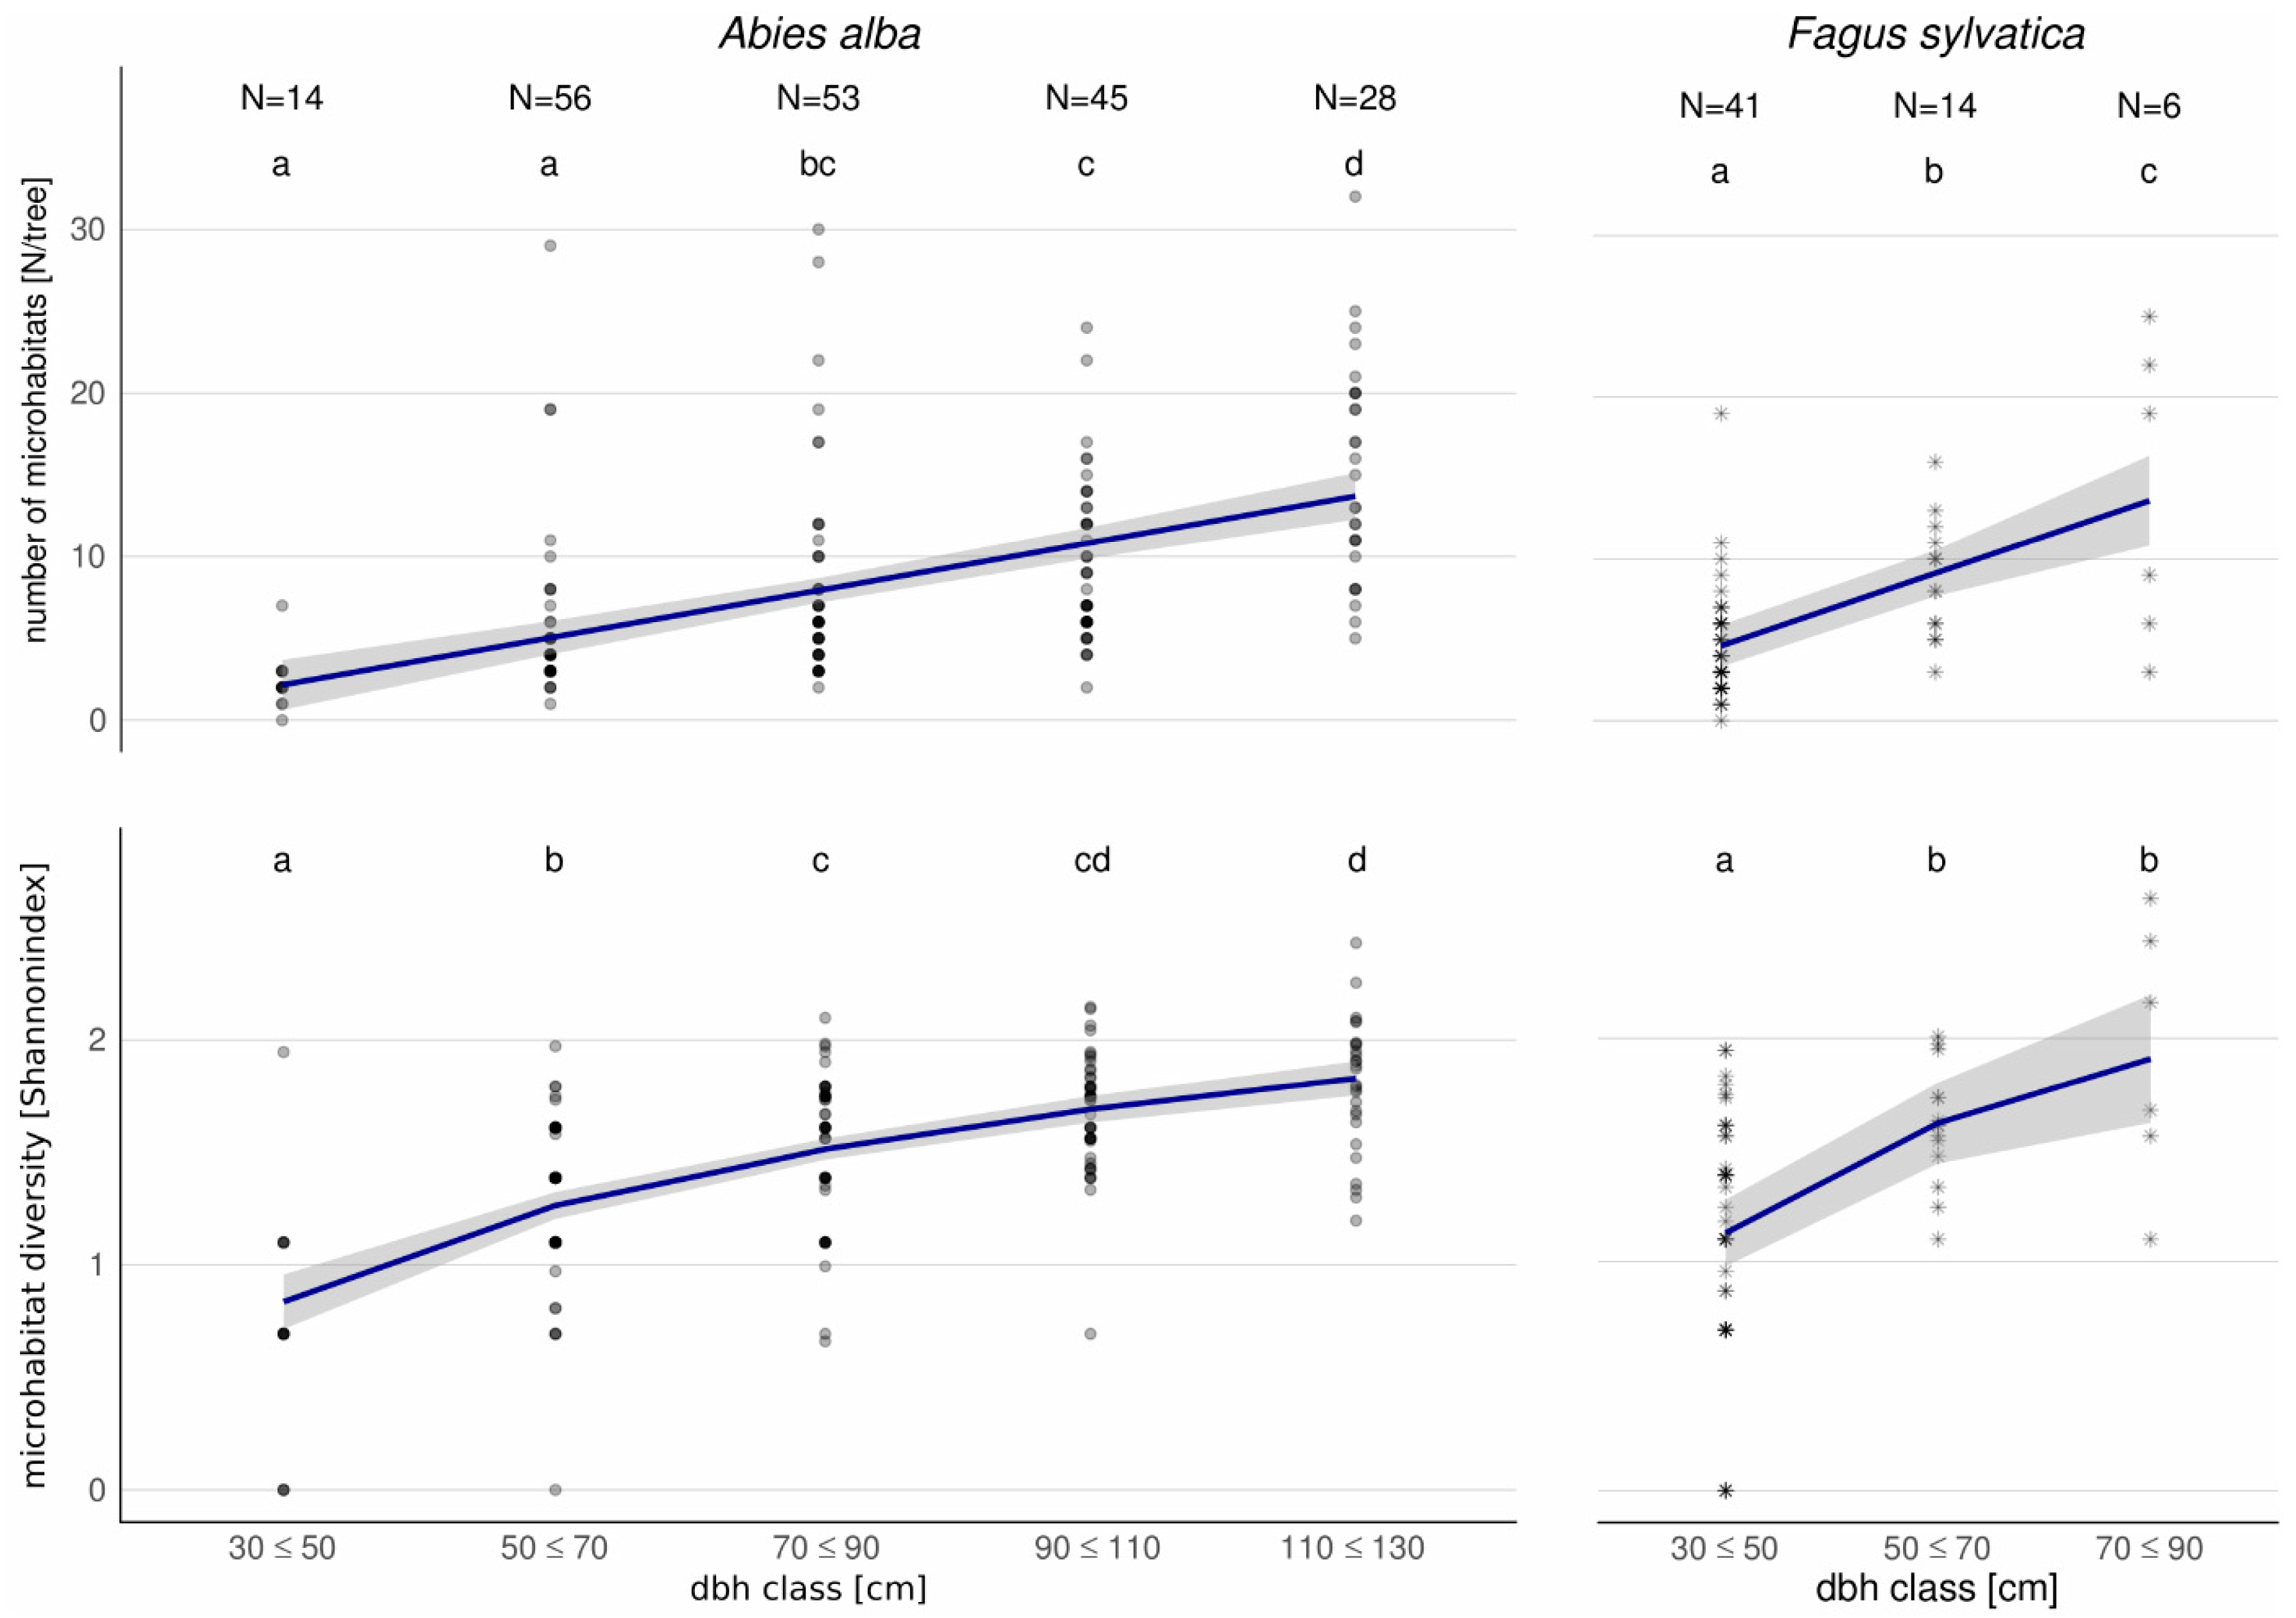
Figure 3.
Relationship between tree canopy class and microhabitat frequency (a) and diversity (b) in habitat trees of the tree species Abies alba (A. a.), Acer pseudoplatanus (A. p.), and Fagus sylvatica (F. s.). Different letters indicate significant differences between canopy classes of each tree species. The black bar indicates the median, the box shows the interquartile range, and the whiskers the 1.5-interquartile range.
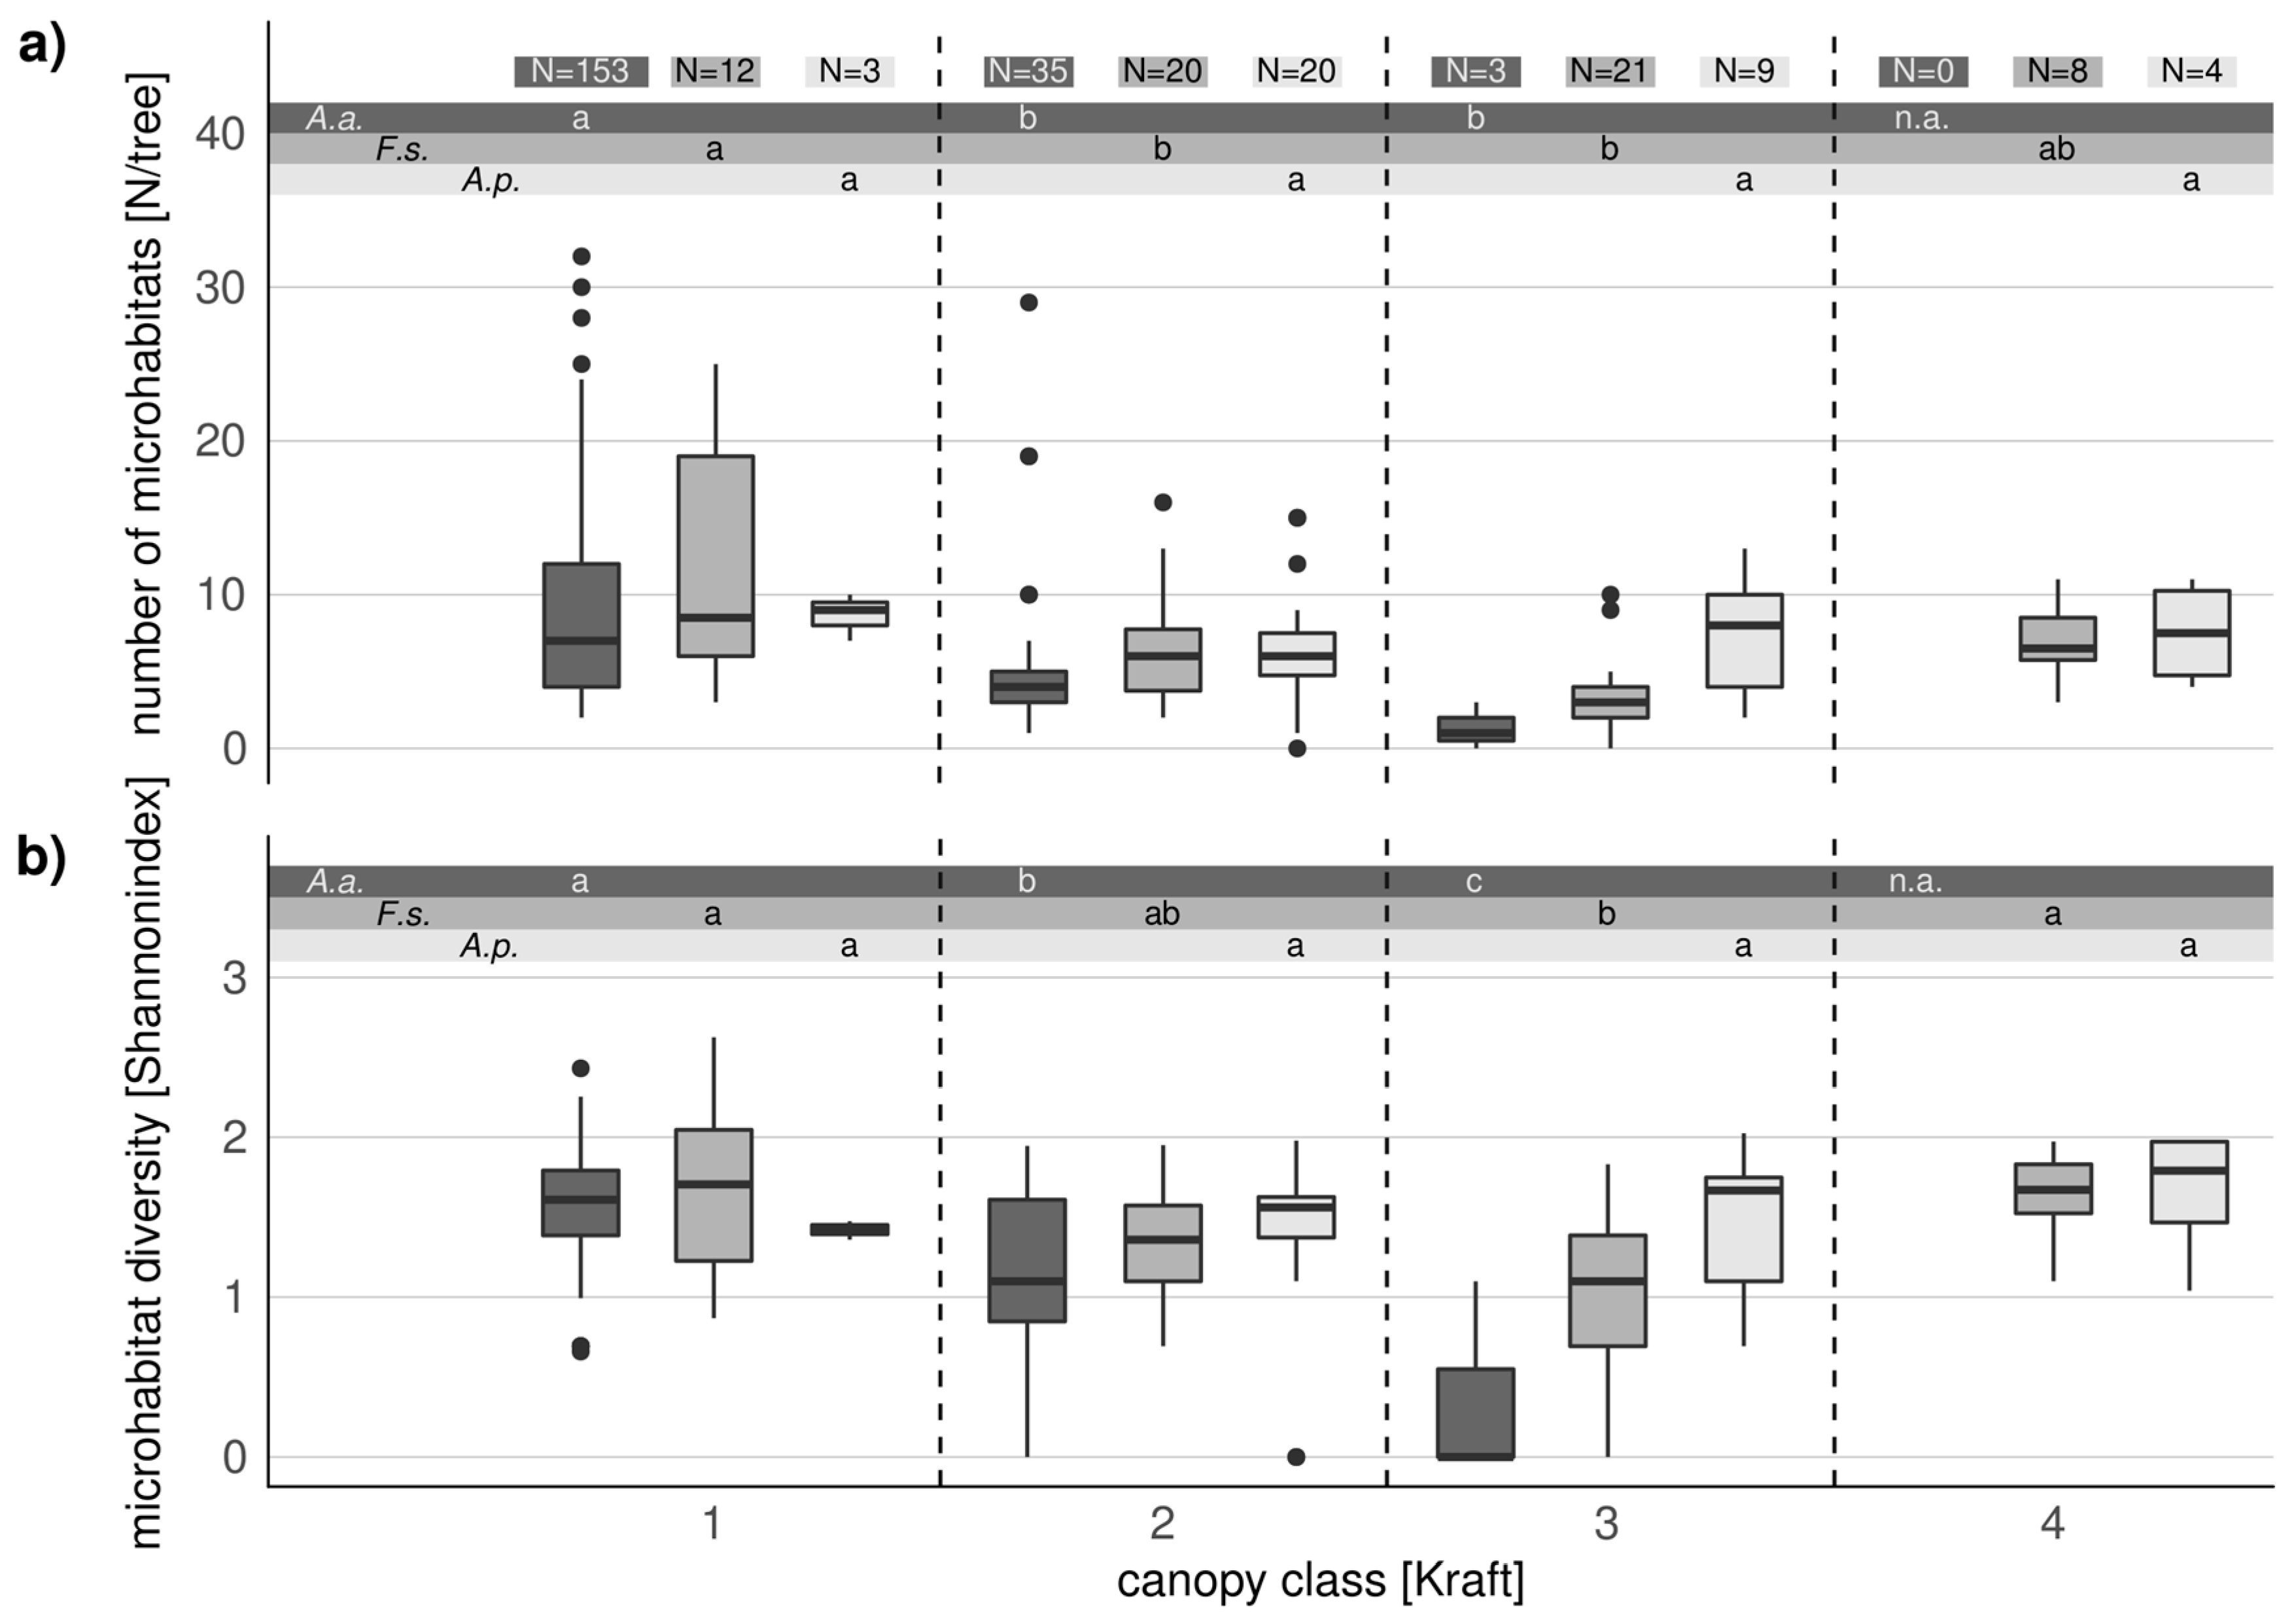
Figure 4.
Number and diversity of microhabitats of habitat trees (dark gray) in comparison to crop trees (light gray) in relation to dbh classes for Abies alba and Fagus sylvatica. Significance levels within the same dbh class are indicated by: *** = p-value < 0.001, * = p-value < 0.05, n.s. = p-value > 0.05. The black bar indicates the median, the box shows the interquartile range, and the whiskers the 1.5-interquartile range.

Table 1.
Researched factors affecting the occurrence of microhabitats. For continuous variables: + = positive impact, 0 = no impact, – = negative impact. For categorical variables: y = significant differences between categories.
Table 1.
Researched factors affecting the occurrence of microhabitats. For continuous variables: + = positive impact, 0 = no impact, – = negative impact. For categorical variables: y = significant differences between categories.
| Forest Type 1 | Factors Influencing Amount of Microhabitats | Source | |||||||||||||
|---|---|---|---|---|---|---|---|---|---|---|---|---|---|---|---|
| Forest Management | Tree Age | dbh | Increasing Vitality 2 | Stem Density | Branchiness | Epicormic Branches | Height to Green Crown Basis | Elevation | Exposure | Basal Area | Site | Tree Species | Land Ownership | ||
| lowland and mountain | 0 | + | – | y | y | [18] | |||||||||
| mountain | + | – | y | [32] | |||||||||||
| lowland and mountain mixed forests | – | + | – | [30] | |||||||||||
| temperate | 0 | + | + | y | [21] | ||||||||||
| deciduous temperate | + | – | 0 | 0 | + | y | [29] | ||||||||
| beech-fir | + | – | y | [19] | |||||||||||
| beech-fir | 0 | + | y | [33] | |||||||||||
| beech-fir (montane) | – | + | y | [31] | |||||||||||
| beech | – | + | – | + | [28] | ||||||||||
| lowland-beech | – | + | [34] | ||||||||||||
| lowland beech | – | + | [17] | ||||||||||||
| lowland-beech oak coppice with standards | – | y | [35] | ||||||||||||
| oak | + | – | y | [36] | |||||||||||
| mediterranean-oak | – | + | – | – | y | [25] | |||||||||
| Douglas fir | – | + | 0 | – | – | [28] | |||||||||
| Douglas fir | + | [37] | |||||||||||||
1 Forest type according to the authors of the publication; 2 increasing vitality, from snags to vital trees.
Table 2.
Fixed and random effects (RE) and AIC result of LMERs (a) and GLMERs (b) for microhabitat diversity per habitat tree (x = included effect; bold = model with the lowest AIC).
Table 2.
Fixed and random effects (RE) and AIC result of LMERs (a) and GLMERs (b) for microhabitat diversity per habitat tree (x = included effect; bold = model with the lowest AIC).
| dbh | Canopy Class | Tree Species | Tree Species:dbh | Tree Species:canopy Class | Soil Type (RE) | AIC | |
|---|---|---|---|---|---|---|---|
| (a) | x | x | x | 289.2 | |||
| x | x | x | x | 295.6 | |||
| x | x | 305.5 | |||||
| x | x | 341.1 | |||||
| x | x | x | x | 342.5 | |||
| x | x | x | 342.8 | ||||
| x | x | 379.3 | |||||
| (b) | x | x | x | 1711.2 | |||
| x | x | x | x | 1714.6 | |||
| x | x | 1744.9 | |||||
| x | x | x | 1851.0 | ||||
| x | x | x | 1863.2 | ||||
| x | x | x | 1865.5 | ||||
| x | x | 1941.9 |
Table 3.
Number and diversity of microhabitats in habitat and crop trees.
| Species | N | Number of Microhabitats [N/Tree] | Microhabitat Diversity [Shannonindex H’] | ||||
|---|---|---|---|---|---|---|---|
| Total | Mean | Max. | Mean | Max. | |||
| habitat trees | Abies alba | 197 | 1674 | 8.5 | 32 | 1.48 | 2.43 |
| Abies alba (dead) | 10 | 97 | 9.7 | 41 | 0.64 | 1.53 | |
| Acer pseudoplatanus | 37 | 254 | 7.0 | 15 | 1.45 | 2.03 | |
| Fagus sylvatica | 65 | 427 | 6.6 | 25 | 1.32 | 2.63 | |
| total (living) | 299 | 2355 | 7.9 | 32 | 1.44 | 2.63 | |
| crop trees | Abies alba | 208 | 675 | 3.3 | 12 | 0.93 | 2.08 |
| Acer pseudoplatanus | 1 | 2 | - | 2 | - | 0.69 | |
| Fagus sylvatica | 19 | 77 | 4.1 | 11 | 1.06 | 1.79 | |
| total | 228 | 754 | 3.3 | 12 | 0.94 | 2.08 | |
© 2018 by the authors. Licensee MDPI, Basel, Switzerland. This article is an open access article distributed under the terms and conditions of the Creative Commons Attribution (CC BY) license (http://creativecommons.org/licenses/by/4.0/).
Share and Cite
MDPI and ACS Style
Großmann, J.; Schultze, J.; Bauhus, J.; Pyttel, P. Predictors of Microhabitat Frequency and Diversity in Mixed Mountain Forests in South-Western Germany. Forests 2018, 9, 104. https://doi.org/10.3390/f9030104
AMA Style
Großmann J, Schultze J, Bauhus J, Pyttel P. Predictors of Microhabitat Frequency and Diversity in Mixed Mountain Forests in South-Western Germany. Forests. 2018; 9(3):104. https://doi.org/10.3390/f9030104
Chicago/Turabian StyleGroßmann, Josef, Juliane Schultze, Jürgen Bauhus, and Patrick Pyttel. 2018. "Predictors of Microhabitat Frequency and Diversity in Mixed Mountain Forests in South-Western Germany" Forests 9, no. 3: 104. https://doi.org/10.3390/f9030104
Note that from the first issue of 2016, this journal uses article numbers instead of page numbers. See further details here.