Hyperspectral Analysis of Pine Wilt Disease to Determine an Optimal Detection Index
by
 ,
,
So-Ra Kim
1, 
Woo-Kyun Lee
2,*,
Chul-Hee Lim
2,3 ,
,
Moonil Kim
2,4,
Menas C. Kafatos
5,
Seung-Ho Lee
6 and
Sung-Soon Lee
7 1
Korea Forest Conservation Association, Dajeon 35262, Korea
2
Department of Environmental Science and Ecological Engineering, Korea University, Seoul 02481, Korea
3
Institute of Life Science and Natural Resources, Korea University, Seoul 02481, Korea
4
Ecosystem Services and Management Program, International Institute for Applied Systems Analysis (IIASA), Schlossplatz 1, A-2361 Laxenburg, Austria
5
Center of Excellence in Earth Systems Modeling and Observations, Chapman University, Orange, CA 92866, USA
6
Neighbor System, Seoul 07532, Korea
7
Korea Institute of Geoscience and Mineral Resources, Daejeon 34132, Korea
*
Author to whom correspondence should be addressed.
Forests 2018, 9(3), 115; https://doi.org/10.3390/f9030115
Submission received: 30 January 2018
/
Revised: 26 February 2018
/
Accepted: 27 February 2018
/
Published: 3 March 2018
(This article belongs to the Special Issue New Application based on Advanced Remote Sensing Data in Forests and Wood Land Areas)
Abstract
:Bursaphelenchus xylophilus, the pine wood nematode (PWN) which causes pine wilt disease, is currently a serious problem in East Asia, including in Japan, Korea, and China. This paper investigates the hyperspectral analysis of pine wilt disease to determine the optimal detection indices for measuring changes in the spectral reflectance characteristics and leaf reflectance in the Pinus thunbergii (black pine) forest on Geoje Island, South Korea. In the present study, we collected the leaf reflectance spectra of pine trees infected with pine wilt disease using a hyperspectrometer. We used 10 existing vegetation indices (based on hyperspectral data) and introduced the green-red spectral area index (GRSAI). We made comparisons between non-infected and infected trees over time. A t-test was then performed to find the most appropriate index for detecting pine wilt disease-infected pine trees. Our main result is that, in most of the infected trees, the reflectance changed in the red and mid-infrared wavelengths within two months after pine wilt infection. The vegetation atmospherically resistant index (VARI), vegetation index green (VIgreen), normalized wilt index (NWI), and GRSAI indices detected pine wilt disease infection faster than the other indices used. Importantly, the GRSAI results showed less variability than the results of the other indices. This optimal index for detecting pine wilt disease is generated by combining red and green wavelength bands. These results are expected to be useful in the early detection of pine wilt disease-infected trees.
1. Introduction
Pine wilt disease, caused by Bursaphelenchus xylophilus, the pine wood nematode (PWN), is one of the most damaging emerging pest problems in forests around the world [1,2,3,4,5]. Since PWN is highly pathogenic, 80% of infested red pine trees die in the first year and the remaining 20% die in the second year; red pine mortality thus quickly reaches 100%. For white pine, the mortality rate is somewhat lower [6,7]. Infected trees are difficult to detect and treat since most of them die three months after infection [8,9]. Fumigation, burning, and felling after cutting are the only options currently available for controlling the spread of pine wilt disease [7,10]; thus, early detection of infected trees is of paramount concern [11]. Controlling the spread of the disease involves early detection of infected trees based on frequent monitoring, exterminating PWN before its emergence to keep the disease contained, and taking preventative measures such as prohibiting the removal of wood from affected areas. However, finding infected trees through a field study is not easy, since the areas thought to be damaged are quite large and the topographical characteristics of forests makes direct access to all necessary areas difficult [9,11].
To overcome such practical problems, the measurement and monitoring of the areas affected by pine wilt disease is carried out using remote sensing. The leaves of pine trees infected with PWN undergo discoloration during the process of withering [6,9,10,12]. Jo et al. [13] and Kim et al. [6] estimated the pine wilt-affected areas using Landsat TM images and the Geographic Information System (GIS). In South Korea, research using high-resolution satellite imagery and spatial statistics has been performed to predict the path of infection [8,12]. However, pine wilt disease can be spread not only by its primary vector, the beetle Monochamus alternatus, but also by anthropogenic factors such as transporting cut pine trees and even mountain climbing [14], which makes it difficult to predict the spread of infection into new areas.
As a way to solve this problem, research on early detection methods was performed through monthly monitoring using vegetation indices (VIs). VIs are derived from radiometric data and are primarily used to indicate the amount of green vegetation present in an image or scene [15]. Many VIs have been developed over the past three decades to provide more sensitive measurements of plant biophysical parameters and to reduce external noise interference such as that related to the soil and atmosphere. PWN-infected trees show a decrease in the normalized difference vegetation index (NDVI) that is accompanied by changes in spectral reflectance [11,16]. Thus, the presence of pest-infected trees can be discovered using VIs calculated with data from satellite images and aerial photographs [9]. Kim et al. [10] developed the Detection Index (DI) using the NDVI measured with a portable near-infrared camera to detect PWN-infected trees in early disease stages.
PWN kills pine trees by disrupting the movement of water [17]. With increasing parasite density, the water content of current-year branches and leaves decreases, causing a decrease in photosynthesis [18,19]. Accordingly, previous studies used multispectral images to estimate photosynthesis levels. However, since there are only three bands in the visible spectrum, using only visible light limits studies to the blue and red wavelengths involved in photosynthesis. Predictions using such a narrow wavelength range also contain measurement errors. Technological advancements and the advent of hyperspectral sensors with high spectral resolutions have raised new possibilities for spectral discrimination of leaf conditions. One result is that some VIs have been developed based on hyperspectral data, enabling researchers to discriminate between healthy and diseased leaf conditions based on green leaf reflectance [20,21]. Structural properties include fractional cover, green leaf biomass, leaf area index (LAI), sensed biomass, and Fraction of Absorbed Photosynthetically Active Radiation (FPAR) [22,23,24]. Biochemical properties include the relative concentrations of water, pigments (chlorophyll, carotenoids and anthocyanins), other nitrogen-rich compounds, and plant structural materials (lignin and cellulose) [25,26,27,28,29,30].
As previously stated, although many studies on leaf physiology have been conducted, a vegetation index best suited to the early detection of trees damaged by pests such as PWN has not been identified. The main purpose of this paper is to investigate the hyperspectral analysis of pine wilt disease-infected trees to determine the optimal detection indices via changes in spectral reflectance characteristics and leaf reflectance.
2. Data and Methods
2.1. Study Area
Study sites were located on Geoje Island, Gyeongsamgnam Province, South Korea (34°54′32.06″ N by 128°38′43.57″ E). Except for some areas of granite, Goeje Island is mostly composed of geological features from the Sinlan Series. It has a temperate oceanic climate and a moderate temperature difference between winter and summer, with an annual temperature range of 23.0 °C. The average yearly temperature is 14.2 °C, and the mean annual precipitation (1981–2000) is 2007.3 mm. During spring (March to May), fog often causes reduced visibility, while during summer (June to August), localized heavy rainfalls occur frequently. In autumn (September to November), clear days are maintained by the effects of a migratory anticyclone. The first frost of the season occurs at the beginning of November, and the winter (December to February) is warm compared to that in other areas on the Korean peninsula (Korea Meteorological Administration).
2.2. Target Tress and PWN Injection
We selected 10 trees (Pinus thunbergii) and divided them into two groups. The first group consisted of seven trees injected with PWN; the other group was made up of three non-injected trees. The injected trees were labeled T1–T5 (Tree 1–Tree 5), T9 and T10. The non-injected trees were labeled T6–T8 (Figure 1).
PWN was obtained from the Southern Forest Resources Research Center; it had been gathered from infected pine trees in Jinju City, Gyeongsangnam Province. It was fragmented and separated using the Baermann funnel method [31]. Botrytis cinerea Pers bacteria incubated in potato dextrose agar (PDA) were smeared with 100 µL of pine wilt suspension and were then allowed to proliferate for 10 days at 24 ± 2 °C.
PWN was injected into the stems and branches of trees T1–T5, T9 and T10. To inject PWN (step 1), a 1.0 × 0.5 cm scar was made with a drill, (step 2) pasteurized cotton was applied to the site, (step 3) 10,000/50 µL of PWN suspension was injected using a micropipette, and (step 4), to prevent secondary infection and water loss, stems were wrapped with aluminum foil.
The beetle Monochamus alternatus, a primary vector of PWN in South Korea, starts to emerge around the middle of May every year. The population peaks in the middle of June, and it subsides by early or late July depending on the year [12]. Therefore, in this study, PWN was injected twice, on June 15 and again on July 26.
2.3. Measurement of Leaf Reflectance
A GER-3700 (Geophysical and Environmental Research Corporation, Buffalo, New York, NY, USA) spectrometer was used to measure the reflectance spectra of the target trees. The wavelengths sampled ranged from 325 nm to 2500 nm, with sampling intervals of 1.5 nm between 325 nm and 1050 nm, 6.2 nm between 1050 nm and 1900 nm, and 9.5 nm from 1900 nm to 2500 nm.
Leaf reflectance measurements were taken five times at high and middle points on each tree to minimize measurement error; measuring the lower layer could have resulted in greater errors associated with the sun incidence angle. Recordings were always taken between 12 p.m. and 3 p.m., in a sequential order (from T1 to T10). We measured spectral reflectance regularly until the injected trees withered (mid-June to early October).
We used the spectral reflectance of a 99% white panel (Spectralon) as a reference for total reflectance. Spectral information was acquired by measuring the target trees in numerical order. We always collected one reference scan of the Spectralon for every target scan, and the reference and target scans were taken as close together in time as possible in order to minimize the effects of atmospheric changes on spectral measurements. Data taken outdoors in natural light using the GER-3700 spectrometer are strongly influenced by weather conditions. In particular, the mid-infrared wavelength region generates much noise when data are taken in humid, cloudy, or windy conditions because of high atmospheric moisture [32]. Therefore, in this study, after removing the noise, reflectance was interpolated using the cubic spline interpolation method.
2.4. Vegetation Indices Calculation
This study attempted to find a way to detect infected trees early by using vegetation indices (VIs). We used 10 existing VIs (Table 1) and a new index (Green-Red Spectral Area Index; GRSAI) that we developed. The 10 existing VIs included those typically used for assessment of vegetation vitality along with the normalized wilt index (NWI) that has been used to detect disease in other tree species. We recorded differences in infected and non-infected trees over time.
Existing indices are calculated using a particular spectral reflectance point. However, certain point values may be undervalued or overvalued according to the environment measured, leading to errors in the calculated indices. To address such problems, unlike other studies, which used spectral reflectance values obtained from a single site [9,10,33,34,35,36,37,38], in this study, the concept of area [39] was applied to suggest a new index to detect pine wilt disease.
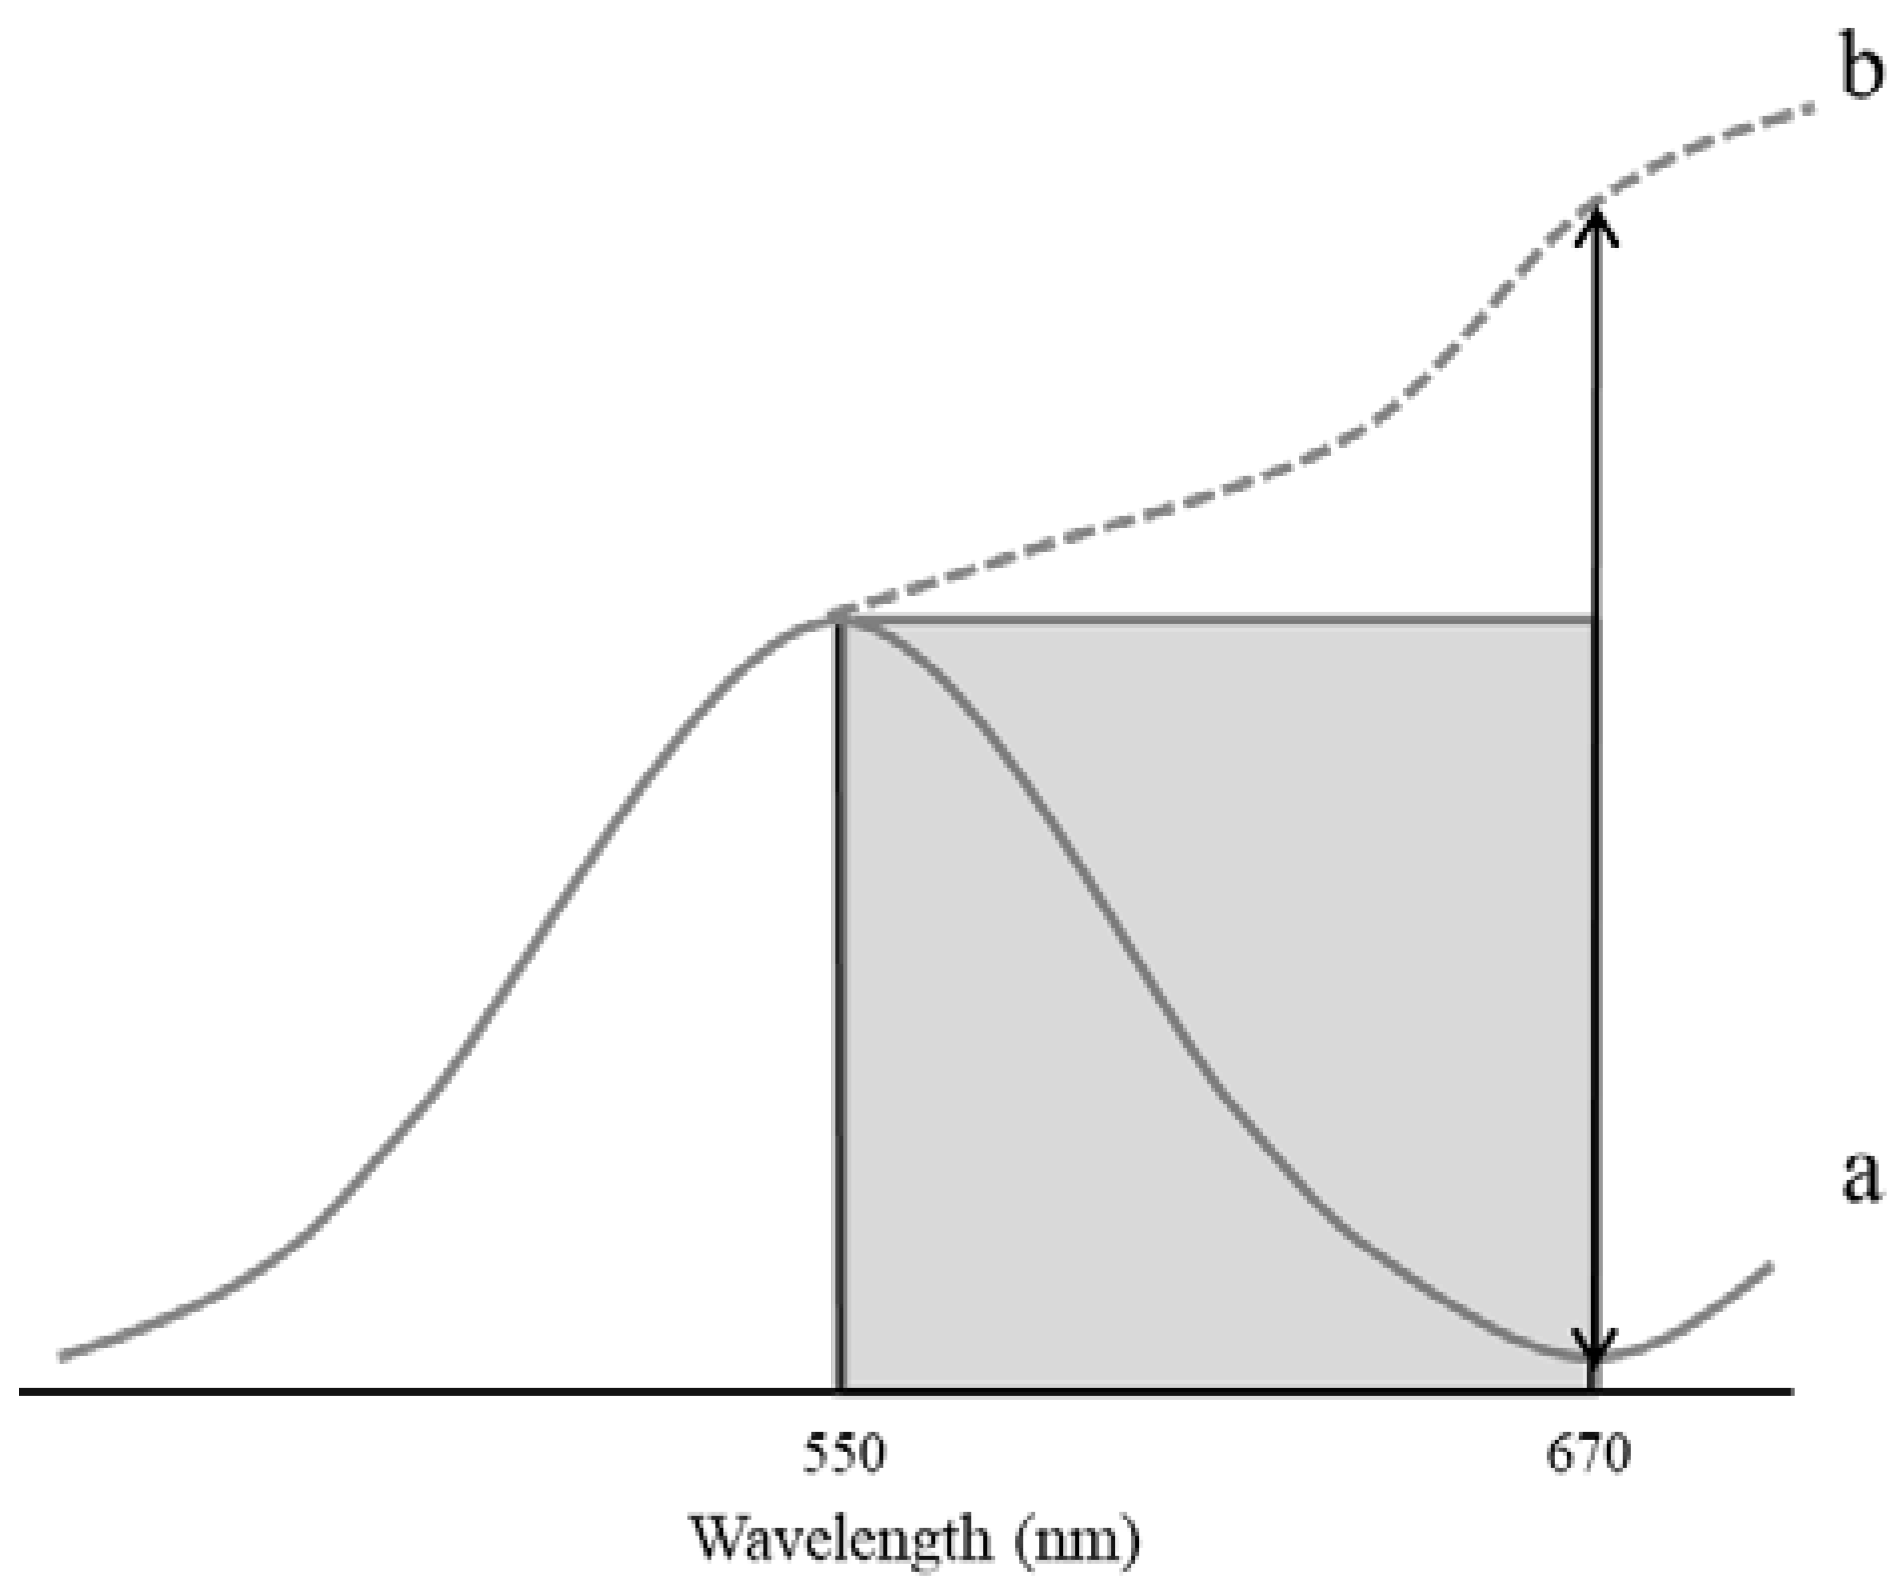
Since the difference between the inflection point of green light and the inflection point of red light varies depending on the degree of infection, we used the ratio of the two to determine the reflectance characteristics of pine wilt disease-infected and non-infected trees. In Figure 2, line (a) shows the spectral reflectance pattern of a healthy tree and line (b) shows the spectral reflectance pattern of a dead tree. As the tree withers, the reflectance tends to change from (a) to (b). If a reflectance value between 550 nm and 670 nm is assumed to be equal, the ratio of the area is 1. Values close to 0 imply healthy vegetation, whereas values close to or larger than 1 imply a withering of vegetation.
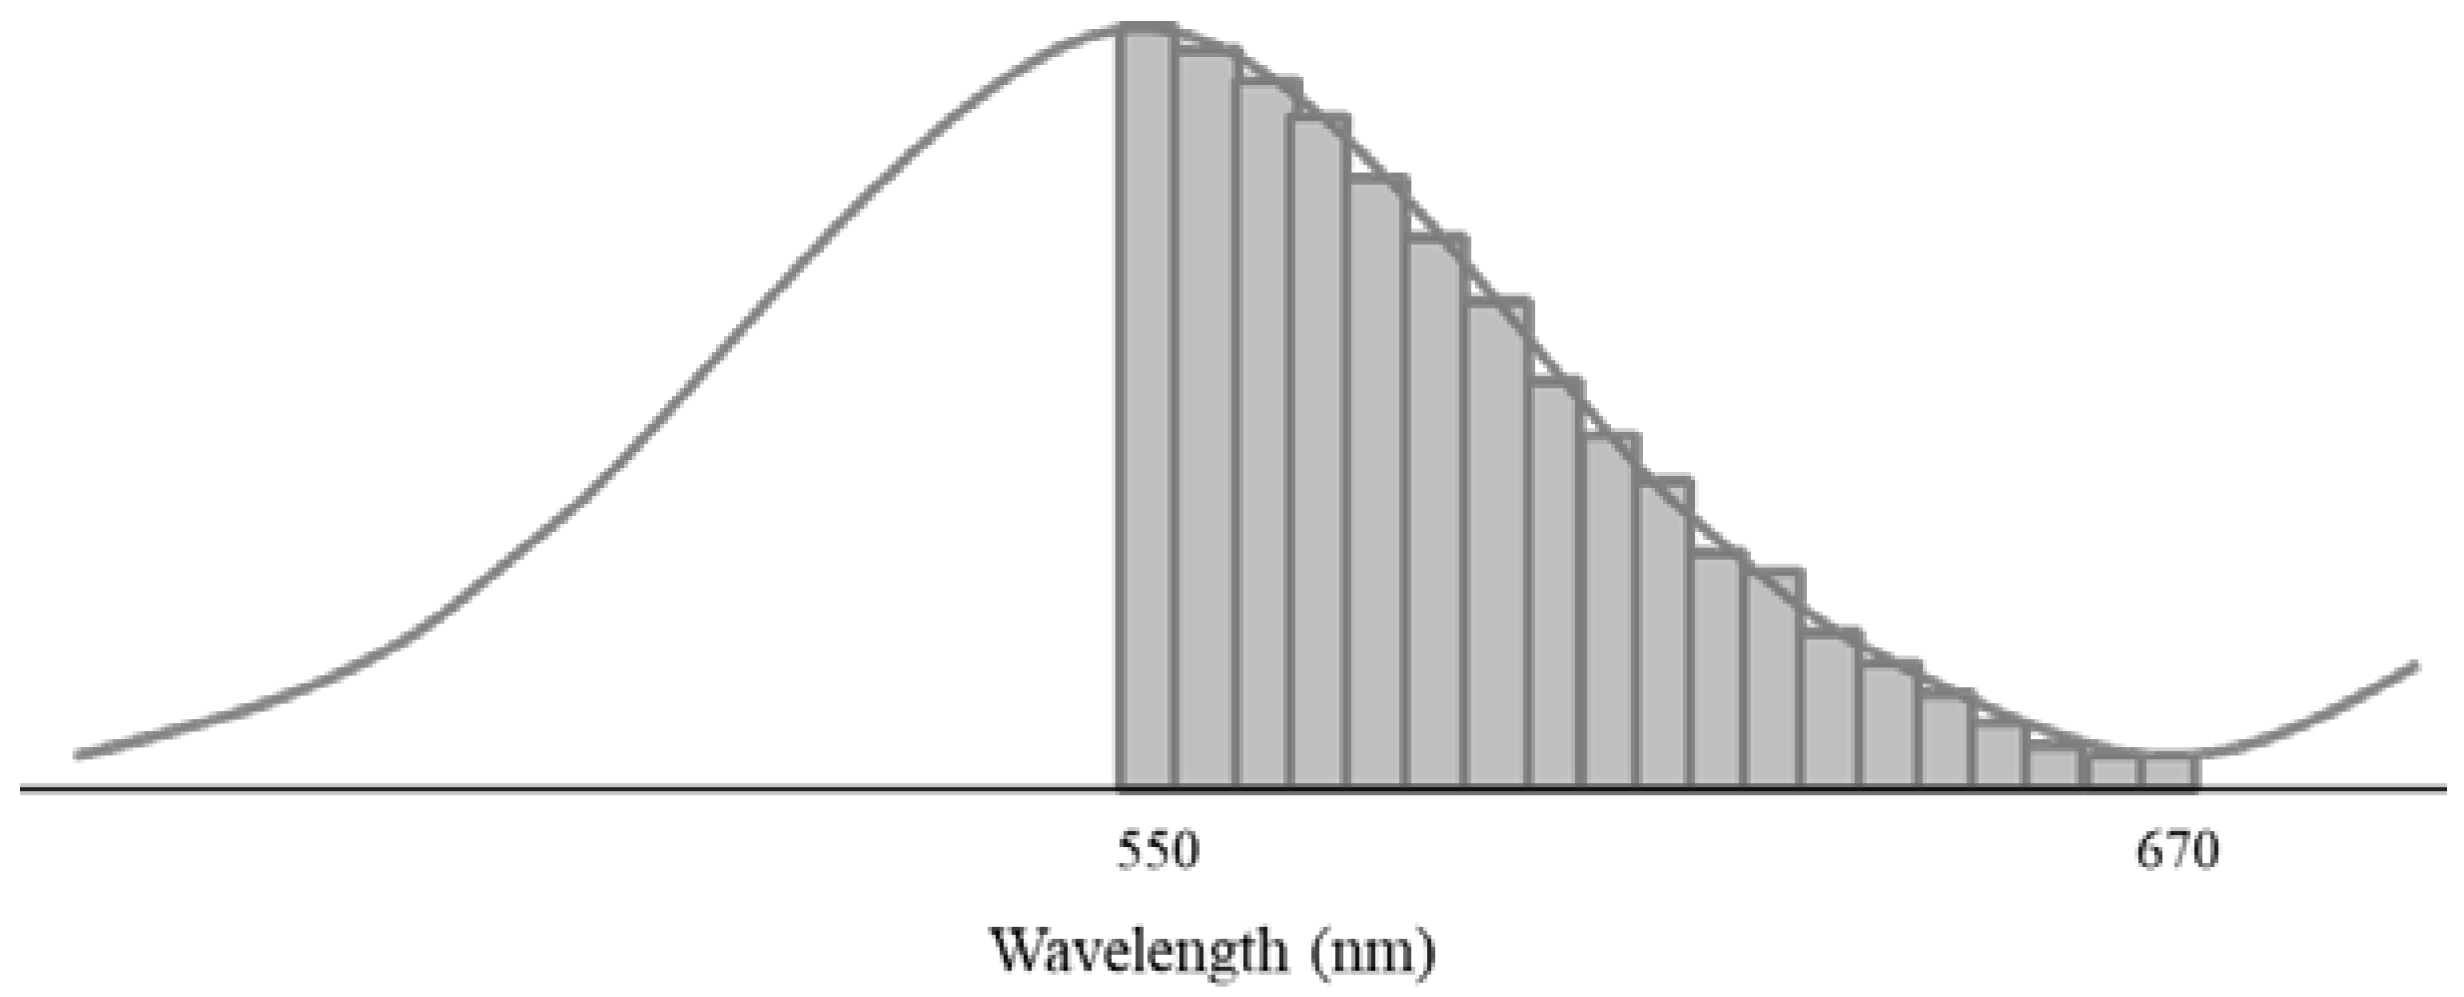
The Green-Red Spectral Area Index (GRSAI) is based on an area of reflectance from 550 nm to 670 nm. The inflection point of red and green may vary by species, but for Pinus thunbergii, 550 nm is the point of maximal inflection of green light, and 670 nm is the point of maximal inflection of red light. A more stable value than that obtained using other methods can be obtained using the area for calculation. The formula for GRSAI is as follows (Equations (1) and (2) and Figure 3):
where f(xk) is the reflectance value when x = xk and ((xk+1 − xk−1)/2)× f(xk) is the area when x = xk. Note that xk+1 − xk and xk − xk−1 cannot be the same. A constant 120 value belongs in between 550 nm and 670 nm.
2.5. Statistical Analysis
We were interested in finding the appropriate index with which to detect pine wilt disease-infected trees. Therefore, an independent samples t-test was conducted to see if the changes in reflectance values obtained from infected vs. non-infected trees as measured by various indices were statistically significant. The limit for statistical significance (p) was set at 0.01 (t < 2.6).
3. Results and Discussion
3.1. Changes in Leaf Reflectance Spectra
We measured spectral reflectance 15 times from June to October 2012. T9, a PWN-injected tree, was not infected with pine wilt disease; therefore, it was excluded from the present analysis. Spectral reflectance values with wavelengths in the mid-infrared range contain a lot of noise. This is because the measurements were taken during the wet season, and the mid-infrared wavelength range is sensitive to moisture content in the atmosphere [32].
In the present work, average time series values were used to study the general changes in infected and non-infected trees according to different spectral reflectance times. Figure 4a shows a graph of the interpolated spectral reflectance of the infected tree group, while Figure 4b shows a graph of the interpolated spectral reflectance of the non-infected tree group. The spectral reflectance graphs were smoothed. Even so, interpolation after removing noise was difficult because the measurements of wavelengths from 1800 nm to 1900 nm contained too much noise. Therefore, in this study, spectral reflectance in the range of 400 nm to 1700 nm was used to analyze changes in leaf reflectance spectra.
Generally, the spectral reflectance of vegetation is observed at wavelengths between 400 nm and 680 nm, where chlorophyll absorption occurs, and at 970 nm, 1190 nm and 1450 nm, which correspond to the absorption of moisture by leaves [45]. The time series spectral reflectance graph of non-infected trees reveals identical spectroscopic characteristics over time; no special changes were observed (Figure 4b). The spectral reflectance graph for pine wilt disease-infected trees was identical to that of non-infected trees early in the experiment. However, 67 days after PWN injection, around August 20, an increase in reflectance in the red (600–700 nm) and mid-infrared (1460–1550 nm) wavelength bands was observed (Figure 4a). When plants are under stress and thus producing less chlorophyll, the light absorption corresponding to chlorophyll decreases, which then leads to an increase in red and green reflectance and a chlorotic phenomenon in which leaves turn yellowish [45]. The increased reflectance in the visible spectrum is interpreted as a universal signal that describes the degree of stress applied to plants [46]. Reflectance values in near infra-red (NIR) wavelengths change when stressors are severe enough to completely desiccate leaves [45].
Pine trees infected with pine wilt disease show changes in physiology, including changes in leaf color (green to yellow), and decreases in moisture content [19]. PWN disrupts the movement of moisture in pine trees. Additionally, as the density of PWN increases, the moisture content of current-year branches and leaves decreases, resulting in a decrease in photosynthesis. Eventually, leaves are visibly discolored and trees wither [14,18,47,48]. Since green and red wavelengths relate to photosynthesis and mid-infrared wavelengths relate to moisture content [15,49,50], all three are significantly altered in pine wilt disease-infected trees in comparison with healthy trees. This is in agreement with the present study, in which Pinus thunbergii infected with PWN showed rapid changes in relative green, red, and mid-infrared reflectance values.
3.2. Vegetation Indices
In order to detect PWN-infected trees in the early stages of disease, 10 existing vegetation indices and a new index (GRSAI) were used to assess data collected over time, and an independent samples t-test was performed to compare the results (Table 2). Statistical significance was set at ρ ≤ 0.01 (t < 2.6). The NDVI, green normalized difference vegetation index (GNDVI), plant senescing reflectance index (PSRI), and pigment-specific normalized difference (PSND) all show significant differences starting on 20 August; red edge position (REP), the normalized difference water index (NDWI), and Simple ratio pigment index (SRPI) revealed differences starting on 29 August. The vegetation atmospherically resistant index (VARI), vegetation index green (VIgreen), NWI, and GRSAI revealed significant differences between infected and non-infected trees earlier than the other indices (starting on 10 August). Thus, the latter four indices are the most suitable for the early detection of pine wilt disease.
Indices that detect infected trees the fastest were primarily calculated using the ratio of reflectance values in green and red wavelengths. This is in accordance with the idea that the red wavelength band is the most sensitive to the differences between infected and non-infected trees. At a certain point after the injection of PWN in healthy trees, a high PWN reproduction rate plugs up the tracheids, which leads to a decrease in water content and chlorophyll function. Reflectance of red light is closely related to chlorophyll content [49]. Uto and Kosugi [20] reported that the characteristics of green leaves and oak wilt are best revealed by examining reflectance at 650 nm.
A notable characteristic of the spectral reflectance of pine wilt disease-infected trees is that as the infection progresses, the dynamic range of spectral reflectance in the mid-infrared wavelength band is wide whereas that of other wavelengths narrows (Figure 4). In light of this, it is inferred that indices such as the VARI, VIgreen, NWI, and GRSAI that assess a wide range of wavelengths are better at detecting pine wilt disease in the early stages. This result should be useful in future research on the early detection of pine wilt disease.
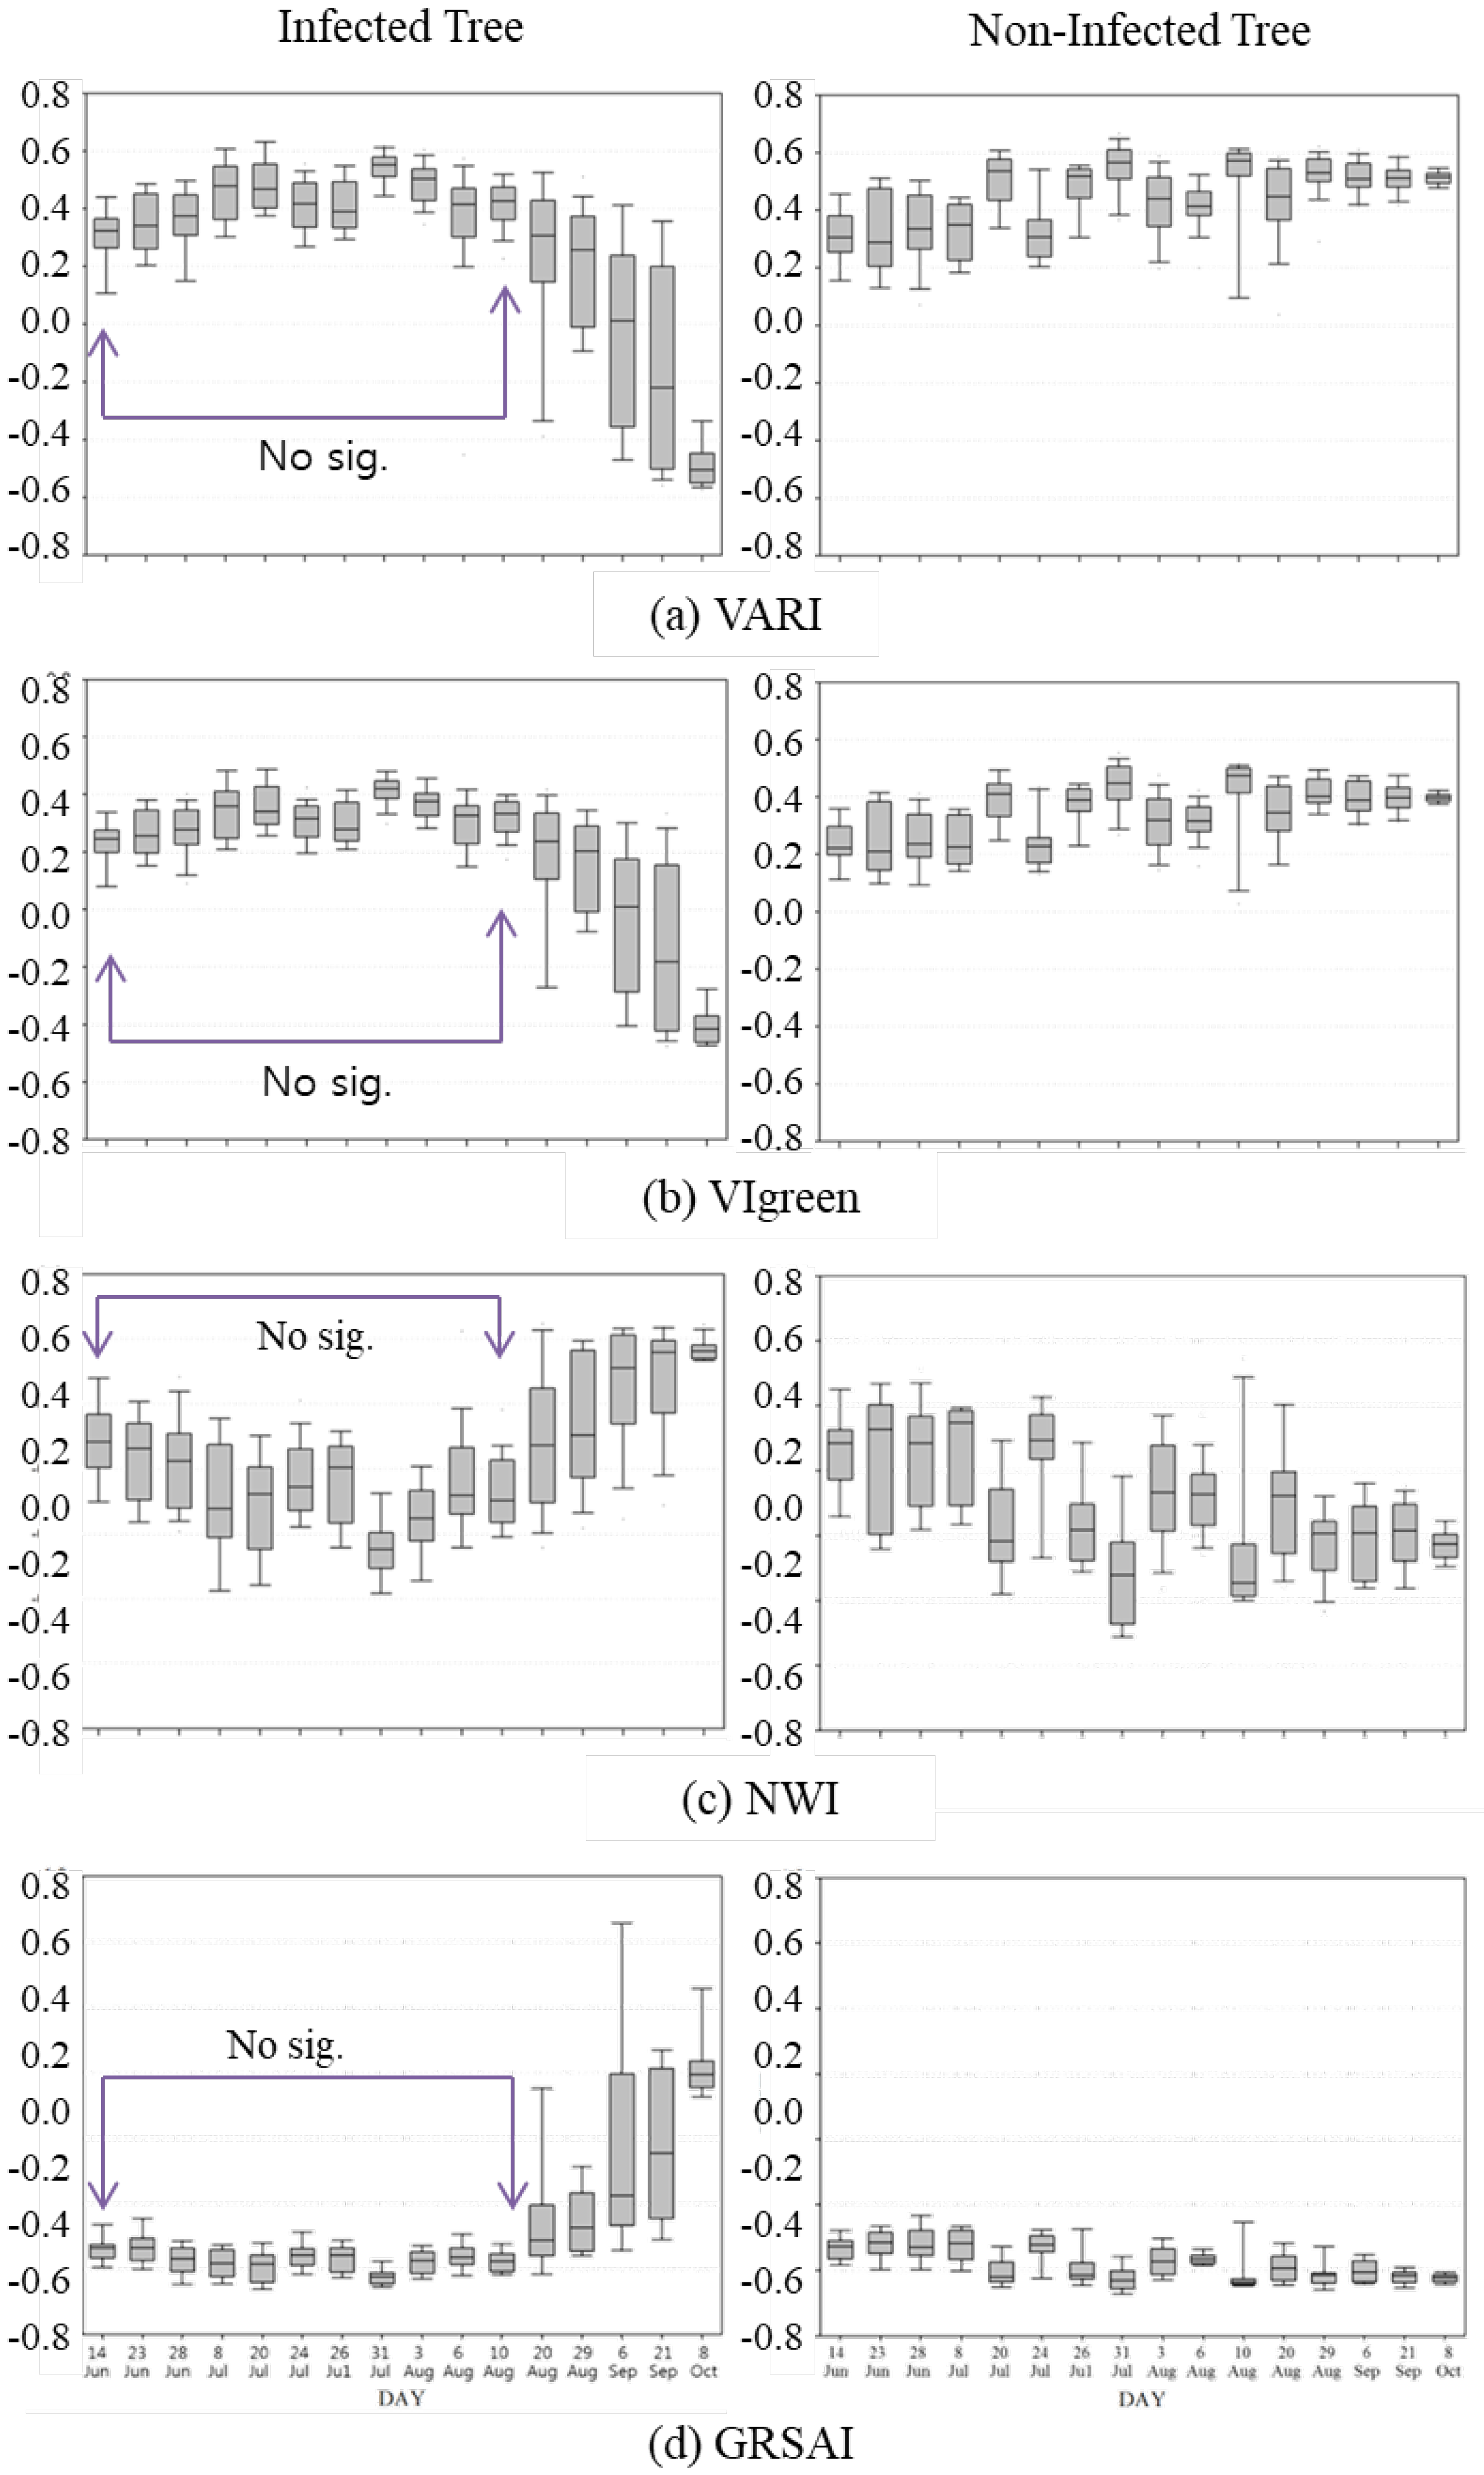
Figure 5 presents the changes in the VARI, VIgreen, NWI, and GRSAI by date. In infected trees, the values of the VARI and VIgreen decreased, with a large amount of variation, beginning on 10 August. This is because the susceptibility to disease differs between trees and because symptoms appear differently, even at different points on a single tree. The non-infected trees showed no obvious changes, so variation was much lower than in the infected group. Changes in each index correlate to changes in physiological characteristics caused by PWN. The VARI and Vigreen are indices related to pigment and nitrogen content, and a decline in these indices explains the discoloration and withering of leaves following the poor delivery of nutrients [50]. On the other hand, the values of NWI and GRSAI of the infected group increased beginning on 10 August.
NWI and GRSAI, which relate to plant senescence and leaf wilt, indicate the increasing damage done by pine wilt disease. NWI accommodates red, green and NIR wavelengths. As the NIR wavelength band reflects 60% of radiant energy, it inevitably contains noise originating from external conditions. Thus, the variability of NWI is larger than that of the VARI, Vigreen, and GRSAI. GRSAI measurements over time between infected trees and non-infected tress showed less variability than those of the other indices because the other three indices are dependent on specific spots on the tree, which in turn causes larger fluctuations from noise, whereas the GRSAI is calculated on the basis of a wider area where the noise factor does not necessarily have a huge impact on the index calculation.
4. Conclusions
This study investigated changes in leaf reflectance spectra along with the hyperspectral analysis of pine wilt disease to determine the optimal detection indices. Reflectance values from 350–2500 nm were taken from infected and non-infected trees with a GER 3700 spectrometer from June to October 2012. We used 10 existing reflectance indices (NDVI, VARI, VIgreen, PSND, PSRI, NWI, GNDVI, NDWI, REP, and SRPI) and a new index, GRSAI, to characterize complex spectra and make comparisons among the target trees (non-infected and infected trees) over time. Our investigations showed reflectance changes in most of the infected trees in the red and mid-infrared wavelengths within two months of pine wilt disease infection with no notable differences in reflectance in non-infected trees. Detecting changes in spectral reflectance in red and mid-infrared wavelengths can contribute to the early detection of pine wilt disease. Our analyses showed that the NDVI, GNDVI, PSRI, and PSND all displayed significant differences in infected vs. non-infected trees beginning on 20 August, and REP, the NDWI and SPRI showed differences beginning on 29 August. The VARI, VIgreen, NWI, and GRSAI continuously showed significant differences between infected and non-infected trees earlier than the other indices (10 August). Importantly, the GRSAI, which compares the difference between red and green reflectance, showed less variability over time than the other indices. Red wavelengths have the fastest changes in spectral reflectance patterns after pine wilt infection. The results of this study, when combined with remote sensing data such as hyperspectral aerial imagery, are expected to be quite useful for the early detection of pine wilt disease.
Acknowledgments
This study was supported by the Korean Ministry of Environment as part of the Climate Change Correspondence Program (Project Number: 2014001310008).
Author Contributions
So-Ra Kim and Woo-Kyun Lee designed this research, analyzed the results, and wrote the paper; Chul-Hee Lim and Moonil Kim participated in analyzing the results and the data work. Seung-Ho Lee and Sung-Soon Lee supported the technical part and reviewed the manuscript. Menas Kafatos and all authors gave comments and approved the final manuscript.
Conflicts of Interest
The authors declare no conflict of interest.
References
- Mota, M.M.; Braasch, H.; Bravo, M.A.; Penas, A.C.; Burgermeister, W.; Metge, K.; Sousa, E. First report of Bursaphelenchus xylophilus in Portugal and in Europe. Nematology 1999, 1, 727–734. [Google Scholar] [CrossRef]
- Ichihara, Y.; Fukuda, K.; Suzuki, K. Early symptom development and histological change associated with migration of Bursaphelenchus xylophilus in seeding tissues of Pinus thunbergii. Plant Dis. 2000, 84, 675–680. [Google Scholar] [CrossRef]
- Hyun, M.W.; Kim, J.H.; Suh, D.Y.; Lee, S.K.; Kim, S.H. Fungi isolated from pine wood nematode, its vector Japanese pine sawyer, and the nematode-infected Japanese Black Pine Wood in Korea. Korean Soc. Mycol. 2007, 35, 159–161. [Google Scholar] [CrossRef] [PubMed]
- Rodrigues, M. National Eradication Programme for the Pinewood Nematode. In Pine Wilt Disease: A Worldwide Threat to Forest Ecosystems; Mota, M.M., Vieira, P., Eds.; Springer: Kato Bunmeisha, Japan, 2008; pp. 5–14. [Google Scholar]
- Sousa, D.; Naves, P.; Vieira, M. Prevention of pine wilt disease induced by Bursaphelenchus xylophilus and Monochanmus galloprovincialis by trunk injection of emamectin benzoate. Phytoparasitica 2013, 41, 143–148. [Google Scholar] [CrossRef]
- Kim, J.B.; Jo, M.H.; Oh, J.S.; Lee, K.J.; Park, S.J.; Um, H.H. Temporal and spatial correlation analysis of Bursaphelenchus xylophilus damage area. In Proceedings of the Korean Society of Agricultural and Forest Meteorology 2001 Spring Conference, Seoul, Korea, 1 June 2001; pp. 49–52. [Google Scholar]
- Shin, S.C. Pine Wilt Disease in Korea. In Pine Wilt Disease; Zhao, B.G., Futai, K., Sutherland, J.R., Takeuchi, Y., Eds.; Springer: Kato Bunmeisha, Japan, 2008; pp. 26–32. [Google Scholar]
- Son, M.H.; Lee, W.K.; Lee, S.H.; Cho, H.K.; Lee, J.H. Natural spread pattern of damaged area by pine wilt disease using geostatistical analysis. J. Korean For. Soc. 2006, 95, 240–249. [Google Scholar]
- Kim, Y.S.; Jung, S.E.; Lee, W.K.; Kim, J.B.; Kwon, T.H. Analyzing vegetation index change of damaged trees by pine wilt disease using portable near infrared camera. J. Korean For. Soc. 2008, 97, 561–564. [Google Scholar]
- Kim, M.I.; Lee, W.K.; Kwon, T.H.; Kwak, D.A.; Kim, Y.S.; Lee, S.H. Early detecting damaged trees by pine wilt disease using DI (Detection Index) from portable near infrared camera. J. Korean For. Soc. 2011, 100, 374–381. [Google Scholar]
- Kim, E.N.; Kim, D.Y. An investigation of pine wilt damage by using ground remote sensing technique. Korean Assoc. Reg. Geogr. 2008, 14, 84–92. [Google Scholar]
- Kim, J.B.; Jo, M.H.; Kim, I.H.; Kim, Y.K. A study on the extraction of damaged area by pine wood nematode using high resolution IKONOS satellite images and GPS. J. Korean For. Soc. 2003, 92, 362–366. [Google Scholar]
- Jo, M.H.; Kim, J.B.; Oh, J.S.; Lee, K.J. Extraction method of damaged area by pinetree pest (Bursaphelenchus xylophilus) using high resolution IKONOS image. Korean Assoc. Geogr. Inf. Stud. 2001, 4, 72–78. [Google Scholar]
- Lee, H.Y.; Koo, C.D.; Sung, J.H.; Shin, J.H.; Yoo, J.H. Changes in water potential of pine seedlings inoculated with Bursaphelenchus xylophilus. J. Korean For. Soc. 2010, 99, 337–343. [Google Scholar]
- Jones, H.G.; Vaughan, R.A. Remote Sensing of Vegetation; Oxford University Press Inc.: New York, NY, USA, 2010; pp. 169–171. [Google Scholar]
- Kelly, N.M. Monitoring Sudden Oak Death in California Using High-Resolution Imagery; General Technical Report, PSW-GTR-184: 799-810; USADA-Forest Service: Washington, DC, USA, 2002.
- Agrios, G. Plant Pathology, 5th ed.; Elsevier Academic Press: Burlington, VT, USA, 2005; p. 922. [Google Scholar]
- Fukuda, K.; Hogetsu, T.; Suzuki, K. Photosynthesis and water status of pine-wood nematode-infected pine seedlings. J. Jpn. For. Soc. 1992, 74, 1–8. [Google Scholar]
- Yoon, J.H.; Woo, K.S.; Moon, Y.S.; Koo, Y.B.; Lee, D.H. Change of water content and disease development on Pinus thunbergii seedlings inoculated with Bursaphelenchus xylophilus. J. Korean For. Soc. 2008, 97, 570–575. [Google Scholar]
- Uto, K.; Kosugi, Y. Evaluation of oak wilt index based on genetic programming. In Proceedings of the First Workshop on Hyperspectral Image and Signal Processing: Evolution in Remote Sensing (WHISPERS ’09), Grenoble, France, 26–28 August 2009; pp. 1–4. [Google Scholar]
- Uto, K.; Massaki, T.; Kosugi, Y.; Saito, E.; Ogata, T. Band selection for Japanese oak wilt extraction in autumnal tints of forest based on NWI. In Proceedings of the 2011 3rd Workshop on Hyperspectral Image and Signal Processing: Evolution in Remote Sensing (WHISPERS), Lisbon, Portugal, 6–9 June 2011; pp. 1–4. [Google Scholar]
- Jordan, C.F. Leaf-area index from quality of light on the forest floor. Ecology 1969, 50, 663–666. [Google Scholar] [CrossRef]
- Tucker, C.J. Red and photographic infrared linear combinations for monitoring vegetation. Remote Sens. Environ. 1979, 8, 127–150. [Google Scholar] [CrossRef]
- Sellers, P.J. Canopy reflectance, photosysnthesis and transpiration. Int. J. Remote Sens. 1985, 6, 1335–1372. [Google Scholar] [CrossRef]
- Rock, B.N.; Vogelmann, J.E.; Williams, D.L.; Vogelmann, A.F.; Hoshizaki, T. Remote Detection of Forest Damage. BioScience 1986, 36, 439–445. [Google Scholar] [CrossRef]
- Hunt, E.R., Jr.; Rock, B.N.; Nobel, P.S. Measurement of leaf relative water content by infrared reflectance. Remote Sens. Environ. 1987, 22, 429–435. [Google Scholar] [CrossRef]
- Curran, P.J. Remote sensing of foliar chemistry. Remote Sens. Environ. 1989, 30, 271–278. [Google Scholar] [CrossRef]
- Peñuelas, J.; Pinol, J.; Ogaya, R.; Filella, I. Estimation of plant water content by the reflectance water index WI (R900/R970). Int. J. Remote Sens. 1997, 18, 2869–2875. [Google Scholar] [CrossRef]
- Gamon, J.A.; Surfus, J.S. Assessing leaf pigment content and activity with a reflectometer. New Phytol. 1999, 143, 105–117. [Google Scholar] [CrossRef]
- Ustin, S.L.; Gitelson, A.A.; Jacquemoud, S.; Schaepman, M.; Asner, G.P.; Gamon, J.A.; Zarco-Tejada, P. Retrieval of foliar information about plant pigment systems form high resolution spectroscopy. Remote Sens. Environ. 2009, 113, S67–S77. [Google Scholar] [CrossRef] [Green Version]
- Ayoub, S.M. Plant Nematology, an Agricultural Training Aid; Nema Aid Publications: Sacramento, CA, USA, 1980. [Google Scholar]
- Field Spectroscopy Facility. Field Guide for the GER3700. 2005. Available online: http://fsf.nerc.ac.uk/resources/guides/pdf_guides/3700_guide_v3_roroc.pdf (accessed on 20 February 2013 ).
- Rouse, J.W.; Haas, R.H.; Schell, J.A.; Deering, D.W. Monitoring vegetation systems in the Great Plains with ERTS. In Proceedings of the Third ERTS Symposium, Washington, DC, USA, 10–14 December 1973; NASA SP-351. pp. 309–317. [Google Scholar]
- Gitelson, A.A.; Kaufman, Y.J.; Stark, R.; Rundquist, D. Novel algorithms for remote estimation of vegetation fraction. Remote Sens. Environ. 2002, 80, 76–87. [Google Scholar] [CrossRef]
- Peñuelas, J.; Filella, I.; Lioret, P.; Muñoz, F.; Vilajeliu, M. Reflectance assessment of mite effects on apple trees. Int. J. Remote Sens. 1995, 16, 2727–2733. [Google Scholar] [CrossRef]
- Gao, B. NDWI: A normalized difference water index for remote sensing of vegetation liquid water from space. Remote Sens. Environ. 1996, 58, 257–266. [Google Scholar] [CrossRef]
- Blackburn, G.A. Quantifying chlorophylls and carotenoids from leaf to canopy scale: An evaluation of some hyperspectral approaches. Remote Sens. Environ. 1998, 66, 273–285. [Google Scholar] [CrossRef]
- Daughtry, C.S.T.; Walthall, C.L.; Kim, M.S.; de Colstoun, E.B.; McMurtrey, J.E., III. Estimating corn leaf chlorophyll concentration from leaf and canopy reflectance. Remote Sens. Environ. 2000, 74, 229–239. [Google Scholar] [CrossRef]
- Lee, J.Y.; Warner, T.A. Image classification with a region based approach in high spatial resolution imagery. In Proceedings of the International Society for Photogrammetry and Remote Sensing, Istanbul, Turkey, 12–23 July 2004; pp. 1141–1146. [Google Scholar]
- Gitelson, A.A.; Merzlyak, M.N.; Lichtenthaler, H.K. Detection of red edge position and chlorophyll content by reflectance measurements near 700 nm. J. Plant Physiol. 1996, 148, 501–508. [Google Scholar] [CrossRef]
- Merzlyak, M.N.; Gitelson, A.A.; Chivkunova, O.B.; Rakitin, V.Y. Non-destructive optical detection of pigment changes during leaf senescence and fruit ripening. Physiol. Plant. 1999, 106, 135–141. [Google Scholar] [CrossRef]
- Chappelle, E.W.; Kim, M.S.; McMurtrey, J.E., III. Ratio analysis of reflectance spectra (RARS): An algorithm for the remote estimation of the concentrations of chlorophyll A, chlorophyll B and the carotenoid in soybean leaves. Remote Sens. Environ. 1992, 39, 239–247. [Google Scholar] [CrossRef]
- Guyot, G.; Baret, F. Utilization de la haute résolution spectrale pour suivre l’état des couverts végétaux. In Proceedings of the 4th International Colloquium on Spectral Signatures of Objects in Remote Sensing, Aussois, France, 18–22 January 1988; ESA SP-287. pp. 279–287. [Google Scholar]
- Uto, K.; Kosugi, Y.; Ogata, T. Hyperspectral analysis of Japanese oak wilt to determine normalized wilt index. In Proceedings of the Geoscience and Remote Sensing Symposium (IGARSS 2008), Boston, MA, USA, 6–11 July 2008; Volume 2, pp. 295–298. [Google Scholar]
- Jensen, J.R. Remote Sensing of the Environmental: An Earth Resource Perspective; Prentice Hall: Upper Saddle River, NJ, USA, 2002; p. 335. [Google Scholar]
- Carter, G.A. Primary and secondary effects of the water content on the spectral reflectance of leaves. Am. J. Bot. 1991, 78, 916–924. [Google Scholar] [CrossRef]
- Kiyohara, T.; Suzuki, K. Nematode population growth and disease development in the pine wilting disease. Eur. J. For. Pathol. 1978, 8, 285–292. [Google Scholar] [CrossRef]
- Hara, N.; Takeuch, Y.; Futai, K. Cytological changes in ray parenchyma cells of seedlings of three pine species infected with the pine wilt disease. Jpn. J. Nematol. 2006, 36, 23–32. [Google Scholar] [CrossRef]
- Keyworth, S.; Jarman, M.; Medcalf, K. Assessing the Extent and Severity of Erosion on the Upland Organic Soils of Scotland Using Earth Observation: A GIFTSS Implementation Test: Final Report. 2009. Available online: http://www.scotland.gov.uk/Resource/Doc/290944/0089386.pdf (accessed on 28 February 2014).
- Roberts, D.A.; Roth, K.L.; Perroy, R.L. Hyperspectral vegetation indices, In Hyperspectral Remote Sensing of Vegetation; Thenkabail, P.S., Lyon, J.G., Huete, A., Eds.; CRC Press, Taylor & Francis Group: Boca Raton, FL, USA, 2012; pp. 309–328. [Google Scholar]
Figure 1.
Pine wood nematode (PWN)-injected trees (T1–T5, T9 and T10) and non-injected trees (T6–T8).
Figure 1.
Pine wood nematode (PWN)-injected trees (T1–T5, T9 and T10) and non-injected trees (T6–T8).
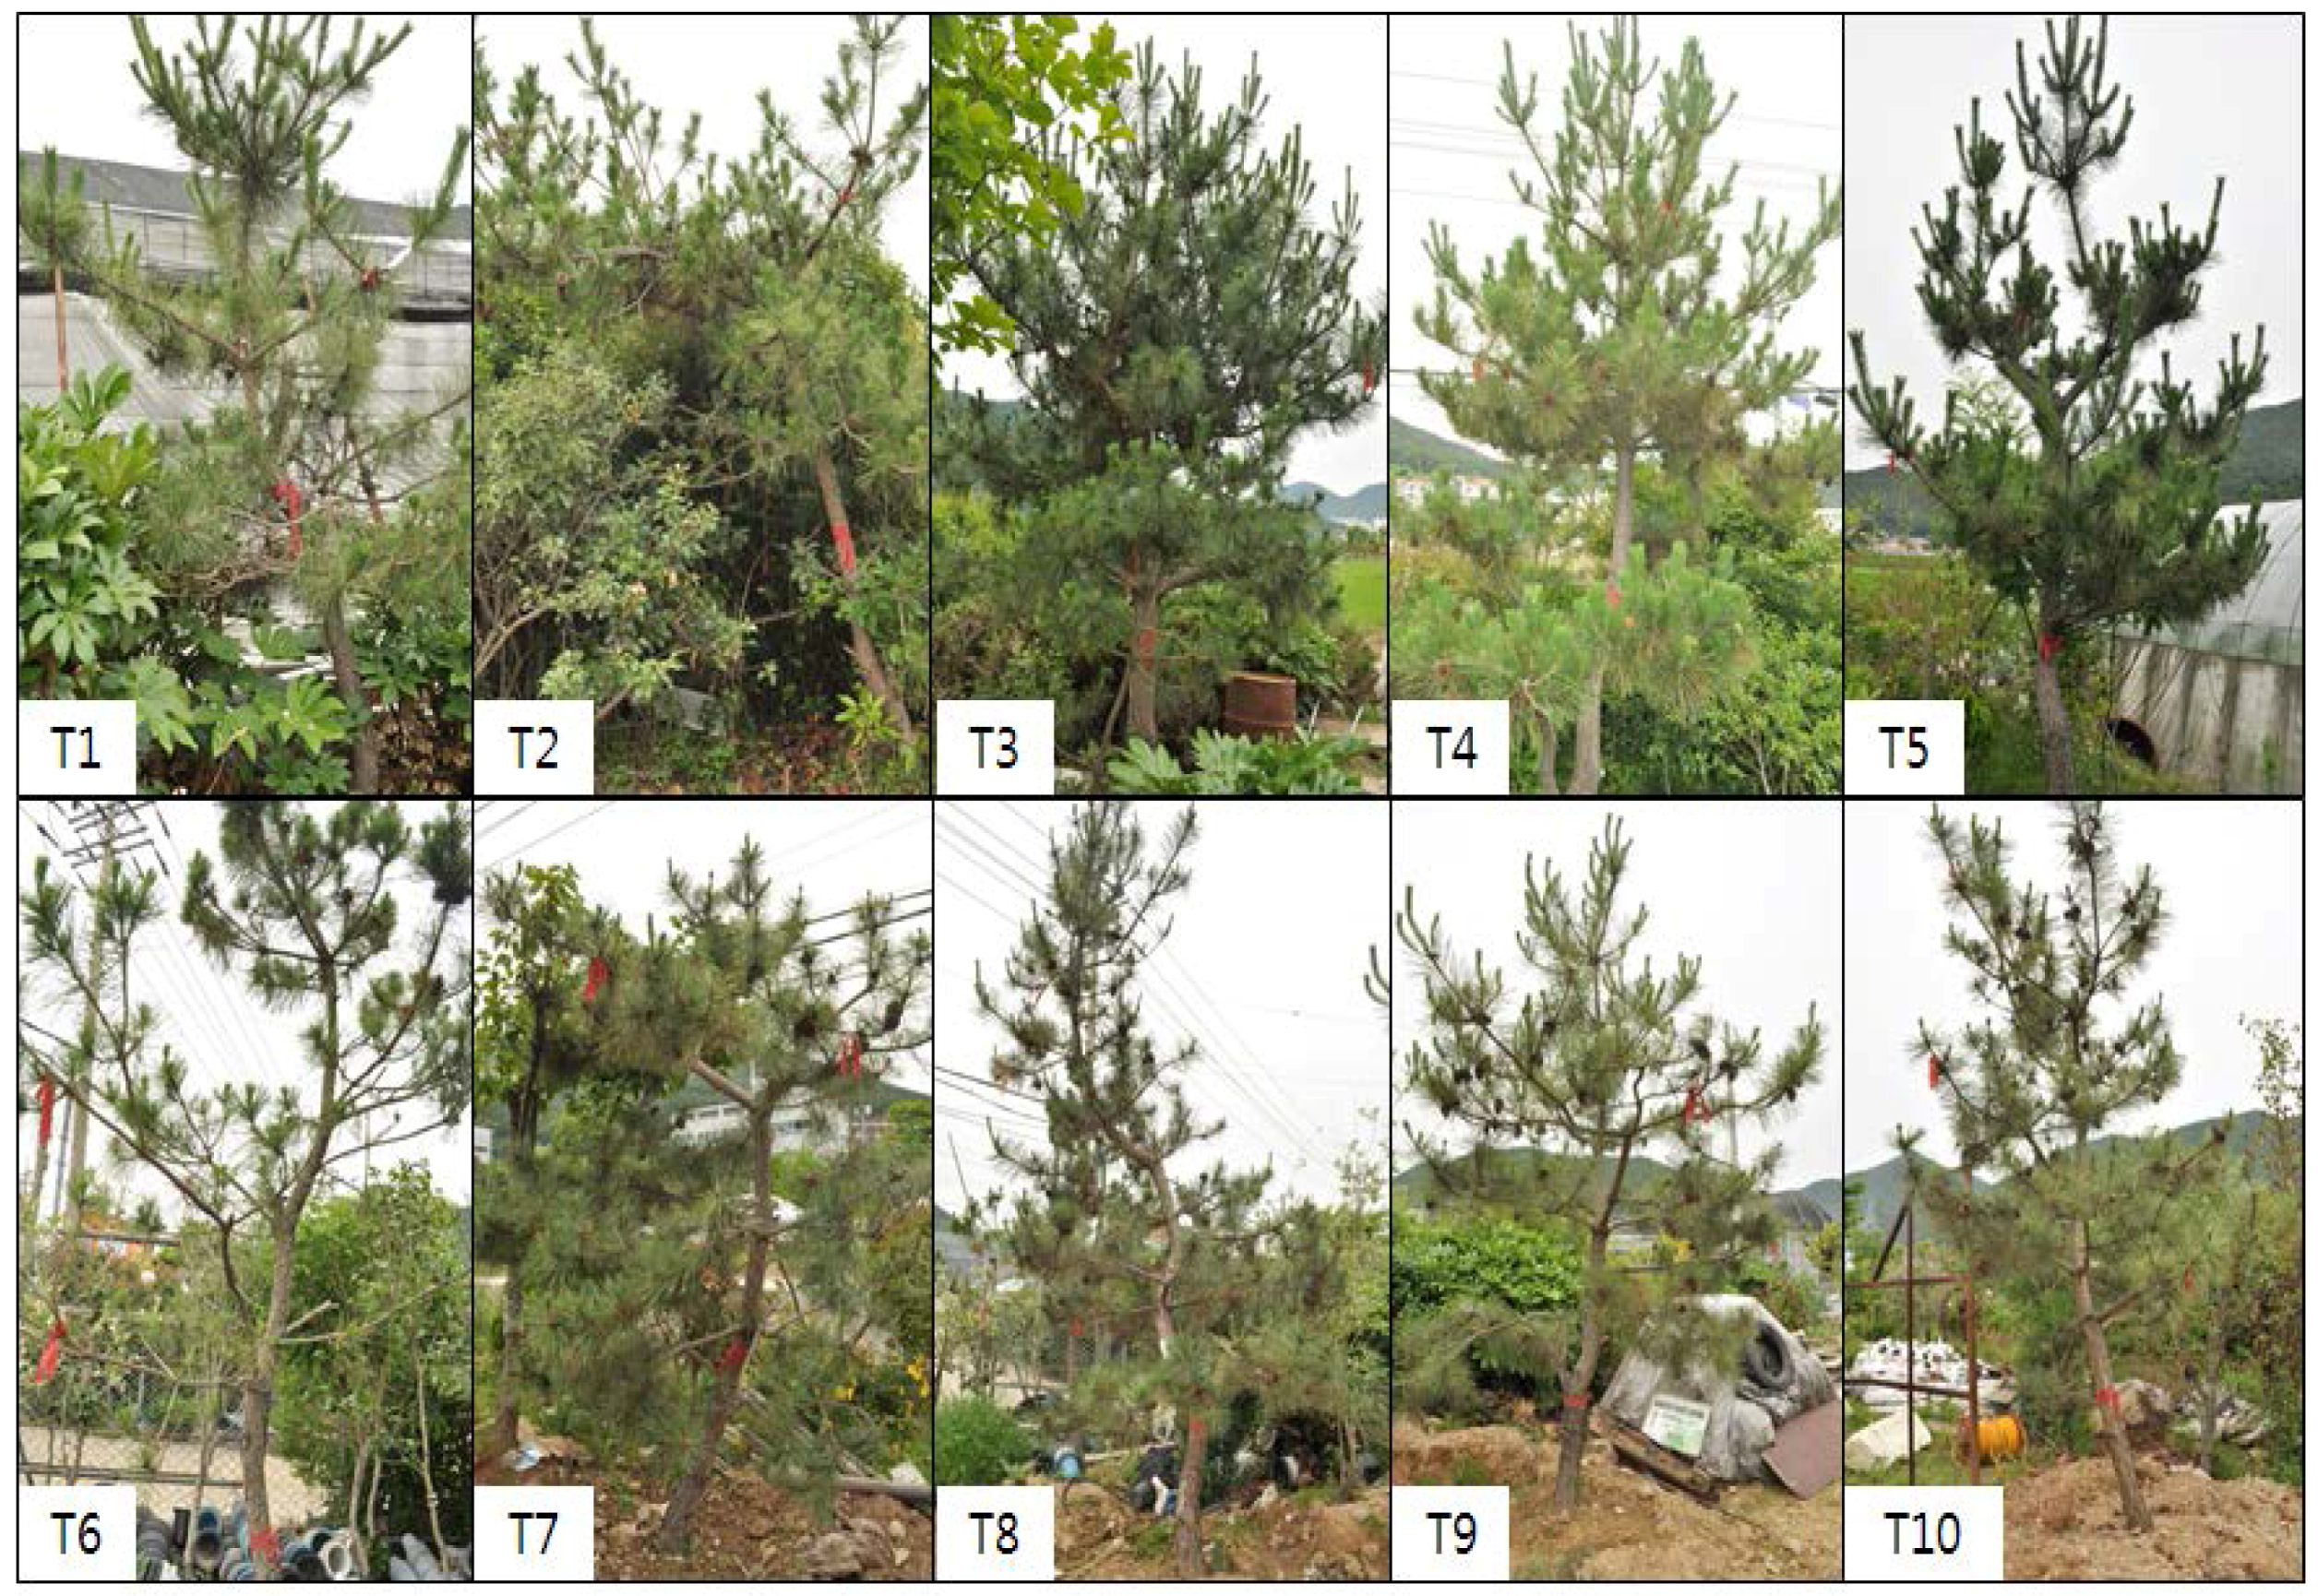
Figure 2.
Reflectance variation between healthy (a) and wilting (b) vegetation.

Figure 3.
The green-red spectral area index (GRSAI) calculation utilizing integration.

Figure 4.
Changes in the leaf reflectance spectra of infected (a), and non-infected (b) trees.
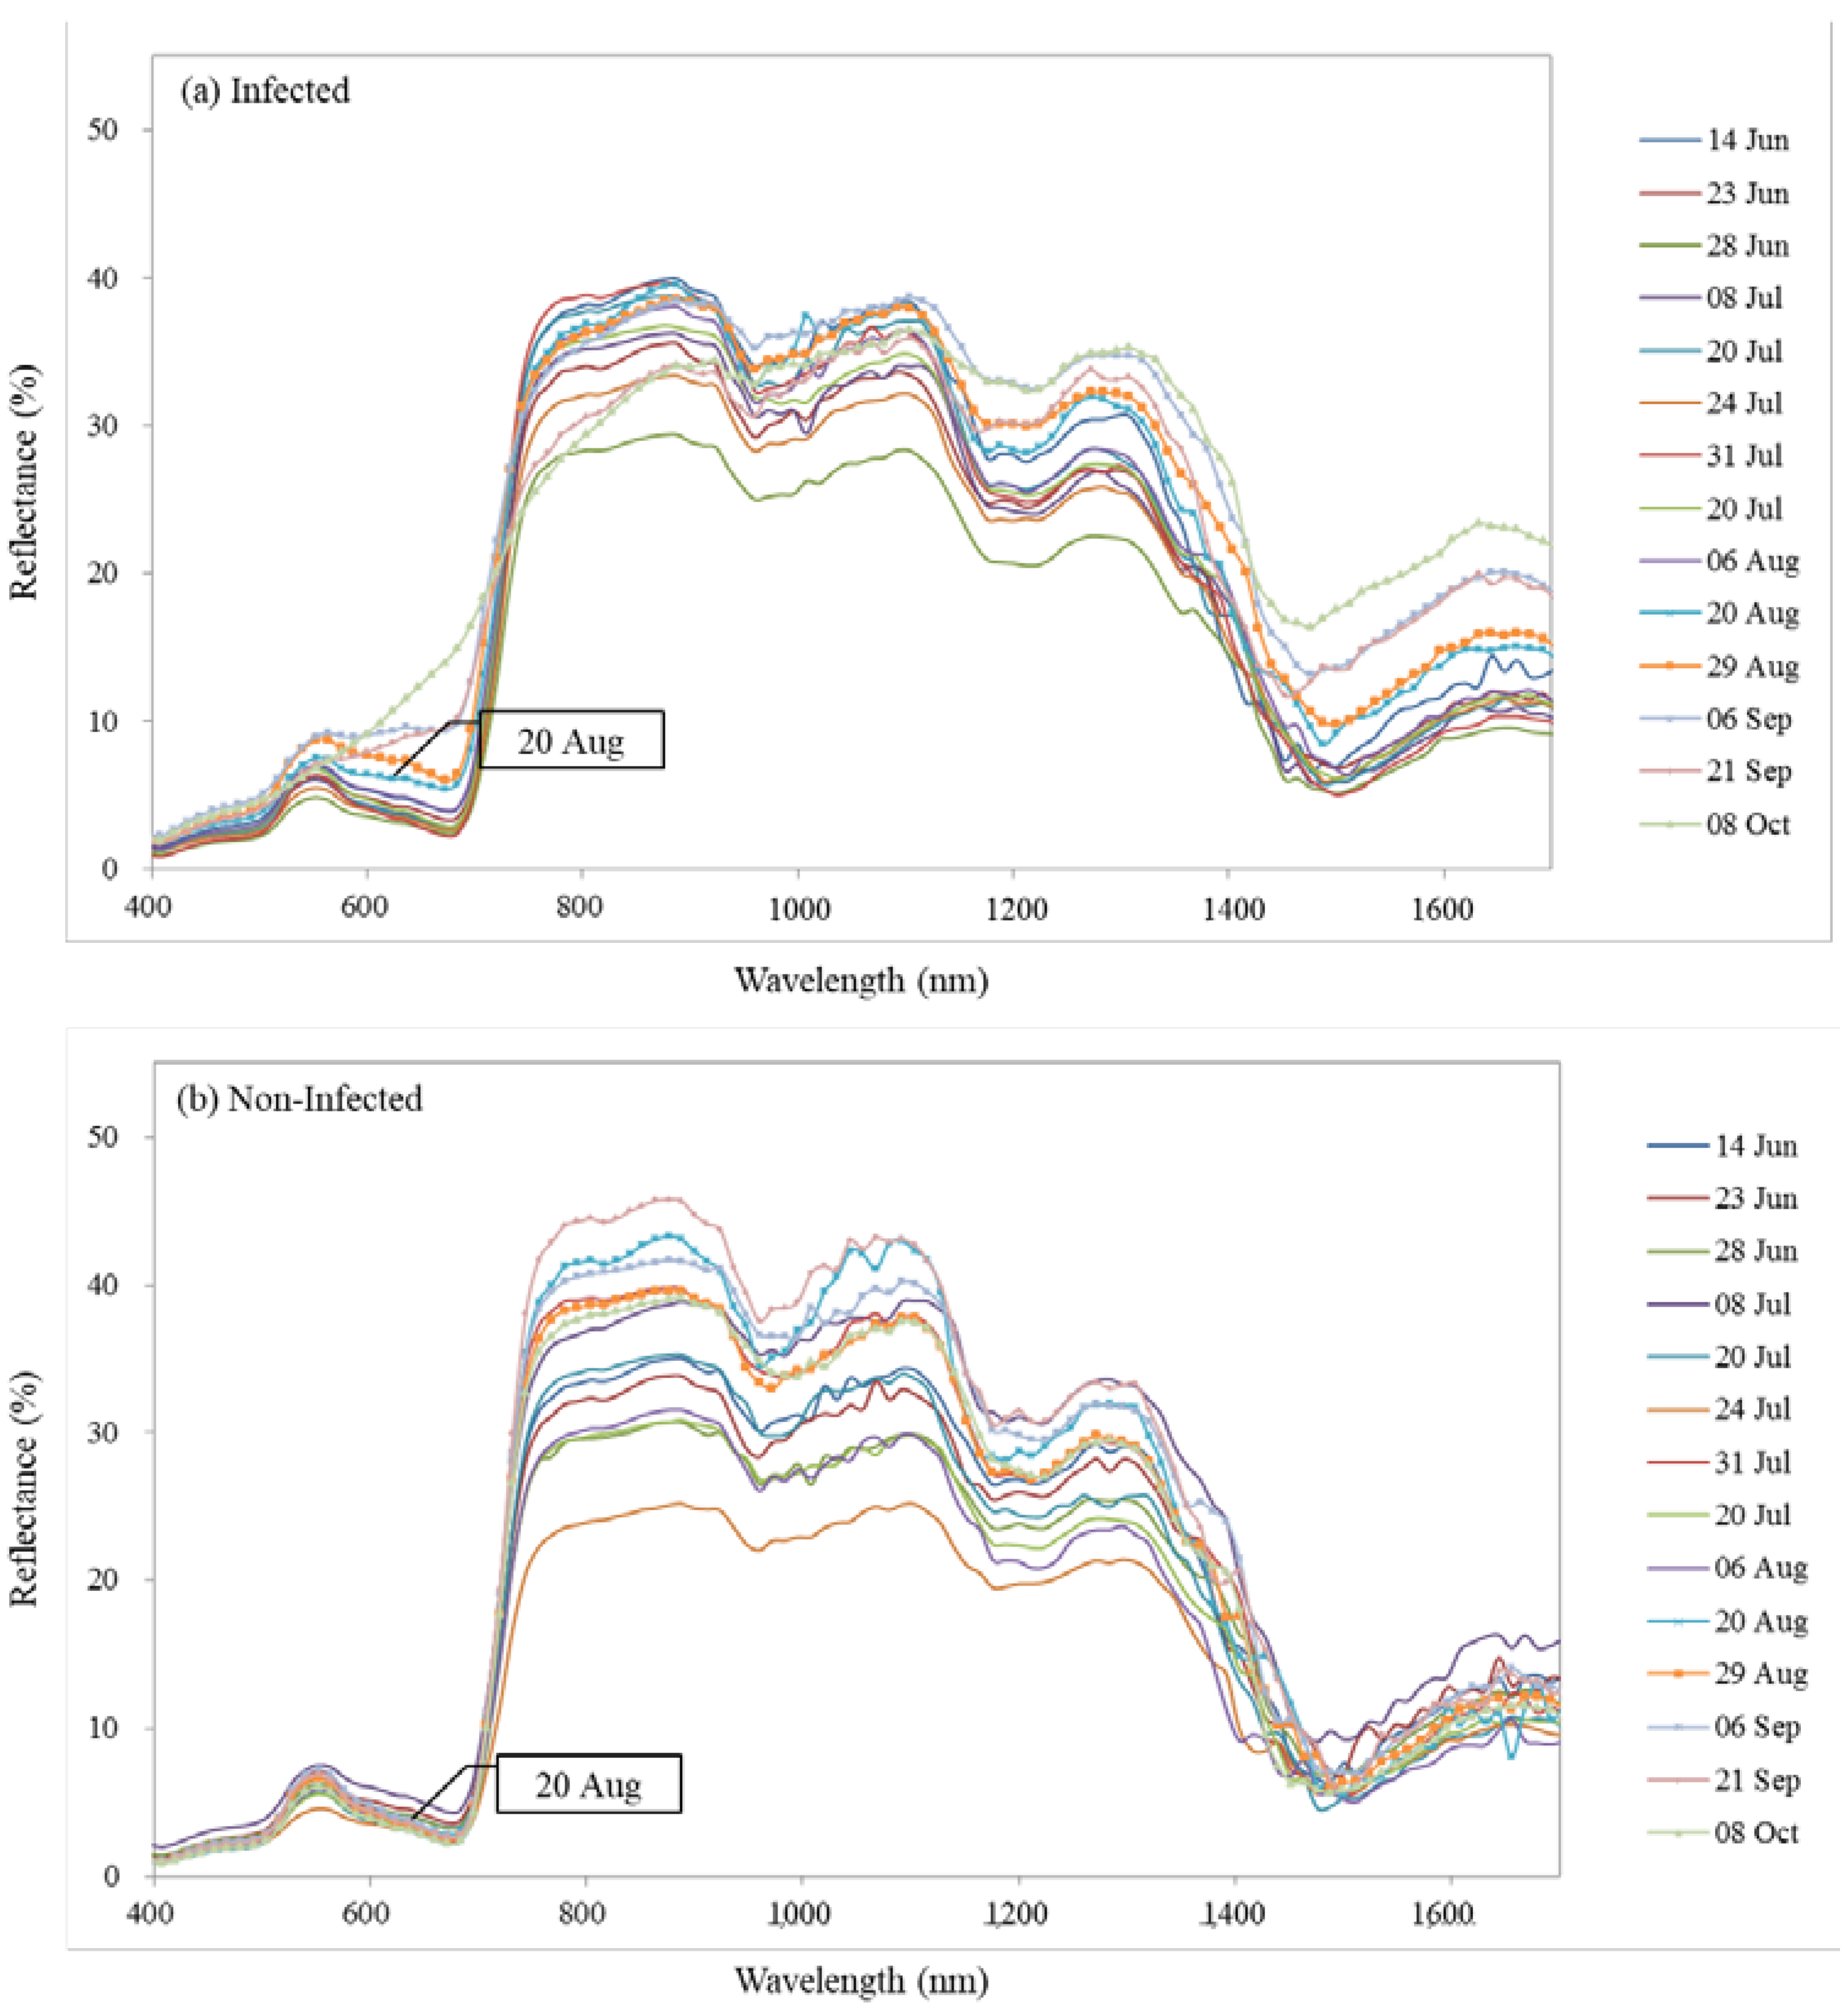
Figure 5.
Changes in vegetation reflectance indices (VARI, VIgreen, NWI, GRSAI) over time.

Table 1.
Vegetation indices calculated from multispectral and hyperspectral data.
| Vegetation Index | Equation | Reference |
|---|---|---|
| Normalized difference vegetation index (NDVI) | Rouse et al. [33] | |
| Green normalized difference vegetation index (GNDVI) | Gitelson et al. [40] | |
| Normalized difference water index (NDWI) | Gao [36] | |
| Vegetation index green (VIgreen) | Giltelson et al. [34] | |
| Plant senescing reflectance index (PSRI) | Merzlyak et al. [41] | |
| Simple ratio pigment index (SRPI) | Peñuelas et al. [35] | |
| Vegetation atmospherically resistant index (VARI) | Gitelson et al. [34] | |
| Pigment-specific normalized difference (PSND) | Chappelle et al. [42] | |
| Red edge position (REP) | Guyot & Baret [43] | |
| Normalized wilt index (NWI) | NDGI = (Rred − Rgreen)/(Rred + Rgreen) | Uto et al. [44] |
Table 2.
Independent t-test results of different indices used to measure reflectance in infected and non-infected trees over time.
Table 2.
Independent t-test results of different indices used to measure reflectance in infected and non-infected trees over time.
| Indices | 14 June | 23 June | 28 June | 8 July | 20 July | 24 July | 26 July | 31 July | 6 August | 10 August | 20 August | 29 August | 6 September | 21 September | 8 October |
|---|---|---|---|---|---|---|---|---|---|---|---|---|---|---|---|
| NDVI | 1.437 | 0.865 | 0.525 | 4.314 | 0.950 | 3.050 | 0.166 | 0.490 | 1.714 | 1.296 | 3.144 | 6.619 | 9.228 | 10.269 | 27.932 |
| GNDVI | 1.208 | 1.126 | 1.593 | 3.711 | 0.226 | 1.944 | 2.807 | 2.379 | 0.443 | 1.971 | 2.838 | 5.005 | 9.717 | 14.113 | 7.088 |
| REP | 2.115 | 6.789 | 3.724 | 4.299 | 2.178 | 2.837 | 7.523 | 4.945 | 0.228 | 2.689 | 0.718 | 4.554 | 4.786 | 2.704 | 3.877 |
| NDWI | 1.500 | 3.423 | 2.327 | 6.747 | 1.854 | 5.102 | 0.182 | 4.285 | 0.069 | 0.646 | 1.230 | 6.681 | 8.902 | 8.968 | 12.478 |
| PSRI | 1.031 | 2.529 | 0.482 | 2.612 | 0.900 | 4.696 | 1.023 | 2.956 | 1.509 | 0.497 | 2.810 | 4.845 | 5.489 | 7.083 | 15.040 |
| SRPI | 0.691 | 3.396 | 0.196 | 2.374 | 2.111 | 2.049 | 1.464 | 1.367 | 1.318 | 2.741 | 1.121 | 5.271 | 6.529 | 9.525 | 10.857 |
| VARI * | 0.976 | 1.011 | 0.335 | 4.416 | 1.154 | 3.804 | 2.548 | 0.979 | 1.408 | 2.715 | 3.846 | 7.900 | 8.912 | 10.290 | 28.122 |
| VIgreen * | 1.054 | 0.636 | 0.383 | 3.948 | 1.745 | 3.420 | 2.990 | 1.857 | 1.445 | 3.594 | 4.074 | 7.844 | 8.823 | 10.222 | 27.622 |
| PSND | 1.320 | 1.048 | 0.570 | 4.444 | 0.859 | 3.097 | 0.550 | 0.754 | 1.726 | 1.154 | 2.958 | 6.437 | 9.230 | 10.257 | 25.554 |
| NWI * | 1.155 | 0.040 | 0.640 | 3.562 | 1.911 | 2.901 | 2.844 | 2.730 | 1.274 | 4.198 | 4.052 | 8.654 | 13.192 | 14.003 | 50.321 |
| GRSAI * | 0.674 | 0.860 | 2.355 | 4.242 | 1.489 | 2.427 | 2.186 | 0.532 | 1.412 | 2.660 | 3.915 | 5.535 | 6.033 | 8.582 | 11.138 |
* Vegetation index for early detection of pine wilt disease.
© 2018 by the authors. Licensee MDPI, Basel, Switzerland. This article is an open access article distributed under the terms and conditions of the Creative Commons Attribution (CC BY) license (http://creativecommons.org/licenses/by/4.0/).
Share and Cite
MDPI and ACS Style
Kim, S.-R.; Lee, W.-K.; Lim, C.-H.; Kim, M.; Kafatos, M.C.; Lee, S.-H.; Lee, S.-S. Hyperspectral Analysis of Pine Wilt Disease to Determine an Optimal Detection Index. Forests 2018, 9, 115. https://doi.org/10.3390/f9030115
AMA Style
Kim S-R, Lee W-K, Lim C-H, Kim M, Kafatos MC, Lee S-H, Lee S-S. Hyperspectral Analysis of Pine Wilt Disease to Determine an Optimal Detection Index. Forests. 2018; 9(3):115. https://doi.org/10.3390/f9030115
Chicago/Turabian StyleKim, So-Ra, Woo-Kyun Lee, Chul-Hee Lim, Moonil Kim, Menas C. Kafatos, Seung-Ho Lee, and Sung-Soon Lee. 2018. "Hyperspectral Analysis of Pine Wilt Disease to Determine an Optimal Detection Index" Forests 9, no. 3: 115. https://doi.org/10.3390/f9030115
Note that from the first issue of 2016, this journal uses article numbers instead of page numbers. See further details here.