Plant Water Use Strategy in Response to Spatial and Temporal Variation in Precipitation Patterns in China: A Stable Isotope Analysis


1
State Key Laboratory of Soil Erosion and Dryland Farming on the Loess Plateau, Institute of Soil and Water Conservation, Chinese Academy of Sciences and the Ministry of Water Resources, Yangling 712100, China
2
University of Chinese Academy of Sciences, Beijing 100049, China
*
Author to whom correspondence should be addressed.
Forests 2018, 9(3), 123; https://doi.org/10.3390/f9030123
Submission received: 20 November 2017
/
Revised: 27 February 2018
/
Accepted: 2 March 2018
/
Published: 6 March 2018
(This article belongs to the Special Issue Isotope Application in Forest Growth Assessment)
Abstract
:Spatial and temporal variation in precipitation patterns can directly alter the survival and growth of plants, yet in China there is no comprehensive and systematic strategy for plant use based on the effects of precipitation patterns. Here, we examined information from 93 published papers (368 plant species) on plant xylem water stable isotopes (δD and δ18O) in China. The results showed that: (1) The slope of the local meteoric water line (LMWL) gradually increased from inland areas to the coast, as a result of continental and seasonal effects. The correlation between δD and δ18O in plant stem water is also well fitted and the correlation coefficients range from 0.78 to 0.89. With respect to the soil water line, the δ18O values in relation to depth (0–100 cm) varied over time; (2) Plants’ main water sources are largely affected by precipitation patterns. In general, plants prioritize the use of stable and continuous water sources, while they have a more variable water uptake strategy under drought conditions; (3) There are no spatial and temporal variations in the contribution of the main water source (p > 0.05) because plants maintain growth by shifting their use of water sources when resources are unreliable.
1. Introduction
Vegetation plays an important role in global water cycles, and its survivorship and growth is essentially restricted by water resources. Stable isotope techniques have become one of the most powerful tools for understanding the relationship between plants and water sources. Precipitation is one of the key sources of water. Spatial distribution in the δD and δ18O values of precipitation are commonly used in hydrologic studies [1]. Global meteoric water line observations in 1961 provided the foundation in this field [2]. Massive models based on spatial interpolation methods greatly boost accurate representation of stable isotopes in precipitation [3,4]. Furthermore, previous works have proved that latitude, altitude, amount of precipitation, and distance from coast are four major factors of variation in precipitation isotope ratios [5]. These driving forces, particularly uneven spatial distribution of precipitation, are extensively recognized as governing terrestrial biological activity, as a result of differing water use strategies [6,7]. In general, plants give priority to using stable and continuous water sources, although they can vary their water uptake strategy under special conditions. There is considerable research from all over the world showing how different plant species use water resources on the local scale. Flanagan and Ehleringer found that Chrysothamnus nauseosus (Pallas) Britt. derived its water primarily from groundwater, but the other three species (Juniperus osteosperma (Torr.) Little, Pinus edulis Engelm., and Artemisia tridentate Nutt.) utilized precipitation and groundwater [8]. Xu et al. found that Abies fargesii Franch. Var. faxoniana (Rehder et E. H. Wilson) Tang S. Liu depends primarily and consistently on groundwater, while Betula utilis D. Don and Bashania fangiana (A. Camus) Keng f. prefer using rainwater, but always automatically convert to groundwater as the main source under water stressed conditions [9]. Rossatto et al. found that, in response to the groundwater level, vegetation at higher elevations extracted water from both shallow and deep soil layers and plants only rely on more superficial water at lower elevations [10]. Schwinning et al. found that all three of the species they examined (Oryzopsis hymenoides, Gutierrezia sarothrae, and Ceratoides lanata) took up deeper soil water under drought conditions and shallow soil water after a heavy rainfall event in summer in a cold desert ecosystem (Colorado Plateau) [11]. At a study site in the hyperarid Namib Desert, where mean annual precipitation is less than 12 mm, all of the trees are reliant on shallow soil water and groundwater from flood water infiltration [12]. In addition, fog water, karst water, and spring water can also be important supplementary water sources for plants [13,14,15,16]. The seasonality of precipitation patterns shapes species dynamics [17,18]. A series of studies have used δD and δ18O to confirm seasonal shifts (dry/wet season) in water sources for plant growth [9,19,20,21,22]. Understanding the role of spatial and temporal variation in precipitation patterns on plant water use strategy is critical for accurately predicting the effects of climate change on terrestrial ecosystems worldwide, including this case study. However, on the national level, research into these questions has been not been comprehensive and systematic.
China is located in the East Asian monsoon climate zone, where precipitation has an uneven spatial and seasonal distribution [23]. Different environments have diverse precipitation patterns that are affected by many factors, such as elevation, latitude, and temperature. The 200 mm, 400 mm, and 800 mm precipitation isohyets divide the country into four regions: arid, semi-arid, semi-humid, and humid [24,25,26]. Regional divisions can help when examining the effects of spatial patterns of precipitation on plant water use strategies. Recently, hydrogen and oxygen stable isotope ratios of water within plants have been used to provide new information on vegetation water use strategies under natural conditions. In this study, plant xylem water stable isotope (δD and δ18O) information from 93 published papers was examined. These papers were identified from the China National Knowledge Infrastructure (CNKI), Wanfang Data Knowledge Service Platform, and Web of Science databases. The references selected comprehensively and authentically cover the water use strategies of plants in the different regions of China. They represent 368 plant species (including the same plants in different habitats or of different ages), covering 229 species studied in the wet season and 139 in the dry season. The objectives of this study were: (1) to compare patterns of δD and δ18O occurrence between precipitation, plant stem water, and soil water; (2) to identify regional and seasonal changes in the main water sources used by plants; (3) to analyze regional and seasonal changes in the contributions of the main water sources and the relationships between the main water sources and other water sources used by plants in China.
2. Materials and Methods
Rainfall data collection: the precipitation data were obtained from 2114 meteorological stations in the “Dataset of Monthly Surface Observation Values in Individual Years (1981–2010) in China” from the China Meteorological Data Service Center (CMDC) (which can be accessed at: http://data.cma.cn/en). Based on Kriging interpolation, precipitation data for China were divided into four categories: <200 mm, 200–400 mm, 400–800 mm, and >800 mm, representing arid, semi-arid, semi-humid, and humid regions, respectively. Rainwater isotope data for China were collected by the Global Network of Isotopes in Precipitation (GNIP) from International Atomic Energy Agency (IAEA/WMO, 2017). The GNIP Database can be accessed at: http://www.iaea.org/water. The hydrogen and oxygen stable isotope values for precipitation were obtained for each region in order to establish the equation of the local meteoric water line.
Plant xylem water stable isotope (δD and δ18O) data were collected from 93 published papers (listed and numbered in Appendix A except those that have been cited as references). The Chinese-language references were identified using the China National Knowledge Infrastructure (CNKI) and Wanfang Data Knowledge Service Platform databases, supported by the National Natural Science Foundation (NSFC), or state level publications such as Acta Ecologica Sinica, Journal of Applied Ecology, Journal of Natural Resources, Journal of Plant Ecology, and Scientia Silvae Sinicae. The English-language references were identified using the Web of Science. The references date from 2000 to 2017. They include papers on the analysis of plant water use strategy that mainly refer to plant water sources. After title/abstract screening and removal of duplicates, a total of 93 records remained and were included in the study; they were separated into four categories based on latitude and longitude of study area: arid region (n = 28), semi-arid region (n = 19), semi-humid region (n = 23), and humid region (n = 23).
Stable isotope analyses have been used effectively to determine the reliance of a species on shallow, middle, and deep soil water, groundwater, river water, spring water, fog water, karst water, and seawater [27,28,29,30,31]. Suberized twigs from plants and different depths of soil samples were selected for the stable isotope ratio measurements in the respective source papers. In this study, the plant potential water sources were also defined following the original definitions in the respective source papers. Groundwater was defined as a saturated region of the water. Spring water referred to deep water, but it was treated as an individual potential water source. Karst water was defined as water stored in the epikarst zone. It is difficult to compare the contribution of soil water because different papers have their own definitions of shallow soil water, middle soil water, and deep soil water. We exploit the cluster analysis method to normalize the soil classification based on variations of δ18O values for the four regions. “Minor water sources” include river water, spring water, fog water, karst water, and seawater, because they are usually not the main water sources used by vegetation and play complementary roles. Water sources used by plants were divided into five categories: shallow soil water, middle soil water, deep soil water, precipitation, groundwater and minor water sources.
The significance of groundwater receives wider attention and plants tend to take dissimilar groundwater use strategies in different regions [32]. Therefore, the contribution of groundwater deserves special consideration and we defined it as the number of samples out of a population of plant samples reported to have groundwater contributing to xylem water in each region [33].
The effects of seasonality and region were tested with factorial ANOVAs and Student’s t test. These analyses were conducted using SPSS 18.0 (International Business Machines Corporation (IBM), New York City, NY, USA). Maps were created using ArcMap 10.2 (Environmental Systems Research Institute (ESRI), Redlands, CA, USA).
3. Results and Discussion
3.1. The Relationship between δD and δ18O
3.1.1. Meteoric Water Line
In theory, variations in δ18O and δD under equilibrium fractionation conditions can be described using the equation for the global meteoric water line, which has a slope of 8 (Global Meteoric Water Line (GMWL) δD = 8 δ18O + 10) [2]. The slope for specific conditions depends upon factors like the humidity, the temperature, the wind speed, and the turbulence in the water. The intercept (=deuterium excess) of the precipitation line at the source area reflects the rate of evaporation [5], to some degree, representing the climate and regional characteristics. It can also provide a reference for inferring plant water sources. Zheng et al. first used the least squares method to establish the Chinese meteoric water line (δD = 7.9 δ18O + 8.2) in 1983 [34]. The slope is close to 8. While China is a vast country with complex terrain, all rainfall cannot be expected to lie along the Global Meteoric Water Line, and regional or local meteoric water lines are required that can represent the real natural conditions. Here we used data from the CMDC and GNIP Database to determine the regional meteoric water line equations for four regions of China (Table 1): the arid region (δD = 6.231 δ18O − 0.458), semi-arid region (δD = 7.283 δ18O − 1.457), semi-humid region (δD = 7.652 δ18O + 5.34), and humid region (δD = 8.067 δ18O + 12.304). The continental effect, seasonal effect, as well as particular geographical location influences the slope.
The arid and semi-arid regions are located in northwestern China and in the hinterland of the Eurasian continent and are affected by a cold northwesterly airflow in winter. Airflow from the southwestern Indian Ocean is blocked by the Qinghai-Tibet Plateau in summer. This means that there is little annual precipitation and intense evaporation, which results in a local meteoric water line with a lower slope, and a more negative intercept. Compared with the semi-arid region, the slope of the equation for the arid region deviates greatly from the normal value (Table 1). Based on the Chinese Network of Isotopes in Precipitation, the study by Liu et al. showed that raindrops suffered re-evaporation whilst falling, and the precipitation vapor was mixed with some local recycled water vapor in Northwest China (local meteoric water line (LMWL), δD = 7.05 δ18O − 2.17, n = 50) [35]. Other studies suggest a slope range from 6.01 to 7.56 [36,37,38,39] for the arid and semi-arid regions of China. The humid and semi-humid regions are affected by an eastern monsoon climate and controlled by high-pressure over Siberia, with strong cold air activity and less precipitation in winter, then with the warm moist air of the Pacific bringing abundant rainfall in summer [40]. Because of an obvious continental effect, the slopes of the meteoric water lines for the humid and semi-humid regions are higher than elsewhere and are in the range of 7.6 to 8. Specifically, the slope for the humid region is 8.02, which is slightly higher than in the GMWL. Also, there are some similar results from previous research. For example, Zhang et al. established a local meteoric water line for Southwest China (δD = 7.99 δ18O + 7.46, r2 = 0.99, n = 70) [41]; Wu et al. established a LMWL for Sichuan Province (δD = 7.96 δ18O + 8.67, r2 = 0.97, n = 68) [42]; and Liu et al. established a LMWL for Yunnan Province (δD = 7.53 δ18O + 1.42, r2 = 0.97, n = 92) [43]. There is a trend in that heavy isotopes in precipitation are gradually depleted from coast to inland regions [40].
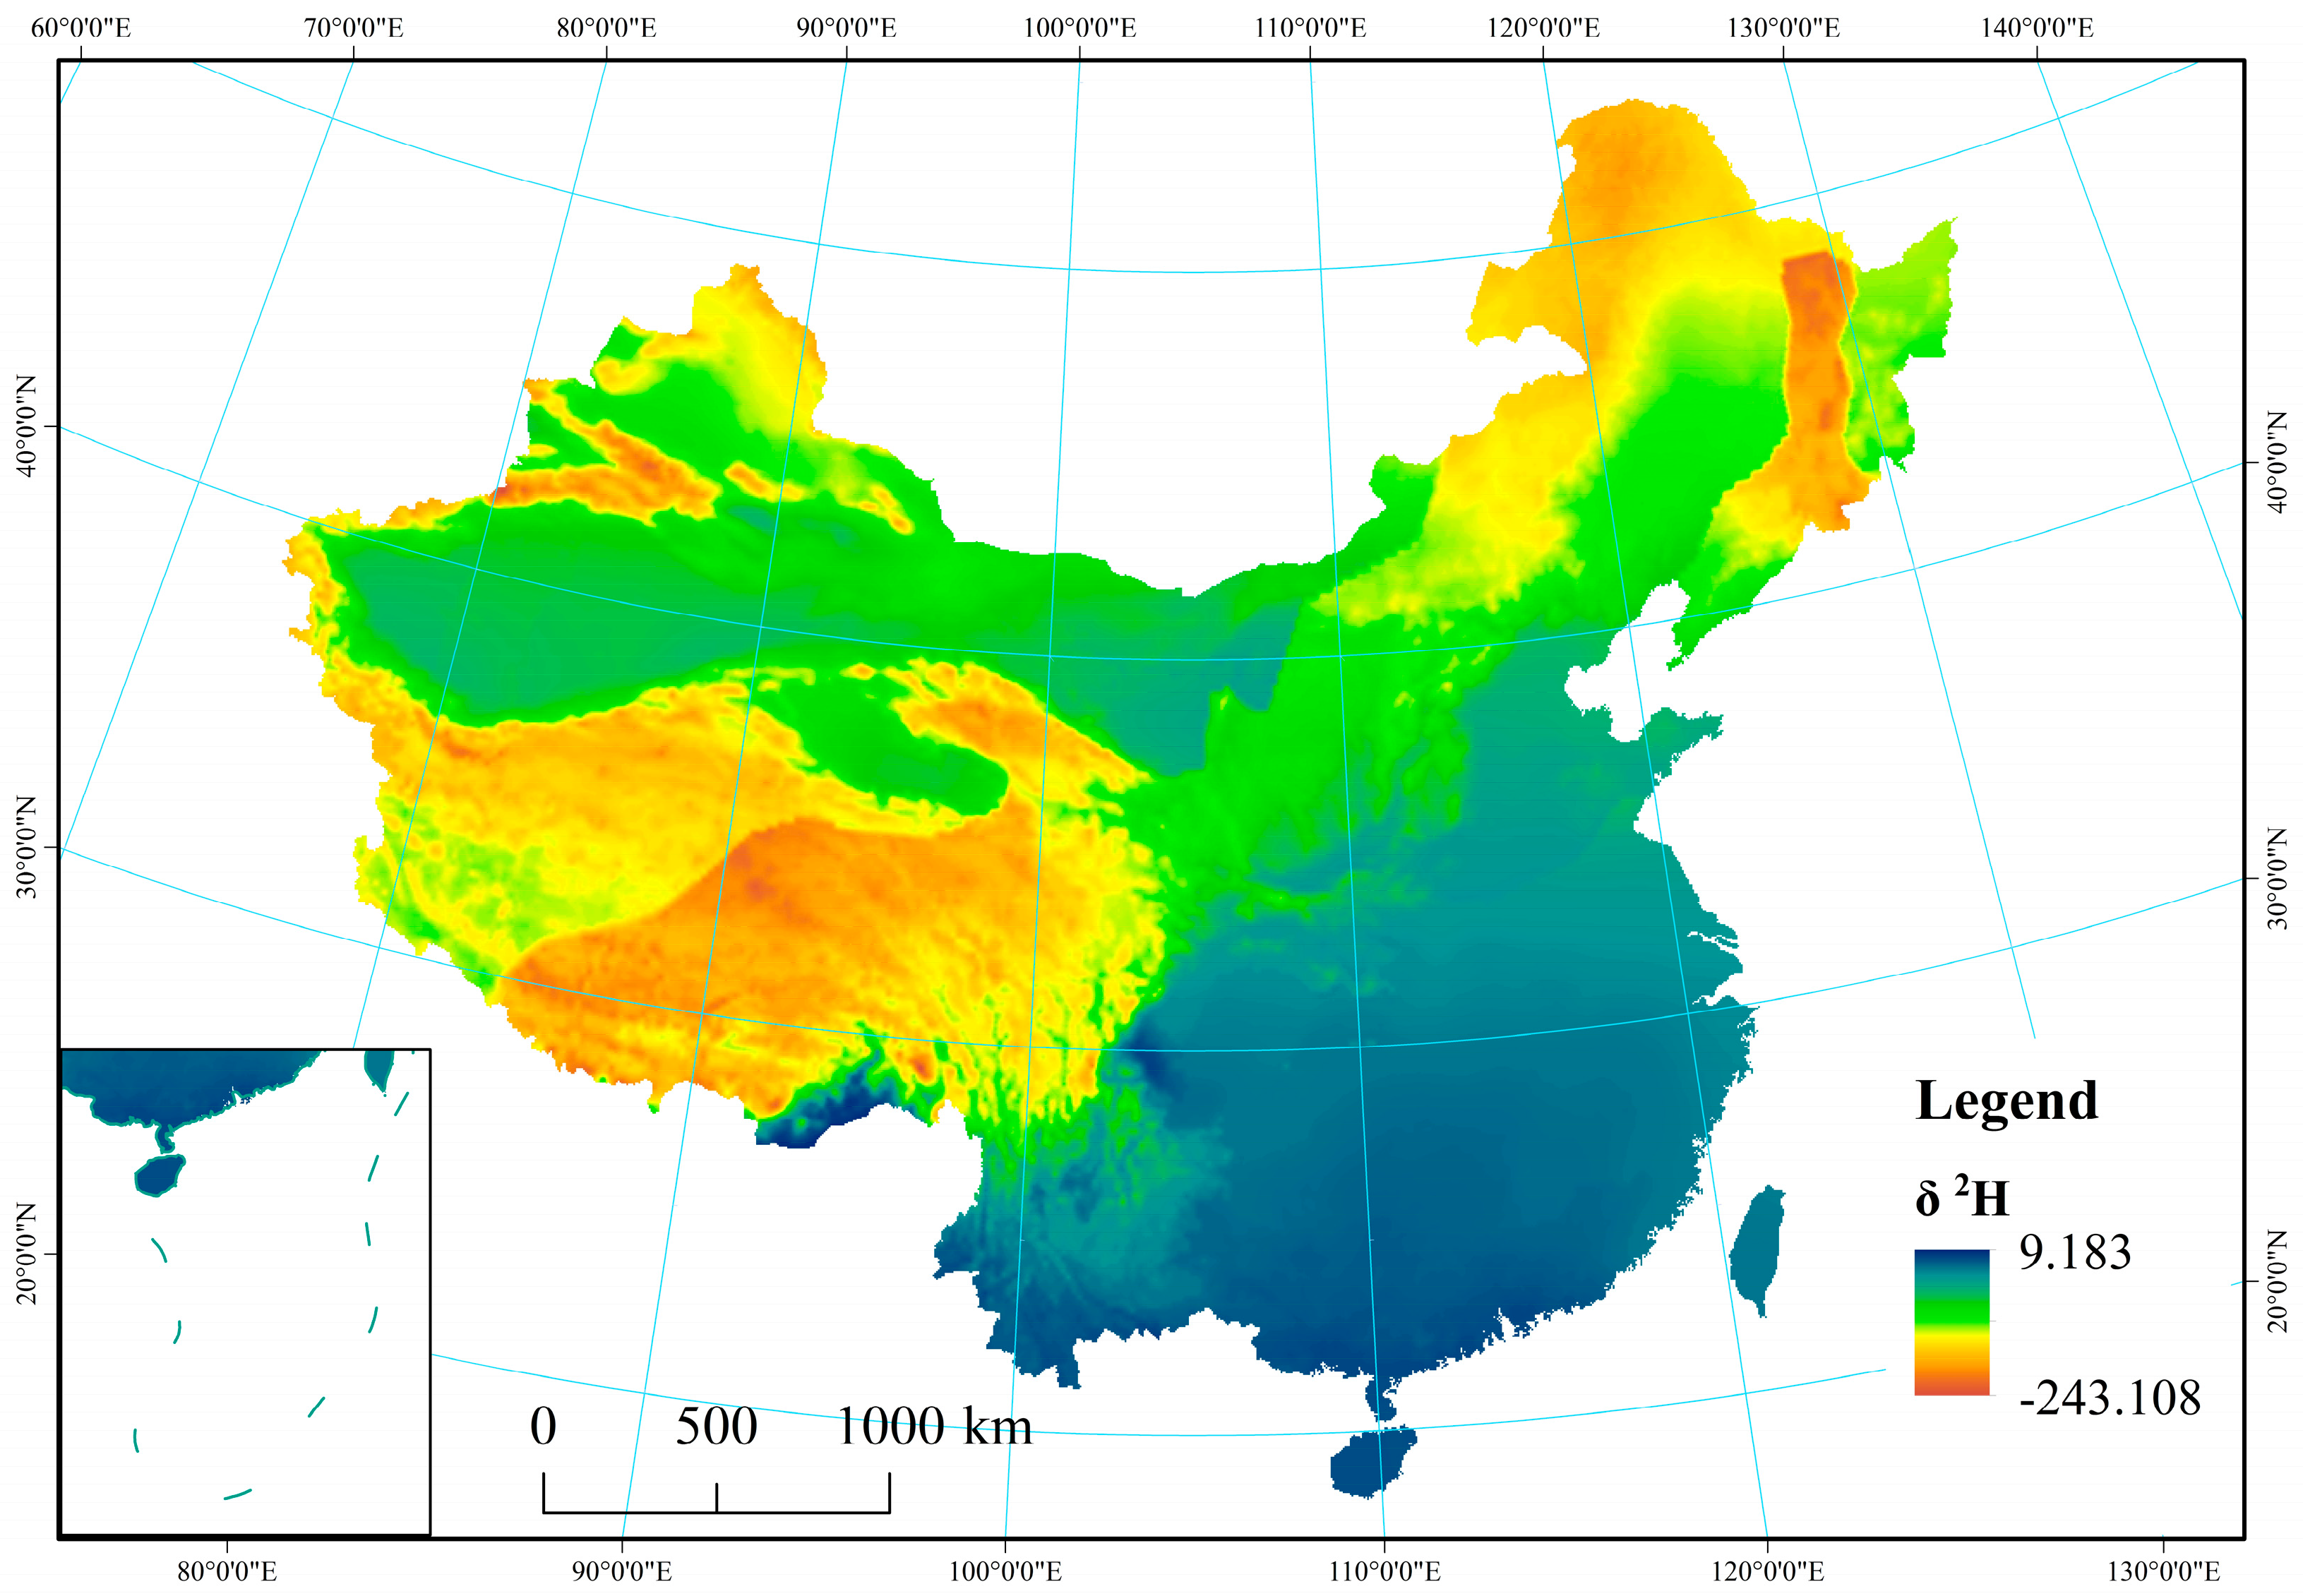
From the arid, semi-arid, semi-humid, and humid regions, average values for δ18O and δD in precipitation were observed to vary from −22.75‰ and −19.94‰, −16.37‰ and −6.77‰, −173.60‰ and −146.66‰, and −119.92‰ and −42.29‰, respectively. The results showed that δ18O and δD values for precipitation were reduced with increasing distance from the ocean. In particular, stable isotopes (δD and δ18O) on the Tibetan Plateau exhibited the lowest values (−243.11‰ for δD and −32.51‰ for δ18O), while values were highest in the humid region (−6.81‰ for δD and 0.19‰ for δ18O) because of latitude and elevation effects (Appendix B Figure A1 and Figure A2). Tian et al. found that δ18O in precipitation at Xixiabangma on the Tibetan Plateau showed an obvious altitude effect [44]. Liu et al. established a model of the quantitative relationship between δ18O in precipitation and latitude and altitude (δ18Oppt = − 0.0176 LAT2 + 1.1195 LAT − 0.0016 ALT − 23.7553) [45].
3.1.2. Plant Stem Water Line
Plants take up water from the soil, and soil water is recharged by rainfall. δD and δ18O values of plant stem water tend to differ according to water source acquisition across the soil-plant-atmosphere continuum because there is no isotopic fractionation during water uptake by terrestrial plants except for salt-excluding plant species [46,47].
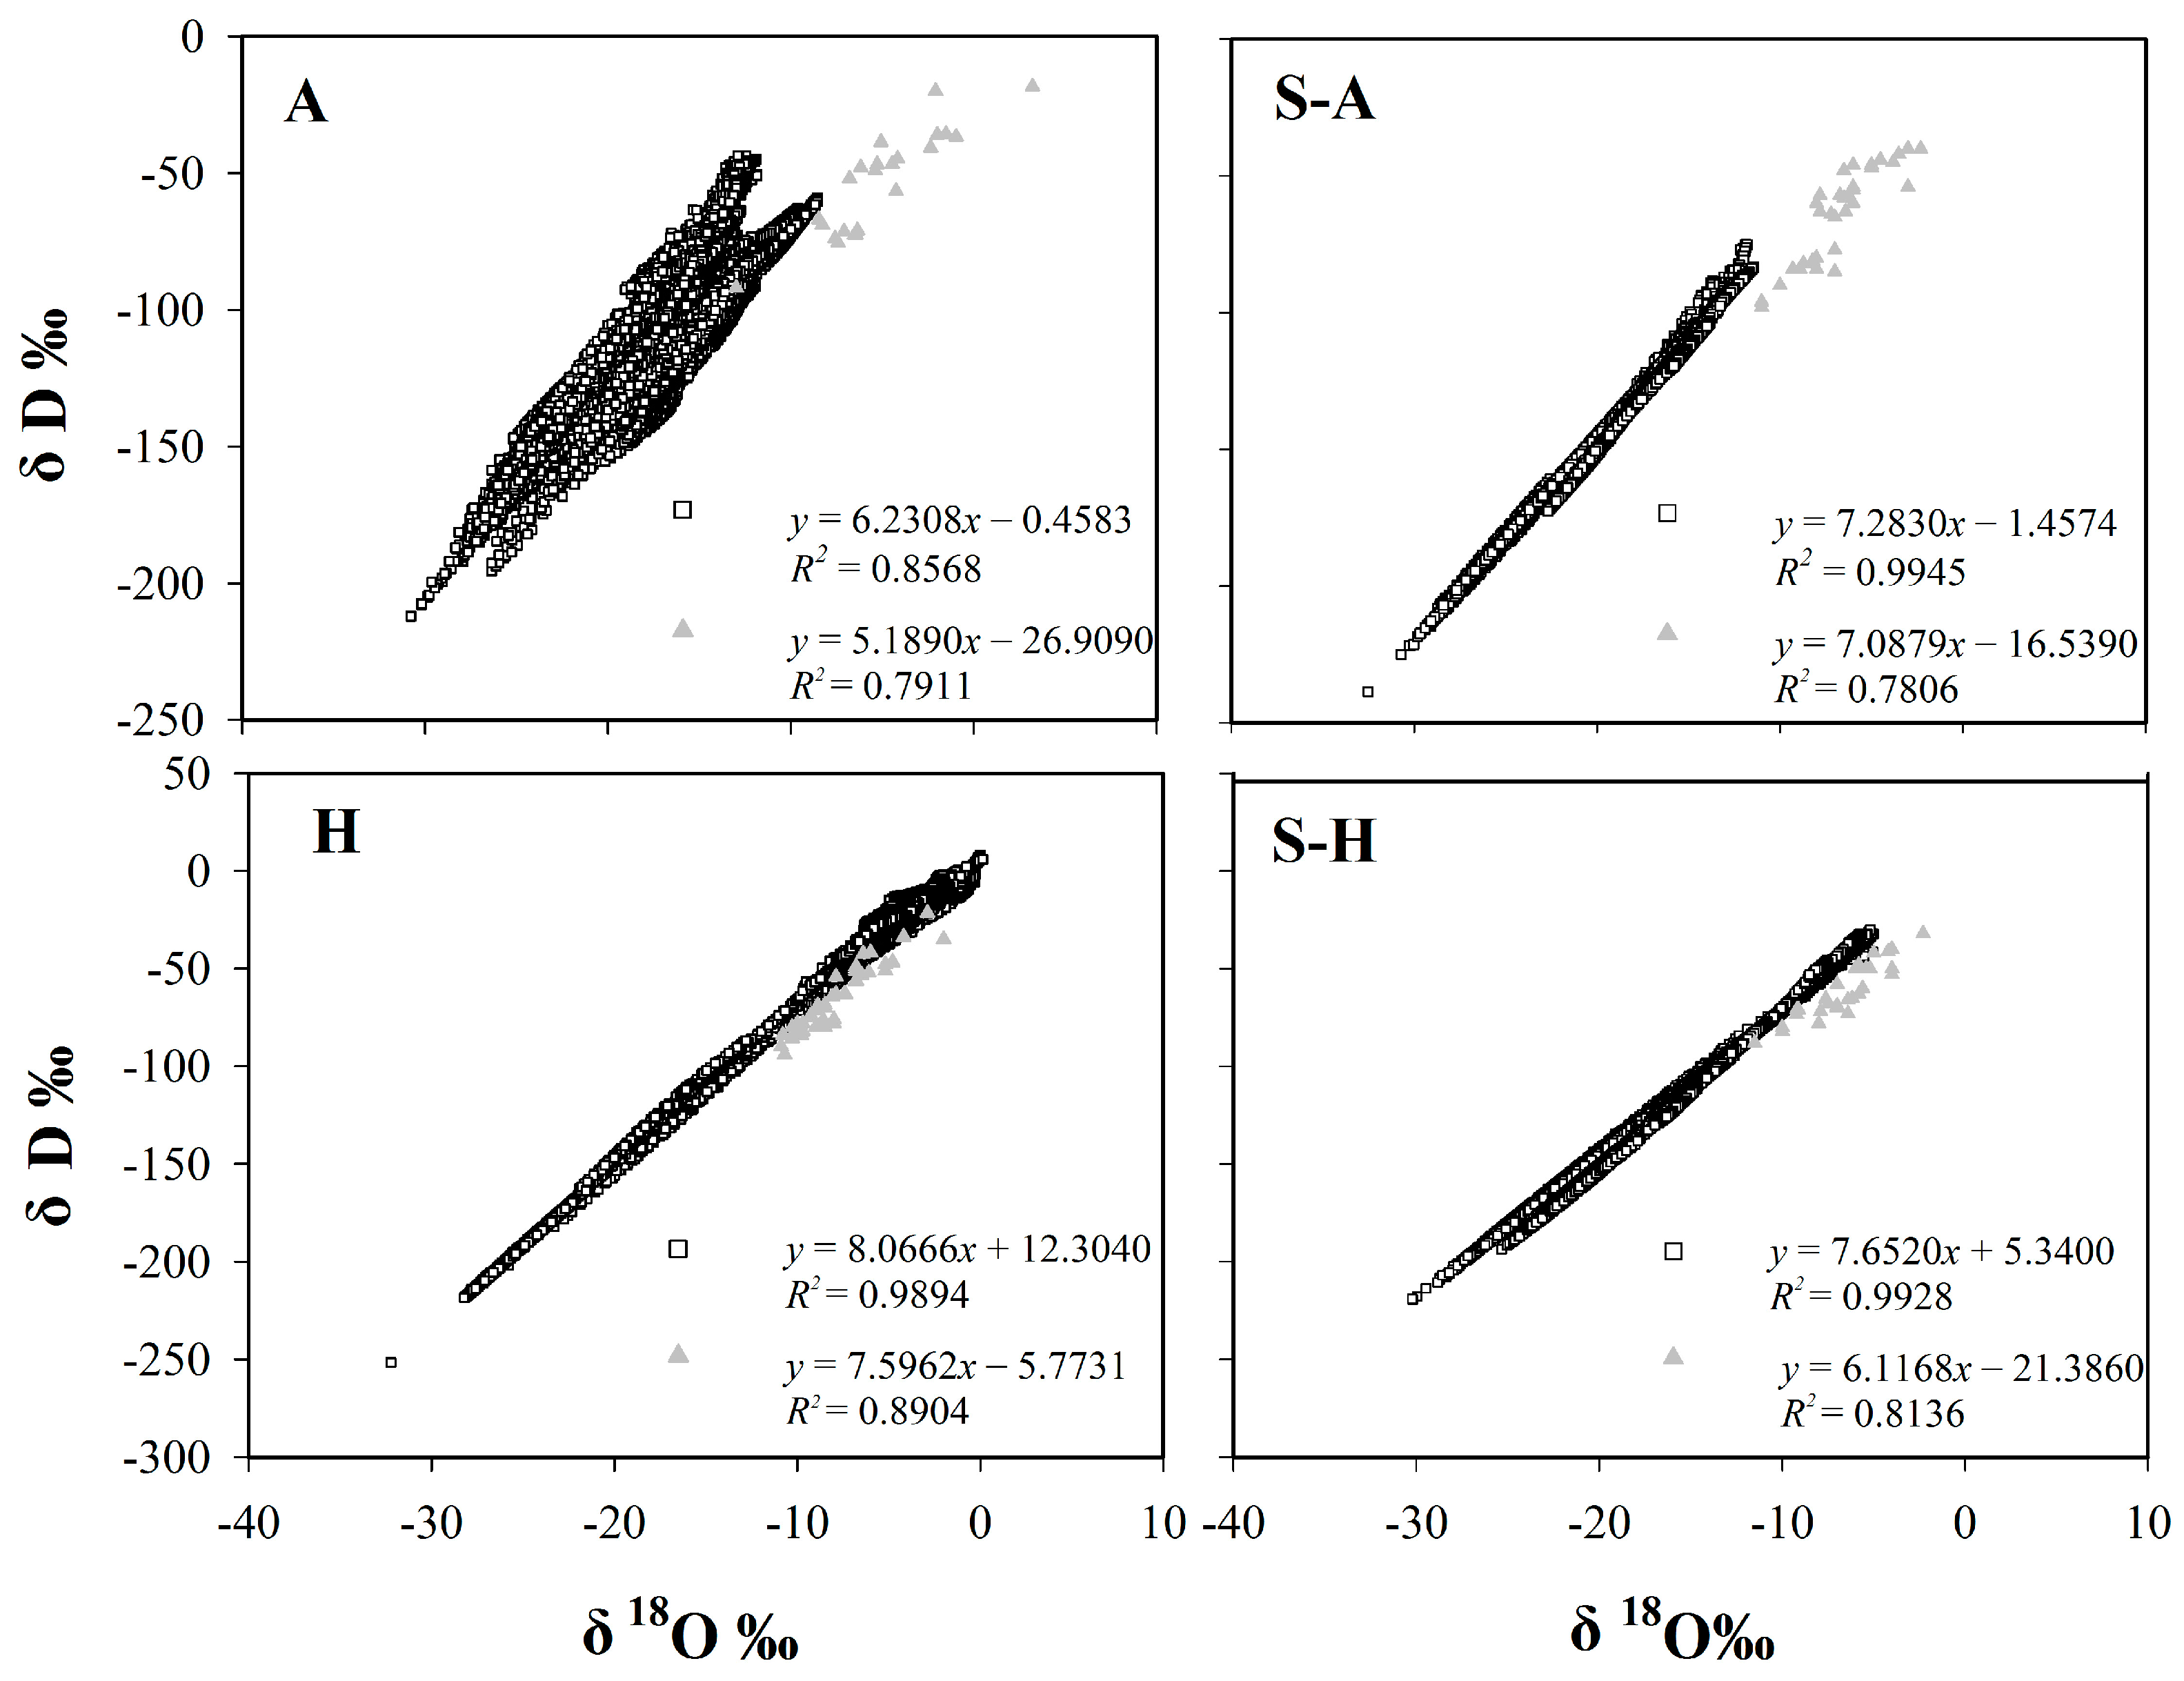
The range of isotopic values (δD and δ18O) in precipitation is greater than in the stem water in vegetation (Table 1) because the range of soil water is reduced by the mixing of precipitation water. The plant study sites are relatively scattered, and the meteorological station that collected rainfall data can be difficult to accurately match to study sites. In general, δD and δ18O values for plant stem water are relatively large and are mainly distributed in the upper part of the isotopic values for precipitation due to evaporation affecting both rain and the soil surface (Figure 1).
The study found that the correlation between δD and δ18O in plant stem water is well established for the four regions of China: the arid region (δD = 5.1890 δ18O − 26.909), semi-arid region (δD = 7.0879 δ18O − 16.539), semi-humid region (δD = 6.1168 δ18O − 21.386), and humid region (δD = 7.5962 δ18O − 5.7731) (Figure 1). The results of Least Significant Difference (LSD) tests showed that δD differs between the arid region and the other regions (p < 0.05). As for δ18O, there is also a significant difference between the arid region and the other regions (p < 0.01). The results are because of severe evaporation in the arid region. In general, the slope of the Plant Stem Water Line (PSWL) increases gradually from the arid region, to the semi-humid region, to the semi-arid region, to the humid region. Notably, the slope for the semi-humid region was less steep than that for the semi-arid region, which may be related to water sources accessed by plants.
3.1.3. Soil Water Line
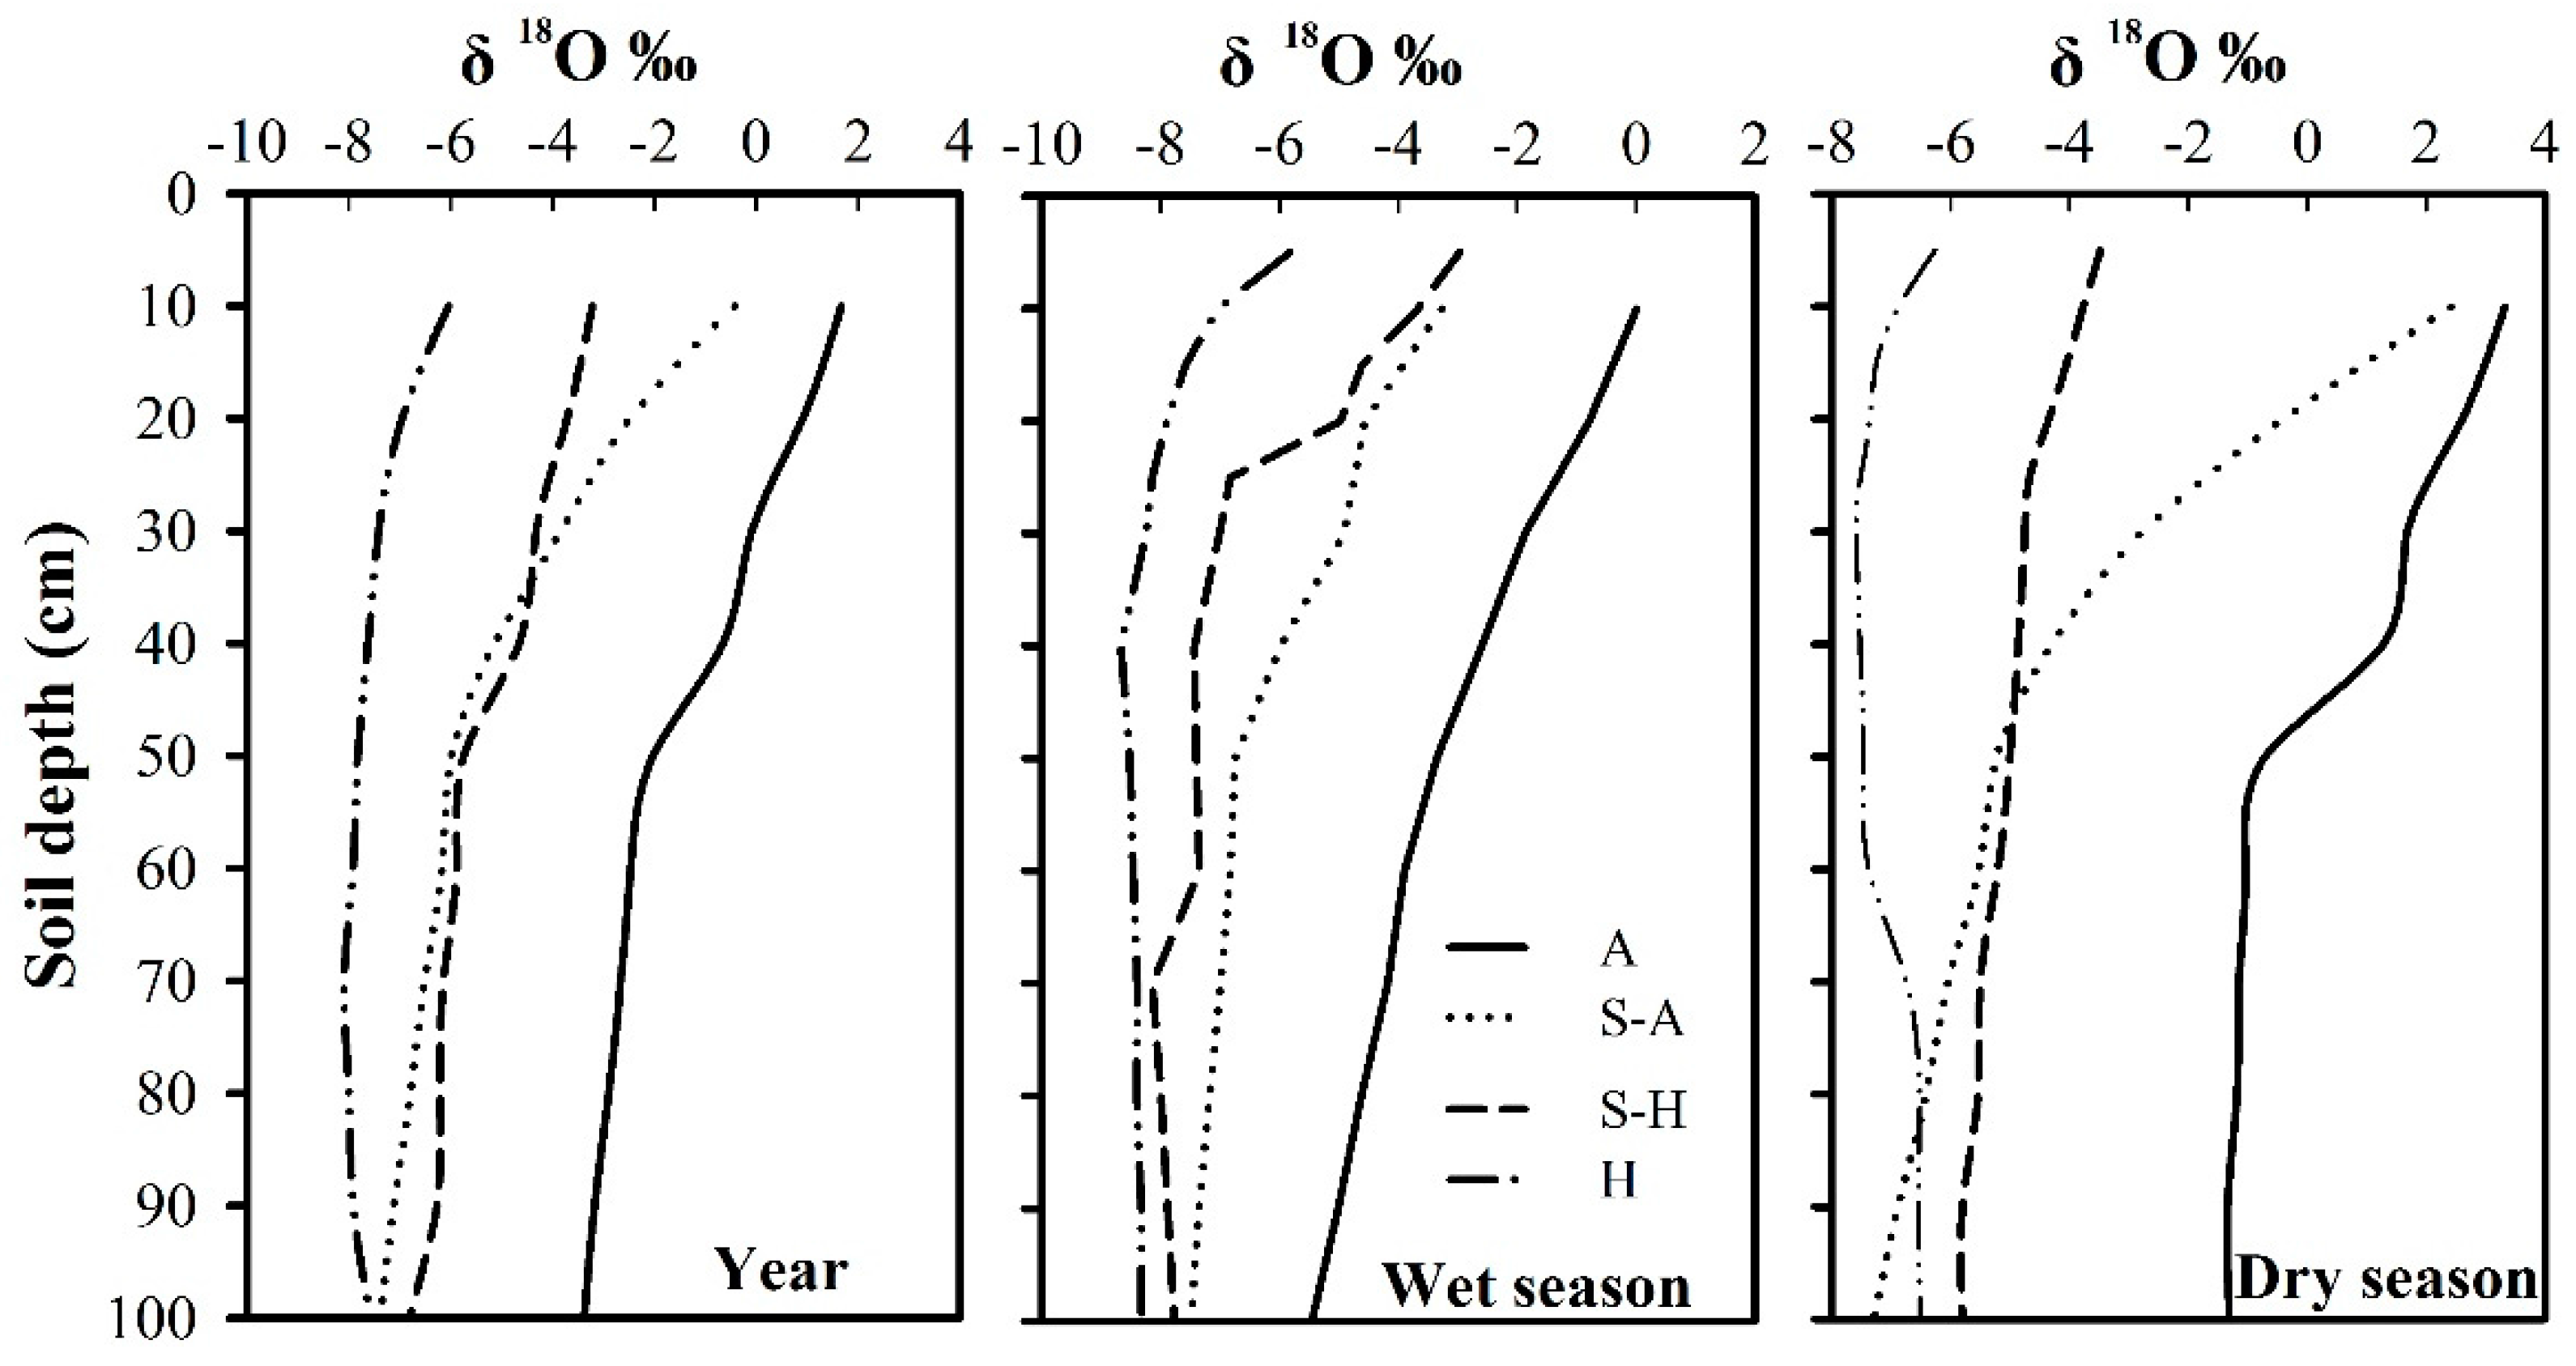
The δ18O values by depth (0–100 cm) varied with time (Figure 2). In the top 20 cm of the soil profile, δ18O showed a high variation for all regions (p < 0.05), and the coefficients of variation were −0.10, −0.10, −1.00, and 0.41 for the humid region, semi-humid region, semi-arid region, and arid region, respectively, due to the combined impact of summer precipitation and soil evaporation. There was also an increasing trend during the year, with average δ18O values of −6.50‰, −3.47‰, −1.45‰, and −1.29‰, respectively. At a depth of 20–80 cm, δ18O had relatively low values compared with the top soil layer (0–20 cm) and the coefficients of variation were −0.03, −0.12, −0.16, and −0.39, respectively, for the four regions. The values remained relatively constant in deep soil layers (below 80 cm), with coefficients of variation of −0.03, −0.06, −0.03, and −0.04, respectively, for the four regions. The δ18O values varied greatly with the seasons, ranging from −8.68‰ to 0.01‰ in the wet season, and from −7.59‰ to 3.33‰ in the dry season. Average isotopic values in the arid region were at the highest level, ranging from −3.18‰ (in the wet season) to 0.22‰ (in the dry season). Average isotopic values in the semi-arid region and the semi-humid region were intermediate, varying from −6.14‰ (in the wet season) to −4.24‰ (in the dry season) in the semi-arid region and from −6.47‰ (in the wet season) to −4.83‰ (in the dry season) in the semi-humid region. Average isotopic values in the humid region were at the lowest level, ranging from −7.80‰ (in the wet season) to −7.04‰ (in the dry season). Owing to high evaporative demand, precipitation during the dry season freely evaporated from the soil surface, bringing about decreased infiltration and shallower soil water penetration, which was short-lived, especially in the arid region.
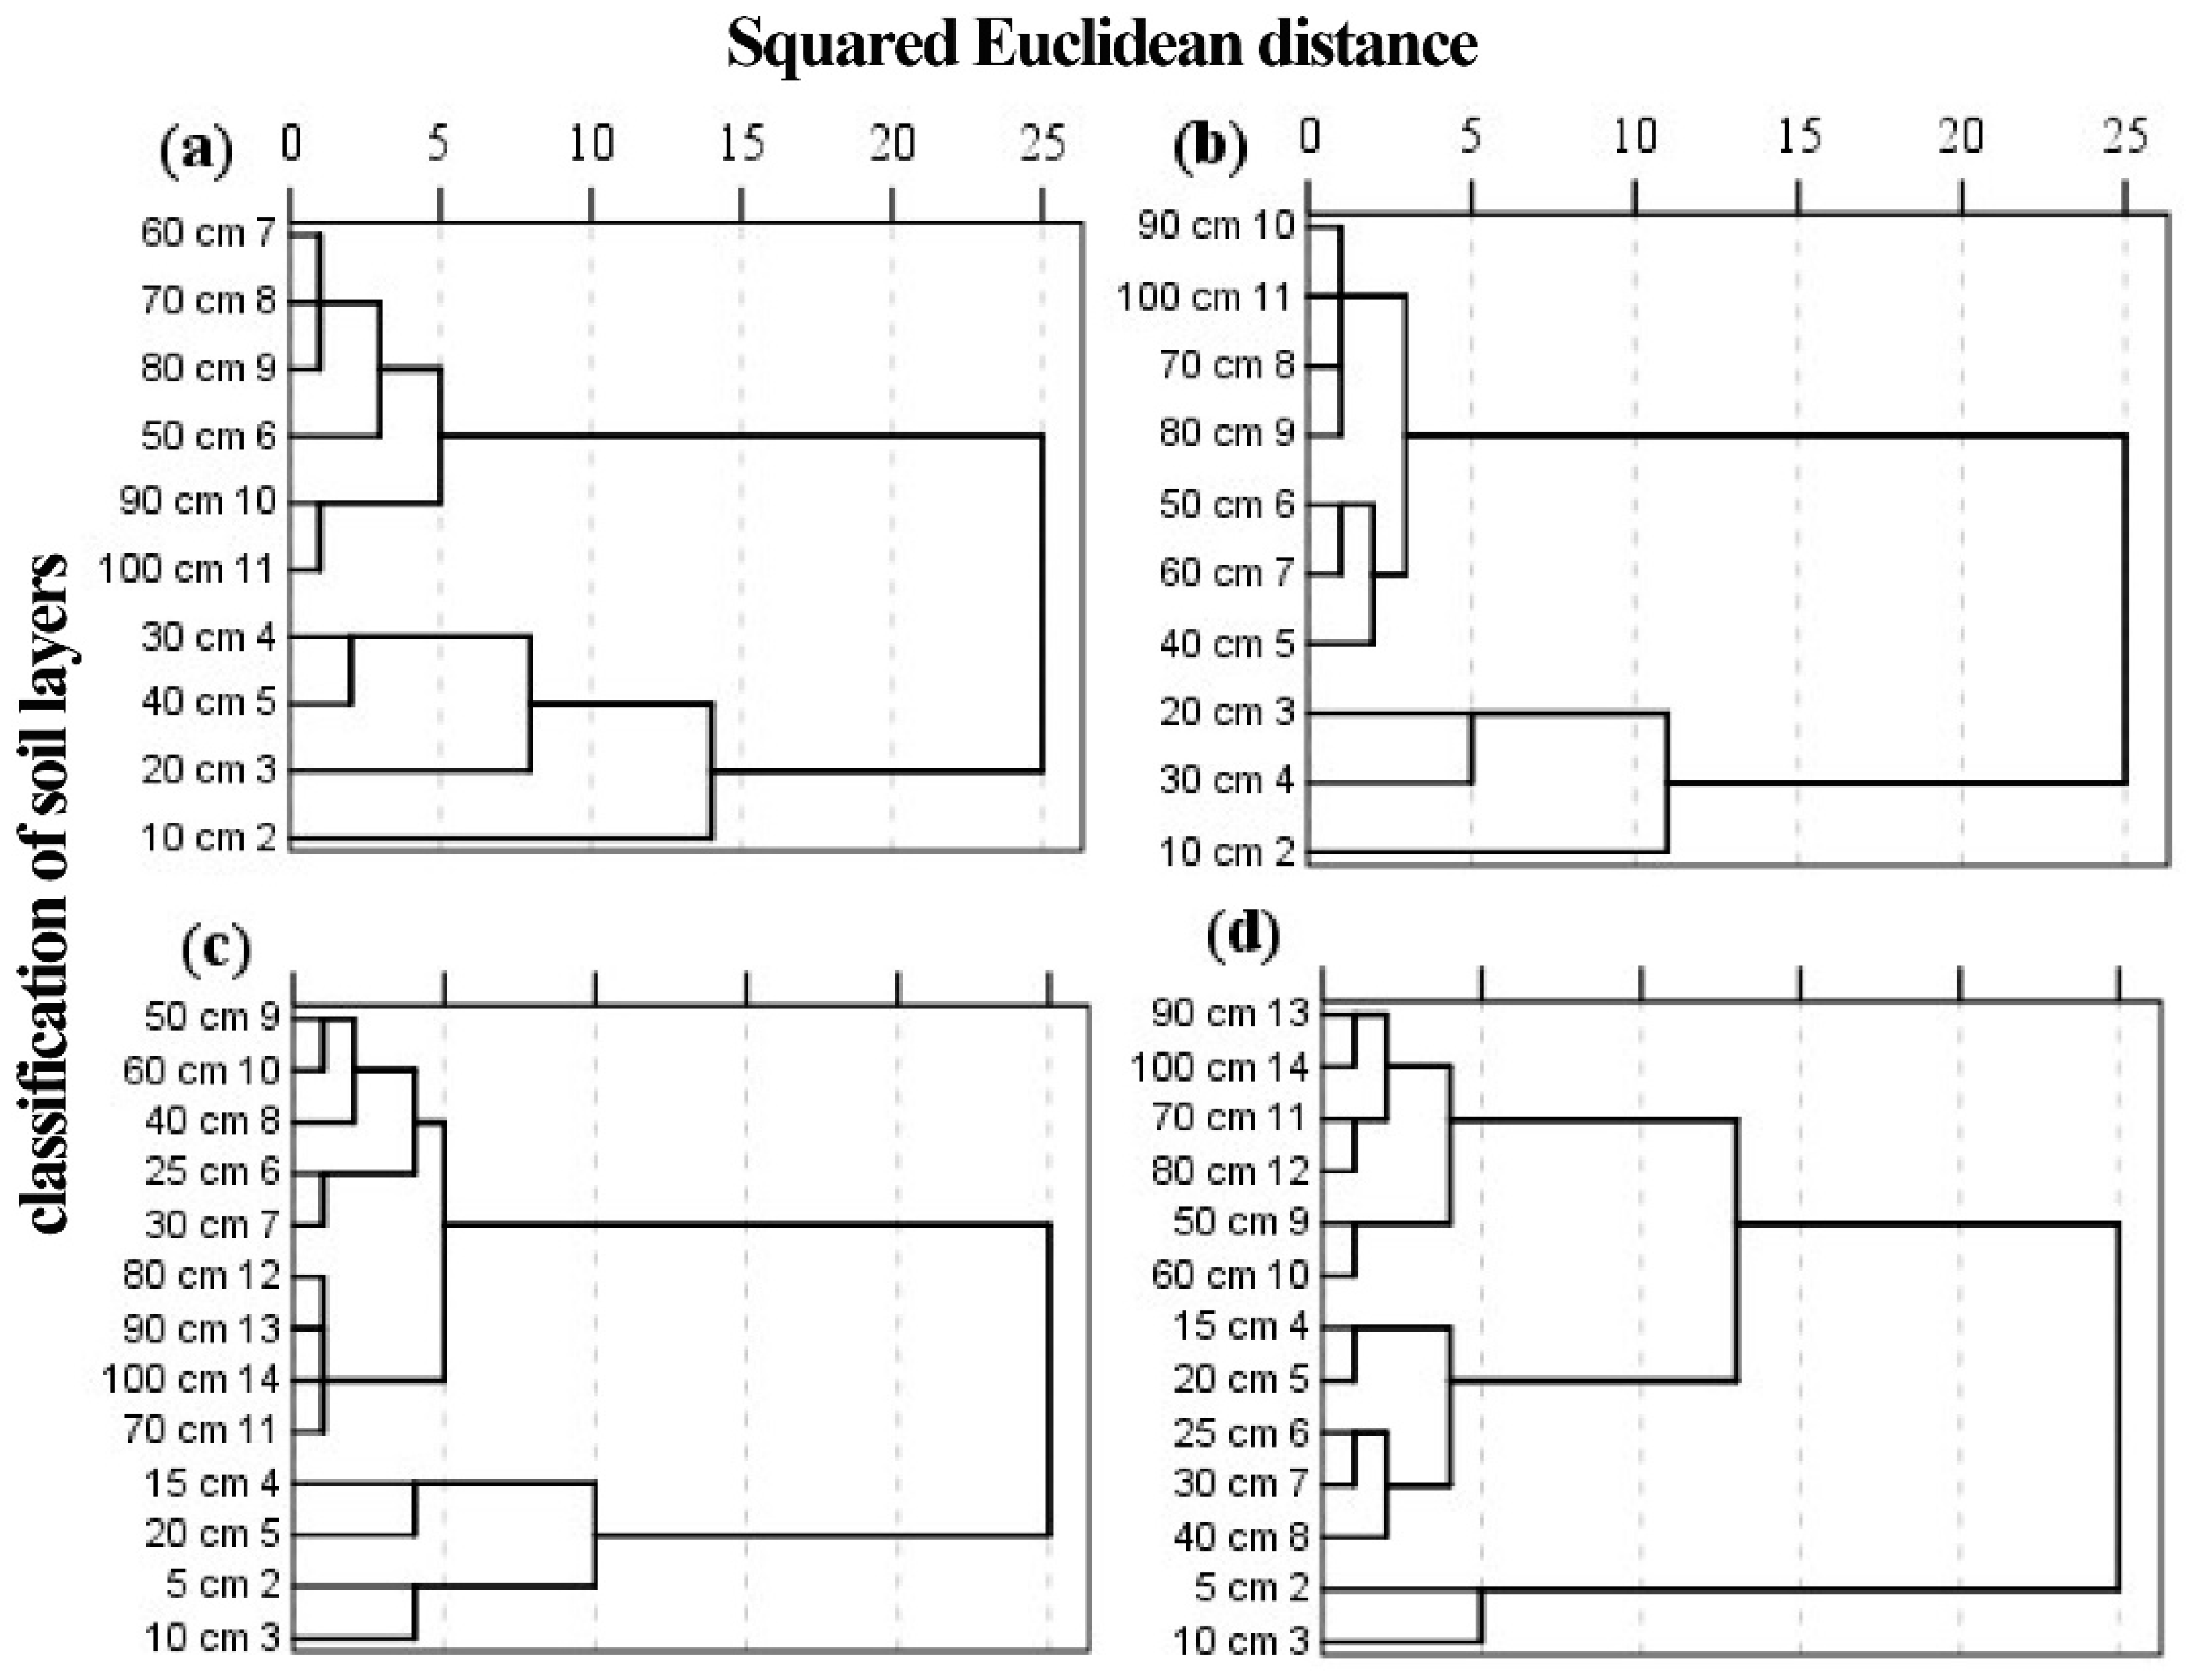
There was obvious change in δ18O values with depth. In general, shallow soil water was the most unstable zone and the δ18O values had high variation; the middle soil water had lower δ18O values than the shallow soil water and limited changes with depth; the deep soil water had relatively stable δ18O values within the soil profile. Soil water needed to be classified into different layers for effective analysis of any variations. Cluster analysis can provide preliminary soil groupings based upon the squared Euclidean distance. The variations of δ18O values make each soil layer (0–100 cm) produce different squared Euclidean distances so that they were clustered into different groups. For example (Figure 3a), when the squared Euclidean distance is equal to 5, the soil layers were divided into five groups: 10 cm, 20 cm, 30–40 cm, 50–80 cm, and 90–100 cm. By analogy, when the squared Euclidean distance is equal to 10, the soil layers were divided into three layers: 10 cm, 20–40 cm, and 50–100 cm. Intense evaporation made the classification of data for the soil surface fragmented. A series of studies were conducted on a small scale and provided references for soil classification [13,25,48,49,50,51,52,53,54,55,56,57]. Combing previous studies and the results of cluster analysis allowed for valid and reliable soil classification (Table 2).
In the arid region, soil water could be divided into three layers: shallow soil water (0–40 cm), middle soil water (40–100 cm), and deep soil water (>100 cm). In the semi-arid region, it was divided into: shallow soil water (0–30 cm), middle soil water (30–60 cm), and deep soil water (>60 cm). In the semi-humid region, the classification was shallow soil water (0–20 cm), middle soil water (20–60 cm), and deep soil water (>60 cm). There are some specific formations that create different conditions, for example, Karst areas are found in the humid region and are characterized by shallow soils and exposed rocks with poor stability [58,59]. Rainfall flows underground rapidly and little infiltration occurs, which causes the loss of surface water and desiccation [60]. Karst areas is a typical shallow soil area [61] and there have been many plant water source studies undertaken there. To date, most research studies were carried out in karst areas in the humid region, so they involved relatively shallow soils, with the classification: shallow soil water (0–10 cm), middle soil water (10–40 cm), and deep soil water (>40 cm). In general, the results of soil classification were slightly different from previous studies because here we combined many published papers on a regional scale, while previous research has focused on the local scale. Our overview not only reveals variations in isotopic values of soil profiles, but also provides a standard for measuring soil water sources of different plants in the same region.
3.2. Plant Main Water Source
Water available to plants comes from precipitation, soil water, groundwater, and so on. Precipitation falling in the wet season has a markedly different effect on soil water than during the dry season. In general, precipitation in the rainy season accounts for 70–80% of annual precipitation in most of China [27,62,63,64]. The timing and magnitude of rainfall has significant implications for the water uptake of plants [6,65].
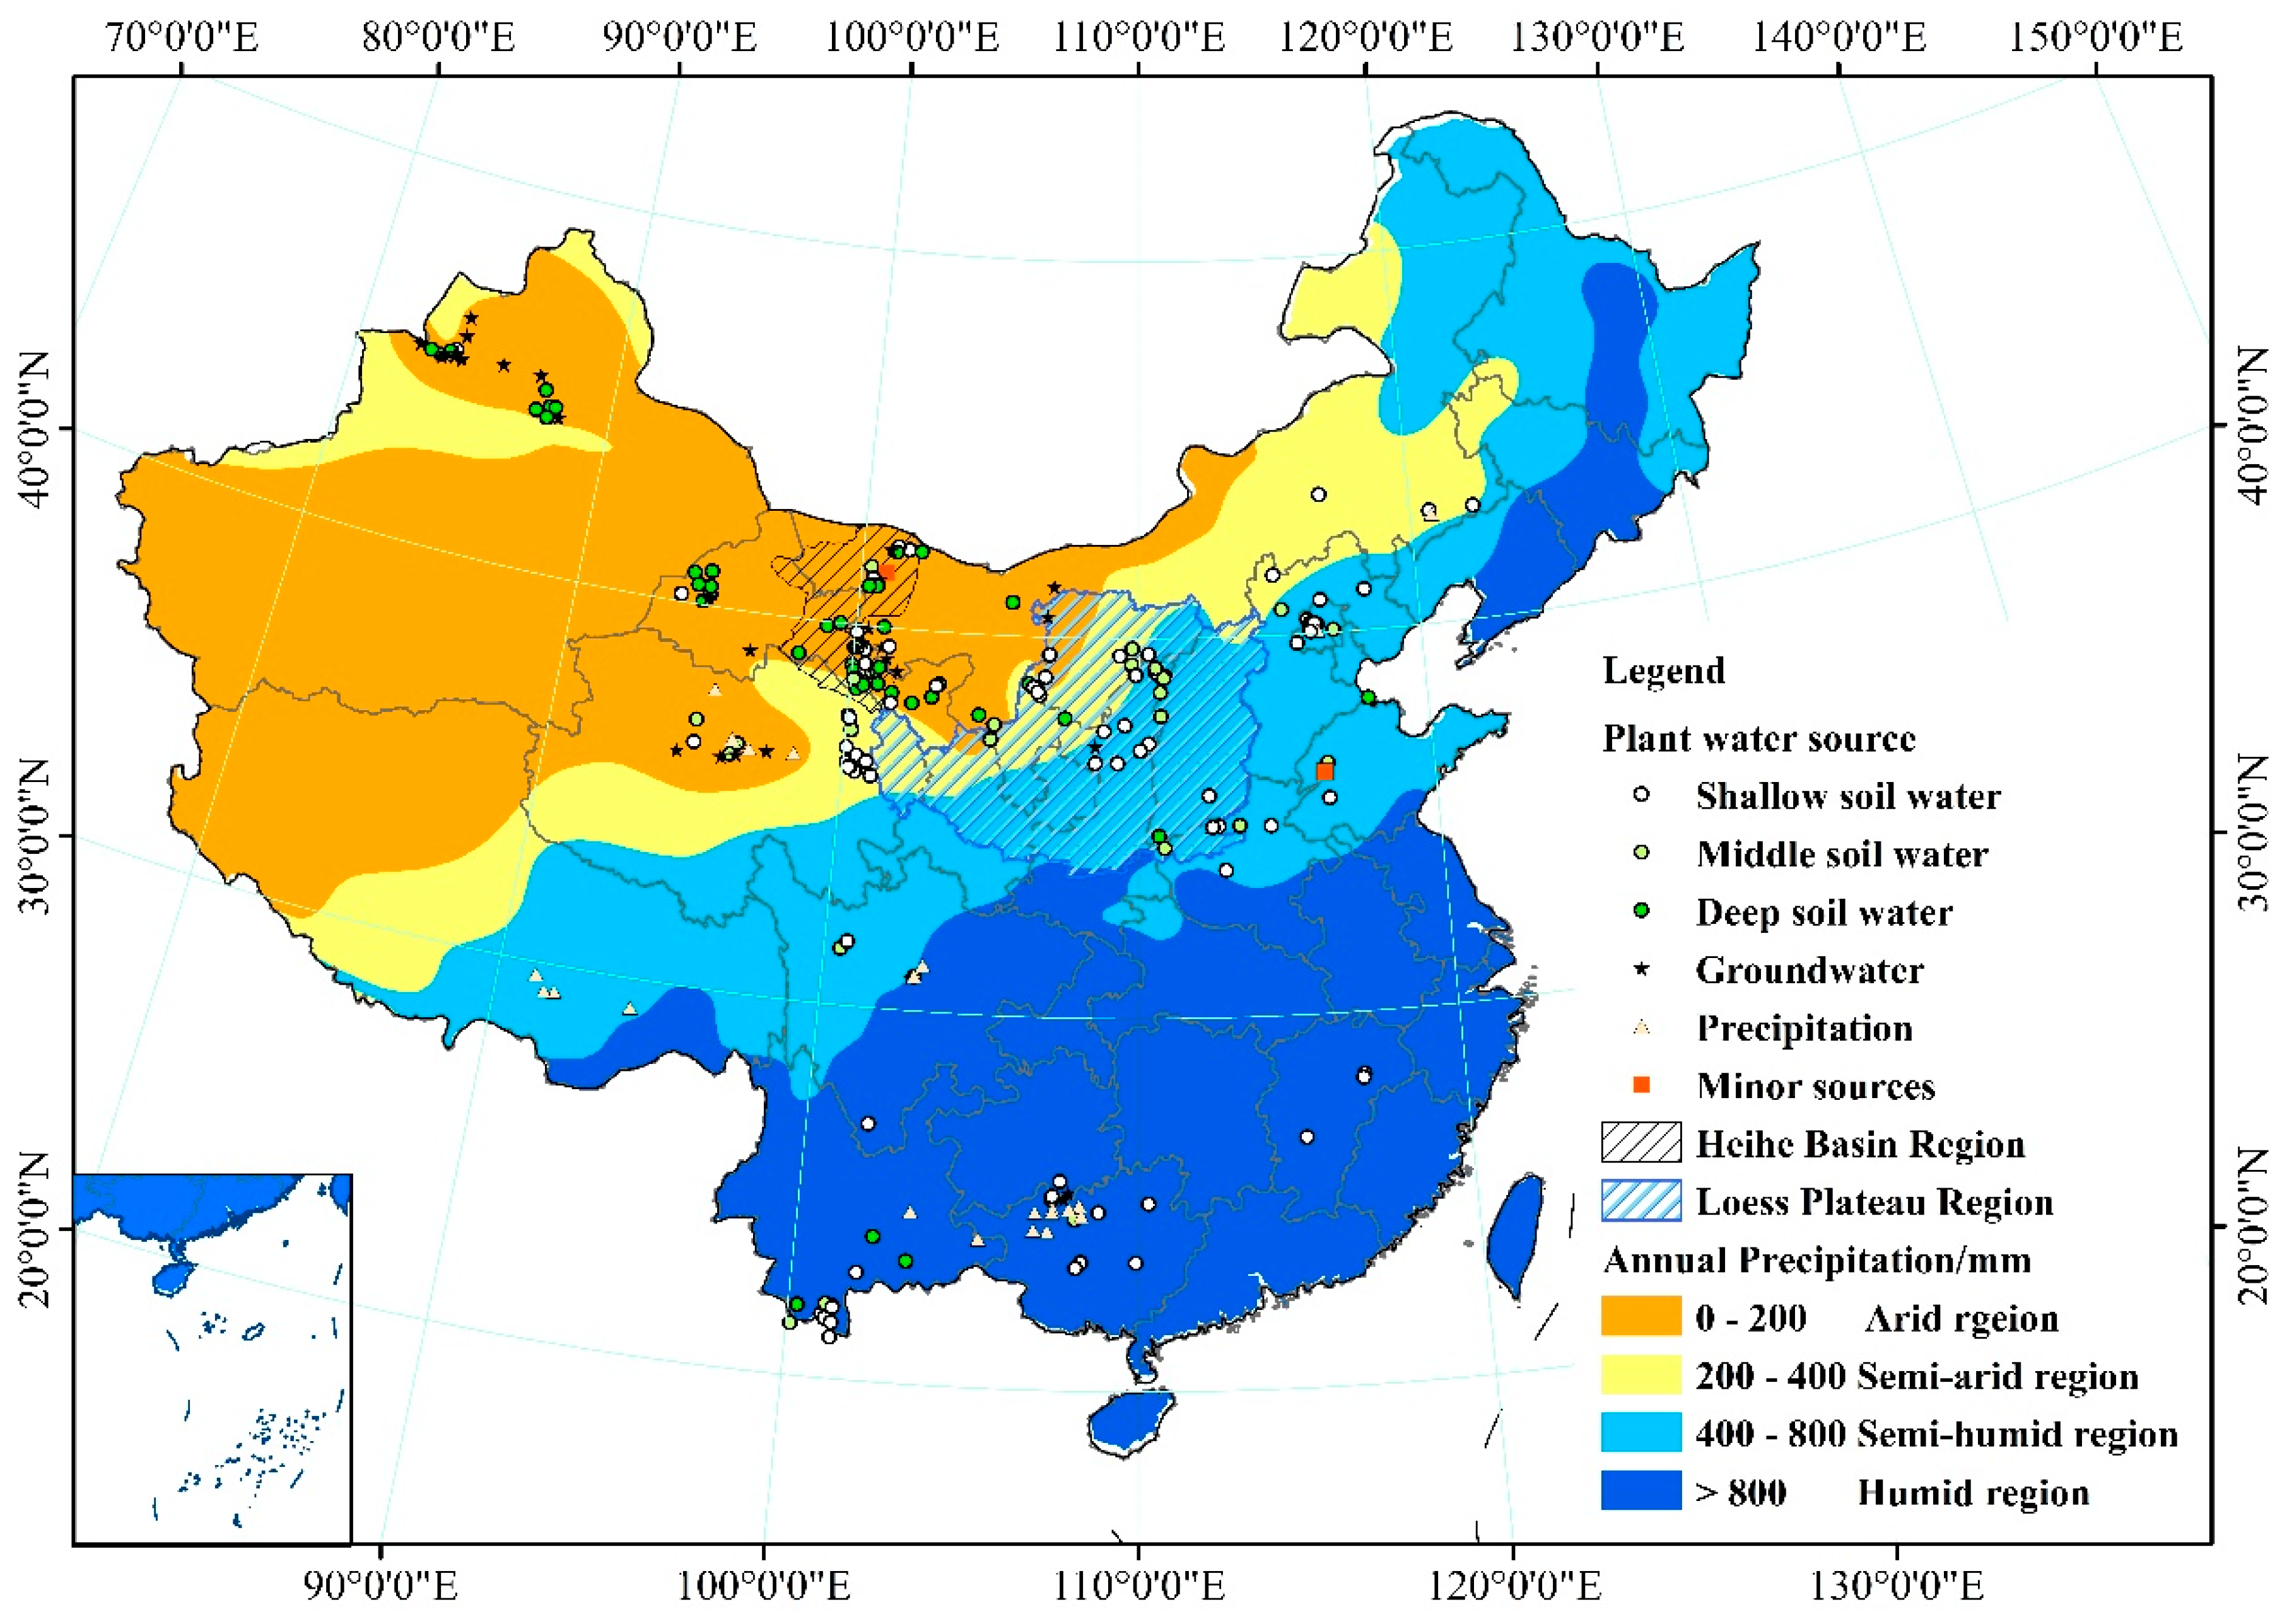
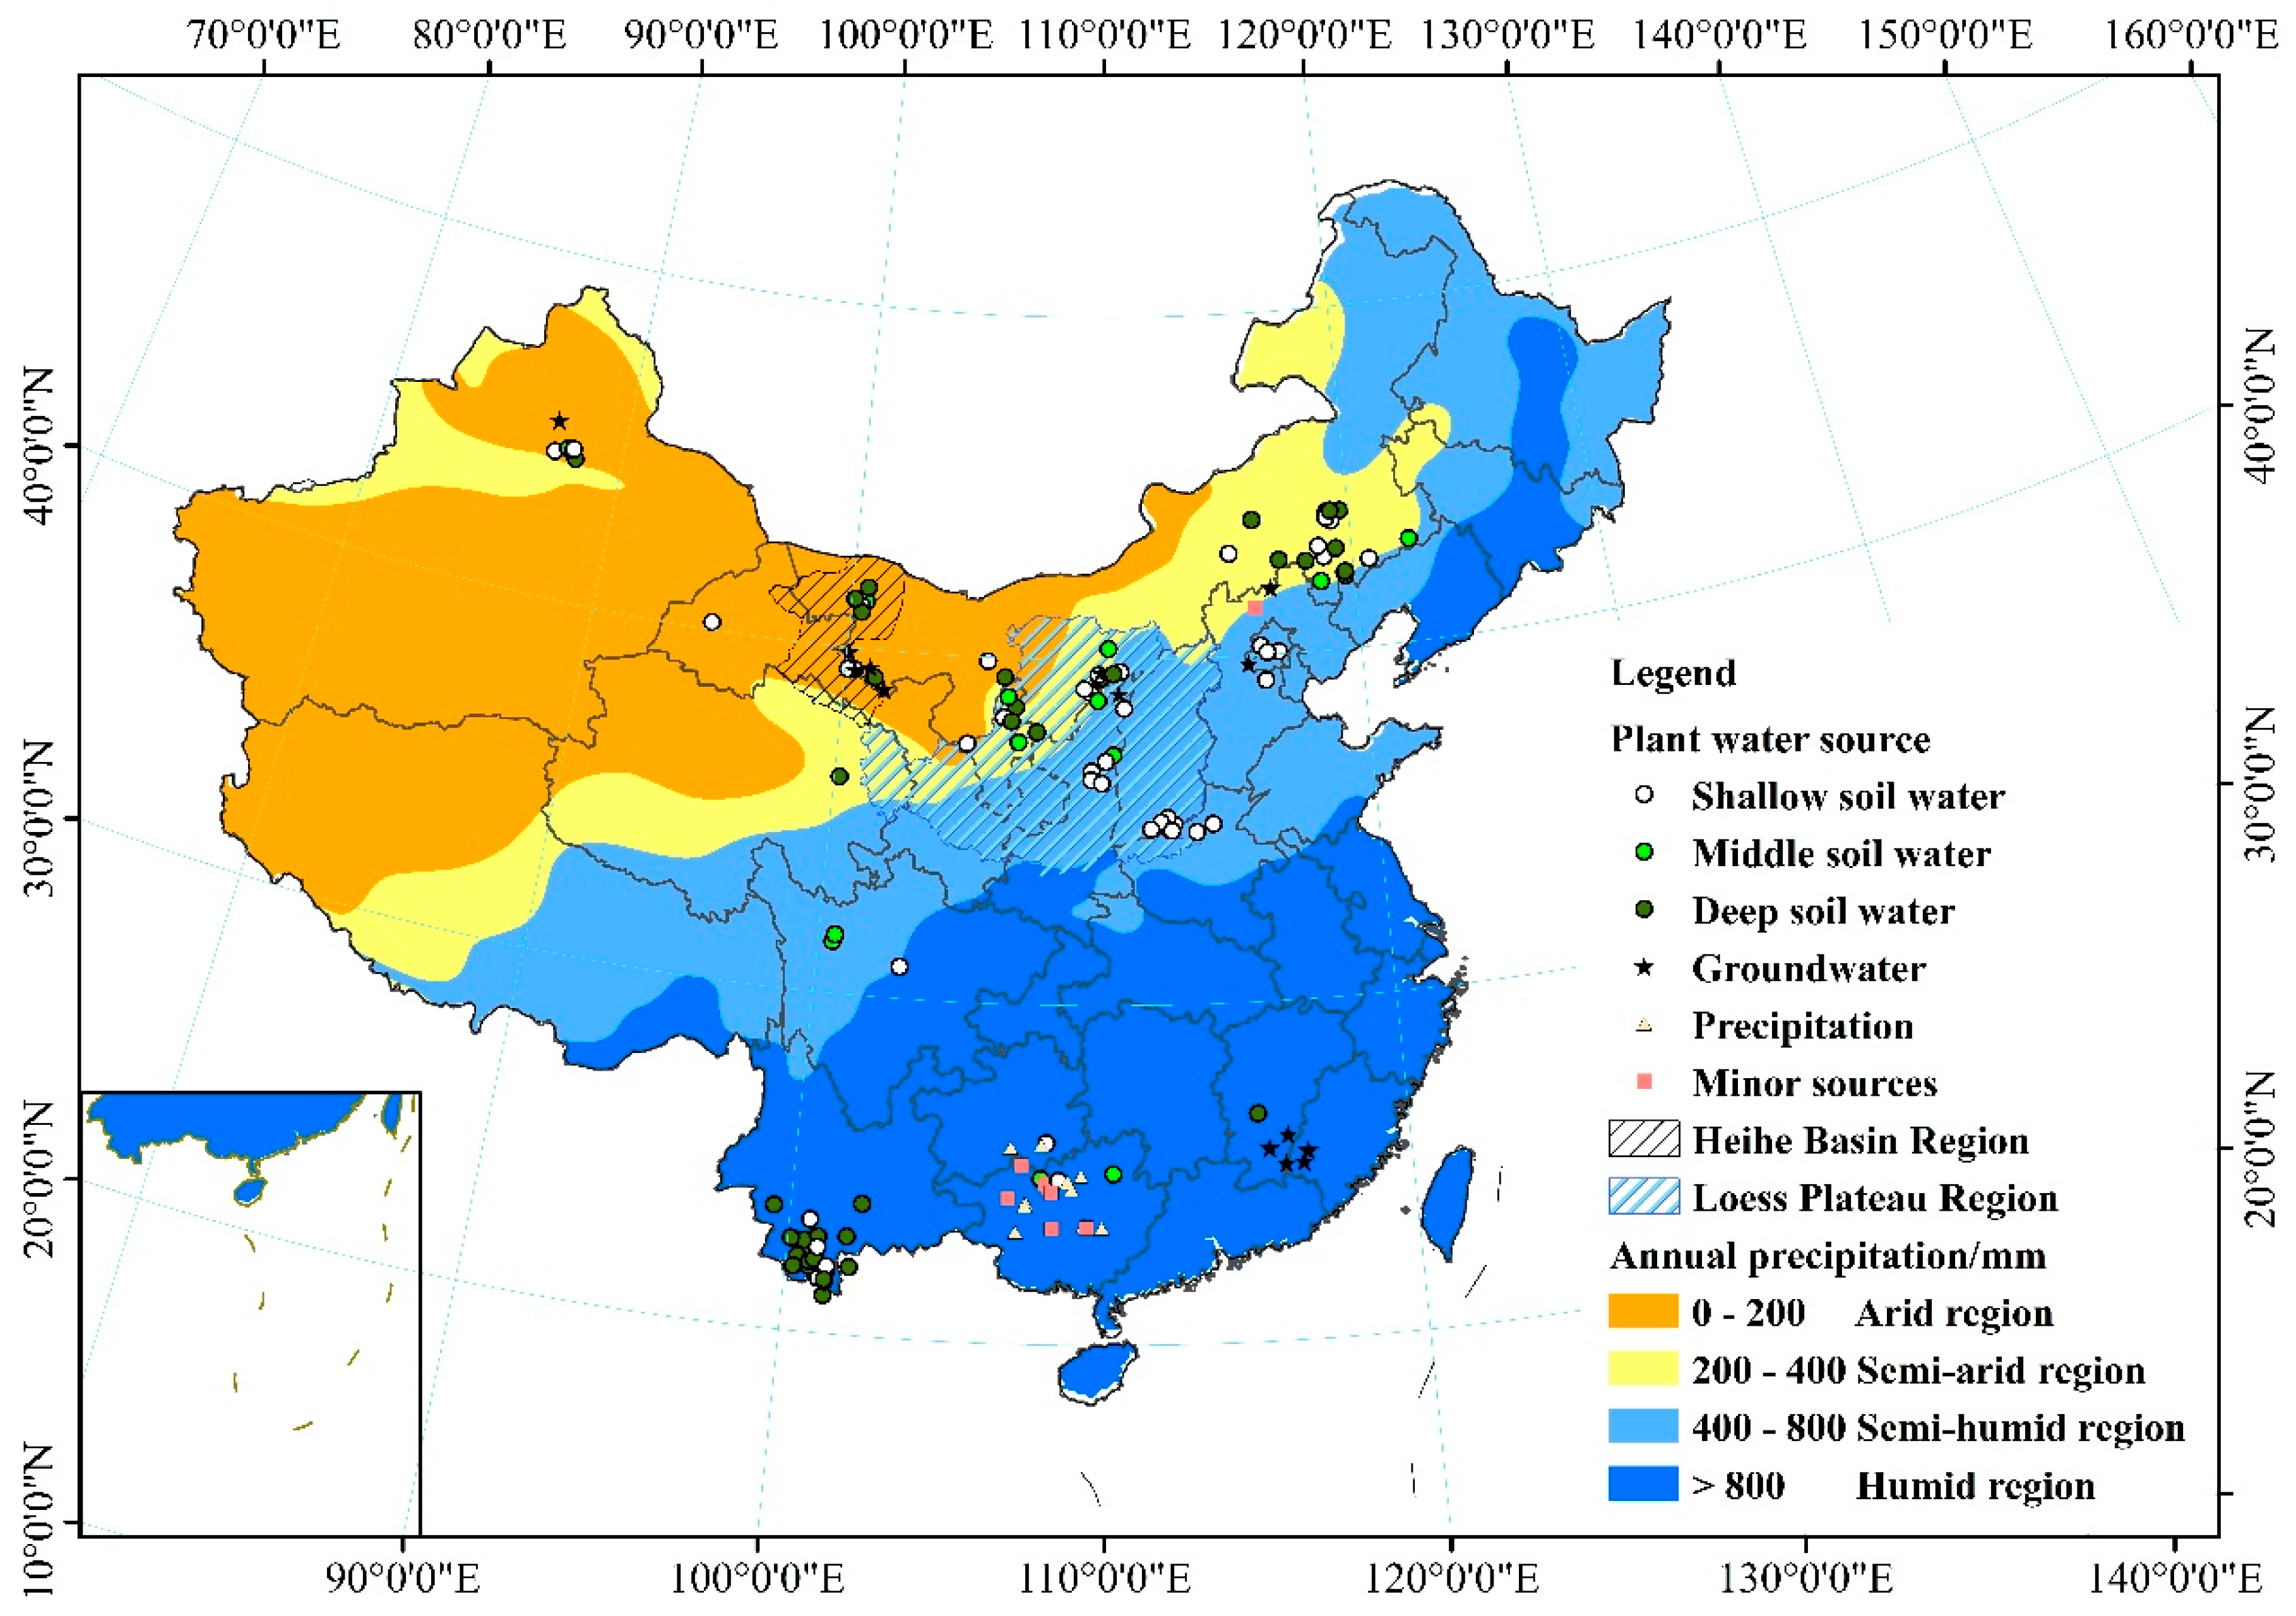
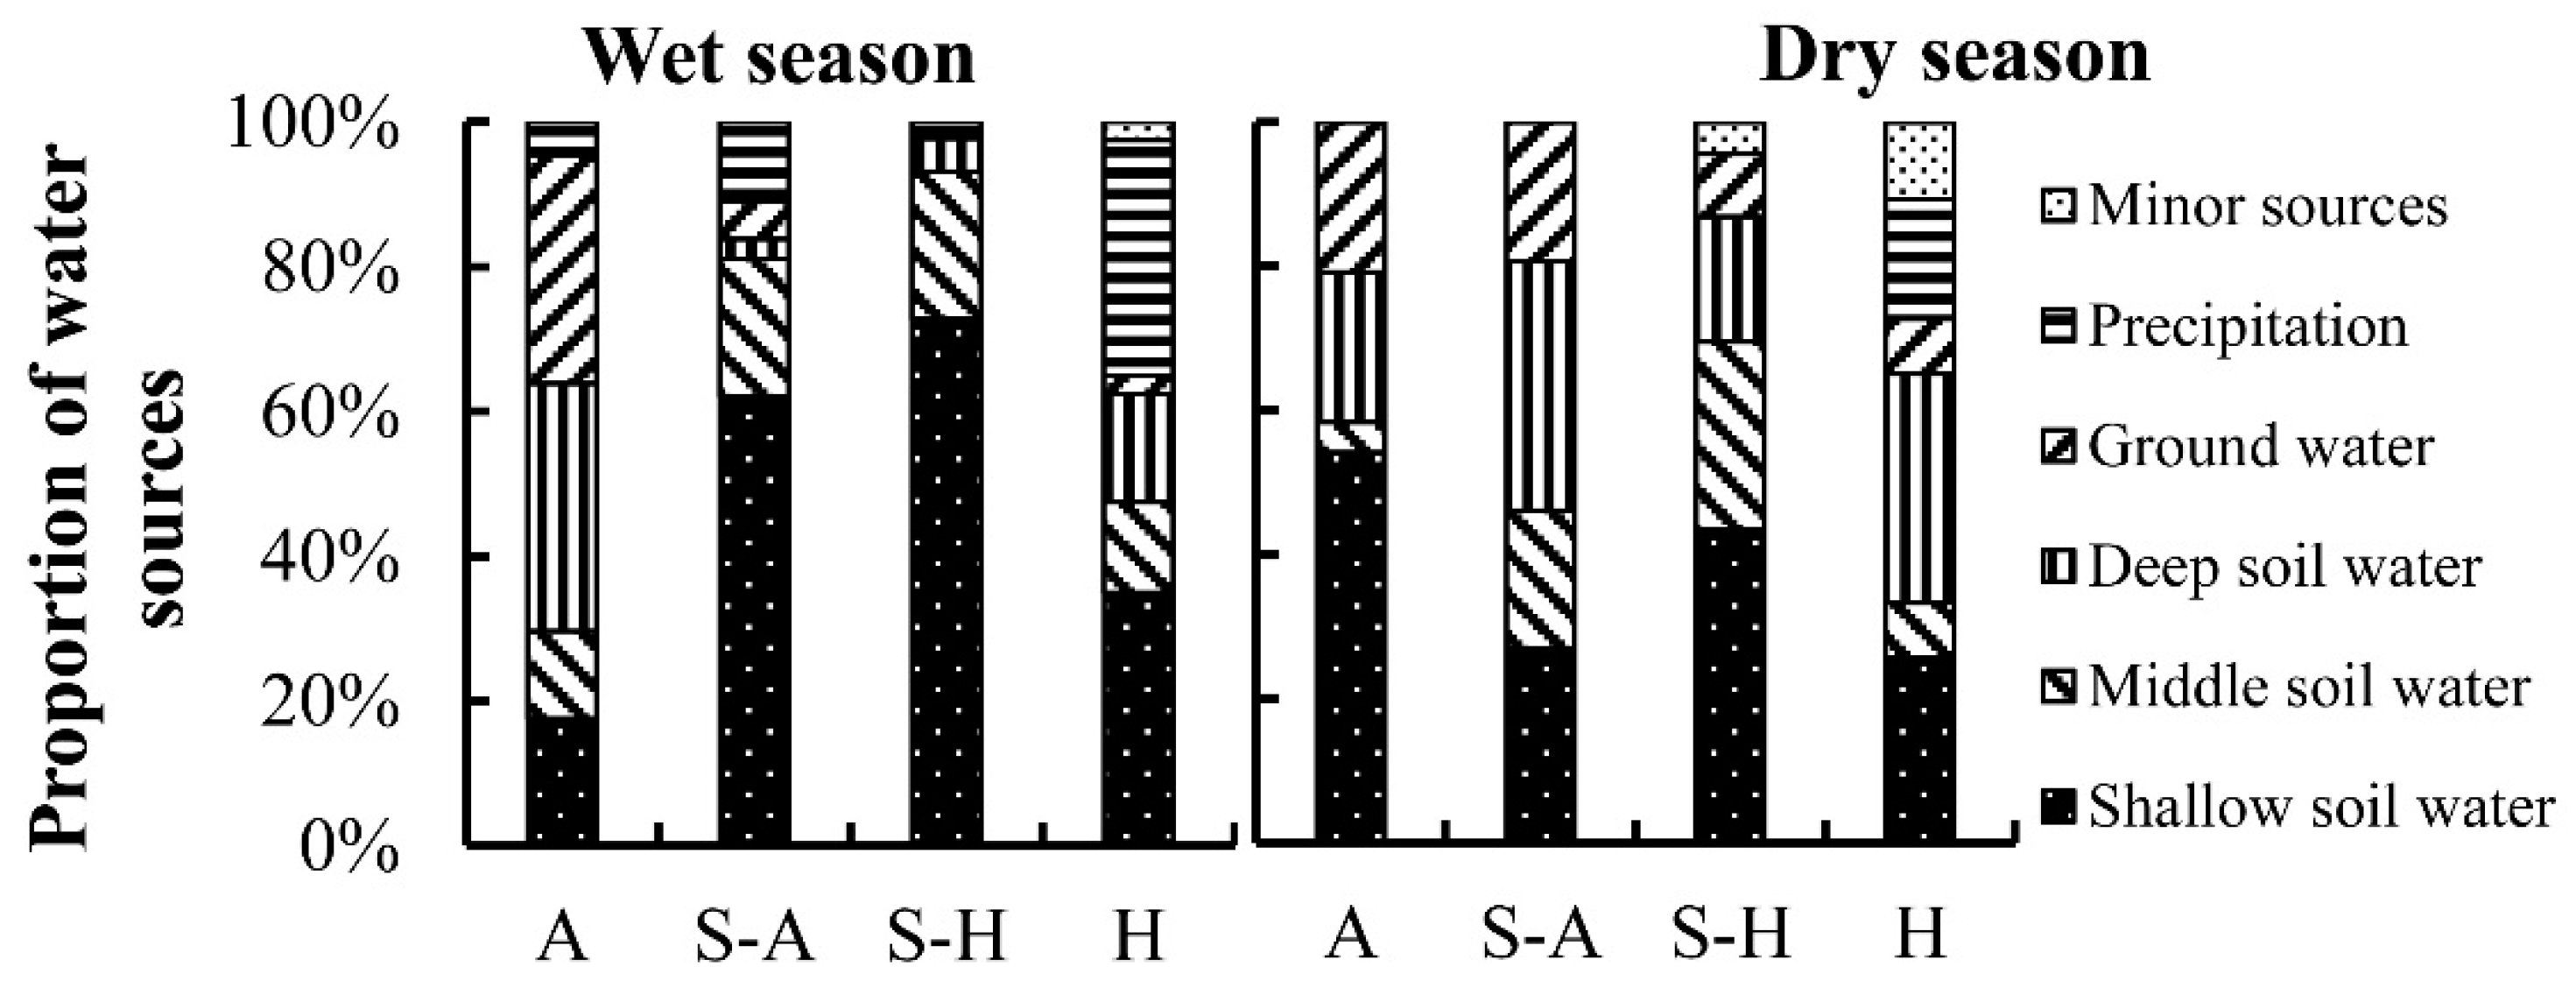
Here, we have summarized the seasonal variation trends for the main water sources for plants in the four regions of China (Figure 4 and Figure 5). The proportions were obtained from the number of samples for each main water source from all the samples in each region. In the wet season, trees would favor the use of deep soil water (34.3%) and groundwater (31.5%) in the arid region (Figure 6a), as their root systems give them better access to water that has infiltrated more deeply. Shallow soil water is the main water source for vegetation in the semi-arid region (62.6%) and semi-humid region (72.7%). Annual precipitation is more than 800 mm in the humid region, and shallow soil water (35%) and precipitation (32.5%) are the main water sources for plants in this region. In the dry season (Figure 6b), one of the major challenges facing vegetation in water-limited arid ecosystems is the discontinuous nature of water availability [66]. In the arid region, plants can efficiently utilize shallow soil water (54.2%), deep soil water (20.8%), and groundwater (20.8%) to avoid drought stress. In the semi-arid region, plants consistently use various water sources: shallow soil water (26.9%), middle soil water (19.2%), deep soil water (34.6%), and groundwater (19.2%). In the semi-humid region, plants rely on shallow soil water (43.5%), middle soil water (26.1%), and deep soil water (17.4%). In the humid region, plants rely on shallow soil water (25.8%), deep soil water (31.8%), and precipitation (16.6%).
Plants have strong adaptability to the environment, using diverse water sources in particular geographical situations (Figure 7). Riparian forests tend to use river water in arid and semi-arid regions. For example, Li et al. found that the riparian tree species Populus eupheratica used more stream water (68%) in the lower reaches of the Heihe River, especially during the discharge period [67]. Zhu et al. found that the water use patterns of plants varied over time. At the beginning of the growing season, four plants (Sympegma regelii Bunge, Ceratoides latens (J. F. Gmel.) Reveal et Holmgren, Calligonum mongolicum Turcz., and Ephedra przewalskii Stapf) in Golmud used a mixture of both precipitation and groundwater; in the mid-to-late period of the growing season, Sympegma regelii Bunge took up shallow soil water, while the three other plants species extracted from deep soil water and groundwater [68]. Xing et al. found that Salsola abrotanoides Bge. used river water preferentially over precipitation in the Qaidam Basin [38]. In contrast, Dawson and Ehleringer published a landmark paper demonstrating that mature streamside riparian trees in a semi-arid dry mountain catchment made use of water from deeper strata rather than stream water, and only small streamside individuals appeared to use stream water [69]. Recently, Bowling et al. revisited this study and found that neither groundwater nor stream water matched the δD and δ18O values of xylem water because of the “two water worlds” hypothesis [70]. In the semi-humid region, one of the water sources for plants is spring water. Trees growing in the Beijing mountain area are often located on rocky outcrops, and Liu et al. found that the tree species Platycladus orientalis (L.) Franco predominantly utilized natural spring water (57.8%) and the tree species Quercus variabilis Bl. primarily extracted water from natural springs (40.5%) and middle soil water (25.9%) [71]. Sun et al. found that Quercus variabilis Bl. also used spring water (19.6%) during the dry season in the south-facing area of the Taihang Mountains [72]. In the humid region, plants also used minor water sources (karst water, spring water, fog, river water, and seawater), which accounted for 10.6% of the total water usage. The humid region (Southwest China) is home to one of the largest karst areas in the world [73]. The high proportion of bedrock outcrops makes spring water and karst water common supplementary water sources for plants [13,18,31,74]. In addition, Fu et al. found that the proportion of fog water contributing to xylem water ranged from 15.8% (Cleistanthus sumatranus (Miq.) Muell. Arg.) to 41.3% (Combretum latifolium Bl.) [14]. Zhan et al. found that approximately 16% of the water sources of plants originated from fog in the northern Dongting lake area [75]. Huang et al. found that indigenous mangrove species (Kandelia obovata, aegiceras corniculatum, and Avicennia marina) used groundwater and seawater in coastal shelterbelt forests of southeast China [29].
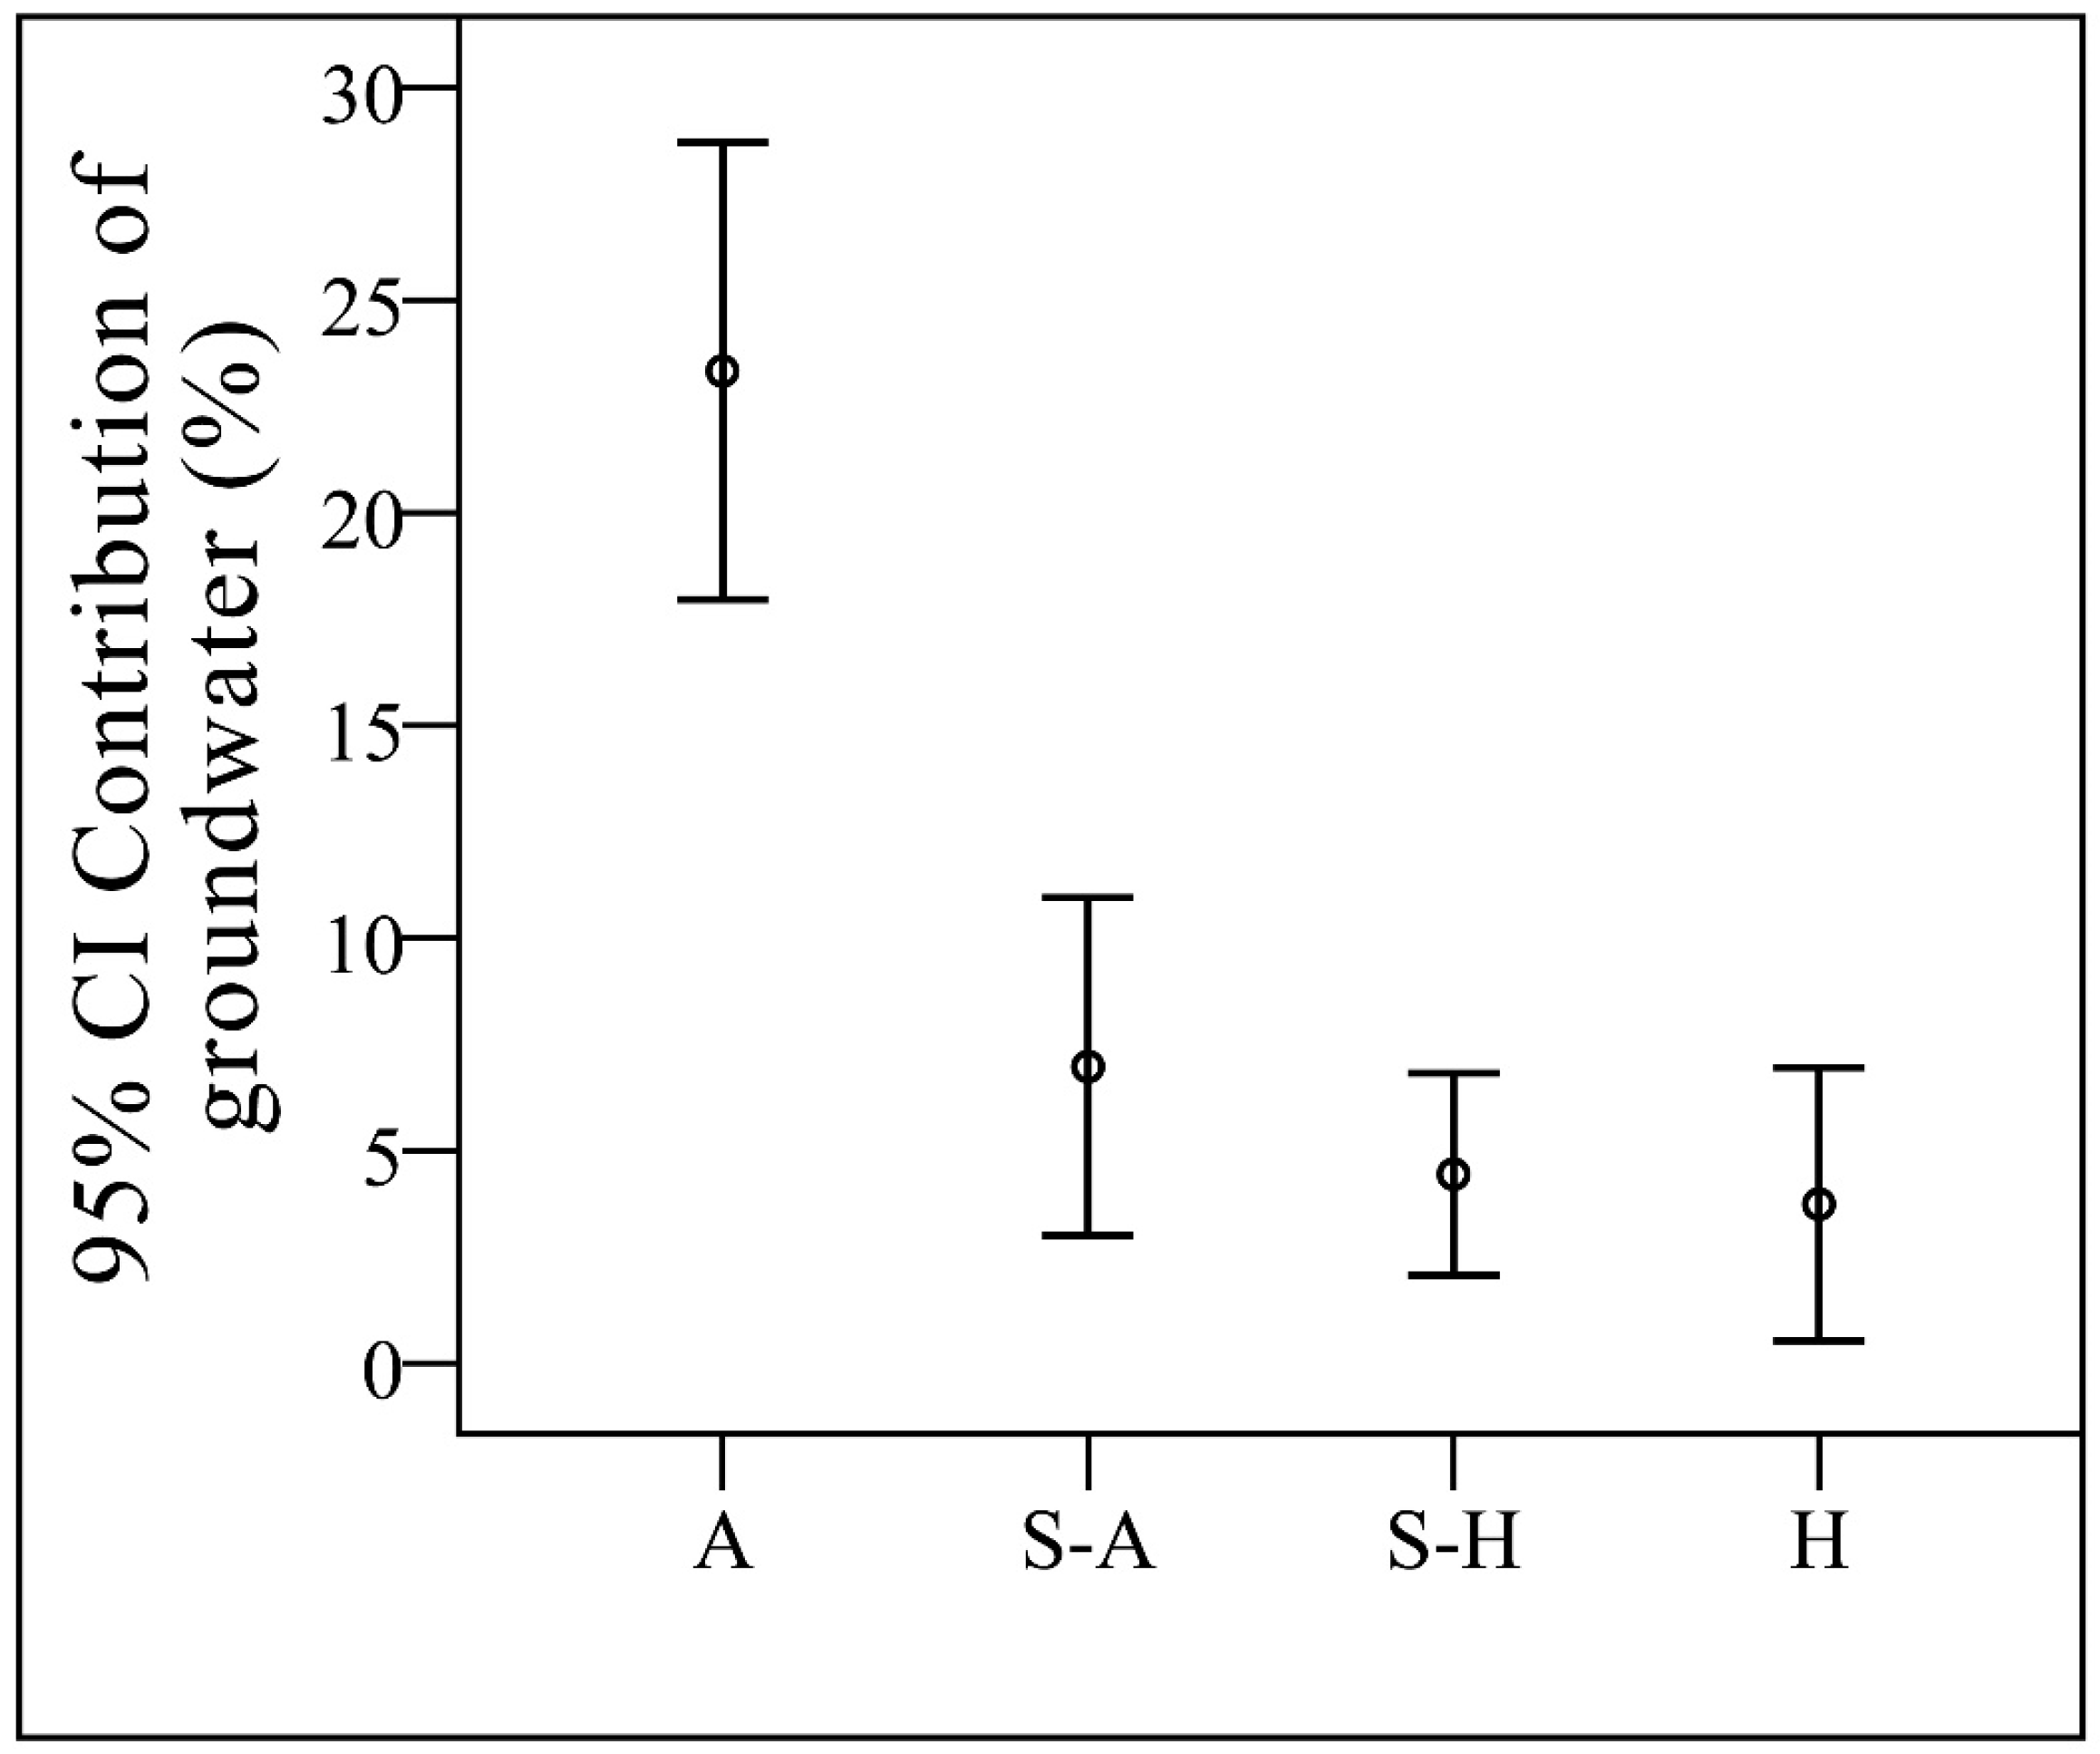
The ability to access groundwater determines species’ groundwater use and accessibility is related with spatial and temporal distribution of groundwater. The average contributions of groundwater in the wet season and the dry season were 10.7% and 8.9%, respectively, although the seasonal variation was not significant (p > 0.05). The percentages of samples that have groundwater contribution to xylem water out of the total samples in the arid region, semi-arid region, semi-humid region, and humid region were 56.8%, 27.0%, 28.4%, and 6.6%, respectively. The average contributions of groundwater from the arid region, semi-arid region, semi-humid region, and humid region were 23.3%, 7.0%, 4.4%, and 3.7%, respectively (Figure 8). There is a high variation between the former and the latter because the number of samples with groundwater contributions was high, but per sample the contribution of groundwater was relatively low. In summary, the contribution of groundwater is positively related to the degree of drought. This is consistent with the point of view presented by Evaristo and McDonnell [33].
In particular, the Loess Plateau is located in the semi-arid and semi-humid regions, which have less precipitation and poor water resources. Soil water status is worse because of the presence of soil dry layers [76]. The results reveal that 43.9% of the samples from the Loess Plateau had some groundwater in the xylem water, and these tended to be from the northern Loess Plateau (Figure 5). Whether groundwater was used by plants depended on the complex topography of the sites on the Loess Plateau. The central and southern Loess Plateau is a hill and gully area where the soil layers are deep—up to more than 80 m. It is difficult for plants to access groundwater. In the rainy season and the dry season on the Loess Plateau, plants are dependent on soil water from different layers. In the northern part of the Loess Plateau, in the Mu Us Desert, groundwater level is low and plants can absorb water from the saturated zone [77].
The Heihe River basin is the second largest inland river basin in the arid and semi-arid regions of northwest China. It is a classic area for studying oases and desertification [78]. Plants here mainly used deep soil water and groundwater through the year. From the Heihe River Basin, 67.7% of the xylem water samples contained a contribution from groundwater, mainly samples from the lower reaches of the Heihe River Basin (Figure 5).
3.3. Contribution of the Plant Main Water Source
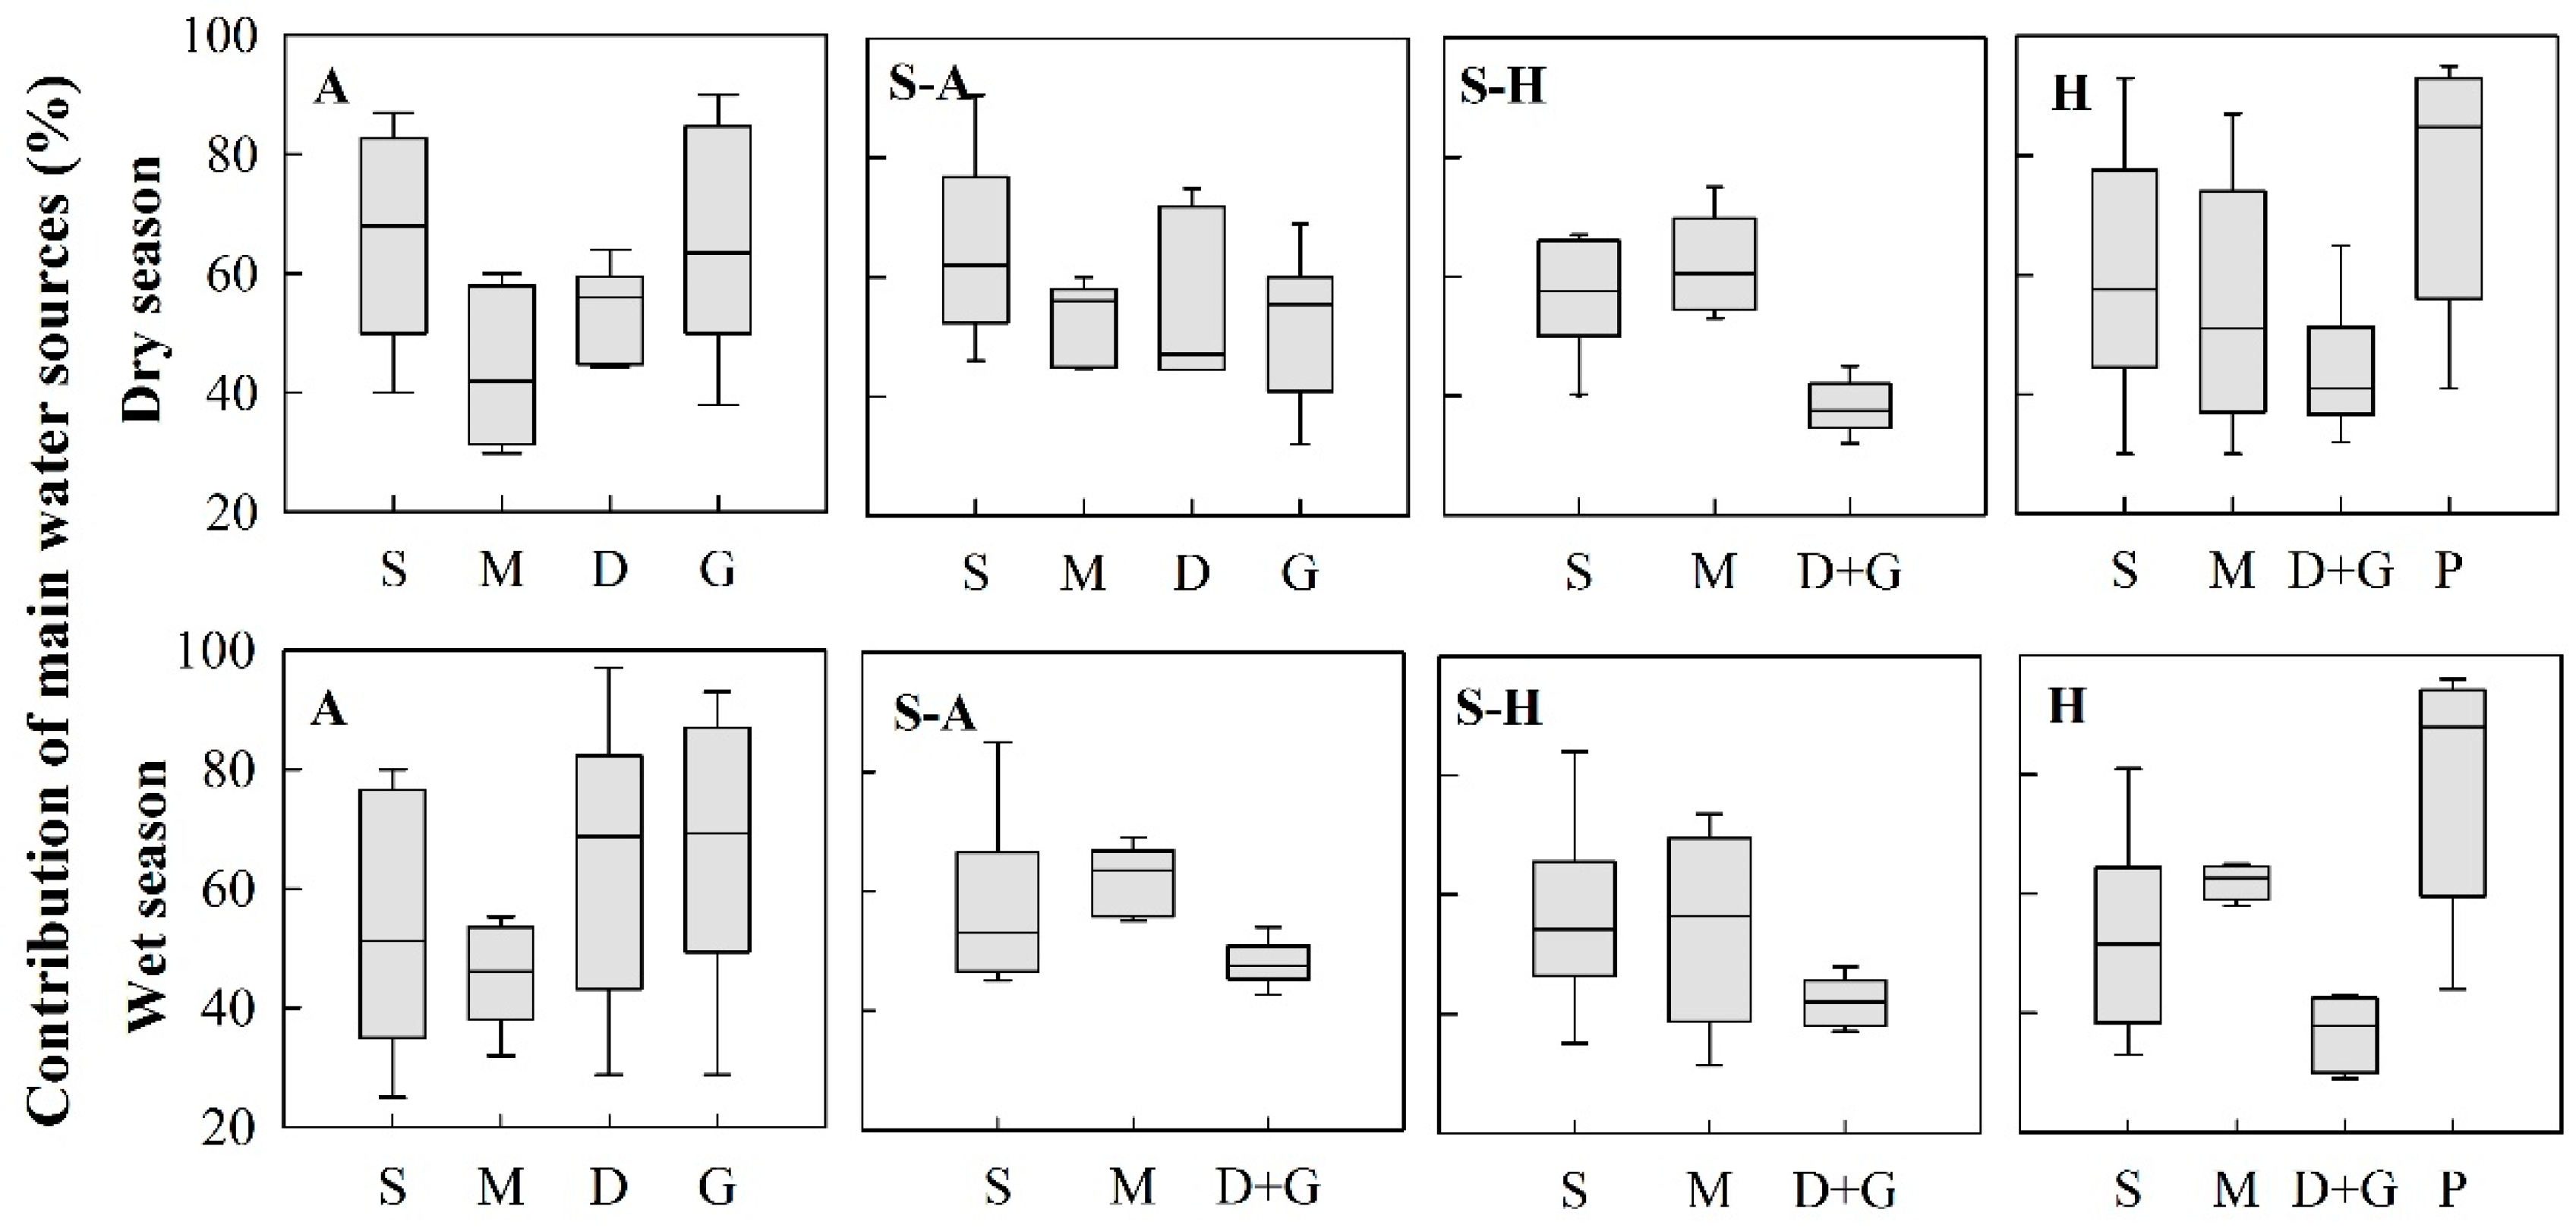
The contribution of the plant main water source (CPMWS) values were 56.3% in the wet season and 57.6% in the dry season, and there was no significant seasonal difference (p > 0.05). In the dry season, the average CPMWS values were 60.3%, 56.0%, 55.3%, and 56.0%, respectively, from the arid region, semi-arid region, semi-humid region, and humid region, and there was no significant regional difference (p > 0.05). In the wet season, the average CPMWS values were 60.8%, 55.9%, 56.6%, and 59.6% from the arid region, semi-arid region, semi-humid region, and humid region, and there was also no significant regional difference (p > 0.05). Although the average CPMWS values had no significant seasonal or regional differences, the main water sources of plants differed in both the wet and the dry seasons.
In the arid region, the main water sources for plants in the dry season were shallow soil water, deep soil water, and groundwater; their median CPMWS values were 69.1%, 56.0%, and 63.5%, respectively (Figure 9). In the wet season, in contrast, shallow soil water had a low CPMWS value of 51.3%. Deep soil water and groundwater made high contributions and their median CPMWS values were 68.8% and 69.3%, respectively. In the semi-arid region, the median CPMWS values of shallow soil water, middle soil water, deep soil water, and groundwater in the dry season were 62.0%, 56.0%, 47.1%, and 55.5%, respectively. Compared with the dry season, the median CPMWS of shallow soil water decreased to 53.0%, the median CPMWS of middle soil water increased to 63.5%, and the combination of deep water and groundwater was 47.5% in the wet season. In the semi-humid region, the CPMWS of shallow and middle soil water showed an increasing trend, and the CPMWS of the combination of deep water and groundwater exhibited a decreasing trend from the dry season to the wet season. The values for shallow soil water, middle soil water, and the combination of deep soil water and groundwater were 61%, 60.5%, and 37.5% in the dry season. The values for shallow soil water, middle soil water, and the combination of deep soil water and groundwater were 54.2%, 56.4%, and 44.0% in the wet season. In the humid region, shallow soil water and middle soil water exhibited relatively large differences from 57.6% and 51% in the dry season to 51.6% and 62.6% in the wet season, respectively. In some special cases, precipitation made the highest contribution: 84.8% (dry season) and 87.9% (wet season) in karst areas, where rainfall was treated as a potential water source for plants growing on outcrops, as they can use rainfall stored in crevices/cracks directly [79]. For example, Nie et al. found that in the dry season, five species (Radermachera sinica (Hance) Hemsl., Sterculia euosma W. W. Smith, Schefflera octophylla (Lour.) Harms, Alchornea trewioides (Benth.) Muell. Arg, Celtis biondii Pamp.) utilized both recent and previous rainfall, in percentages ranging from 89.1% to 100% [80].
In general, soil water was the main water source for plants and shallow soil water made the highest contributions. CPMWS is closely related to available water sources for plants. Due to the occurrences of facilitative and competitive interactions, different plants alleviate water stress by switching their utilization of water sources. In the dry savannas, Walter [81] proposed a two-layer hypothesis that relies on vertical niche partitioning, and it has been proposed that shallowly-rooted grasses use water only from the subsurface layers. On the contrary, deeply-rooted woody trees primarily depend on subsoil water below the grass roots [81]. The roots offer powerful evidence for testing this hypothesis [82]. Deeply-rooted perennials showed a complete dependence on summer precipitation. Shallowly-rooted herbaceous utilized both summer precipitation and winter-spring precipitation in the desert of southern Utah [83]. Moreover, Ward et al. found that this assumption is not only suitable for the dry savannas, but is also suitable for some mesic areas [84].
4. Conclusions
Influenced by continental and seasonal effects, the slope of the LMWL gradually increased from the arid region, to the semi-arid region, to the semi-humid region, to the humid region (6.231, 7.283, 7.652, and 8.067, respectively) in China. For each region, the ranges of isotopic values (δD and δ18O) in vegetation are mainly distributed in the upper part of the LMWL because evaporation affects both rainfall and the soil surface. With respect to the soil water line, the δ18O values by depth (0–100 cm) varied with time, especially for the top soil layer.
Soil water availability for plants is affected by seasonal rainfall patterns. In the wet season, plants favor deep soil water and groundwater in the arid region. Shallow soil water is the main water source for vegetation in the semi-arid region and semi-humid region. In the humid region, shallow soil water and precipitation are the main water sources for plants. In the dry season, in water-limited arid ecosystems, plants can efficiently utilize shallow soil water, deep soil water, and groundwater to avoid drought stress. In the semi-arid region, plants consistently use various water sources: shallow soil water, middle soil water, deep soil water, and groundwater. In the humid region, plants rely on shallow soil water, deep soil water, and precipitation.
Soil water was the main water source for plants, and shallow soil water made the highest contributions. The contribution of plant main water source (CPMWS) values exhibited no significant seasonal or regional difference, although there were seasonal differences in specific water sources. These figures are closely related to available water sources for plants. Plants maintain their growth via shifting their utilization of water sources when there is water source instability, with both facilitative and competitive interactions occurring.
Acknowledgments
Funding was generously provided by the National Natural Science Foundation of China (4177010434, 41390463, 41741002) and the National Key Research and Development Program of China (2016YFC0501604). We acknowledge dedicated assistance from Zhi-lin PEI, who contributed precipitation data from the China Meteorological Data Service Center(CMDC) “Dataset of monthly surface observation values in individual years (1981-2010)” and helped generate the map by using ArcMap 10.2.
Author Contributions
Y.Z. and L.W. designed the study. Y.Z. compiled the data set and conducted the statistical analyses. Y.Z. and L.W. wrote the manuscript.
Conflicts of Interest
The authors have no conflicts of interest to declare.
Appendix A
- Ma, H.Y.; Yang, X.D.; Lv, G.H.; He, X.M.; Zhang, X.N.; Wang, X.Y.; Li, Y. Water sources of dominant desert species in ebinur lake wetland nature reserve, Xinjiang, China. Acta Ecologica Sinica 2017, 37, 829–840.
- Zhou, H.; Zheng, X.J.; Tang, L.S.; Li, Y. Differences and similarities between water sources of Tamarix ramosissima, Nitraria sibirica and Reaumuria soongorica in the southeastern Junggar Basin. Chinese Journal of Plant Ecology 2013, 37, 665–673.
- Zhu, Y.J.; Jia, Z.Q. Water Source of Haloxylon ammodendron plantations in autumn at the southeast edge of Badain Jaran Desert. Scientia Silvae Sinicae 2012 48, 1–5.
- Zhu, L.; Xu, X.; Mao, G.L. Water sources of shrubs grown in the northern Ningxia Plain of China characterized by shallow groundwater table. Chinese Journal of Plant Ecology 2012, 36, 618–628.
- Gong, G.L.; Chen, H.; Duan, D.Y. Comparison of the methods using stable hydrogen and oxygen isotope to distinguish the water source of Nitraria tangutorum. Acta Ecologica Sinica 2011, 31, 7533–7541.
- Wang, Y.L.; Liu, L.C.; Gao, Y.H.; Li, G.; Zhao, J.C.; Xie, M. Analysis of water sources of plants in artificial sand-fixation vegetation area based on large rainfall events. Chinese Journal of Applied Ecology 2016, 27, 1053–1060.
- Yin, L.; Zhao, L.J.; Ruan, Y.F.; Xiao, H.L.; Cheng, G.D.; Zhou, M.X.; Wang, F.; Li, C.Z. Study of the replenishment sources of typical ecosystems water and dominant plant water in the lower reaches of the Heihe, China. Journal of Glaciology and Geocryology 2012, 34, 1478–1486.
- Xing, X.; Chen, H.; Zhu, J.J.; Chen, T.T. Water sources of five dominant desert plant species in Nuomuhong area of Qaidam Basin. Acta Ecologica Sinica 2014, 34, 6277–6286.
- Wu, Y.; Zhou, H.; Zheng, X.J.; Li, Y.; Tang, L.S. Seasonal changes in the water use strategies of three co-occurring desert shrubs. Hydrological Processes 2015, 28, 6265–6275.
- Dai, Y.; Zheng, X.J.; Tang, L.S.; Li, Y. Dynamics of water usage in Haloxylon ammodendron in the southern edge of the Gurbantünggüt Desert. Chinese Journal of Plant Ecology 2014, 38, 1214–1225.
- Cui, Y.Q.; Ma, J.Y.; Feng, Q.; Sun, J.H.; Sun, W. Water sources and water-use efficiency of desert plants in different habitats in Dunhuang, NW China. Ecological Research 2017, 32, 243–258.
- Li, H.; Liang, X.; liu, Y. F.; Liu, Y.L.; Iian, Y. Application of hydrogen and oxygen stable isotopes for determining water sources used by cotton in Xinjiang arid region. Earth Science 2017, 42, 843–852.
- Zhu, Y.; Jia, Z.; Yang, X. Resource-dependent water use strategy of two desert shrubs on interdune, Northwest China. Journal of Food Agriculture and Environment 2011, 9, 832–835.
- Zhao, L.J.; Xiao, H.L.; Cheng, G.D.; Song, Y.X.; Zhao, L.; Li, C.Z.; Yang, Q. A preliminary study of water sources of riparian plants in the lower reaches of the Heihe Basin. Acta Geoscientiva Sinica 2008, 29, 709–718.
- Chen, J.; Xu, Q.; Gao, D.Q.; Ma, Y.B. Water use of Helianthemum songaricum and co-occurring plant species Sarcozygium xanthoxylum in western ordos. Scientia Silvae Sinicae 2016, 52, 48–56.
- Zhu, L.; Qi, Y.S.; Xu, X. Water sources of Medicago sativa grown in different slope positions in Yanchi county of Ningxia. Chinese Journal of Plant Ecology 2014, 38, 1226–1240.
- Zheng, X.R.; Zhao, G.Q.; Li, X.Y.; Li, L.; Wu, H.W.; Zhang, S.Y.; Zhang, Z.H. Application of stable hydrogen isotope in study of water sources for Caragana microphylla bushland in Nei Mongol. Chinese Journal of Plant Ecology 2015, 39, 184–196.
- Wu, H.W.; Li, X.Y.; Jiang, Z.Y.; Li, J.; Zheng, X.R.; Zhao, D.Z. Variations in water use for Achnatherum splendens in Qinghai Lake watershed, based on δD and δ18O. Acta Ecologica Sinica 2015, 35, 8174–8183.
- Liu, B.Q.; Liu, Z.M.; Qian, J.Q.; Alamusa; Zhang, F., L. Water sources of dominant sand-binding plants in dry season in southern Horqin Sandy Land, China. Chinese Journal of Applied Ecology 2017, 28, 2093–2101.
- Zhou, H.; Zhao, W.Z.; He, Z.B. Water sources of Nitraria sibirica and response to precipitation in two desert habitats. Chinese Journal of Applied Ecology 2017, 28, 2083–2092.
- Liu, L.Y.; Jia, Z.Q.; Zhu, Y.J.; Li, H.; Yang, D.F.; Wei, D.X.; Zhao, X.B. Water use strategy of Salix cheilophila stands with different ages in Gonghe Basin, Qinghai Province. Forest Research 2012, 25, 597–603.
- Zhao, G.Q.; Li, X.Y.; Wu, H.W.; Zhang, S.Y.; Li, G.Y. Study on plant water use in Myricaria squamosa with stable hydrogen isotope tracer in Qinghai Lake basin. Chinese Journal of Plant Ecology 2013, 37, 1091–1100.
- Fang, J.; Wei, Y.F.; Liu, S.; Zhao, X.Y.; Li, S.G. Stable isotopic analysis on water utilization sources of Pinus sylvestris var. mongolica plantations in inter-dune lowland in Horqin Sandy Land. Chinese Journal of Ecology 2011, 30, 1184–1900.
- Song, L.; Zhu, J.; Li, M.; Yu, Z. Water utilization of Pinus sylvestris var. mongolica in a sparse wood grassland in the semiarid sandy region of Northeast China. Trees 2014, 28, 971–982.
- Su, H.; Li, Y.; Liu, W.; Xu, H.; Sun, O.J. Changes in water use with growth in Ulmus pumila in semiarid sandy land of northern China. Trees 2014, 28, 41–52.
- Jia, Z.; Zhu, Y.; Liu, L. Different water use strategies of juvenile and adult caragana intermedia plantations in the Gonghe Basin, Tibet Plateau. PLoS ONE 2012, 7, e45902.
- Li, J.; Wu, H.W.; Li, X.Y.; He, B.; Pei, T.T.; Jiang, Z.Y.; Bao, Z.C. Water utilizations by crops in the cropland ecosystem, Qinghai Lake Watershed. Journal of Natural Resources 2017, 32, 1348–1359.
- Liu, Z.Q.; Yu, X.X.; Lou, Y.H.; Li, H.Z.; Jia, G.D.; Lu, W.W., Water use strategy of Platycladus orientalis in Beijing mountainous area. Acta Ecologica Sinica 2016, 37, 3697–3705.
- Liu, Z.Q.; Yu, X.X.; Jia, G.D.; Li, H.Z.; Lu, W.W. Water source of typical plants in rocky mountain area of Beijing, China. Chinese Journal of Applied Ecology 2017, 28, 2135–2142.
- Liu, Z.Q.; Yu, X.X.; Jia, G.D.; Jia, J.B.; Lou, Y.H.; Zhang, K. Water use characteristics of Platycladus orientalis and Quercus variabilis in Beijing mountain area. Scientia Silvae Sinicae 2016, 52, 22–30.
- Yang, G.M.; Wang, L. Water Use Patterns of two typical plants based on hydrogen and oxygen stable isotopes at Dumping site in the opencast coal mining area of Heidaigou. Journal of Natural Resources 2016, 31, 477–487.
- Sun, S.J.; Meng, P.; Zhang, J.S.; Huang, H.; Wan, X.C. Deuterium isotope variation and water use in an agroforestry system in the rocky mountainous area of North China. Acta Ecologica Sinica 2010, 30, 3717–3726.
- Zhang, T.G.; Li, Z.B.; Li, P.; Xu, G.C.; Liu, X.J.; Jin, Y.R. Response characteristics of soil water use patterns by different plants to precipitation in rocky mountainous areas. Chinese Journal of Applied Ecology 2016, 27, 1461–1467.
- Sun, S.J.; Meng, P.; Zhang, J.; Wan, X.C. Seasonal variation in water use of Ziziphus jujuba in the south aspect of Taihang Mountains with deuterium isotope signature. Scientia Silvae Sinicae 2011, 47, 46–53.
- Q, X.; Y, W. H.; R, l. S. Water use strategies of Malus toringoides and its accompanying plant species Berberis aemulans. Acta Ecologica Sinica 2011, 31, 5702–5710.
- Zhu, J.F.; Liu, J.T.; Lu, Z.H.; Sun, J.K.; Xia, J.B. Water use patterns of Tamarix chinensis in shell island wetlands of the Yellow River Delta. Wetland Science 2015, 13, 765–771.
- Wang, P.; Song, X.F.; Yuan, R.Q.; Han, D.M.; Zhang, Y.H.; Zhang, B. Study on water consumption law of summer corn in north China using deuterium and oxygen-18 isotopes. Journal of Natural Resources 2013, 28, 481–491.
- Zhang, C.; Zhang, J.; Zhao, B.; Zhu, A.; Hui, Z.; Ping, H.; Li, X. Coupling a two-tip linear mixing model with a δD– δ 18O plot to determine water sources consumed by maize during different growth stages. Field Crops Res. 2011, 123, 196–205.
- Wang, J.; Fu, B.; Lu, N.; Zhang, L. Seasonal variation in water uptake patterns of three plant species based on stable isotopes in the semi-arid Loess Plateau. Sci. Total Environ. 2017, 609, 27–37.
- Shao, H.; Zhu, J.F.; Liu, J.T.; Lu, Z.H.; Xia, J.B.; Sun, J.K.; Zhao, Y.Y. Soil-water interacting use patterns driven by Ziziphus jujube on the Chenier Island in the Yellow River Delta, China. Archives of Agronomy and Soilence 2016, 62, 1614–1624.
- Guo, F.; Ma, J.J.; Zheng, L.J.; Sun, X.H.; Guo, X.H.; Zhang, X.L. Estimating distribution of water uptake with depth of winter wheat by hydrogen and oxygen stable isotopes under different irrigation depths. Journal of Integrative Agriculture 2016, 15, 891–906.
- Wang, B.Y.; Chen, B.Z.; Sun, S.B.; Zhou, Z.Y.; Yang, Z.Q.; Liu, Y.Q.; Zhang, J.W. The water-use characteristics of summer corn during growing period in Yuchen, Shandong Province. J. Soil Water Conserv. 2016, 30, 153–161.
- Deng, W.P.; Yu, X.X.; Jia, G.D.; Li, Y.J.; Liu, Y.J. Water sources of three typical plants in the Beijing mountain areas in rainy season. Arid Zone Research 2014, 31, 649–657.
- Chen, Y.J.; Cao, K.F.; Schnitzer, S.A.; Fan, Z.X.; Zhang, J.L.; Bongers, F. Water-use advantage for lianas over trees in tropical seasonal forests. New Phytol. 2015, 205, 128–136.
- Deng, Y.; Jiang, Z.; Qin, X. Water source partitioning among trees growing on carbonate rock in a subtropical region of Guangxi, China. Environ. Earth Sci. 2012, 66, 635–640.
- Shen, Y.J.; Zhang, Z.B.; Gao, L.; Peng, X. Evaluating contribution of soil water to paddy rice by stable isotopes of hydrogen and oxygen. Paddy and Water Environment 2015, 13, 125–133.
- Liu, W.J.; Liu, W.Y.; Li, P.J.; Duan, W.P.; Li, H.M. Dry season water uptake by two dominant canopy tree species in a tropical seasonal rainforest of Xishuangbanna, SW China. Agric. Forest Meteorology 2010, 150, 380–388.
- Zhu, X.Q.; Fan, T.; Guan, W.; Qin, N. Soil-water utilization levels in a Cyclobalanopsis glaucoides virgin forest on the central Yunnankarst plateau. Journal of Zhejiang A and F University 2014, 31, 690–696.
- Deng, X.Q.; Wang, S.J.; Rong, L. Study on water sources of proper plant species in karst areas. Earth and Environment 2012, 40, 154–160.
- Ding, Y.L.; Chen, H.S.; Nie, Y.P.; Wang, S.; Zhang, H.L.; Wang, K.L. Water use strategy of Eucalyptus urophylla × E. grandis on karst hillslope based on isotope analysis. Chinese Journal of Applied Ecology 2016, 27, 2729–2736.
- Xu, Q.; Liu, S.R.; An, S.Q.; Jiang, Y.X.; Lin, G.H. Characteristics of hydrogen stable isotope in soil water of sub-alpine dark coniferous forest in Wolong, Sichuan Province. Scientia Silvae Sinicae 2007, 43, 8–14.
- Wu, J.N.; Liu, W.J.; Chen, C.F. How do plants share water sources in a rubber-tea agroforestry system during the pronounced dry season? Agric. Ecosyst. Environ. 2017, 236, 69–77.
- Song, L.N.; Zhu, J.J.; Li, M.C.; Zhang, J.X.; Lv, L.Y., Sources of water used by Pinus sylvestris var. mongolica trees based on stable isotope measurements in a semiarid sandy region of northeast China. Agric. Water Manag. 2016, 164, 281–290.
Appendix B
Figure A1.
Spatial distribution of δ18O in precipitation across China.
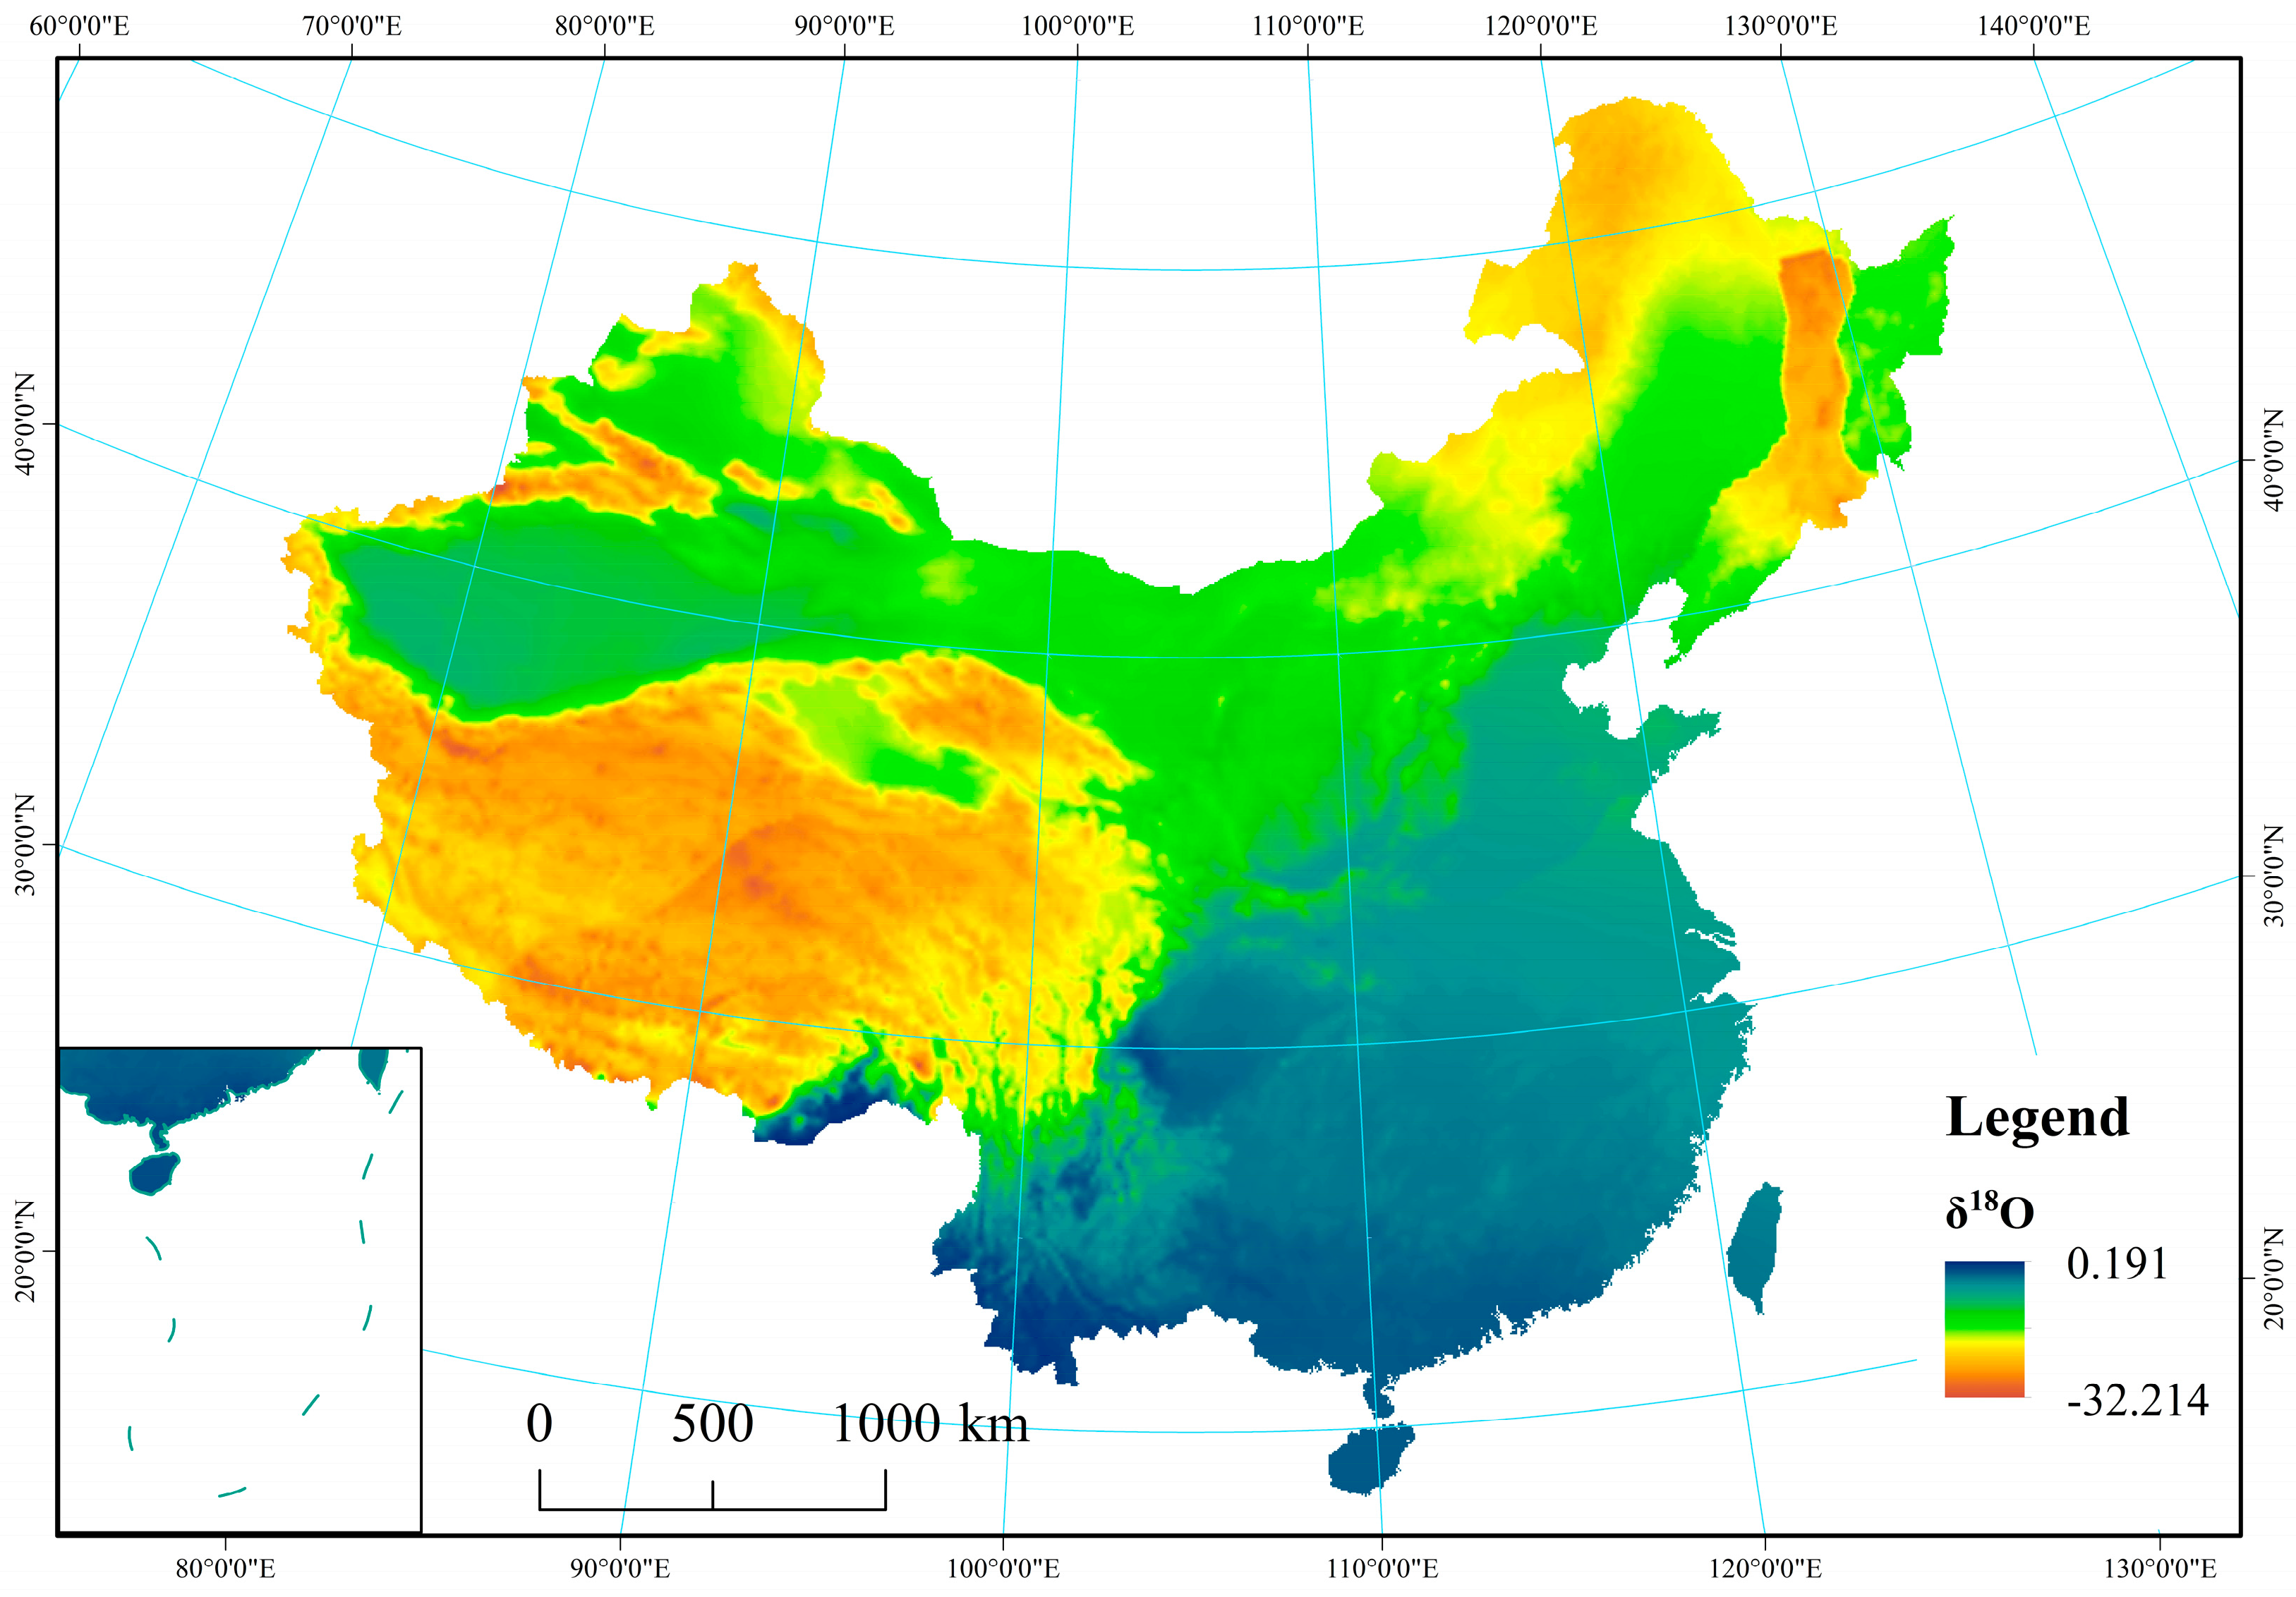
Figure A2.
Spatial distribution of δ2H in precipitation across China.

References
- West, J.B.; Bowen, G.J.; Cerling, T.E.; Ehleringer, J.R. Stable isotopes as one of nature’s ecological recorders. Trends Ecol. 2006, 21, 408–414. [Google Scholar] [CrossRef] [PubMed]
- Craig, H. Isotopic Variations in Meteoric Waters. Science 1961, 133, 1702–1703. [Google Scholar] [CrossRef] [PubMed]
- Bowen, G.J.; Wilkinson, B. Spatial distribution of δ18O in meteoric precipitation. Geology 2002, 30, 315–318. [Google Scholar] [CrossRef]
- Bowen, G.J.; Revenaugh, J. Interpolating the isotopic composition of modern meteoric precipitation. Water Resour. Res. 2003, 39, 1299. [Google Scholar] [CrossRef]
- Dansgaard, W. Stable isotope in precipitation. Tellus 1964, 16, 436–468. [Google Scholar] [CrossRef]
- Loik, M.E.; Breshears, D.D.; Lauenroth, W.K.; Belnap, J. A multi-scale perspective of water pulses in dryland ecosystems: Climatology and ecohydrology of the western USA. Oecologia 2004, 141, 269. [Google Scholar] [CrossRef] [PubMed]
- Du, B.; Kang, H.; Zhu, Y.; Zhou, X.; Yin, S.; Burgess, P.J.; Liu, C. Variation of oriental oak (Quercus variabilis) leaf δ13C across temperate and subtropical China: Spatial patterns and sensitivity to precipitation. Forests 2015, 6, 2296–2306. [Google Scholar] [CrossRef] [Green Version]
- Flanagan, L.B.; Ehleringer, J.R. Stable isotope composition of stem and leaf water: Applications to the study of plant water use. Funct. Ecol. 1991, 5, 270–277. [Google Scholar] [CrossRef]
- Xu, Q.; Li, H.; Chen, J.; Cheng, X.; Liu, S.; An, S. Water use patterns of three species in subalpine forest, Southwest China: The deuterium isotope approach. Ecohydrology 2011, 4, 236–244. [Google Scholar] [CrossRef]
- Rossatto, D.R.; de Carvalho Ramos Silva, L.; Villalobos-Vega, R.; Sternberg, L.D.S.L.; Franco, A.C. Depth of water uptake in woody plants relates to groundwater level and vegetation structure along a topographic gradient in a neotropical savanna. Environ. Exp. Bot. 2012, 77, 259–266. [Google Scholar] [CrossRef]
- Schwinning, S.; Starr, B.I.; Ehleringer, J.R. Summer and winter drought in a cold desert ecosystem (Colorado Plateau) part I: Effects on soil water and plant water uptake. J. Arid Environ. 2005, 60, 547–566. [Google Scholar] [CrossRef]
- Schachtschneider, K.; February, E.C. The relationship between fog, floods, groundwater and tree growth along the lower Kuiseb River in the hyperarid Namib. J. Arid Environ. 2010, 74, 1632–1637. [Google Scholar] [CrossRef]
- Rong, L.; Wang, S.J.; Yu, G.S.; Deng, X.Q.; Ran, J.C. Stable isotope analysis of water sources of four woody species in the Libo karst forest. Sci. Silvae Sin. 2012, 48, 14–22. [Google Scholar]
- Fu, P.L.; Liu, W.J.; Fan, Z.X.; Cao, K.F. Is fog an important water source for woody plants in an Asian tropical karst forest during the dry season? Ecohydrology 2016, 9, 964–972. [Google Scholar] [CrossRef]
- Querejeta, J.I.; Estrada-Medina, H.; Allen, M.F.; Jimenez-Osornio, J.J. Water source partitioning among trees growing on shallow karst soils in a seasonally dry tropical climate. Oecologia 2007, 152, 26–36. [Google Scholar] [CrossRef] [PubMed]
- Schwinning, S.; Sala, O.E.; Loik, M.E.; Ehleringer, J.R. Thresholds, memory, and seasonality: Understanding pulse dynamics in arid/semi-arid ecosystems. Oecologia 2004, 141, 191–193. [Google Scholar] [CrossRef] [PubMed]
- West, A.G.; Hultine, K.R.; Burtch, K.G.; Ehleringer, J.R. Seasonal variations in moisture use in a piñon–juniper woodland. Oecologia 2007, 153, 787–798. [Google Scholar] [CrossRef] [PubMed]
- Nie, Y.P.; Chen, H.S.; Wang, K.L.; Tan, W.; Deng, P.Y.; Yang, J. Seasonal water use patterns of woody species growing on the continuous dolostone outcrops and nearby thin soils in subtropical China. Plant Soil 2011, 341, 399–412. [Google Scholar] [CrossRef]
- Schwinning, S.; Starr, B.I.; Ehleringer, J.R. Dominant cold desert plants do not partition warm season precipitation by event size. Oecologia 2003, 136, 252–260. [Google Scholar] [CrossRef] [PubMed]
- Sun, S.J.; Meng, P.; Zhang, J.S.; Wan, X.C. Variation in soil water uptake and its effect on plant water status in Juglans regia L. during dry and wet seasons. Tree Physiol. 2011, 31, 1378–1389. [Google Scholar] [CrossRef] [PubMed]
- Ren, G.Y.; Zhan, Y.J.; Ren, Y.Y.; Chen, Y.; Wang, T.; Liu, Y.J.; Sun, X.B. Spatial and temporal patterns of precipitation variability over mainland China: I. Climatology. Adv. Water Sci. 2015, 26, 299–310. [Google Scholar]
- Huang, B.W. Comprehensive natural regionalization preliminary draft of China. Acta Geogr. Sin. 1958, 24, 348–365. [Google Scholar]
- Wu, S.H.; Yang, Q.Y.; Zheng, D. Delineation of eco-geographic regional system of China. J. Geogr. Sci. 2003, 13, 309–315. [Google Scholar]
- Mao, F.; Sun, H.; Yang, H.L. Research progress in dry/wet climate zoning. Prog. Geogr. 2011, 30, 17–26. [Google Scholar]
- Wu, H.; Li, X.-Y.; Jiang, Z.; Chen, H.; Zhang, C.; Xiao, X. Contrasting water use pattern of introduced and native plants in an alpine desert ecosystem, Northeast Qinghai-Tibet Plateau, China. Sci. Total Environ. 2016, 542, 182–191. [Google Scholar] [CrossRef] [PubMed]
- Wei, Y.F.; Fang, J.; Liu, S.; Zhao, X.Y.; Li, S.G. Stable isotopic observation of water use sources of Pinus sylvestris var. mongolica in Horqin Sandy Land, China. Trees 2013, 27, 1249–1260. [Google Scholar] [CrossRef]
- Song, L.; Zhu, J.; Li, M.; Zhang, J. Water use patterns of Pinus sylvestris var. mongolica trees of different ages in a semiarid sandy lands of Northeast China. Environ. Exp. Bot. 2016, 129, 94–107. [Google Scholar]
- Liu, S.B.; Chen, Y.N.; Chen, Y.P.; Friedman, J.M.; Hati, J.H.A.; Fang, G.H. Use of 2H and 18O stable isotopes to investigate water sources for different ages of Populus euphratica along the lower Heihe River. Ecol. Res. 2015, 30, 581–587. [Google Scholar] [CrossRef]
- Huang, M.S.; Du, X.N.; Liao, M.M.; Chen, L.Z.; Lin, G.H. Photosynthetic characteristics and water use strategies of coastal shelterbelt plant species in Southeast China. Chin. J. Ecol. 2012, 31, 2996–3002. [Google Scholar]
- Wang, P.Y.; Liu, W.J.; Li, J.T. Water use strategy of Ficus tinctoria in tropical rainforest region of Xishuangbanna, Southwestern China. Chin. J. Appl. Ecol. 2010, 21, 836–842. [Google Scholar]
- Deng, Y.; Kuo, Y.M.; Jiang, Z.; Qin, X.; Jin, Z. Using stable isotopes to quantify water uptake by Cyclobalanopsis glauca in typical clusters of karst peaks in China. Environ. Earth Sci. 2015, 74, 1039–1046. [Google Scholar] [CrossRef]
- West, A.G.; February, E.C.; Bowen, G.J. Spatial analysis of hydrogen and oxygen stable isotopes (“isoscapes”) in ground water and tap water across South Africa. J. Geochem. Explor. 2014, 145, 213–222. [Google Scholar] [CrossRef]
- Evaristo, J.; McDonnell, J.J. Prevalence and magnitude of groundwater use by vegetation: A global stable isotope meta-analysis. Sci. Rep. 2017, 7, 44110. [Google Scholar] [CrossRef] [PubMed]
- Zheng, S.H.; Hou, F.G.; Ni, B.L. A study on hydrogen and oxygen isotopes composition of precipitation in China. Chin. Sci. Bull. 1983, 28, 801–806. [Google Scholar]
- Liu, J.R.; Song, X.F.; Yuan, G.F.; Sun, X.X.; Liu, X.; Chen, F.; Wang, Z.M.; Wang, S.Q. Character istics of δ18O in precipitation over Northwest China andits water vapor sources. Acta Geogr. Sin. 2008, 63, 12–22. [Google Scholar]
- Huang, L.; Zhang, Z. Stable isotopic analysis on water utilization of two xerophytic shrubs in a revegetated desert area: Tengger Desert, China. Water 2015, 7, 1030–1045. [Google Scholar] [CrossRef]
- Duan, D.Y.; Hua, O.; Song, M.H.; Hu, Q.W. Water sources of dominant species in three alpine ecosystems on the Tibetan Plateau, China. J. Plant Sci. 2008, 50, 257–264. [Google Scholar] [CrossRef] [PubMed]
- Xing, X.; Chen, H.; Chen, T.T.; Han, L. Study of the water sources of Salsola abrotanoides under various precipitation conditions. J. Glaciol. Geocryol. 2015, 37, 1396–1405. [Google Scholar]
- Li, S.G.; Romero-Saltos, H.; Tsujimura, M.; Sugimoto, A.; Sasaki, L.; Davaa, G.; Oyunbaatar, D. Plant water sources in the cold semiarid ecosystem of the upper Kherlen River catchment in Mongolia: A stable isotope approach. J. Hydrol. 2007, 333, 109–117. [Google Scholar] [CrossRef]
- Liu, J.R.; Song, X.F.; Yuan, G.F.; Sun, X.M.; Liu, X.; Wang, S.Q. Characteristics of δ18O in precipitation over eastern monsoon China and the water vapor sources. Chin. Sci. Bull. 2009, 54, 3521–3531. [Google Scholar]
- Zhang, X.P.; Liu, J.M.; Masayoshi, N.; Xie, Z.C. Vapor origins revealed by deuterium excess in precipitation in Southwest China. J. Glaciol. Geocryol. 2009, 31, 31–37. [Google Scholar]
- Wu, X.D. Stable isotope compositions for meteoric water from Chengdu and their implication of climate. Acta Geol. Sin. 2009, 29, 52–54. [Google Scholar]
- Liu, W.J.; Li, P.J.; Li, H.M.; Zhang, Y.P.; Duan, W.P. Fog interception and its relation to soil water in the tropical seasonal rain forest of Xishuangbanna, Southwest China. Acta Ecol. Sin. 2006, 26, 9–15. [Google Scholar] [CrossRef]
- Tian, L.D.; Yao, T.D.; Zhang, Y.S.; Pu, J.C. Chemical characteristics of summer precipitation at Xixiabangma, Tibetan Plateau. Environ. Sci. 1998, 19, 1–5. [Google Scholar]
- Liu, Z.F.; Tian, L.D.; Yao, T.D.; Chai, X.R. Spatial distribution of δ18O in precipitation over China. Chin. Sci. Bull. 2009, 54, 804–811. [Google Scholar]
- Allison, G.B.; Hughes, M.W. The use of natural tracers as indicators of soil-water movement in a temperate semi-arid region. J. Hydrol. 1983, 60, 157–173. [Google Scholar] [CrossRef]
- Ellsworth, P.Z.; Williams, D.G. Hydrogen isotope fractionation during water uptake by woody xerophytes. Plant Soil 2007, 291, 93–107. [Google Scholar] [CrossRef]
- Dai, Y.; Zheng, X.J.; Tang, L.S.; Li, Y. Stable oxygen isotopes reveal distinct water use patterns of two Haloxylon species in the Gurbantonggut Desert. Plant Soil 2015, 389, 73–87. [Google Scholar] [CrossRef]
- Zhang, C.; Li, X.; Wu, H.; Wang, P.; Wang, Y.; Wu, X.; Li, W.; Huang, Y. Differences in water-use strategies along an aridity gradient between two coexisting desert shrubs (Reaumuria soongorica and Nitraria sphaerocarpa): Isotopic approaches with physiological evidence. Plant Soil 2017, 1–19. [Google Scholar] [CrossRef]
- Zhou, H.; Zhao, W.Z.; Zhang, G.F. Varying water utilization of Haloxylon ammodendron plantations in a desert-oasis ecotone. Hydrol. Process. 2017, 31, 825–835. [Google Scholar] [CrossRef]
- Yang, H.; Auerswald, K.; Bai, Y.; Han, X. Complementarity in water sources among dominant species in typical steppe ecosystems of Inner Mongolia, China. Plant Soil 2011, 340, 303–313. [Google Scholar] [CrossRef]
- Zhu, L.; Wang, Z.H.; Mao, G.L.; Zheng, S.X.; Xu, X. Water uptake from different soil depths for halophytic shrubs grown in northern area of Ningxia plain (China) in contrasted water regimes. J. Plant Interact. 2014, 9, 26–34. [Google Scholar] [CrossRef]
- He, C.X.; Chen, B.; Meng, P.; Zhang, J.S.; Yang, H.G. Interspecific water use strategies of a Juglans regia and Isatis tinctoria/Senna tora agroforestry system in a hilly area of Northern China. Chin. J. Plant Ecol. 2016, 40, 151–164. [Google Scholar]
- Lv, T.; Zhao, X.N.; Gao, X.D.; Pan, Y.H. Soil water use strategy of dominant species in typical natural and planted shrubs in loess hilly region. Chin. J. Plant Ecol. 2017, 41, 175–185. [Google Scholar]
- Gu, D.; Zhang, Z.; Mallik, A.; Zhou, A.; Mo, L.; He, C.; Huang, Y. Seasonal water use strategy of Cyclobalanopsis glauca in a karst area of southern China. Environ. Earth Sci. 2015, 74, 1007–1014. [Google Scholar] [CrossRef]
- Liu, W.; Li, J.; Lu, H.; Wang, P.; Luo, Q.; Liu, W.; Li, H. Vertical patterns of soil water acquisition by non-native rubber trees (Hevea brasiliensis) in Xishuangbanna, southwest China. Ecohydrology 2014, 7, 1234–1244. [Google Scholar] [CrossRef]
- Yang, B.; Wen, X.F.; Sun, X.M. Seasonal variations in depth of water uptake for a subtropical coniferous plantation subjected to drought in an East Asian monsoon region. Agric. For. Meteorol 2015, 201, 218–228. [Google Scholar] [CrossRef]
- Cao, J.H.; Yuan, D.X.; Pan, G.X. Some soil features in karst ecosystem. Adv. Earth Sci. 2003, 18, 37–44. [Google Scholar]
- Medina, E.; Cuevas, E.; Lugo, A.E.; Juan, S. Substrate chemistry and rainfall regime regulate elemental composition of tree leaves in karst forests. Forests 2017, 8, 182. [Google Scholar] [CrossRef]
- Deng, Y.; Jiang, Z.; Cao, J.; Li, Q.; Lan, F. Characteristics comparison of the leaf anatomy of Cyclobalanopsis glauca and its adaption to the environment of typical karst peak cluster areas in Nongla. Guihaia 2004, 24, 317–322. [Google Scholar]
- Nie, Y.P.; Chen, H.S.; Wang, K.L. Methods for determining plant water source in thin soil region: A review. Chin. J. App. Ecol. 2010, 21, 2427–2433. [Google Scholar]
- Si, J.; Feng, Q.; Cao, S.; Yu, T.; Zhao, C. Water use sources of desert riparian Populus euphratica forests. Environ. Monit. Assess. 2014, 186, 5469–5477. [Google Scholar] [CrossRef] [PubMed]
- Zhu, Y.J.; Jia, Z.Q.; Lu, Q.; Hao, Y.G.; Zhang, J.B.; Li, L.; Mu, Y.L. Water use strategy of five shrubs in Ulanbuh Desert. Sci. Silvae Sin. 2010, 46, 15–21. [Google Scholar]
- Cheng, X.; An, S.; Li, B.; Chen, J.; Lin, G.; Liu, Y.; Luo, Y.; Liu, S. Summer rain pulse size and rainwater uptake by three dominant desert plants in a desertified grassland ecosystem in northwestern China. Plant Ecol. 2006, 184, 1–12. [Google Scholar] [CrossRef]
- West, A.G.; Dawson, T.E.; February, E.C.; Midgley, G.F.; Bond, W.J.; Aston, T.L. Diverse functional responses to drought in a Mediterranean-type shrubland in South Africa. New Phytol. 2012, 195, 396–407. [Google Scholar] [CrossRef] [PubMed]
- Zhou, Y.D.; Chen, S.P.; Song, W.M.; Lu, Q.; Lin, G.H. Water-use strategies of two desert plants along a precipitation gradient in northwestern China. Chin. J. Plant Ecol. 2011, 35, 789–800. [Google Scholar] [CrossRef]
- Li, Y.F.; Yu, J.J.; Lu, K.; Wang, P.; Zhang, Y.C.; Du, C.Y. Water sources of Populus euphratica and Tamarix ramosissima in Ejina Delta, the lower reaches of the Heihe River, China. Chin. J. Plant Ecol. 2017, 41, 519–528. [Google Scholar]
- Zhu, J.J.; Chen, H.; Xing, X.; Chen, T.T. Quantification analysis of water sources of desert plants in Qaidam Basin: A case study of Golmud plot. Geogr. Res. 2015, 34, 285–292. [Google Scholar]
- Dawson, T.E.; Ehleringer, J.R. Streamside trees that do not use stream water. Nature 1991, 350, 335–337. [Google Scholar] [CrossRef]
- Bowling, D.R.; Schulze, E.S.; Hall, S.J. Revisiting streamside trees that do not use stream water: Can the two water worlds hypothesis and snowpack isotopic effects explain a missing water source? Ecohydrology 2017, 10, e1771. [Google Scholar] [CrossRef]
- Liu, Z.Q.; Yu, X.X.; Jia, G.D.; Jia, J.B.; Lou, Y.H.; Lu, W.W. Contrasting water sources of evergreen and deciduous tree species in rocky mountain area of Beijing, China. Catena 2017, 150, 108–115. [Google Scholar] [CrossRef]
- Sun, S.J.; Meng, P.; Zhang, J.S.; Jia, C.R.; Ren, Y.F. Ecosystems water use patterns of Quercus variabilis and Grewia biloba based on stable hydrogen and oxygen isotopes in the south aspect of Taihang Mountains. Acta Ecol. Sin. 2014, 34, 6317–6325. [Google Scholar]
- Yuan, D.X. Karstology of China; Geological Publishing House: Beijing, China, 1994. [Google Scholar]
- Deng, Y.; Jiang, Z.C.; Li, Y.Q.; Hu, Y. Water sources of typical plants in different rocky desertification grades in Guangxi. Trop. Geogr. 2015, 35, 416–421. [Google Scholar]
- Zhan, L.; Chen, J.; Li, L. Isotopic assessment of fog drip water contribution to vegetation during dry season in Junshan wetland, northern Dongting Lake. Wetl. Ecol. Manag. 2017, 25, 1–13. [Google Scholar] [CrossRef]
- Wang, L.; Shao, M.A.; Zhang, Q.F. Distribution and characters of soil dry layer in north Shaanxi Loess Plateau. Chin. J. Appl. Ecol. 2004, 15, 436–442. [Google Scholar]
- Wang, L.; Mu, Y.; Zhang, Q.; Zhang, X. Groundwater use by plants in a semi-arid coal-mining area at the Mu Us Desert frontier. Environ. Earth Sci. 2013, 69, 1015–1024. [Google Scholar]
- Zeng, Q.; Ma, J.Y. Plant water sources of different habitats and its environmental indication in Heihe River basin. J. Glaciol. Geocryol. 2013, 35, 148–155. [Google Scholar]
- Nie, Y.P.; Chen, H.S.; Wang, K.L.; Yang, J. Water source utilization by woody plants growing on dolomite outcrops and nearby soils during dry seasons in karst region of Southwest China. J. Hydrol. 2011, 420, 264–274. [Google Scholar] [CrossRef]
- Nie, Y.P.; Chen, H.S.; Wang, K.L. Seasonal variation of water sources for plants growing on continuous rock outcrops in limestone area of Southwest China. Chin. J. Plant Ecol. 2011, 35, 1029–1037. [Google Scholar]
- Walter, H. Grassland, Savanne und Busch der arideren Teile Afrikas in ihrer okologischen Bedingtheit, Jahrb. Wissensch. Bot. 1939, 87, 750–860. [Google Scholar]
- Brantley, S.L.; Eissenstat, D.M.; Marshall, J.A.; Godsey, S.E.; Balogh-Brunstad, Z.; Karwan, D.L.; Papuga, S.A.; Roering, J.; Dawson, T.E.; Evaristo, J.; et al. Reviews and syntheses: On the roles trees play in building and plumbing the critical zone. Biogeosciences 2017, 14, 5115–5142. [Google Scholar] [CrossRef]
- Ehleringer, J.R.; Phillips, S.L.; Schuster, W.S.F.; Sandquist, D.R. Differental utilization of summer rains by desert plants. Oecologia 1991, 88, 430–434. [Google Scholar] [CrossRef] [PubMed]
- Ward, D.; Wiegand, K.; Getzin, S. Walter’s two-layer hypothesis revisited: Back to the roots! Oecologia 2013, 172, 617–630. [Google Scholar] [CrossRef] [PubMed]
Figure 1.
The relationship between δD and δ18O values for precipitation and plant stem water. The hollow squares represent isotopic values for precipitation, the solid triangles represent isotopic values for plant stem water. A: Arid region; S-A: Semi-arid region; S-H: Semi-humid region; H: Humid region.

Figure 2.
Seasonal dynamics of the δ18O values in soil water (0–100 cm). A: Arid region; S-A: Semi-arid region; S-H: Semi-humid region; H: Humid region.
Figure 2.
Seasonal dynamics of the δ18O values in soil water (0–100 cm). A: Arid region; S-A: Semi-arid region; S-H: Semi-humid region; H: Humid region.

Figure 3.
Soil cluster analysis using δ18O values. x-axis, Squared Euclidean distance; y-axis, Soil depth (0–100 cm); (a) Arid region; (b) Semi-arid region; (c) Semi-humid region; (d) Humid region. The length of the black line represents the size of squared Euclidean distance, the nodes represent soil layers that have the nearest distance and were clustered into one group.

Figure 4.
Plants’ main water sources in the wet season.

Figure 5.
Plants’ main water sources in the dry season.

Figure 6.
Seasonal changes in the proportion of plant water sources. A: Arid region; S-A: Semi-arid region; S-H: Semi-humid region; H: humid region.
Figure 6.
Seasonal changes in the proportion of plant water sources. A: Arid region; S-A: Semi-arid region; S-H: Semi-humid region; H: humid region.

Figure 7.
Contribution of minor water sources. A: Arid region; S-A: Semi-arid region; S-H: Semi-humid region; H: humid region.
Figure 7.
Contribution of minor water sources. A: Arid region; S-A: Semi-arid region; S-H: Semi-humid region; H: humid region.
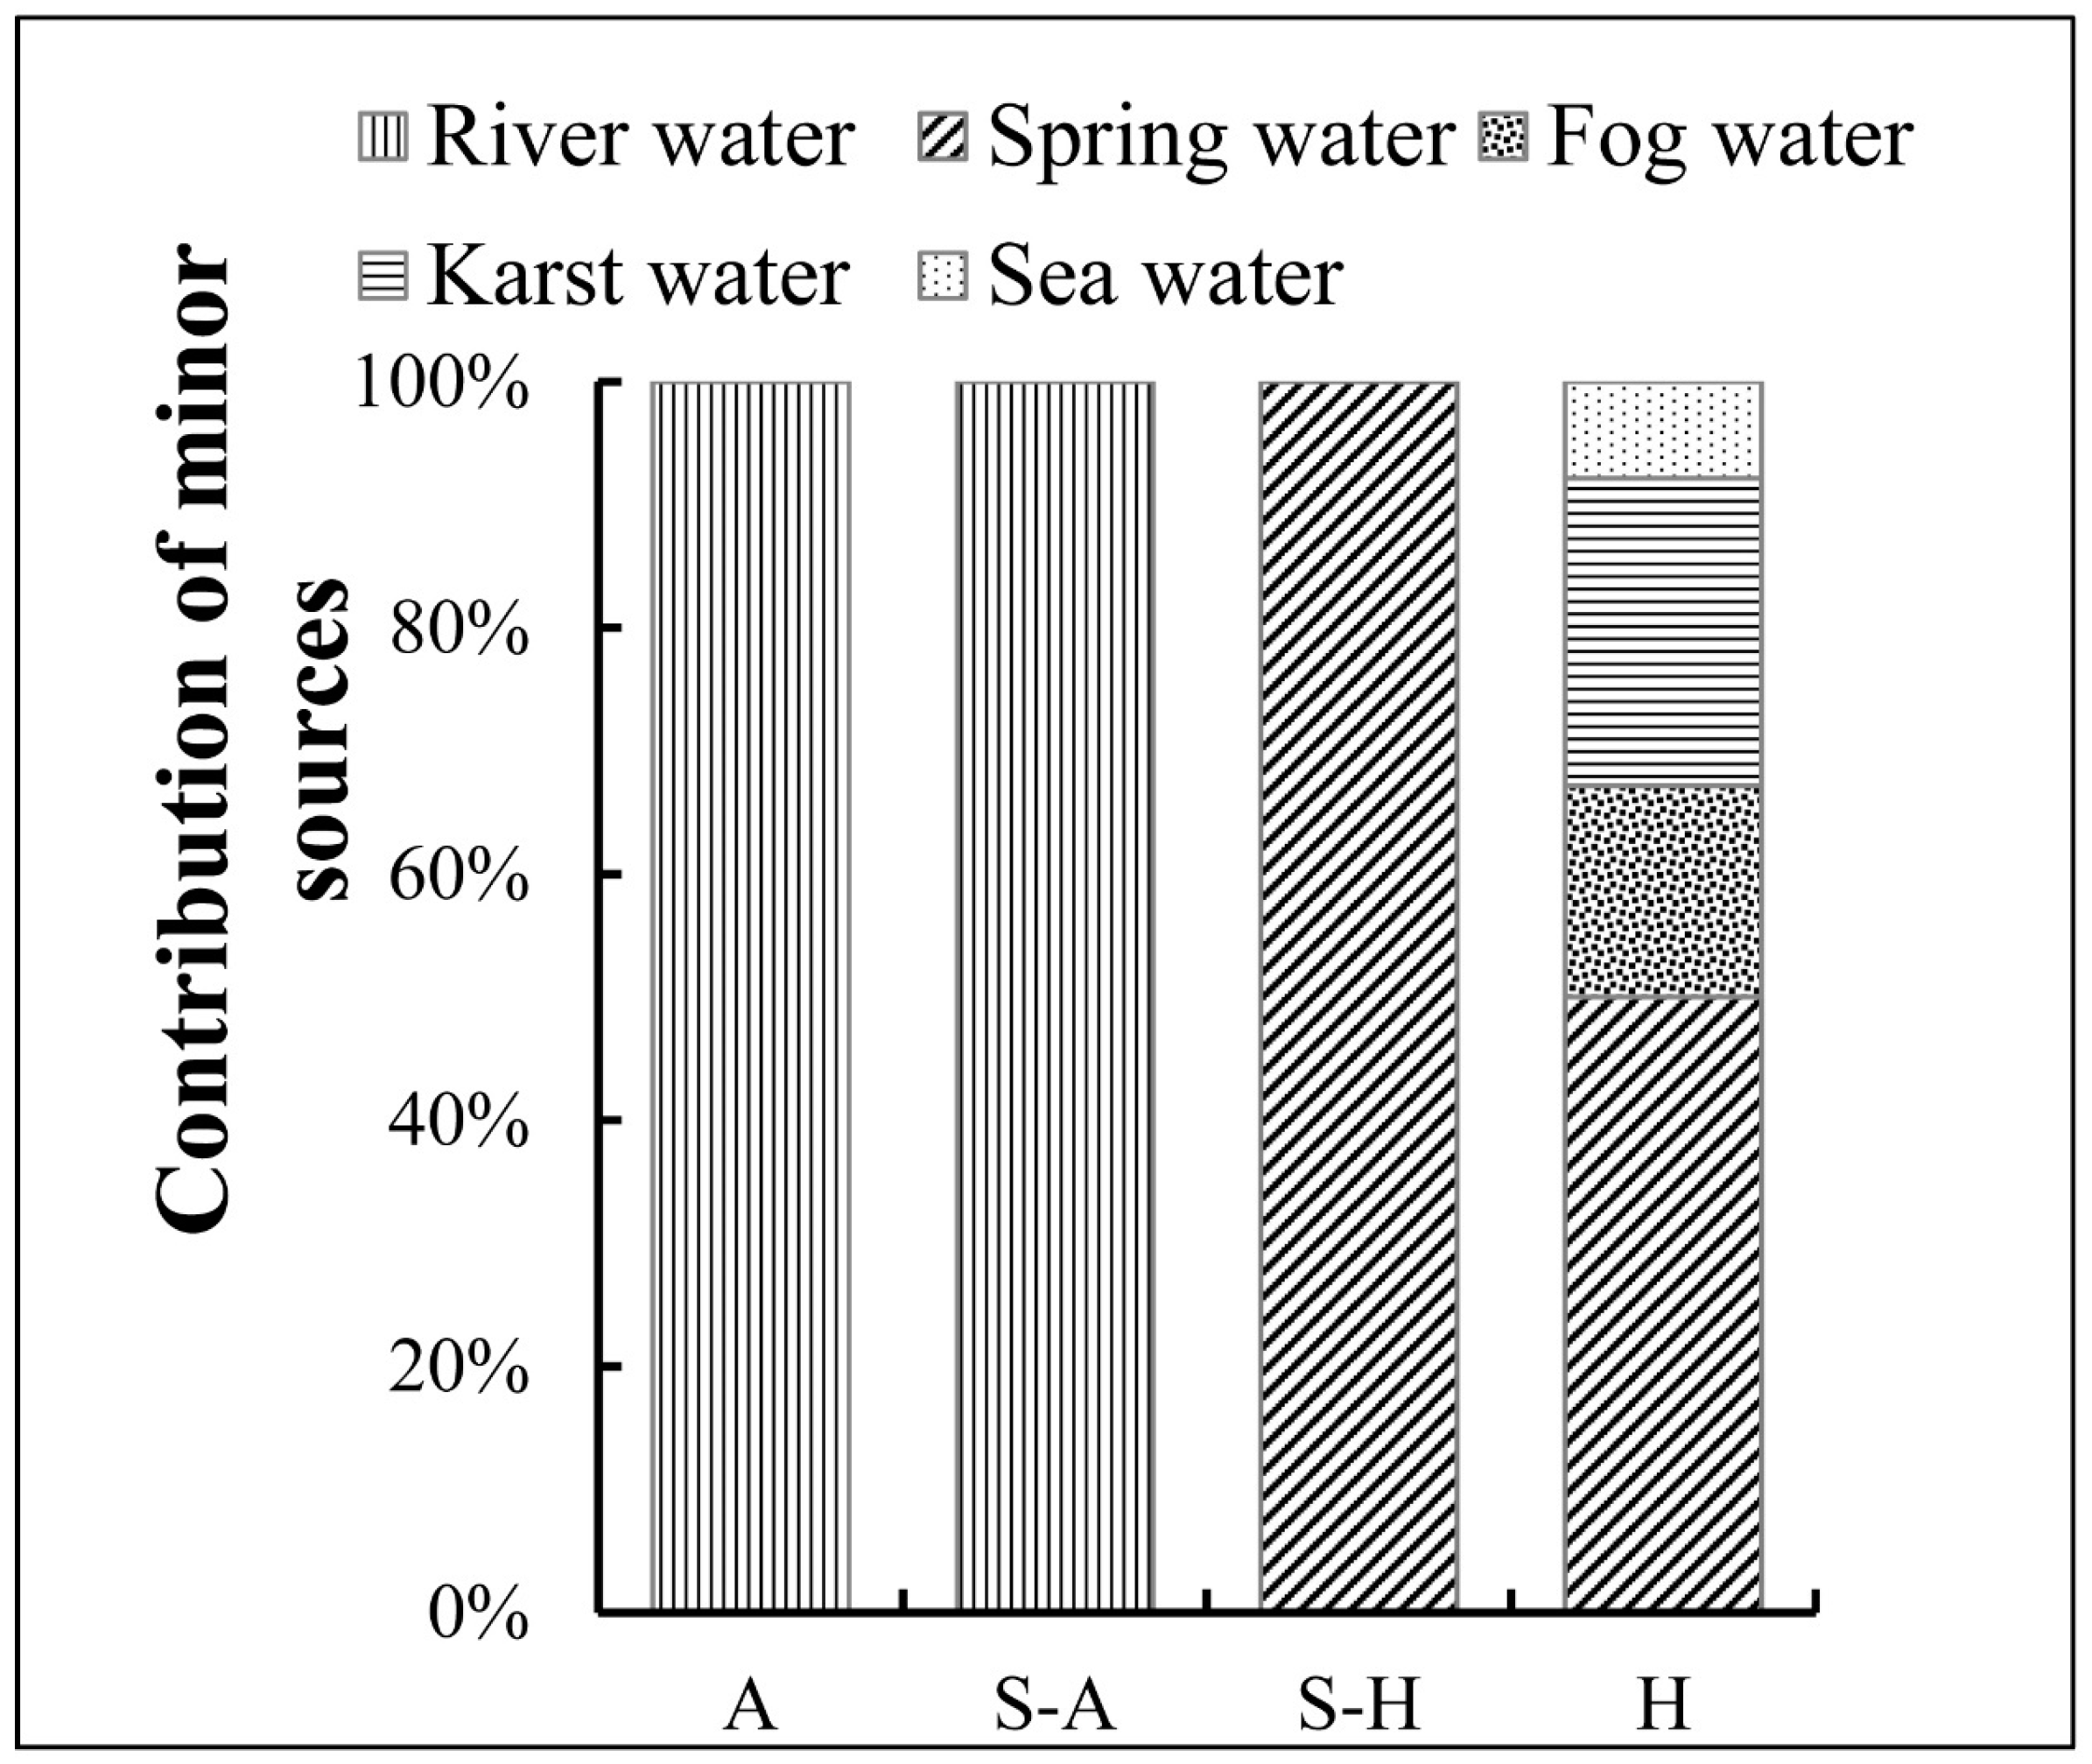
Figure 8.
Contribution of groundwater. CI: Confidence Interval; A: Arid region; S-A: Semi-arid region; S-H: Semi-humid region; H: humid region.
Figure 8.
Contribution of groundwater. CI: Confidence Interval; A: Arid region; S-A: Semi-arid region; S-H: Semi-humid region; H: humid region.

Figure 9.
Contribution of the plant main water source. A: Arid region; S-A: Semi-arid region; S-H: Semi-humid region; H: humid region; S: Shallow soil water; M: Middle soil water; D: Deep soil water; G: Groundwater; P: Precipitation; D + G: Combination of deep soil water and groundwater. Deep soil water and groundwater were classified as a group because of the small number of samples for groundwater.

Table 1.
The relationship between δD and δ18O values for precipitation and plant stem water.
| Region | Equation | R2 | N | Range of δD (‰) | Range of δ18O (‰) |
|---|---|---|---|---|---|
| GMWL | δD = 8 δ18O + 10 | 400 | |||
| LMWL of China | δD = 7.9 δ18O + 8.2 | 0.977 | 107 | ||
| LMWL of A | δD = 6.231 δ18O − 0.458 | 0.859 | 10,397 | −212~−43.6 | −30.79~−8.56 |
| LMWL of S-A | δD = 7.283 δ18O − 1.457 | 0.995 | 4888 | −238.5~−75 | −32.5~−11.4 |
| LMWL of S-H | δD = 7.652 δ18O + 5.34 | 0.993 | 9079 | −219.5~−29.9 | −30.2~−5.0 |
| LMWL of H | δD = 8.067 δ18O + 12.304 | 0.989 | 9240 | −251.5~8.1 | −32.23~0.13 |
| PSWL of A | δD =5.189 δ18O − 26.909 | 0.791 | 23 | −92~−18.36 | −13~+3.2 |
| PSWL of S-A | δD =7.088 δ18O − 16.539 | 0.781 | 34 | −98~−40 | −11~−2.3 |
| PSWL of S-H | δD =6.117 δ18O − 21.386 | 0.814 | 30 | −88~−32 | −11.5~−2.3 |
| PSWL of H | δD =7.596 δ18O − 5.773 | 0.89 | 43 | −94~−21.5 | −10.9~−2 |
GMWL: Global Meteoric Water Line; LMWL: Local Meteoric Water Line; PSWL: Plant Stem Water Line; A: Arid region; S-A: Semi-arid region; S-H: Semi-humid region; H: Humid region. N represents the number of samples.
Table 2.
The results of our soil classification.
| Region | Previous Studies | The Preliminary Results of Cluster Analysis | Final Results | |||
|---|---|---|---|---|---|---|
| Author | Location | Classification/cm | Classification/cm | SED | Reclassification/cm | |
| A | Dai et al. (2015) | Gurbantonggut Desert | 0–40, 40–100, 100–300, | 0–10, 10–20, 20–40, 40–80, 80–100 | 5 | 0–40, 40–100, >100 |
| Zhou et al. (2017) | Badain Jaran Desert | 0–50, 50–150, 150–300 | ||||
| Zhang et al. (2017) | Heihe River Basin | 0–30, 30–80, 80–200 | ||||
| S-A | Yang et al. (2011) | Inner Mongolia | 0–20, 20–40, >40 | 0–10, 20–30, 30–60, 60–100 | 2.5 | 0–30, 30–60, >60 |
| Wu et al. (2016) | Tibet Plateau | 0–30, 30–60, 60–120 | ||||
| Zhu et al. (2014) | Ningxia plain | 0–40, 40–140, 140–200 | ||||
| S-H | Liu et al. (2017) | Huabei plain | 0–20, 20–60, 60–100 | 0–10, 10–20, 20–60, 60–100 | 5 | 0–20, 20–60, >60 |
| He et al. (2016) | Huabei plain | 0–30, 30–100 | ||||
| Lv et al. (2016) | Loess plateau | 0–10, 10–40, 40–80, 80–120 | ||||
| H | Rong et al. (2014) | karst area | 0–10, >10 | 0–5, 5–10, 10–40, 40–100 | 5 | 0–10, 10–40, >40 |
| Gu et al. (2015) | karst area | 0–5, 5–30, 30–50, 50–90 | ||||
| Yang et al. (2015) | Jitai Basin | 0–20, 20–50, 50–100 | ||||
SED: Squared Euclidean distance; A: Arid region; S-A: Semi-arid region; S-H: Semi-humid region; H: Humid region. In the semi-arid region, δ18O values are relatively stable compared to the other regions so that squared Euclidean distances were separated into classes using a value of 2.5.
© 2018 by the authors. Licensee MDPI, Basel, Switzerland. This article is an open access article distributed under the terms and conditions of the Creative Commons Attribution (CC BY) license (http://creativecommons.org/licenses/by/4.0/).
Share and Cite
MDPI and ACS Style
Zhao, Y.; Wang, L. Plant Water Use Strategy in Response to Spatial and Temporal Variation in Precipitation Patterns in China: A Stable Isotope Analysis. Forests 2018, 9, 123. https://doi.org/10.3390/f9030123
AMA Style
Zhao Y, Wang L. Plant Water Use Strategy in Response to Spatial and Temporal Variation in Precipitation Patterns in China: A Stable Isotope Analysis. Forests. 2018; 9(3):123. https://doi.org/10.3390/f9030123
Chicago/Turabian StyleZhao, Ying, and Li Wang. 2018. "Plant Water Use Strategy in Response to Spatial and Temporal Variation in Precipitation Patterns in China: A Stable Isotope Analysis" Forests 9, no. 3: 123. https://doi.org/10.3390/f9030123
Note that from the first issue of 2016, this journal uses article numbers instead of page numbers. See further details here.