Article

Allocation of Storage Yards in Management Plans in the Amazon by Means of Mathematical Programming

by
Evandro Ferreira da Silva
1,*,
Gilson Fernandes Da Silva
1,
Evandro Orfanó Figueiredo
2,
Daniel Henrique Breda Binoti
1,
Adriano Ribeiro de Mendonça
1,
Carlos Moreira Miquelino Eleto Torres
3 and
José Eduardo Macedo Pezzopane
1
1
Department of Forest Sciences and wood, Federal University of Espirito Santo (UFES), Av. Governador Lindemberg, Jerônimo Monteiro 29550-000, ES, Brazil
2
Brazilian Agricultural Research Corporation (EMBRAPA-Acre), BR-364, km 14, Rio Branco 69900-970, AC, Brazil
3
Department of Forest Engineering, Federal University of Viçosa (UFV), Viçosa 36570-000, MG, Brazil
*
Author to whom correspondence should be addressed.
Forests 2018, 9(3), 127; https://doi.org/10.3390/f9030127
Submission received: 19 November 2017 / Revised: 2 February 2018 / Accepted: 17 February 2018 / Published: 8 March 2018

Abstract

:
The present study aimed to optimize the location of wood storage yards in forest management for the production of wood in the Brazilian Amazon. The area of forest management studied was 638.17 ha, with 1478 trees selected for harvest with a diameter at breast height of at least 50 cm in accordance with Brazilian legislation. Taking the topography into account—permanent preservation areas, restricted areas, and remaining trees—and using GIS tools, 7896 sites were identified that could be used as wood storage yards. By using mathematical programming techniques, more specifically binary integer linear programming, and based on the classical p-median model, optimal locations for the opening of yards were defined. Four scenarios were proposed combining distance and volume constraints. The scenarios evaluated promoted reductions in infrastructure investment compared with traditional planning. The results showed reductions in the number of forest roads (–6.33%) and trails to extract logs (–15.49%) when compared to traditional planning. The best performing scenario was that with the maximum volume restriction. It was concluded that the application of mathematical programming was able to promote significant gains in the harvest planning of native forests of the Amazon with the potential to reduce environmental damage.

Graphical Abstract

1. Introduction

Native tropical forests represent approximately 10% of the existing land surface [1], and about 96% of the tree species [2]. The predatory exploitation of forest resources has resulted in national and international pressure and policies related to their conservation and use [3]. The Brazilian Government has regulated the use of natural resources in the Brazilian Amazon [4]. To meet these regulations, one of the main tools for the rational use of forests is called sustainable forest management (SFM). SFM aims to apply management and reduced impact exploration techniques that are suitable for the sustainable use of forest resources [5,6], being set by the SFM plan that guides all exploitation and management activities of forests in Brazil [7]. In the case of the Amazon, the main objective of SFM is to facilitate the exploitation of renewable forest resources, in particular wood, based on the reduction of waste and the impact on the remaining forest, as well as to ensure greater safety for workers [8] and maintenance of the ecosystem [9]. The economic viability of the use of forest resources and the feasibility of forest management techniques are important to ensure economic, social and environmental development [5,10,11,12,13,14], where one of the main challenges is the balance between economic and environmental objectives [15].
In this sense, the infrastructure planning of the forest management area, such as the definition of roads, places of wood storage yards and skidtrails, is a complex process and has a direct connection with the harvesting costs and environmental impacts generated [16,17]. In tropical forests, this complexity becomes even greater due to the great diversity of species, the size of the trees, the different types of forest, among other factors. Thus, the definition of infrastructure is part of harvest planning at the operational level, being crucial in the generation of forest production costs [18,19,20].
The use of new technologies and methodologies, which enables better precision in forest management in the planning and execution of the SFM plan, has been regarded as precision forest management (PFM) [21,22]. In planning and implementing the activities of PFM, the use of computational, mathematical, and spatial tools, along with operational research techniques, allows the decision-making process to be optimized in several aspects, especially in terms of the legal, environmental, economic, social, and technical goals.
Traditionally, the planning of the forest road infrastructure, wood storage yards and skidtrails in the PMFS located in the Brazilian Amazon, is carried out manually by forest engineers. The use of the manual method is performed according to the experience of the managers using tools such as topographic maps and the spatial database, with information of the terrain to aid in decision makin [23,24,25].
As a rule, the manual method of infrastructure planning leads to the loss of economic performance, as well as being a time consuming process, without a clear idea of the nearness of an optimal solution [26]. In this way, it can be said that this is an empirical and intuitive process, suffering from the strong influence of the human component, that is, it depends heavily on the experience of the one who performs the work. In addition, the time of elaboration is linearly associated with the quantity of area to be planned, with reduced flexibility in the case that the planning needs to be changed, which makes it difficult to compare different proposed plans. It should be noted that the roads and skidtrails can represent up to about 50% of the total costs of the harvest [27,28].
The planning of the exploitation activities, assuming reduced impact techniques, both in field activities and in infrastructure planning, has been considered crucial in management areas located in tropical forests, because it enables greater safety of operations and a reduction in environmental impacts, which are invaluable over time [29,30,31,32,33,34]. Among the activities of logging, wood storage yards, the extraction of logs, and the construction of forest roads are of paramount importance in light of the environmental impacts caused mainly by the need for forest cover removal when opening forest roads and wood storage yards. In addition to the environmental impacts, the costs related to the opening of roads and extracting logs are the most significant in forest management. Optimizing yard locations will result in a greater efficiency of the production chain [35,36,37,38,39,40], providing environmental and economic gains.
The complexity of elaborating the planning of forest harvesting infrastructure in an optimal way considering numerous variables, in a systematized form and in a viable time, motivated numerous researches about the problem [25,41,42].
The graphs theory and computational system were applied to determine the best forest road routes in the Amazon for the harvesting of wood and the behavior of forest fragmentation as a function of the road network [43]. Using aerial laser scanner technology and GIS, it was possible to define extraction trails in a pine forest [44]. Using raster-based GIS data, it was possible to create a model that determines individual skidtrails for a stacking site by selecting the best landing site that minimizes extraction distance by reducing costs [17]. Through operational research and GIS [45], they developed a binary integer programming model, similar to the location problem of the facility, capable of defining optimal locations of storage yards. Other researches such as those of [16,46,47,48] also studied forest harvesting planning.
Studies aiming to optimize the planning of yard allocation in the Amazon are incipient; in [49,50,51,52], the application of mathematical programming was studied in planning the location of wood storage yards in the sustainable forest management plan (SFMP) through the p-median model. The p-median problem is that of locating p facilities to minimize the distance between demand nodes and the facilities selected. The class of location–allocation problems is defined among p facilities (shops, warehouses, schools and police stations, for example) that aim to meet certain n demand points (residences, neighborhoods, customers, and regions) resulting in the p locations that will be opened to meet each demand point [53,54,55,56,57,58,59,60].
As mentioned previously, forest harvesting planning in Brazilian Amazon SFM areas is done manually based on GIS tools, forest inventory data and the land information database. In light of the above discussion, the objective of this study is to determine the optimal location of wood storage yards, under the SFM, in native forest of the Amazon, where there is no road infrastructure and skidtrails; mathematical programming is employed to simulate different scenarios depending on the final harvest planning.

2. Materials and Methods

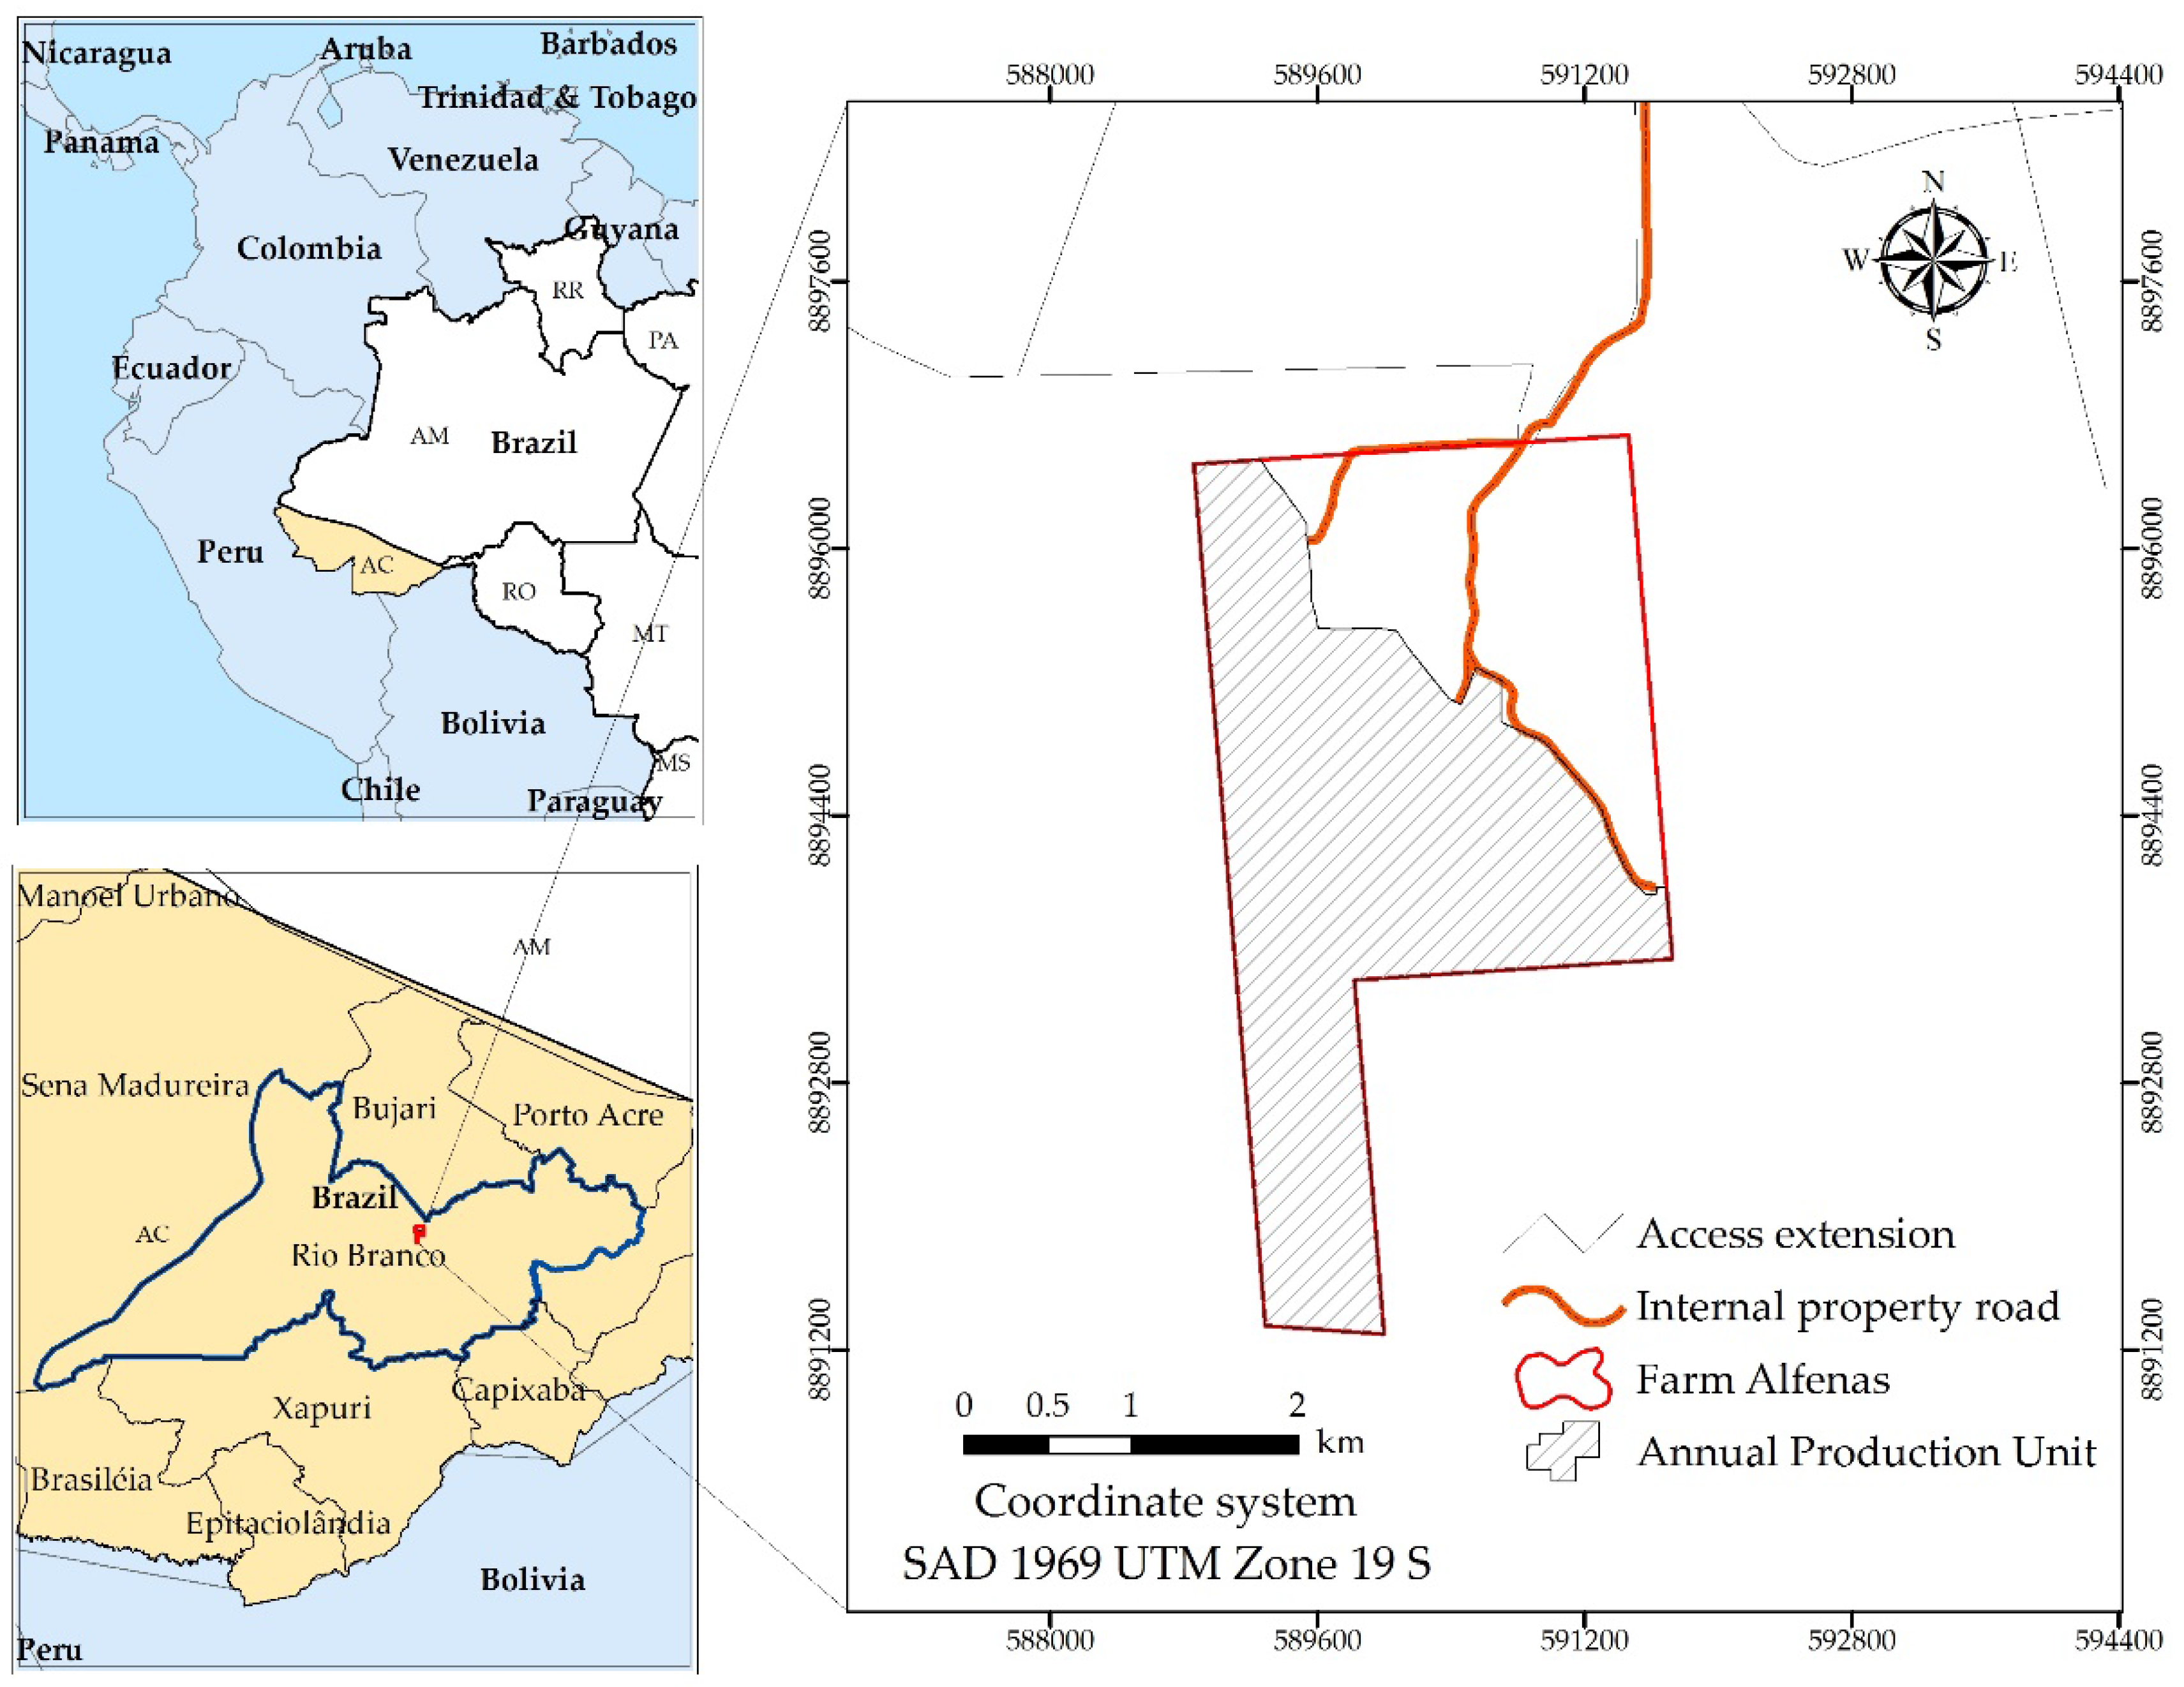
2.1. Description of the Study Area

The study area is located in the municipality of Rio Branco-Acre (9°58′26” South, 67°48′27” West), in the northern region of Brazil bordering Bolivia and Peru (Figure 1). The dominant vegetation is open forest with bamboo, with small fasciation of dense forest, characterized by an average volume of 150 m3 ha–1 [61,62].
The forest management area of the present study corresponds to a single annual production unit (APU) which corresponds to the area that will be explored during the respective year. This has 638.17 ha, and 72.76 ha of permanent preservation area (PPA). The PPAs are areas defined by Brazilian legislation where woodcutting is prohibited. Some criteria that define this type of area are the margins of springs and rivers, the tops of hills, and areas with slopes up to 45°. Through the forest inventory census, 1478 individual trees standing with commercial value were selected in the APU for exploration, with diameter above 50 cm in accordance with Brazilian legislation [7], totaling an estimated volume of 10,713.74 m3. Subtracting the area of the PPA from the volume estimated by the APU area, the average potential exploration is 18.95 m3 ha–1. It is noteworthy that Brazilian legislation authorizes exploration up to 30 m3 ha–1 [63].

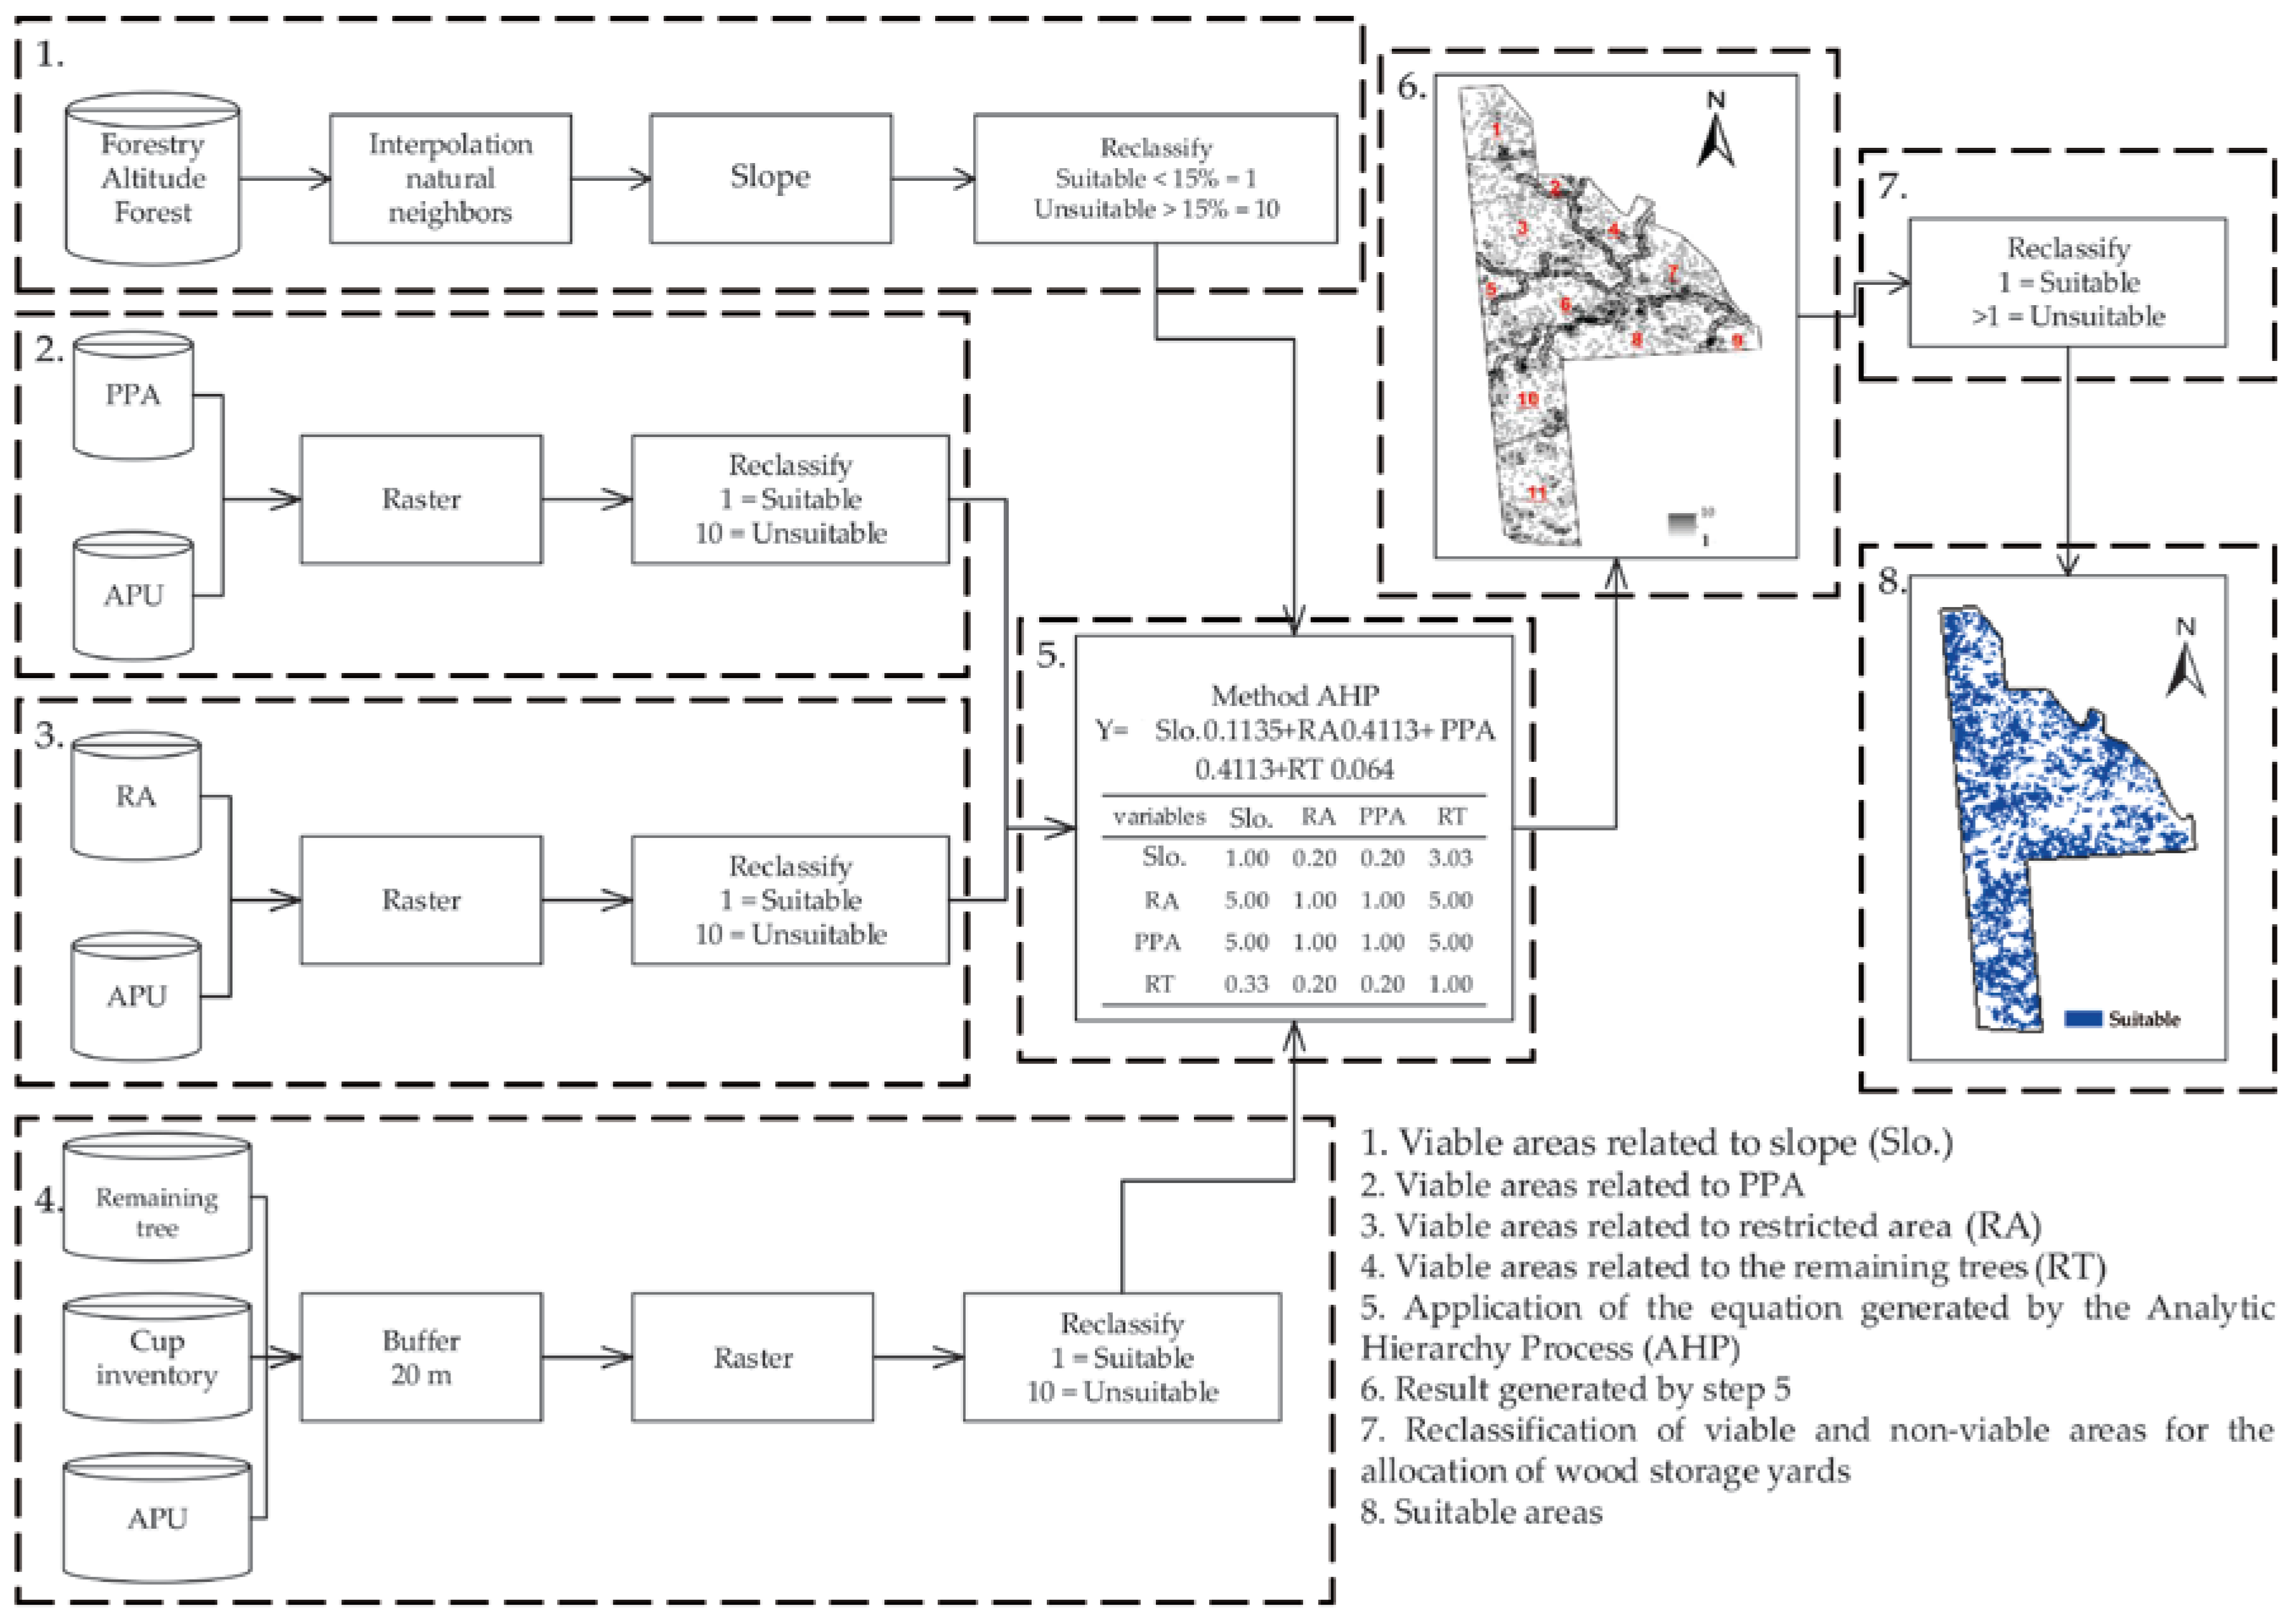
2.2. Definition of Suitable Areas for the Allocation of Storage Yards

To select suitable areas for the construction of storage yards, a number of factors must be considered including the slope (Slo.), the presence of PPAs, remaining trees (RT) and areas that present any physical limitation for deploying yards, considered as restricted area (RA) [51]. As a result, we describe how these factors were considered in defining the final map of suitable areas for building yards. To assist in this analysis, we used the software ArcGis®10.2 [64], as illustrated in Figure 2.

2.2.1. Definition of Areas Eligible Based on Slope

During the identification of suitable locations for yards as a function of the relief, an interpolation by natural neighbors was performed from approximately 3000 barometric points collected in the forest inventory.
Through the slope tool, the model of slope was created, according to the procedure described in [65]. A maximum slope of 15% was established following the methodology in [51]. The location of the wood storage yards should be in a flat, well-drained area. Up to 15% is close to corrugated areas according to [65]; this value was adopted by [51] and considered feasible in the present work. Areas above the established value were considered restricted for the allocation of storage yards. Subsequently, the reclassification was carried out with a value for suitable areas of 1 and a value of 10 for unsuitable areas. As such, values greater than10 represent areas unsuitable for the allocation of wood storage yards.

2.2.2. Influence of the PPA in the Definition of Eligible Areas

The identification of the PPA is a crucial point in forest management, as Brazilian legislation prohibits the opening of yards within these areas. Thus, the polygon of the PPA was combined with the APU area, and the image, was transformed into a raster image with areas outside the PPA being considered suitable for the SFM; areas outside the PPA were assigned the value 1 and areas within the PPA were assigned the value 10.

2.2.3. Obtaining Suitable Areas Relating to Restricted Areas

The restricted zone file was obtained from the management plan database. These areas can be classified as places that create sudden gaps, which hinder the construction of roads, opening of yards, and the creation of walking trails. Basically, they are areas observed in the field during the forest inventory, which are unviable for infrastructure installation. Generally, they are defined by the operational management manager.
With that file, the APU was combined with the restricted zones, and subsequently transformed into a raster image and reclassified with a value of 1 assigned to areas outside the restricted zone (suitable) and 10 assigned to areas within (unsuitable).

2.2.4. Definition of Areas Suitable for the Remaining Trees

An important factor considered was the remaining forest. The area of each tree was represented by a buffer of 20 m, excluding from the database only those individual trees selected for harvesting, that is, a buffer of trees that could not be harvested was performed. The inventory of tree canopies identified that large size trees will not be harvested and are not part of the commercial species [21].
Later, we joined the image buffer of the inventory of tree canopies with the remaining individual trees and the method of the APU and created a raster image, with a value of 1 assigned to areas outside the buffer (suitable) and 10 assigned to areas within (unsuitable).

2.2.5. Weighted Overlay of Raster Images

We applied the analytic hierarchy process (AHP) method, proposed by Saaty [66,67], to set the suitable areas. The method is a multi-criteria decision-making tool. Using a numerical scale, we calibrated the amplitude of importance of quantitative and qualitative criteria. The scale ranges from 1 to 9, with “less important than” represented by 1 and “absolutely more important than” represented by 9 covering the entire spectrum of comparison [66,67]. In this work, we considered the criteria declivity, restricted areas, presence of PPAs, and remaining trees. The definition of weights was based on the literature and information gathered during the research related to the production process. For image processing, we used the extension of Arcgis®10.2 [64] called AHP, obtained from the Environmental Systems Research Institute (ESRI) Scripts website. More details about the AHP method can be found in [68].
The equation obtained in item 5 in Figure 2 through the analytic hierarchy process (AHP) method allowed the weighted overlay to be calculated and then the definition of areas suitable for the allocation of yards was about 271 ha.
The AHP method was also compared with fuzzy analysis for the identification of potential energy wood terminal locations by [69]; the fuzzy analysis made it possible to evaluate the transition areas with continuous gradation more adequately. The authors of [70] also used fuzzy analysis to define suitable areas for the installation of power plants and subsequently applied the mathematical allocation–location programming model to define the optimal installation site.
Thus, the AHP method allows a satisfactory analysis of the appropriate areas for the allocation of wood storage yards, being a technique that indicates clearly defined objectives, such as the degree of importance of the variable in relation to another variable [71].

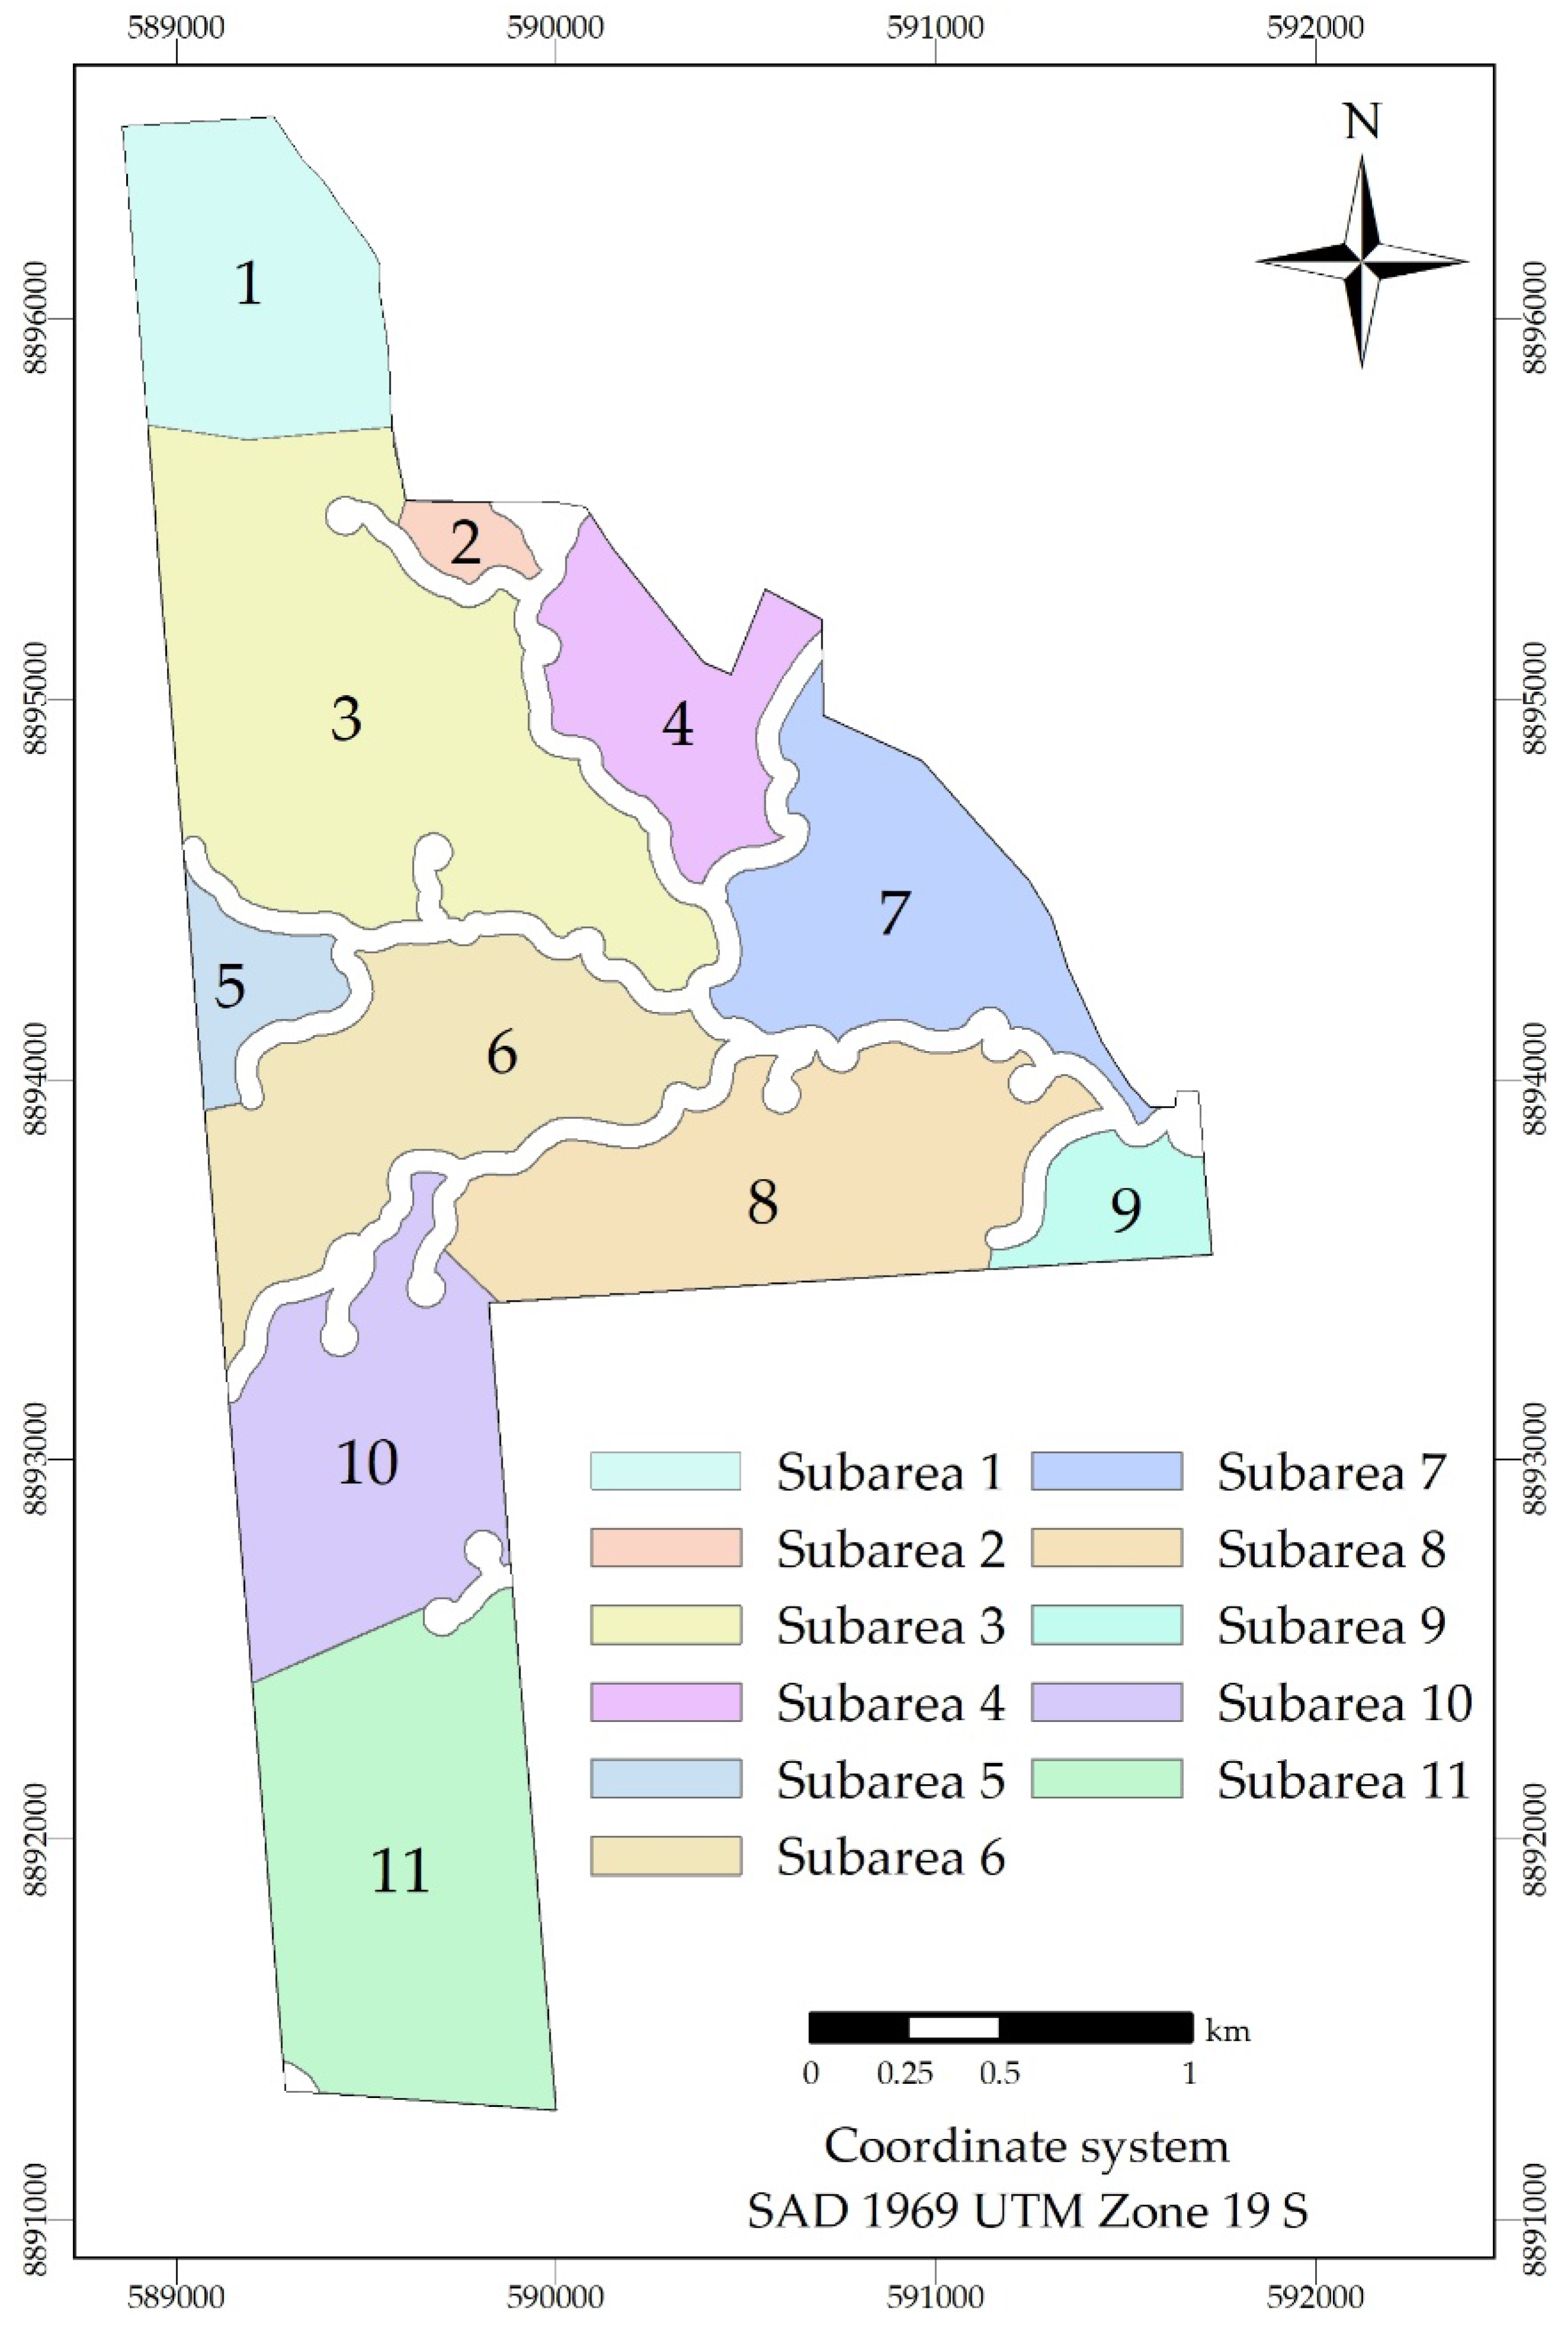
2.2.6. Division of Suitable Area in Subareas

As mentioned previously, the APU presents a total area of 638.17 ha. By eliminating unsuitable areas (PPA, restricted areas, remaining trees, and declivity), approximately 271 ha remained suitable for building wood storage yards.
This suitable area is not area continuous and is permeated by unsuitable areas. For example, a suitable area may be separated from another suitable area by a PPA. This can hinder the extraction of harvested trees that would be taken to the storage yard since Brazilian law prohibits trees from being extracted within the PPA. This example illustrates the need for subareas to be created, which in practice means that each subarea will need to have at least one yard to avoid extraction in areas where this would be unworkable. Owing to this, the APU was partitioned into 11 subareas, as shown in Figure 3.
There is no specific methodology to guide the construction of subarea boundaries. In this way, the subdivision must be carried out according to the experience of the forest manager. The same methodology was applied by [51].

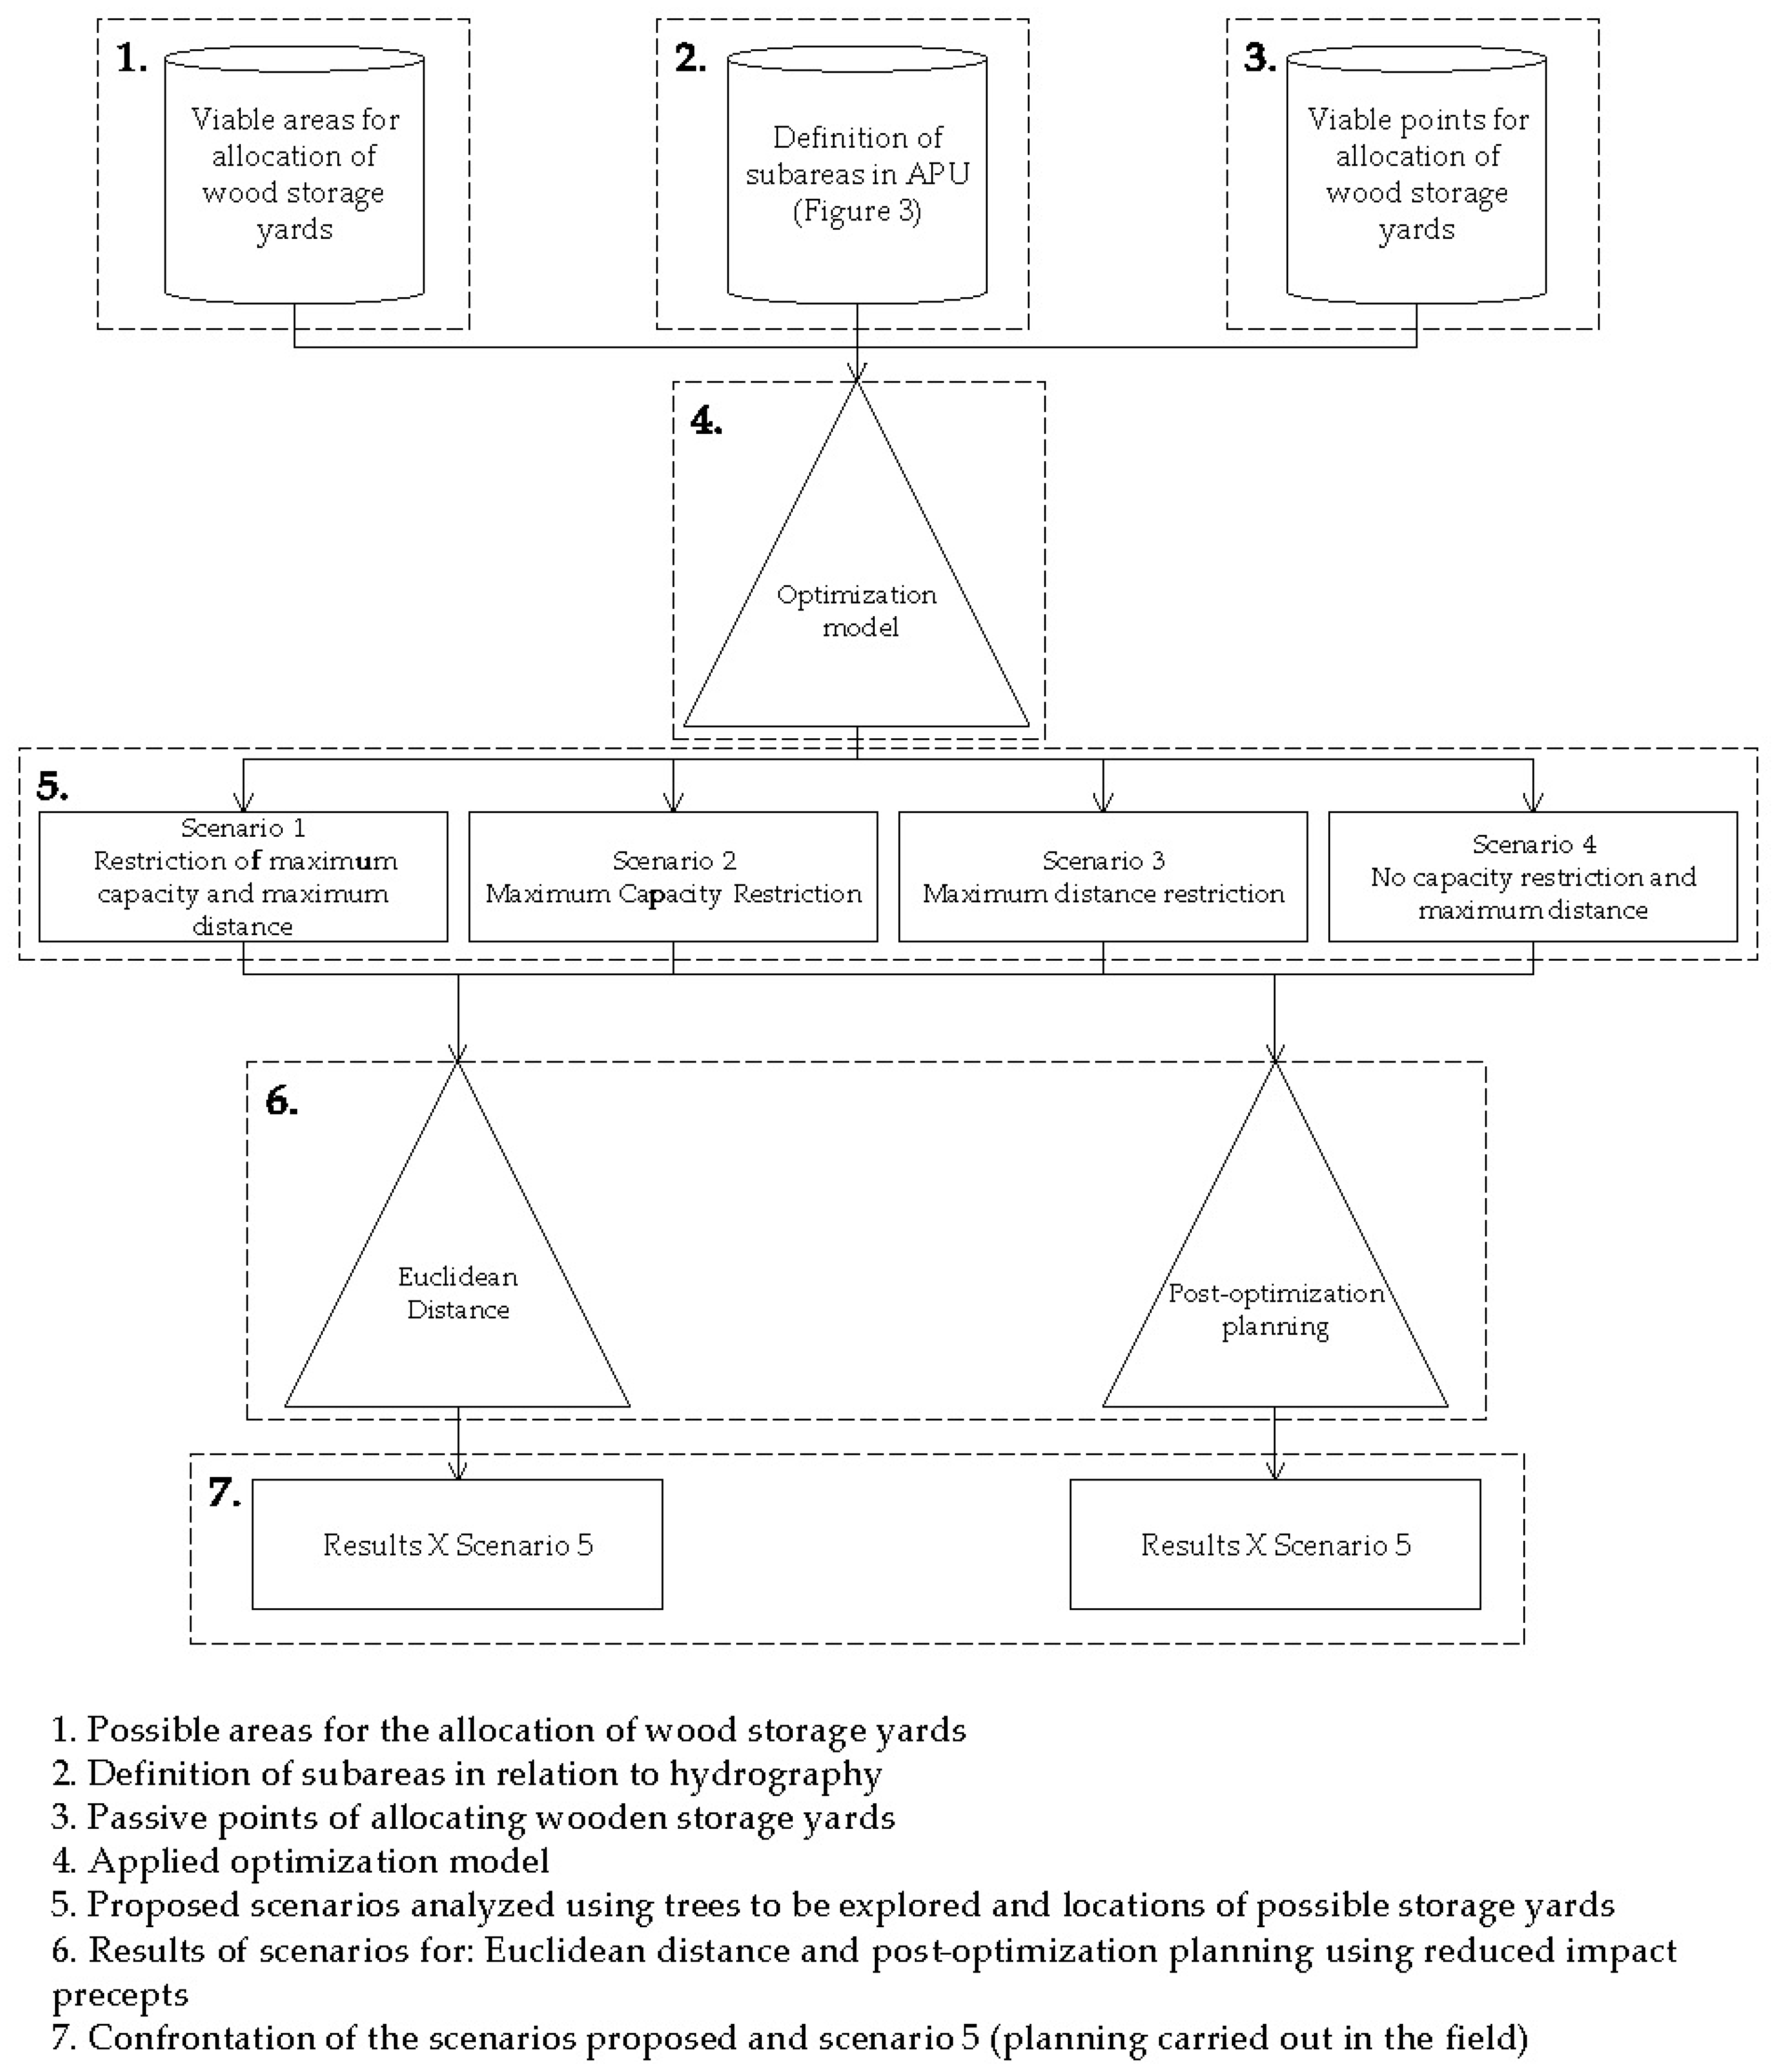
2.3. Optimization Model for the Allocation of Storage Yards

The goal of the optimization model is to minimize the distance between where the harvested trees must be extracted and each storage yard. In Figure 4, we present the schema for the operation of the model, starting with the definition phase of the areas suitable for the allocation of yards (Step 1) and its respective subdivision (Step 2). For each subdivision (Figure 3), Step 3 proceeded, which finds all possible yards (P) for each subarea. Steps 1–3 are the only inputs of the model. Step 4 of the figure represents effectively the optimization models used and their respective scenarios, which are simply variations of the model, as will be described in detail in the following. Steps 5 and 6 are associated with the results of the model and its reality check (i.e., validation).
Steps 1 and 2 are described in detail in Section 2.2.1, Section 2.2.2, Section 2.2.3, Section 2.2.4, Section 2.2.5 and Section 2.2.6. To perform Step 3, we define the regular grid of possible yards, measuring 25 × 25 according to [51], only in areas defined as suitable in Step 8 in Figure 2. To improve the refinement of the same location, we defined a central point in each mesh grid. Subsequently, the vertices of the grid were converted into points. It results in 7896 locations with the potential of installation of one storage yard.
Step 4 consists of defining the optimization model itself, which is the classic model of p-medians studied widely in various applications with numerous variations [53,59,72,73,74,75,76,77,78,79,80,81]. Thus, the model proposed in this paper is now presented in detail explaining all its variables and constraints:
Minimize : i = 1 n j = 1 P d i j x i j
Subject to:
j = 1 P x i j = 1
j = 1 P Y j = p
x i j Y j 0
i = 1 n q i x i j Q j
d i j x i j D max
where i is a tree; j is a yard; P is the total number of yards that can be allocated in a given subarea; dij is the Euclidean distance (m) from tree i to the yard j; p is the number of yards to be effectively allocated (pP) and Xij is a binary variable (0 or 1) that takes the value 1 if the tree i should be extracted into the yard j and 0 otherwise; Yj is a binary variable (0, 1), assuming the value 1 if selected and 0 otherwise; q i is the volume of the tree i; Qj is the maximum volume (m3) of the yard j; and Dmax is the maximum distance (m) at which the tree i can be extracted to the yard j.
The objective function (OF) (1) minimizes the sum of the Euclidean distances between each tree and yard to which they will be extracted. The first constraint (2) ensures that each tree cannot be extracted to more than one yard. The second constraint (3) ensures that from all possible yards (P) in a particular subarea, only a certain number of yards will be selected (p). In practice, this restriction ensures that a reduced number of yards (p) is allocated, i.e., the selection of p in P. The calculation of p is introduced in the following. The third constraint (4), associated with the second constraint (3), allows us to decide whether yard p is selected within P. The fourth constraint (5) ensures that the maximum capacity of the storage yard (maximum volume stored) (Qj) is not exceeded; and the constraint (6) ensures that a tree i is not extracted to a yard j that is further than the maximum extraction distance (Dmax).
To calculate p, some factors should be considered. Brazilian legislation suggests that the maximum area of a yard should be 500 m2 (20 m × 25 m), but there are no restrictions on the volume stored. For safety reasons (stack height), in practice, the maximum volume stocked is 350 m3. Once a particular yard reaches its maximum capacity (350 m3), stored wood is quickly transported, allowing the yard to receive new wood. Thus, the capacity of the yard depends on how often it will be reloaded. However, this depends on the maximum distance at which trees may be extracted (Dmax), which will define the volume of wood received by a yard. Hence, Dmax must be calculated to define this volume.
According to [21], Dmax corresponds to half of the optimal distance between roads (ROD); this equation is commonly used in the planning of forest roads in Brazil, where this distance is calculated according to [82] by the following expression:
R O D = 2 10 C V T r
where ROD is the optimal distance between forests transportation roads (m), C (R$ km−1) is the cost of road construction per kilometer, V (m3 ha−1) is the volume of exploitable wood per hectare, and Tr (R$ m−1m3−1) is the cost of extraction per meter (round trip) for each cubic meter transported.
To obtain the value of Tr in Equation (7), we use the following equation:
T r = [ H S k ( Y D A V W ) ( D D 2 ) ] [ A V W ( Y D A V W ) ]
where Tr (R$ m−1m3−1) is the cost of extraction per meter (round trip) per cubic meter transported, HSk is the cost per hour of the use of a skidder (R$ h–1), YD is the extraction productivity (m3 h−1), AVW is the average volume of logs (m3), and DD (m) is the average distance of extraction (estimated or expected) (m).
To calculate the value of C in Equation (7), it was assumed that, in accordance with [83], the technical coefficient of the performance of opening roads is, on average, 2.99 h km–1. The average cost of renting a forestry tractor is in the region is R$300.00 h–1. Thus, the cost per kilometer of opening roads (C) can be calculated as the product of the performance of opening (2.99 h km–1) and the cost per hour of hiring a forestry tractor (R$300.00 h–1), resulting in a value per kilometer of open road of R$898.50 km–1.
The value of V is calculated in Equation (7), based on the total volume of exploitable trees (10,713.73 m3) in the APU (638.17 ha minus 72.76 ha PPA), resulting in 18.95 m3 ha–1. The HSk variable in Equation (8) was calculated by the product of the average time cost for using the Skidder (18.00 R$ for m3 extracted wood) and the average extraction productivity from the area, which was 16.27 m3 of wood extracted through time (variable YD in Equation 8), which resulted in a cost of 292.86 R$ h−1. The value of the variable DD Equation (8) used in this work was obtained in [83], corresponding to an average distance of extraction of 152.17 m. Finally, the variable VMT in Equation (8) was obtained based on the inventory carried out in the area, corresponding to an average volume of 2.2120 m3 per log.
By applying Equation (7), we conclude that the optimal distance between roads (ROD) is 516 m. Here, Dmax was defined as half of the ROD, so in this case it equals 258 m. However, due to obstacles encountered in the field when extracting trees, as well as location errors, which are common in the practice of harvesting, Dmax was relaxed from 258 to 342.20 m, i.e., an increase of approximately 33%. This percentage increase was calculated from information provided by the companies that carry out harvesting and has no scientific basis. However, this increase in Dmax will be important in the solution of the optimization model, making it more flexible and increasing the space for feasible solutions. Finally, from practical experience obtained in the process of harvesting over time, for a Dmax of about 350 m, the volume contained in a circle with that radius is approximately 700 m3. Thus, it was assumed here that the maximum volume contained in a yard will be approximately this value, i.e., the yard will be loaded twice in a time period.
Based on the maximum volume of each yard (700 m3), one can calculate the recommended number of yards (p) for each of the subareas using
p = v o l u m e   o f   t r e e s   i n   s u b a r e a 700
The maximum capacity of the yard, equal to 700 m3, and Dmax, equal to 342.20 m, were defined using some references from empirical information and the literature [82,83,84], respectively. As such, the maximum capacity of the yard was adopted as the value employed in the executed planning. These variables have a significant impact on the solution of the model, and therefore, deserve a more rigorous study. Even if this is not the goal of this study, we tried to assess the impact of these variables on the model performance. Thus, for a maximum capacity of the yard equal to 700 m3 and a Dmax equal to 342.20 m, solution scenarios were proposed by means of Cplex® [85] software that matched the presence and absence of these variables (Step 5 in Figure 4) as follows:
Scenario 1: The model contains the maximum capacity of the yard and maximum distance of extraction.
Scenario 2: The model contains the maximum capacity of the yard, but does not consider the restriction of the maximum distance of extraction.
Scenario 3: The model ignores the maximum capacity of the yard, but considers the restriction of the maximum distance of extraction.
Scenario 4: The model does not consider yard capacity restrictions or the maximum distance of extraction.
Scenario 5: Planning of the project that was filed and approved by the Institute of Environment of Acre (IMAC), Brazil, to carry out the exploitation in accordance with current legislation. This scenario was used as a parameter of comparison for both the analysis of the Euclidean distance and for planning the operation. It is relevant to mention that this scenario represents what companies operating in the Brazilian Amazon use with a common tool for management decisions. Therefore, any solution that is found to be better than Scenario 5 represents a technological gain.
Scenarios 1 through 4 were defined in order to explore all variations of the model. What has been called scenario 5 is the current scenario of harvest planning.
Another important parameter in allocating yards is the number of yards (p) defined for each subarea. The value of p for each scenario was set as follows:
Scenarios 1 and 2: the p value of the constraint represented by Equation (3) was calculated using Equation (9). If a viable solution is found, the issue is considered resolved. Otherwise, the value of p is incremented by one until a viable solution is obtained.
Scenario 3: the p value of the constraint represented by Equation (3) has not been calculated using Equation (9). In this case, p should be set as an initial value equal to p = 1 and the model should be solved. If one finds a viable solution, the issue is considered resolved. Otherwise, the value of p is incremented by one until a viable solution is found.
Scenarios 4 and 5: Scenario 5 represents the planning situation calculated empirically by the company without any assistance or optimization model. Thus, the p value considered in this scenario is a value that depends on the expertise of the decision maker and is not calculated by using any scientific method. The p value set in Scenario 5 was also adopted in Scenario 4.
The possibility of infeasibility described for the solution of the model compared with the value of p should be mentioned, specifically for the cases of Scenarios 1, 2, and 3, owing to restrictions on the maximum range and capacity of the yard. In the case of Scenario 1, these two restrictions are present, and there is a greater chance of infeasibility. To understand the influence of the value of p on the infeasibility solution, let us examine each constraint separately. After assessing the capacity of the yard, it is interesting to note that the maximum capacity of a yard was set to 700 m3. Let us assume that the subarea presents a volume of 1400 m3, which initially would require two yards (Equation (9)) to receive the volume harvested in this subarea. It turns out that the model decision variable is a binary variable where one means that a certain tree will be allocated to a yard and zero means it will not. There is no way to ensure that the sum of the volumes intended for a particular yard will be, in the case of this example, equal to 700 m3. Let us say that the sum is equal to 695 m3, i.e., yard 1 will receive this volume. This means that 705 m3 are left over to be transported to the other yard, which will not be possible as the capacity constraint limits the yard to 700 m3, making the solution impossible. Thus, as already mentioned, in cases like this, the p value was increased by one unit to seek a viable solution.
Evaluating the constraint of maximum distance, it may happen that, depending on the value of p, certain trees will be beyond the maximum distance defined by this restriction (Equation (6)), which will make the solution of the model infeasible. It is logical to think that the larger the value of p, that is, the more yards that exist in the area, the smaller the distance between the trees and the yards. Therefore, when this restriction caused impracticality, the p value was increased by one until a viable solution was obtained.

2.4. Comparison of the Scenarios with the Project Approved for Implementation

In accordance with the laws of the State of Acre, to harvest timber in forests, it takes the approval of a SFMP by the IMAC, which is the Brazilian Government agency responsible. The management plan will contain all the principles for the management of the established forest cutting cycle. The planning operation is detailed in the annual operating plan (AOP) that has information such as the location of inventory trees, yards, roads, and skidtrails. Once approved, this is the plan that will be implemented in practice.
Thus, to assess the impact of the optimization model and the different scenarios, a comparison was made with the responses obtained for each scenario with the proposed harvest delivered and approved by the IMAC. Through this comparison, it is possible to conclude whether the model for the optimization of the allocation of yards has potential benefits.
A comparison of the mentioned proposed scenarios with the project approved by the IMAC was carried out in two ways: comparison of the Euclidean distance and of exploration planning. All calculations of distance and area were made in Arcgis® [64].
First, the analysis of the distances was carried out through the sum of the Euclidean distances of the selected tree–yard connection. Thus, it was possible to carry out a direct comparison of the planning approved by the IMAC with the scenarios proposed through the optimization model.
However, in the planning of the operation, one cannot take into consideration only the Euclidean distance, because in the real world the logs would not be extracted in a straight line due to obstacles. In addition, when a tree is extracted, the tracks can be employed to extract other trees, to minimize the impact on soil, vegetation, and water resources. Thus, even if an optimization model is not used, this does not exclude the need to plan the trails and roads. This plan follows the same methodology that is considered acceptable by the IMAC, so the management plan is approved by the organization.
To compare the five scenarios analyzed based on the Euclidean distance, the following factors were considered: total distance (TD), in meters, which is the sum of the distances from the tree–yard connection; average maximum distances (AMD) in meters, which is the average of all distances above the Dmax value without relaxation of 33% (258 m); average of the distances (AD), in meters, which is the average of all tree–yard connection distances; and the coefficient of variation of the volume of the yards (Cvvp), as a percentage.
To compare the results after the planning of forest roads and trails, the following factors were considered: total allocated yards (TAC), which is the number of allocated yards in each scenario; total of forest roads (TFR), in kilometers, which is the total amount of planned forest roads; total skidtrails (TS), in kilometers, which is the total amount of planned skidtrails. In the quantification of environmental impacts, the total amount of area affected by the infrastructure deployment of yards, roads, and tracks was estimated, with the first four scenarios being compared with each other and with Scenario 5 using a function of area and percentage, with the following variables: total of yards infrastructure (TPI), in hectares; total forest road infrastructure (TFRI), in hectares; total of skidtrail infrastructure (TSI), in hectares.

2.5. Planning of Forest Roads and Skidtrails

For the purpose of this work, it should be considered that the APU does not present any forest road or skidtrail. Thus, it should be clear to the reader that the main objective of this work is the allocation of wood storage yards, which will consequently define the construction of forest roads and skidtrails, that is, no previous infrastructure was considered. Once the optimal locations for the wood storage yards were defined, the forest roads and skidtrails were planned using GIS software manually in all scenarios. To plan the roads, the idea was to connect the patios positioned in the 11 subareas in order to produce a minimum route, whilst also trying to avoid the constructed roads passing through areas of PPA, restricted areas and areas of accentuated slope. These criteria were used for all scenarios evaluated. The road surface consists basically of scraped soil and subsequent compaction by circulation of the machine and transport vehicles. The roads have been designed with a width of 5 m and their main utility is to transport the wood stored in the yards to the processing sites. The construction of the roads was in accordance with the legislation and methodology of the digital model of forestry (MODEFLORA) [21].
The planning of the skidtrails began after the end of the planning of the forest roads in each scenario. The same criteria and tools used for the planning of the forest roads were used to plan the skidtrails. The planning of the skidtrails consists in defining the path that the forest tractor follows during the extraction, from the location of the wood log inside the forest to the storage yard. According to [21], the construction of skidtrails should be guided by the topographical features, seeking the shortest possible path. In addition, the track should not cross the hydrographic mesh area, being as straight forward as possible. The track must circumvent the region of instability and if the path is inclined, it is more appropriate to take the diagonal route. The extraction of more than 15 trees for each track is to be avoided, is a secondary angle of more than 45 ° between the tracks and the main trail.

2.6. Estimate of Environmental Impacts in the Harvest Planning from the Opening of Roads and Skidtrails

Estimating environmental impacts is complex and would involve a whole separate study, because the harvesting of forest is related to the removal of trees of interest, as well as the damage this causes to the remaining vegetation, fauna, soil, and overall ecosystem. However, as an estimation of the impact generated by harvesting activities still in the planning phase, a simple rule that can be used is that the larger the area earmarked for infrastructure facilities for the harvesting—areas for the construction of roads, paths, and yards—the greater the impact on the forest ecosystem.
Thus, in this study, the area of infrastructure (AI), which includes areas for the construction of roads, trails, and storage yards, was used as a proxy for possible environmental impacts caused by harvesting.
We used the average value of 5 m in width for the construction of roads and 4 m for skidtrails. In the case of storage yards, they have their own installation area. To estimate the variable AI in hectares, the buffer tool was used according to the widths. The buffer area quantification was performed in GIS software in all the planned infrastructures of the analyzed scenarios.

3. Results

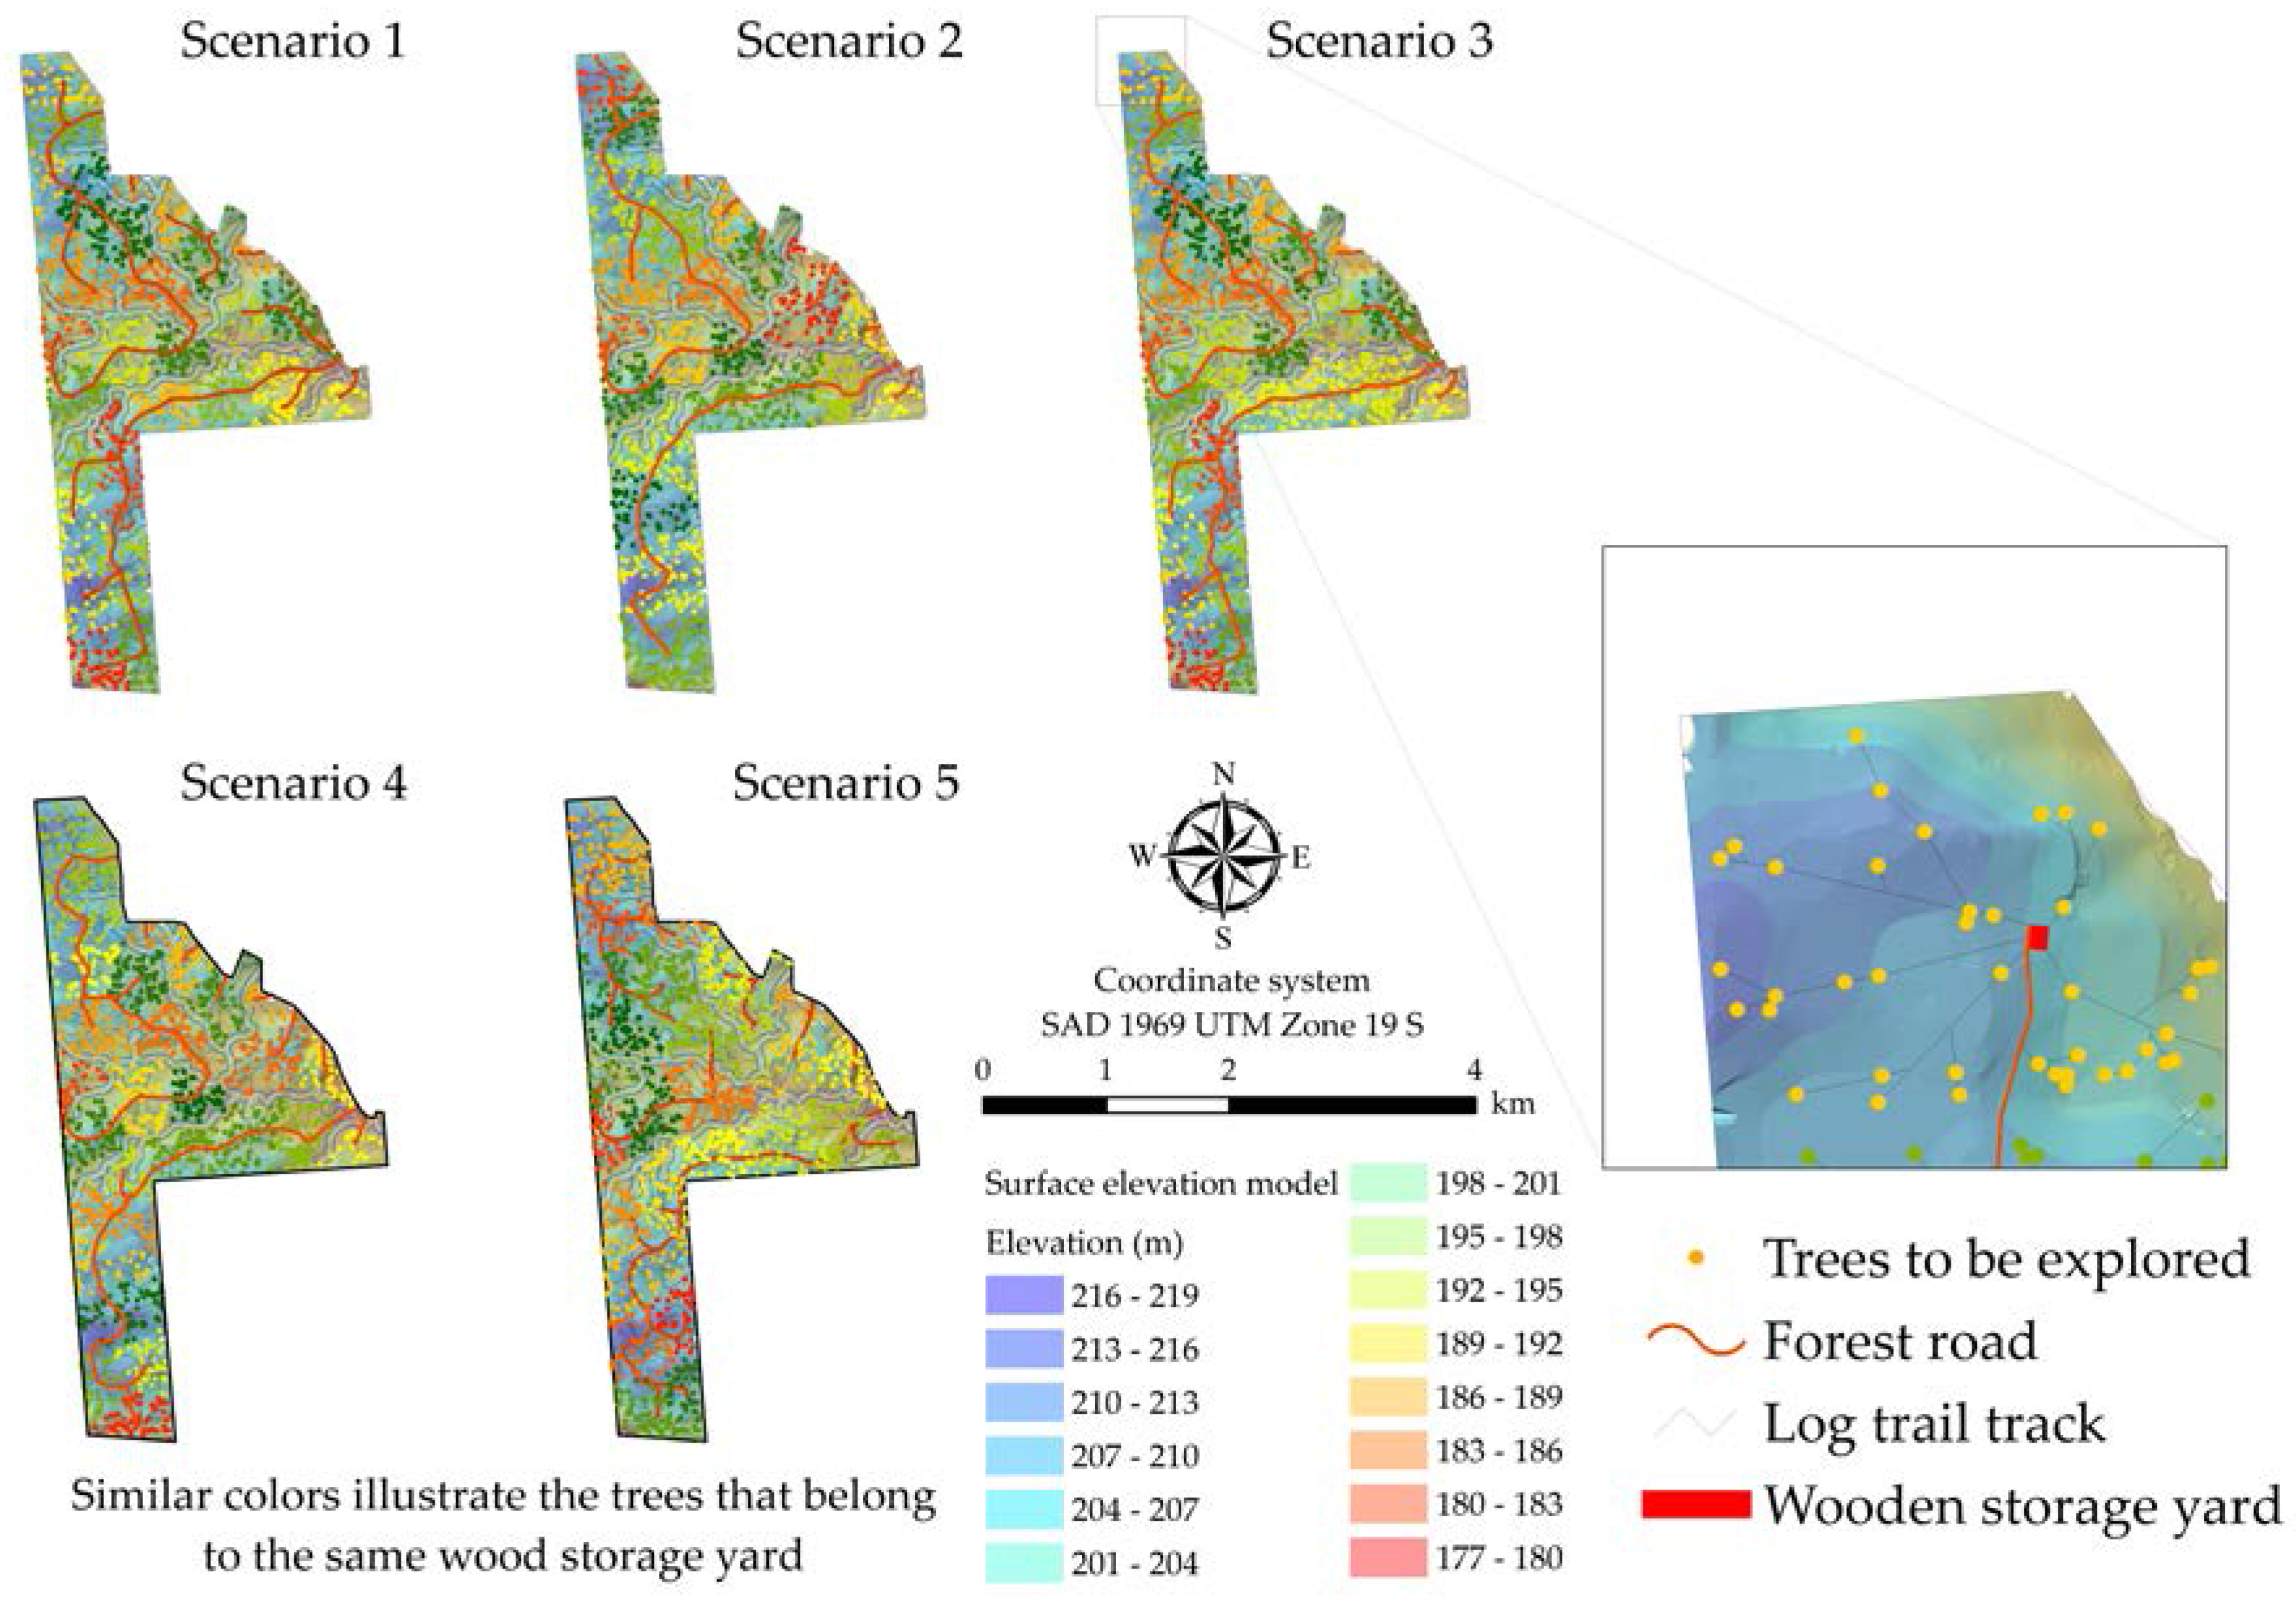
3.1. Allocation of Storage Yards Based on the Euclidean Distance

In Table 1, the values of the OF for the scenarios and subareas are listed. In addition, the coefficients of variation (CVFO) between the OF responses of the scenarios in each subarea. Table 2 allows a comparison of the model’s performance for different scenarios globally, that is, considering the optimization for all 11 subareas. Based on the results presented in this table, it should be noted that, in view of the statistics TD, AMD, and AD, the statistics were selected to support a direct comparison between the scenarios by means of absolute values; Scenario 1 achieved better performance, followed by Scenarios 3, 4, and then 2. Comparing only Scenario 1 with Scenario 5, there were reductions of 16.81, 21.13, 16.36, and 7.29%, respectively, for TD, AMD, AD, and CVvp.
Regarding the processing of the data, 7896 possible storage yards were allocated to meet the demand of 1478 exploitable subjects, which led to the creation of 11,678,185 variables. The division of APU had a positive influence on the search for an exact solution for the model, because it reduced the number of combinations within each subarea.

3.2. Distribution of Individual Trees in Relation to the Euclidean Distances of Extraction of the Scenarios

One of the concerns in the design of the model is that the trees should be extracted at the shortest distance possible. According to [82,84], extracting trees further than 342.20 m can be economically unviable in addition to damaging soil and flora. Thus, the model is more restrictive regarding the distance in Scenarios 1 and 3 than in Scenarios 2 and 4. The results presented in Table 3 corroborate with what was expected, that is, in Scenarios 1 and 3, the trees were extracted at smaller Euclidean distances compared with Scenarios 2 and 4, showing the effect of the constraint of distance. Note also that in Scenarios 2 and 4, the percentage of trees extracted at more than 300 m was more than double the result found for Scenarios 1 and 3.

3.3. Allocation of Storage Yards, Forest Roads, and Skidtrails of Post-Optimized Planning

While the optimization model defines the location of where the yards should be installed, based on the Euclidean distance, the next step is to plan the operation that will be performed in the field, which includes the definition of forest road infrastructure and extraction trails. Note that in the countryside it is not possible to follow the Euclidean distances. Thus, a map was manufactured for each scenario, as shown in Figure 5, to subsequently make a comparison between Scenarios 1–4 and Scenario 5.
After installation of the infrastructure in the SFM area in accordance with the criteria described in the methodology and the construction of the exploration map of each scenario, the variables TAP, TFR, and TSF were calculated (Table 4). From these results, we can see that in the scenarios that feature restriction of extraction distance (Scenarios 1 and 3), there was a greater allocation of yards, which demanded the construction of more roads to connect them. However, with the largest number of yards, the extraction distance of the trees was reduced.
Finally, to evaluate Table 5, we checked the impact of each scenario on the final planning of the exploitation of the wood via PFM. Considering the last column of this table, which reports the total area within the infrastructure, it should be noted that Scenarios 1–4 showed similar results and were more desirable than Scenario 5. This indicates that the optimization model, regardless of the scenario considered, brought gains.

4. Discussion

4.1. Allocation of Storage Yards Based on the Euclidean Distance

Considering the value of the OF for each subarea (Table 1), note that subareas 2 and 5 did not vary in their solutions using the various proposals in the model. This occurred because the small number of individual trees in these subareas meant that the distance and capacity constraints did not reach their limits, making them innocuous. Scenarios 1 and 3 showed similar results, with only restriction subareas 8 and 9 opening a further yard in Scenario 1 (Table 4).
After analyzing the values of the OF for Scenarios 3 and 4 (Table 1), it is observed that in subarea 10, scenario 4 presented the highest FO with the absence of distance and capacity constraints, which allowed the extraction of logs at longer distances and with no storage limit. It was found that the distance restriction was more limiting than the maximum volume restriction, because an individual tree positioned above the Dmax of extraction can make the solution of the model infeasible, requiring the allocation of a greater number of storage yards to make the model viable.
The reduction in values of the variables TD, ADM, and AD in Scenarios 1–4 compared with Scenario 5 (Table 2) shows the efficiency of the model in determining the optimal positioning of the stockyard, which culminated in the reduction of extraction distances in all the proposed scenarios analyzed. The reduction of 16.81% of TD in Scenario 1 compared with Scenario 5 can be considered significant in the decision-making process of the tree–yard connection. Thus, if the extraction was performed simply based on the Euclidean distance from the tree to the yard, the scenarios analyzed would reduce not only operating costs but also the environmental impact of extraction activities in the areas of SFM located in the Amazon rainforest.

4.2. Distribution of Individual Trees in Relation to the Euclidean Distances of Extraction of the Scenarios

When comparing Scenarios 1–4 with Scenario 5, all the proposed scenarios had a reduction in the tree–yard connection. The distance constraint Scenarios 1 and 3 provided a greater number of individual trees within the optimal distance limit (individual trees closer to the yards), providing income gain by increasing the ratio of productivity to extraction distance. This happens because this restriction forces the opening of new yards, which leads to a reduction of extraction distance. However, this solution generates a negative impact through an increase in the number of forest roads being opened because, as more yards are opened, it is necessary to increase the road network to connect them.
In Scenario 5, 28% of individual trees (Table 3) were positioned above the optimal extraction distance (258 m). Note that Scenarios 1 and 3, which had the distance restriction, were those with a lower percentage of individual trees being extracted further than 258 m. These scenarios provided an average reduction of 50.89% for individual trees that must be extracted at the optimal distance compared with Scenario 5. In Scenario 2, which does not consider the maximum distance restriction, the highest percentage of trees swept away was obtained above the optimal distance between the optimized Scenarios 1–4. When comparing Scenario 4 with 2, note that there was a tendency to extract trees at smaller distances in Scenario 4. The number of yards found in each of the scenarios explains this result. In Scenario 2, this number was calculated by Equation (9) and in Scenario 4 it was defined as the number of yards that the company adopted in its empirical planning (Scenario 5). Therefore, for the same reasons already exposed, Scenario 4 had more yards than Scenario 2, decreasing the extract distance, but also increasing the length of roads.

4.3. Allocation of Storage Yards, Forest Roads, and Skidtrails of Post-Optimized Planning

Scenario 2 considers the maximum capacity restriction whereas Scenario 3 takes into account the maximum distance restriction. Thus, by observing Table 4, note that more yards were opened in Scenario 3 than in Scenario 4, which leads to the conclusion that the maximum distance restriction is more restrictive. This is due to the uneven distribution of the trees in the forest, common in tropical forests. It must be considered that the allocation of a new yard contributes to the reduction of the OF, but can significantly influence the TRF; thus, studies are needed to explore the reason for opening forest roads and skidtrails taking into account costs and environmental damage caused.
Thus, the opening of forest roads should be subject to further analysis. Accordingly, in view of the results presented in Table 4, it is observed that only Scenario 1 had increased TFR (2.83%) when compared with Scenario 5. Scenario 2 obtained the best results, reducing the need for the construction of forest roads by 18.48%, followed by Scenario 4 (9.35%) and Scenario 3 (–0.36%). This result is very relevant because the construction of forest roads is very expensive.
Choosing the best strategy for the harvesting of logs depends on the decision maker. Assuming that there is legislation that must be met, the aspects that guide the decision are typically economic and environmental issues. From an environmental point of view, one can consider the impact caused by the infrastructure required to carry out the harvest, more specifically the opening of trails and roads. Observing Table 5, some considerations are very important. Scenario 2 promoted a smaller total area for infrastructure and also promoted a reduced need for opening roads. It should be noted that opening roads has a greater impact than opening trails, owing to the removal of soil. Therefore, this scenario appears to have less environmental impact. Moreover, Scenario 1 demanded the largest area for infrastructure (excluding Scenario 5), and the largest area of roads to be opened; therefore, it had the greatest potential to cause environmental impact. Finally, a very important conclusion is that the optimization model brought clear gains in reducing the impact of harvesting. Comparing Scenario 2 with Scenario 5, the former promoted a reduction of 16.15% in total area for infrastructure and a reduction of 21.28% in the area required for the construction of roads. These results indicate the enormous potential of optimization models to promote gains in harvest. It should be remembered that these gains might be even more significant when we consider that this activity can be scaled up or down.
From the economic point of view, not enough data were collected to perform this analysis. This is clear even in the proposed model, which does not show coefficients nor economic restrictions. One of the greatest difficulties in economic modeling is to obtain the cost values from companies because such information may be economically sensitive. However, without a doubt, the economic variables included in the model are indispensable and must be the object of future research.

5. Conclusions

The adoption of the proposed optimization model is viable for planning the allocation of storage yards in SFM plans in the Amazon, provided that there is a reduction in the required area for infrastructure, i.e., the construction of yards, forest roads, and skidtrails.
It is assumed that with the reduction in infrastructure, there may be a reduction in environmental damage in the process of wood harvesting using management plans in the Amazon.
The maximum extraction distance restriction was more restrictive than the yard storage capacity restriction. Therefore, it should be highlighted that limiting the extraction distance should be considered more carefully in view of the negative impacts it can generate.
Among the scenarios assessed, Scenario 2 presented the most favorable results, being the only scenario that meets the legal requirements of Brazilian legislation.

Acknowledgments

The authors are grateful to the Coordination of Development of University Employees (CAPES), the Foundation for the Support of Research and Innovation of the Holy Spirit (FAPES) public announcement n ° 009/2014 - Doctor Fixing Bag - Profix n ° FAPES: 323/2015 and the graduate development program in Forest Sciences at the Federal University of Espirito Santo. We thank the anonymous reviewers who provided useful comments and suggestions that improved the previous version of this manuscript.

Author Contributions

Evandro Ferreira da Silva performed the research and wrote the manuscript. Gilson Fernandes da Silva coordinated the study and wrote the manuscript, focusing on matters of operational research. Evandro Orfanó Figueiredo coordinated the study, collected the database, and wrote the manuscript, focusing on the harvest planning issues in native forests of the Amazon. Daniel Henrique Breda Binoti wrote the manuscript, focusing on the planning of harvesting by means of operational research. Adriano Ribeiro de Mendonça coordinated the study and wrote the manuscript, focusing on structuring the manuscript. Carlos Moreira Miquelino Eleto Torres and José Eduardo Macedo Pezzopane contributed to improvements in the structuring of the manuscript for the dissemination of research.

Conflicts of Interest

The authors declare no conflict of interest.

References

  1. Corlett, R.T. The Impacts of Droughts in Tropical Forests. Trends Plant Sci. 2016, 21, 584–593. [Google Scholar] [CrossRef] [PubMed]
  2. Poorter, L.; van der Sande, M.T.; Thompson, J.; Arets, E.J.M.M.; Alarcón, A.; Álvarez-Sánchez, J.; Ascarrunz, N.; Balvanera, P.; Barajas-Guzmán, G.; Boit, A.; et al. Diversity enhances carbon storage in tropical forests. Glob. Ecol. Biogeogr. 2015, 24, 1314–1328. [Google Scholar] [CrossRef]
  3. Wolfslehner, B.; Vacik, H.; Lexer, M.J. Application of the analytic network process in multi-criteria analysis of sustainable forest management. For. Ecol. Manag. 2005, 207, 157–170. [Google Scholar] [CrossRef]
  4. Brazil, LEI No 12.651, DE 25 DE MAIO DE 2012.L12651, Dispõe Sobre a Proteção da Vegetação Nativa. Available online: http://www.planalto.gov.br/ccivil_03/_ato2011-2014/2012/lei/l12651.htm (accessed on 1 August 2017).
  5. Hosokawa, R.T.; Moura, J.B.; Cunha, U.S. Introdução ao Manejo Economia de Floresta; UFPR: Curitiba, Brazil, 1998. [Google Scholar]
  6. Rotta, G.W.; Micol, L.; dos Santos, N.B. Manejo Sustentável no Portal da Amazônia: Um Benefício Econômico, Social e Ambiental; ICV: Alta Floresta, Brazil, 2006.
  7. IBAMA, Norma de Execução n.o 1, de 24 Abril de 2007 do Instituto Brazileiro do Meio Ambiente e Recursos Hídricos. Available online: https://www.legisweb.com.br/legislacao/?id=91545 (accessed on 25 August 2017).
  8. Amaral, P.; Veríssimo, A.; Barreto, P.; Vidal, E. Floresta Para Sempre: Um Manual Para Produção de Madeira na AMAZÔNIA; Imazon: Belém, Brazil, 1998. [Google Scholar]
  9. Braz, E.M. Subsídios Para o Planejamento do Manejo de Florestas Tropicais da Amazônia. Ph.D. Thesis, Universidade Federal de Santa Maria, Santa Maria, Rio Grande do Sul, Brazil, 2010. [Google Scholar]
  10. Timofeiczyk Júnior, R.; Graça, L.R.; Berger, R.; Sousa, R.A.T.M.; Hosokawa, R.T. Estrutura de custos do manejo de baixo impacto em florestas tropicais—Um estudo de caso. Floresta 2005, 35, 89–103. [Google Scholar] [CrossRef]
  11. Sá, C.P.; de Araujo, H.J.B.; Figueiredo, E.O.; de Oliveira, L.C. Coeficientes Técnicos Para o Manejo Florestal Madeireiro em Áreas de Reserva Legal de Pequenas Propriedades no Estado do Acre; Embrapa Acre: Rio Branco, Brazil, 2008. [Google Scholar]
  12. Da Silva, J.C.; de Almeida, A.N.; de Pompermaye, R.S. Análise estratégica do manejo florestal na Amazônia Brazileira. Floresta 2014, 44, 341–348. [Google Scholar] [CrossRef]
  13. Gama, J.R.V.; de Bentes-Gama, M.M.; Scolforo, J.R.S. Manejo sustentado para floresta de várzea na amazônia oriental. Rev. Árvore 2005, 29, 719–729. [Google Scholar] [CrossRef]
  14. De Pinho, G.S.C.; Fiedler, N.C.; Guimarães, P.P.; Silva, G.F.; dos Santos, J. Análise de custos e rendimentos de diferentes métodos de corte de cipós para produção de madeira na floresta nacional do Tapajós. Acta Amazon. 2009, 39, 555–560. [Google Scholar] [CrossRef]
  15. Huth, A.; Drechsler, M.; Ko, P. Multicriteria evaluation of simulated logging scenarios in a tropical rain forest. J. Environ. Manag. 2004, 71, 321–333. [Google Scholar] [CrossRef] [PubMed]
  16. Søvde, N.E.; Løkketangen, A.; Talbot, B. Applicability of the GRASP metaheuristic method in designing machine trail layout. For. Sci. Technol. 2013, 9, 187–194. [Google Scholar] [CrossRef]
  17. Contreras, M.; Chung, W. A computer approach to finding an optimal log landing location and analyzing influencing factors for ground-based timber harvesting. Can. J. For. Res. 2007, 37, 276–292. [Google Scholar] [CrossRef]
  18. Murray, A.T.; Snyder, S. Spatial Modeling in Forest Management and Natural Resource Planning. For. Sci. 2000, 46, 153–156. [Google Scholar] [CrossRef]
  19. Karlsson, J.; Rönnqvist, M.; Bergström, J. An optimization model for annual harvest planning. Can. J. For. Res. 2004, 34, 1747–1754. [Google Scholar] [CrossRef]
  20. Shahi, S.; Pulkki, R. Supply Chain Network Optimization of the Canadian Forest Products Industry: A Critical Review. Am. J. Ind. Bus. Manag. 2013, 3, 631. [Google Scholar] [CrossRef]
  21. Figueiredo, E.O.; Braz, E.M.; d’Oliveira, M.V.N. Manejo de Precisão em Florestas Tropicais: Modelo Digital de Exploração Florestal; Embrapa Acre: Rio Branco, Brazil, 2007. [Google Scholar]
  22. Figueiredo, E.O.; d’Oliveira, M.V.N.; Braz, E.M.; de Almeida Papa, D.; Fearnside, P.M. LIDAR-based estimation of bole biomass for precision management of an Amazonian forest: Comparisons of ground-based and remotely sensed estimates. Remote Sens. Environ. 2016, 187, 281–293. [Google Scholar] [CrossRef]
  23. Liu, K.; Sessions, J. Preliminary Planning of Road Systems Using Digital Terrain Models. Int. J. For. Eng. 1993, 4, 27–32. [Google Scholar] [CrossRef]
  24. Newnham, R.M. ROADPLAN: A Tool for Designing Forest Road Networks. Int. J. For. Eng. 1995, 6, 17–26. [Google Scholar] [CrossRef]
  25. Baskent, E.Z.; Keles, S. Spatial forest planning: A review. Ecol. Model. 2005, 188, 145–173. [Google Scholar] [CrossRef]
  26. Ezzati, S.; Najafi, A.; Yaghini, M.; Hashemi, A.A.; Bettinger, P. An optimization model to solve skidding problem in steep slope terrain. J. For. Econ. 2015, 21, 250–268. [Google Scholar] [CrossRef]
  27. McDonald, T.P.; Taylor, S.E.; Rummer, R.B.; Valenzuela, J. Information needs for increasing log transport efficiency. In Proceedings of the First International Precision Forestry Symposium, Seattle, WA, USA, 17–20 June 2001; United States Department of Agriculture: Washington, DC, USA, 2001. [Google Scholar]
  28. Bredström, D.; Jönsson, P.; Rönnqvist, M. Annual planning of harvesting resources in the forest industry. Int. Trans. Oper. Res. 2010, 17, 155–177. [Google Scholar] [CrossRef]
  29. Putz, F.E.; Zuidema, P.A.; Synnott, T.; Peña-Claros, M.; Pinard, M.A.; Sheil, D.; Vanclay, J.K.; Sist, P.; Gourlet-Fleury, S.; Griscom, B.; et al. Sustaining conservation values in selectively logged tropical forests: The attained and the attainable. Conserv. Lett. 2012, 5, 296–303. [Google Scholar] [CrossRef]
  30. Schwartz, G.; Peña-Claros, M.; Lopes, J.C.A.; Mohren, G.M.J.; Kanashiro, M. Mid-term effects of reduced-impact logging on the regeneration of seven tree commercial species in the Eastern Amazon. For. Ecol. Manag. 2012, 274, 116–125. [Google Scholar] [CrossRef]
  31. Darrigo, M.R.; Venticinque, E.M.; dos Santos, F.A.M. Effects of reduced impact logging on the forest regeneration in the central Amazonia. For. Ecol. Manag. 2016, 360, 52–59. [Google Scholar] [CrossRef]
  32. Boltz, F.; Holmes, T.P.; Carter, D.R. Economic and environmental impacts of conventional and reduced-impact logging in Tropical South America: A comparative review. For. Policy Econ. 2003, 5, 69–81. [Google Scholar] [CrossRef]
  33. Holmes, T.P.; Blate, G.M.; Zweede, J.C.; Pereira, R.; Barreto, P.; Boltz, F.; Bauch, R. Financial and ecological indicators of reduced impact logging performance in the eastern Amazon. For. Ecol. Manag. 2002, 163, 93–110. [Google Scholar] [CrossRef]
  34. Huth, A.; Ditzer, T. Long-term impacts of logging in a tropical rain forest—A simulation study. For. Ecol. Manag. 2001, 142, 33–51. [Google Scholar] [CrossRef]
  35. Braz, E.M.; D’Oliveira, M.V.N. Planejamento de Arraste Mecanizado em Floresta Tropical; Embrapa Acre: Rio Branco, Brazil, 1997. [Google Scholar]
  36. Machado, M.P.O. Custo do manejo florestal madeireiro na Amazônia: Um estudo de caso no Estado do Acre. Bachelor, Universidade Federal do Acre: Rio Branco, AC, Brazil, 2012. [Google Scholar]
  37. Vidal, E.; West, T.A.P.; Putz, F.E. Recovery of biomass and merchantable timber volumes twenty years after conventional and reduced-impact logging in Amazonian Brazil. For. Ecol. Manag. 2016, 376, 1–8. [Google Scholar] [CrossRef]
  38. Da Lopes, E.S.; Missel, J.W.P.; Dias, A.N.; Fiedler, N.C. Technical evalution of a skidder with different wheeled types in log extraction activies of pine plantation. Rev. Árvore 2007, 31, 1053–1061. [Google Scholar] [CrossRef]
  39. Pierzchała, M.; Talbot, B.; Astrup, R. Estimating Soil Displacement from Timber Extraction Trails in Steep Terrain: Application of an Unmanned Aircraft for 3D Modelling. Forests 2014, 5, 1212–1223. [Google Scholar] [CrossRef]
  40. Bramucci, M.; Seixas, F. Determinação e quantificação de fatores de influência sobre a produtividade de “harvesters” na colheita florestal. Sci. For. 2002, 62–74. [Google Scholar] [CrossRef]
  41. Eriksson, L.O. Planning under uncertainty at the forest level: A systems approach. Scand. J. For. Res. 2006, 21, 111–117. [Google Scholar] [CrossRef]
  42. Chung, W.; Stückelberger, J.; Aruga, K.; Cundy, T.W. Forest road network design using a trade-off analysis between skidding and road construction costs. Can. J. For. Res. 2008, 38, 439–448. [Google Scholar] [CrossRef]
  43. Walker, R.; Arima, E.; Messina, J.; Soares-Filho, B.; Perz, S.; Vergara, D.; Sales, M.; Pereira, R.; Castro, W. Modeling spatial decisions with graph theory: Logging roads and forest fragmentation in the Brazilian Amazon. Ecol. Appl. Publ. Ecol. Soc. Am. 2013, 23, 239–254. [Google Scholar] [CrossRef]
  44. Sterenczak, K.; Moskalik, T. Use of LIDAR-based digital terrain model and single tree segmentation data for optimal forest skid trail network. iForest Biogeosci. For. 2014, 8, 661–667. [Google Scholar] [CrossRef]
  45. Philippart, J.; Sun, M.; Doucet, J.-L.; Lejeune, P. Mathematical formulation and exact solution for landing location problem in tropical forest selective logging, a case study in Southeast Cameroon. J. For. Econ. 2012, 18, 113–122. [Google Scholar] [CrossRef]
  46. Shirasawa, H.; Hasegawa, H. A comparative study of heuristic algorithms for the multiple target access problem. J. For. Res. 2014, 19, 437–449. [Google Scholar] [CrossRef]
  47. Nørstebø, V.S.; Johansen, U. Optimal transportation of logs and location of quay facilities in coastal regions of Norway. For. Policy Econ. 2013, 26, 71–81. [Google Scholar] [CrossRef]
  48. Ezzati, S.; Najafi, A.; Bettinger, P. Finding feasible harvest zones in mountainous areas using integrated spatial multi-criteria decision analysis. Land Use Policy 2016, 59, 478–491. [Google Scholar] [CrossRef]
  49. Gomide, L.R.; de Moura, A.L.M.; de Mello, J.M. Simulação Otimizada da Exploração Florestal de Impacto Reduzido em Uma Mata Nativa Localizada em Lavras. In Proceedings of the Anais do XX Congresso de pós-graduação da UFLA, Lavras, Brazil, 2011. [Google Scholar]
  50. Issac Júnior, M.A.; Gomide, L.R.; Silva, P.H.; de Alves, J.A.; Figueiredo, E.O. Alocação de Pátios de Armazenamento de Madeira em um Plano de Manejo Florestal na Amazônia Ocidental; Anais do XLVI Simpósio Brazileiro de Pesquisa Operacional: Salvador, Brazil, 2014. [Google Scholar]
  51. Martinhago, A.Z. Otimização Para a Locação de Pátios de Estocagem Para Exploração de Impacto Reduzido na Amazônia Brazileira. Ph.D. Thesis, Universidade Federal de Lavras, Lavras, Minas Gerais, Brazil, 2012. [Google Scholar]
  52. Da Silva, P.H. Desenvolvimento de um Modelo Para Alocação Ótima de Pátios de Estocagem de madeira. Master’s Thesis, Universidade Federal de Lavras, Lavras, Minas Gerais, Brazil, 2014. [Google Scholar]
  53. Luenberger, D.G.; Ye, Y. Linear and Nonlinear Programming; Springer International Publishing: Cham, Switzerland, 2016; Volume 228, ISBN 978-33-1-918841-6. [Google Scholar]
  54. Goldbarg, M.C.; Henrique Pacca, L.L. Otimização Combinatória e Programação Linear: Modelos e Algoritmos, 2nd ed.; Elsevier: Rio de Janeiro, Brazil, 2005; ISBN 978-85-3-521520-5. [Google Scholar]
  55. Fávero, L.P.; Belfiore, P. Pesquisa Operacional Para Cursos de Engenharia; Elsevier: Rio de Janeiro, Brazil, 2013. [Google Scholar]
  56. Klose, A.; Drexl, A. Facility location models for distribution system design. Eur. J. Oper. Res. 2005, 162, 4–29. [Google Scholar] [CrossRef]
  57. Zanjirani Farahani, R.; Hekmatfar, M. Contributions to Management Science; Drezner, Z., Hamacher, H.W., Eds.; Physica-Verlag HD: Heidelberg, Germany, 2009; ISBN 978-37-9-082150-5. [Google Scholar]
  58. Arenales, M.; Armentano, V.; Morabito, R.; Yanasse, H. Pesquisa Operacional; Elsevier: Rio de Janeiro, Brazil, 2011; ISBN 978-85-3-525193-7. [Google Scholar]
  59. Eiselt, H.; Marianov, V. Foundations of Location; Springer: Boston, MA, USA, 2011; Volume 155, ISBN 978-14-4-197571-3. [Google Scholar]
  60. Hurter, A.P.; Martinich, J.S. Facility Location and the Theory of Production; Springer: Dordrecht, The Netherlands, 1989; ISBN 978-94-010-7637-1. [Google Scholar]
  61. IBGE. Projeto de Proteção do Meio Ambiente e das Comunidades Indígenas—PMACI I.—Diagnóstico Geoambiental e Socioeconômico—Área de Influência da Br-364 trecho Rio Branco/Cruzeiro do Sul; IBGE: Rio de Janeiro, Brazil, 1994.
  62. ACRE. Programa Estadual de Zoneamento Ecológico-Econômico do Estado do Acre. Zoneamento Ecológico-Econômico do Acre Fase II: documento Síntese—Escala 1:250.000; SEMA: Rio Branco, Brazil, 2006. [Google Scholar]
  63. IBAMA. Norma de execução n.o 1, de 24 abril de 2007 do Instituto Brazileiro do Meio ambiente e Recursos Hídricos; IBAMA: Brazilia, Brazil, 2007; p. 33.
  64. Environmental Systems Research Institute (ESRI). ArcGis Professional GIS for the Desktop; Environmental Systems Research Institute: Redlands, CA, USA, 2015. [Google Scholar]
  65. EMBRAPA. Súmula da X Reunião Técnica de Levantamento de Solos; EMBRAPA: Rio de Janeiro, Brazil, 1979. [Google Scholar]
  66. Saaty, T.L. The Analytic Hierarchy Process; McGraw-Hill: New York, NY, USA, 1980. [Google Scholar]
  67. Vaidya, O.S.; Kumar, S. Analytic hierarchy process: An overview of applications. Eur. J. Oper. Res. 2006, 169, 1–29. [Google Scholar] [CrossRef]
  68. Louzada, F.L.R.; Santos, A.R.; Silva, A.G. Delimitação de Corredores Ecológicos no ArcGIS 9.3; CAUFES: Alegre, Brazil, 2010. [Google Scholar]
  69. Kühmaier, M.; Kanzian, C.; Stampfer, K. Identification of potential energy wood terminal locations using a spatial multicriteria decision analysis. Biomass Bioenergy 2014, 66, 337–347. [Google Scholar] [CrossRef]
  70. Teixeira, T.R.; Soares Ribeiro, C.A.A.; Rosa dos Santos, A.; Marcatti, G.E.; Lorenzon, A.S.; de Castro, N.L.M.; Domingues, G.F.; Leite, H.G.; da Costa de Menezes, S.J.M.; Santos Mota, P.H.; et al. Forest biomass power plant installation scenarios. Biomass Bioenergy 2018, 108, 35–47. [Google Scholar] [CrossRef]
  71. Handfield, R.; Walton, S.V.; Sroufe, R.; Melnyk, S.A. Applying environmental criteria to supplier assessment: A study in the application of the Analytical Hierarchy Process. Eur. J. Oper. Res. 2002, 141, 70–87. [Google Scholar] [CrossRef]
  72. Beasley, J.E. A note on solving large p-median problems. Eur. J. Oper. Res. 1985, 21, 270–273. [Google Scholar] [CrossRef]
  73. Church, R.L. BEAMR: An exact and approximate model for the p-median problem. Comput. Oper. Res. 2008, 35, 417–426. [Google Scholar] [CrossRef]
  74. Costa, B.B.; Nassi, C.D.; Ribeiro, G.M. A Methodology for Location of Logistics Platforms Using Geographic Information Systems. J. Traffic Logist. Eng. 2013, 1, 104–110. [Google Scholar] [CrossRef]
  75. Daskin, M.S. Median Problems. In Network and Discrete Location; John Wiley & Sons, Inc.: Hoboken, NJ, USA, 2011; pp. 198–246. [Google Scholar]
  76. Daskin, M.S.; Maass, K.L. The p-Median Problem. In Location Science; Springer International Publishing: Cham, Switzerland, 2015; pp. 21–45. ISBN 9783319131115. [Google Scholar]
  77. Domínguez, E.; Muñoz, J. A neural model for the p-median problem. Comput. Oper. Res. 2008, 35, 404–416. [Google Scholar] [CrossRef]
  78. Isler, C.A.; Bonassa, A.C.; Cunha, C.B. da Algoritmo genético para resolução do problema de p-medianas capacitado associado à distribuição de peças automotivas. Transportes 2012, 20, 5–14. [Google Scholar] [CrossRef]
  79. Park, G.; Lee, Y.; Han, J. A two-level location-allocation problem in designing local access fiber optic networks. Comput. Oper. Res. 2014, 51, 52–63. [Google Scholar] [CrossRef]
  80. Pirkul, H.; Gupta, R.; Rolland, E. VisOpt: A visual interactive optimization tool for P-median problems. Decis. Support Syst. 1999, 26, 209–223. [Google Scholar] [CrossRef]
  81. Rolland, E.; Schilling, D.A.; Current, J.R. An efficient tabu search procedure for the p-Median Problem. Eur. J. Oper. Res. 1997, 96, 329–342. [Google Scholar] [CrossRef]
  82. Food and Agriculture Organization/Swedish International Development Authority (FAO/SIDA). El Transporte de Madera en Paises de America Latina. In Proceedings of the Seminar on Wood Transportation in Latin American Countries, Oaxtepec, Mexico, 23 February–21 March 1975. [Google Scholar]
  83. Figueiredo, E.O.; Lima, Q.S. Coeficientes Técnicos para o Inventário e Manejo Florestal com Emprego do Modelo Digital de Exploração Florestal (Modeflora); EMBRAPA-ACRE: Rio Branco, Brazil, 2008. [Google Scholar]
  84. Matthews, D.M. Cost Control in the Logging Industry; McGraw-Hill: New York, NY, USA, 1942; p. 374. [Google Scholar]
  85. IBM. International Business Machine ILOG CPLEX Optimization; IBM: Armonk, NY, USA, 2015. [Google Scholar]
Figure 1. Location of the study area.
Forests 09 00127 g001
Figure 2. Scheme of obtaining data and methodology for the definition of areas suitable for the allocation of wood storage yards.
Forests 09 00127 g002
Figure 3. Map showing the formation of subareas.
Forests 09 00127 g003
Figure 4. Scheme of the input data of the model, analysis, and results.
Forests 09 00127 g004
Figure 5. Forest road planning and skid trails of the evaluated scenarios.
Forests 09 00127 g005
Table 1. Objective function (OF) values that represent the sum of the Euclidean distances of every tree extracted into their yards, considering the scenarios for each subarea.
SubareaOF (km)
Scenario 1Scenario 2Scenario 3Scenario 4CVFO (%)
118.2618.0218.2623.1812.88
21.231.231.231.230.00
358.9966.3558.9960.175.77
414.0416.4314.0416.439.05
55.045.045.045.040.00
636.5736.3236.5736.320.40
717.4926.4617.4921.7620.56
831.8837.2937.8737.297.80
93.092.632.632.638.50
1023.7737.2923.7748.5335.90
1140.0752.2640.0737.8515.38
Table 2. Values, in the Euclidean distance, that represent the sum of all the trees harvested in all subareas for each of the scenarios, considering the sum of the distances (TD), the average maximum distances (AMD), average distance (AD), and coefficient of variation of the volume of yard (CVvp).
ParametersScenario 1Scenario 2Scenario 3Scenario 4Scenario 5
TD (km)250.43299.32255.96290.43301.01
AMD (m)310.10383.90314.37368.33393.16
AD (m)163.30190.80165.61184.82195.23
CVvp (%)36.6234.1140.2738.5839.50
Table 3. Distribution, in percentage, of the quantity of individual trees in each class of extraction distance (D) by scenario.
ScenarioD ≤ 258 m258 m < D ≤ 300 mD > 300 m
186.2%8.8%5.0%
277.0%11.0%12.0%
386.0%9.0%5.0%
480.0%9.0%11.0%
572.0%13.0%15.0%
Table 4. Total number of allocated yards (TAP), forest roads (TFR), and skidtrails (TS) for each scenario.
ScenarioTAP (n)TFR (km)TSF (km)
13314.1975.99
22311.2579.21
33213.7577.24
42712.5180.23
52713.8092.50
Table 5. Estimate of the environmental impact brought about by the total yard infrastructure (TIP), forest roads (TIFR), and skidtrails (TIS) in each scenario.
ScenarioTIPTIFRTISTotal
ha% *ha% *ha% *ha% *
11.650.267.081.1130.394.7639.126.13
21.150.185.640.8831.584.9538.376.01
31.600.256.891.0830.864.8339.356.16
41.350.216.250.9832.025.0239.626.21
51.350.216.881.0736.345.6944.576.98
* Percentage compared with the total area of the SFM.

