1. Introduction
The economic value of urban trees is a monetary reference for the benefits they offer the public. It reflects a variety of factors such as the value of the land where the trees are located, their historic importance, quality and state of health, the social and environmental benefits they afford, and the costs associated with their maintenance.
These economic values are obtained from assessment equations or formulas that consider—with greater or lesser weight—a combination of the above mentioned factors. The appraisal of urban trees is not an exact science, as it depends on the purposes of the assessment and the assessor’s experience [
1,
2]. Each method or formulation takes different variables into account and provides different results. Numerous methods are used to evaluate urban trees in different regions of the world, and most define the value in monetary terms based on an expert’s perception of the tree. The assessment involves establishing a measurable and objective criterion considering aspects or variables such as whether the tree stands alone or in a group, its physical deterioration, species and variety, size, age, and state of health and location, among others [
3], along with environmental, social, and psychological variables [
4].
The assessment can therefore be used as one of the bases for making decisions on the management of these trees and as an instrument for public administration and for society itself. In fact, policymakers need to have a clear idea of the socioeconomic value of urban asset [
5], which necessarily includes urban trees. This would supplement the maximum probable (or potential) cost estimates of actions designed to mitigate disasters in cities (including climate change) and to prepare effective risk management strategies. So, what is the most appropriate method for assessing urban trees in a particular city?
To answer this question, several authors have conducted studies comparing methods for appraising urban trees. The valuation methods used show important differences [
6,
7,
8,
9,
10,
11], and the conclusion is that no method can be used under all conditions [
1], making it advisable to combine capitalization and parametric methods [
12]. There is therefore no simple solution to the question, and each method must be applied after an exhaustive study of multiple factors including the availability of reliable databases, the proposal of objects for assessment, and possible social repercussions.
This is where the aim of the assessment can be directed towards seeking a method that is closely aligned with social perception. What percentage of the population would choose one method as being the most closely aligned with reality? The answer necessarily involves conducting a survey of the public.
The survey technique is frequently used in issues related to the urban environment for the purposes of territorial management and planning, and the results serve to outline the managers’ future lines of action. Various works highlight the concern with evaluating the opinion of the public. Examples include questioning the effects of biodiversity on the perception of urban green spaces [
13] by evaluating the risk to urban trees at the municipal level through surveys of residents [
14], while other studies evaluate the urban forest factors that citizens consider to be the most beneficial [
15], or their recreational preferences [
16]. Citizens are also consulted at the level of prevention to assess their reactions to the negative effects of urban trees in the specific case of a storm [
17]. In all cases, the knowledge of citizens’ opinions allows future actions to be planned for managing the environment and can be used to select indicators for establishing new urban forests [
18]. However, there are no studies that compare different appraisals using evaluation methods that consider citizens’ opinions or perceptions on this subject.
The aim of this study is precisely to assess this aspect. The tool chosen was the photographic survey. Most studies show that photographs can be used as a valid substitute for aesthetic judgements [
19,
20,
21,
22]. Other authors have verified the validity of photographs to assess not only aesthetic, but also biological, aspects; in the study indicating the validity of photo-based scenic beauty assessments [
23], group-averaged on-site and photo-based assessments were very similar. Repeat photography has been applied in different works and found to be an efficient, effective, and useful method to identify region-wide trends in land-use change [
24], and provides a reliable and consistent measurement of phenophase to monitor plant phenology [
25]. Similarly, digital photography has been proved useful for observing the seasonal change in aboveground green biomass and foliage phenology [
26]. It has been demonstrated that the use of photography to evaluate the perception of forest vegetation and management in urban woodlands can serve as a useful quantitative method and a complement to conventional methods [
27]. Last year, similar results were reported using new technologies in a comparison of landscapes in Devon (UK) and Asturias (Spain) through on-site visits and images taken by UAV (unmanned aerial vehicles), revealing a high degree of consensus between both assessments [
28]. Applying the same technology, UAV was used to measure within-season tree height growth in a mixed forest stand, and the results closely agreed with published field observations for four tree species [
29]. However, the photographic survey with images of trees may be conditioned by the season of the year in which the photographs are taken.
The aim of the present study is to conduct surveys of a population group using photographs of different trees to determine whether there are statistically significant differences in the assessment of the specimens depending on the season of the year in which the photographs are taken.
2. Materials and Methods
2.1. Study Area
The study took place in the Forestry and Environmental Engineering School at the Madrid Polytechnic University in Ciudad Universitaria (Madrid). It has an area of 8.57 ha, of which 7.62 ha are forested. This green space aims to meet two requirements: to contribute to the regeneration of the forest in the Ciudad Universitaria and to show students the forest species of most interest. One characteristic feature of this space is that it has a high diversity. There are 2978 individuals in the arboretum inventory, corresponding to 129 different tree species [
8].
2.2. Survey Design
The survey was designed to compare the differences in opinion expressed by the public in regard to the economic value of the specimens, and the influence of the season on this appraisal. The respondents were shown photographs of 42 tree specimens belonging to 12 species. The photographs were taken with a digital camera (Canon EOS 450D, 18–55 mm, Canon Inc., Tokyo, Japan) from the same point of view and by the same person in two different seasons: one in June, which we call the summer photo (S); and another in December, which we call the winter photo (W).
Of the 42 specimens selected, 27 are evergreen species and 15 are deciduous. The 42 trees were divided into four groups based on other characteristics (see [
8]), as follows: Freq group (most abundant species in the city of Madrid, 21 specimens); Max group (species with the greatest economic value in all the methods analysed, seven specimens); Min group (species with the lowest economic value in all the methods analysed, seven specimens) and Sin group (species considered as singular trees, seven specimens).
Table 1 shows the selected species and the number of specimens, in addition to the leaf type and the group to which they belong.
2.3. Appraisal Methods Used
The tree specimens selected were appraised by eight valuation methods used in different parts of the world. These methods are classified in three types according to their formulation: parametric, mixed, and capitalisation (see [
30]).
2.3.1. Parametric Methods
North American method (CTLA). It defines the “base value” as the expression of the nursery’s unit price according to the cross-section of the trunk, and uses corrective indexes to maintain or reduce its value, but never to increase it.
Burnley method (Burnley). Its main variable is the tree size measured as the volume of an inverted cone, considering the height and crown area. It also includes a monetary value, designated the “base value”. The final figure may be modified by factors that can reduce the base value. This is used mainly in Australia [
31].
Formulaic Expert Method (FEM). This method selects six main criteria (dimension, species, individual, state, location, and outstanding consideration), and the monetary value of the tree is the result of multiplying the total score of the main criteria of a tree by a monetary assignment factor (MAF) derived from the three-year average sales price per square metre of a mid-sized residential home. Used for singular trees in Hong-Kong.
Copima method (Copima). This is based on the price of the species in the local market, corrected by multiplicative indexes that increase the value of the specimen. It is used in the municipalities of Concepción, La Pintana, and Maipú (Chile) [
2].
2.3.2. Mixed Methods
Granada standard (NG). In the first versions of this method, the base value was obtained for each species with a regression model based on the tree age. Since the last review, the method uses the trunk circumference measurement (measured 1 m from the ground) modified by intrinsic and extrinsic factors. It is used in Spain.
Contato method (Contato). This classifies the tree based on its diameter, height, and crown area. The base value of each tree is calculated according to its age using the capitalisation formula, and is modified with corrective multiplicative factors that can increase or decrease the end value. Used in Argentina.
New Zealand method (Standard Tree Evaluation Method) (STEM). This is one of the most widely used methods, and applies a system of points to assess 20 tree attributes in three general categories: state, functions, and outstanding qualities (special merit). The total score (P, with a maximum of 540 points) is multiplied by the wholesale cost of a five-year-old tree (with no specific indication of the tree species). To this is added the wholesale cost of planting and maintaining the tree until it reaches the same age as the replaced specimen.
2.3.3. Capitalisation Methods
Capitalisation method (Capitalis.). This is based on the capitalisation of the replacement and maintenance costs throughout the life of the tree. Two methodologies can be distinguished. The first uses the replacement costs, and involves finding specimens of the same species, age, and physical and ornamental characteristics on the market, and whose transplantation is technically feasible. This tree must also have a high possibility of rooting without compromising its normal development.
The second is based on maintenance costs, assuming that the tree chosen to replace the tree being appraised is younger. That is, it is estimated that the internal yield rate (r) for transforming the future tree into the current tree represents an intermediate situation where the substitute tree has a somewhat lower age and dimensions than those of the current tree.
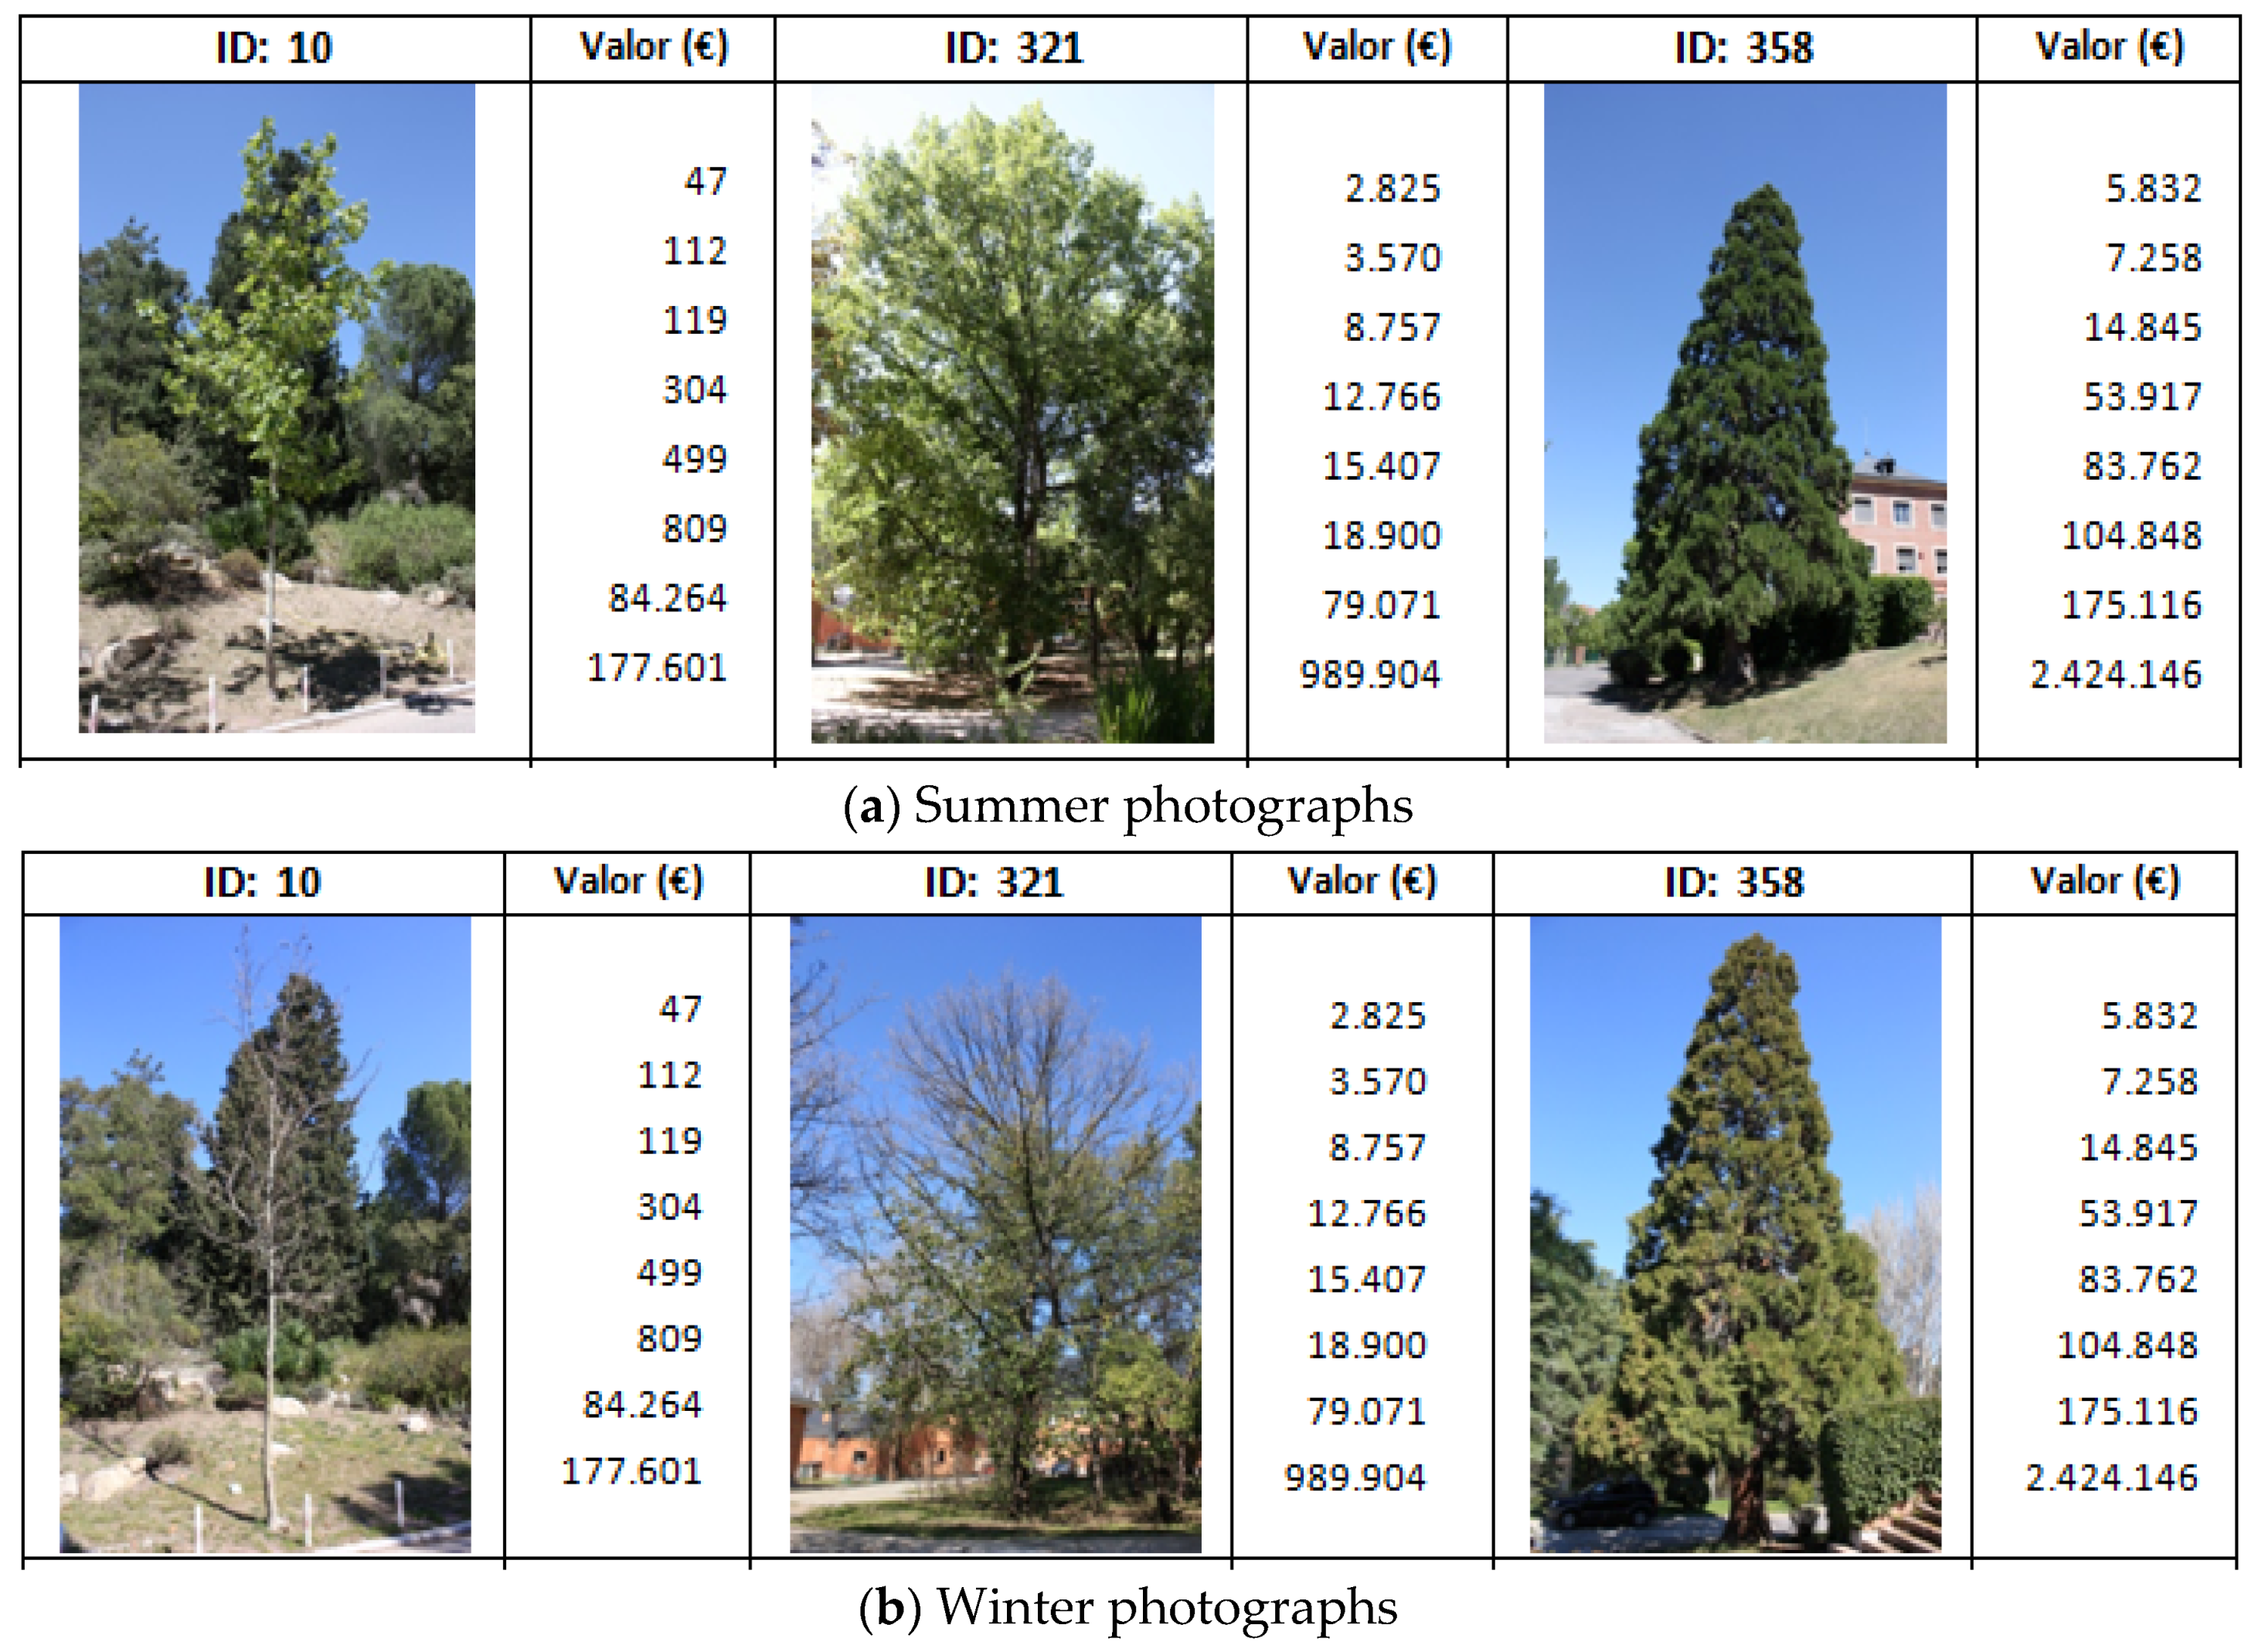
STEM has the highest values in all the examples, while FEM comes second, with the highest values in 95% of cases with the eight methods used. The highest valuations for these two methods are justified by the calculation criteria. FEM has land price as a multiplicative factor, which considerably raises the valuations. With STEM, the final value depends on a parameter resulting from multiplying the difference in age between the tree and its substitute by the annual maintenance cost. For example, in the sequoia specimen (
Figure 1), the highest value corresponds to the STEM method (€2,424,146) and the next highest to the FEM (€175,116), and differs significantly from the lowest value (€5832, CTLA). The difference between the rest of the methods becomes more pronounced as the age of the tree increases.
The Burnley, Contato, Capitalisation, Copima, NG, and CTLA methods have lower values. This is because Burnley and Contato calculate the basic value from the tree height and diameter variables that include crown measurements. Burnley considers crown and trunk size; Contato uses crown area and age. These variables are the most suitable for explaining the variability of urban trees without concurring in problems of collinearity [
32]. Capitalistion and Copima base their valuation on market prices such as the cost of the plant in the greenhouse, whereas NG and the CTLA calculate the basic value with the measurement of the trunk section, and thus present values of a similar order.
2.4. Conducting the Survey
The survey consisted of five pages of DIN A4 (210 × 297 mm) paper. The first page contained questions on personal details such as sex and age range (18–30, 30–45, 45–60, or over 60), and the following pages included a photograph of each specimen with an identification number, and, on the right, the valuation options in euros obtained with the different methods ordered from lowest to highest. The first survey was made in May (with the photos we have called summer), and the second survey in October, with the winter photos.
Figure 1 contains an example of the three specimens showing the photographs of both seasons together.
The respondents were first-year and Master’s students in Forestry Engineering at the School of Forestry and Environmental Engineering at the Madrid Polytechnic University. The opinion of a total of 78 students was collected.
2.5. Statistical Methods
The data from the completed surveys were entered in a MS Excel database (2010, Microsoft, Redmond, Washington, D.C., USA) for their subsequent statistical processing with the STATGRAPHICS Centurion XVII software (2014, Statpoint Technologies, Inc., The Plains, VA, USA).
The variables used were: proportion of students who assigned the same economic value to the same specimen in both seasons (%0), proportion of students who assigned more value to the winter photograph (%W), and proportion of students who assigned more value to the summer photograph (%S).
Two statistical analyses were performed: the t test for paired samples, comparing the three above mentioned variables for each specimen. The null hypothesis was that the proportions were equal. The hypothesis of normality was also verified with the Shapiro-Wilk test.
The valuations for the three variables were compared with a simple ANOVA, and box plots were obtained. The factors were species, leaf type, and group. The null hypothesis was the equality of proportions for the different factor levels (SP, Type, Group). The equality of variances between factor levels was verified with Levene’s test. In the case of the SP factor, in which only one specimen was valued for some species, the robust Welch test was used with a null hypothesis that was equal to equal mean proportions. This test assumes the inequality of variances; it is adequate when the number of specimens differs widely between factor levels, and the sample sizes are small [
33]. The levels with statistically significant differences were obtained using the multiple range test with limits by Fisher’s LSD (Least Square Differences).
A significance level of 5% was used in all the statistical tests.
3. Results
The survey was given to 40 undergraduate and 38 Master’s students, 27 of whom were women and 51 men.
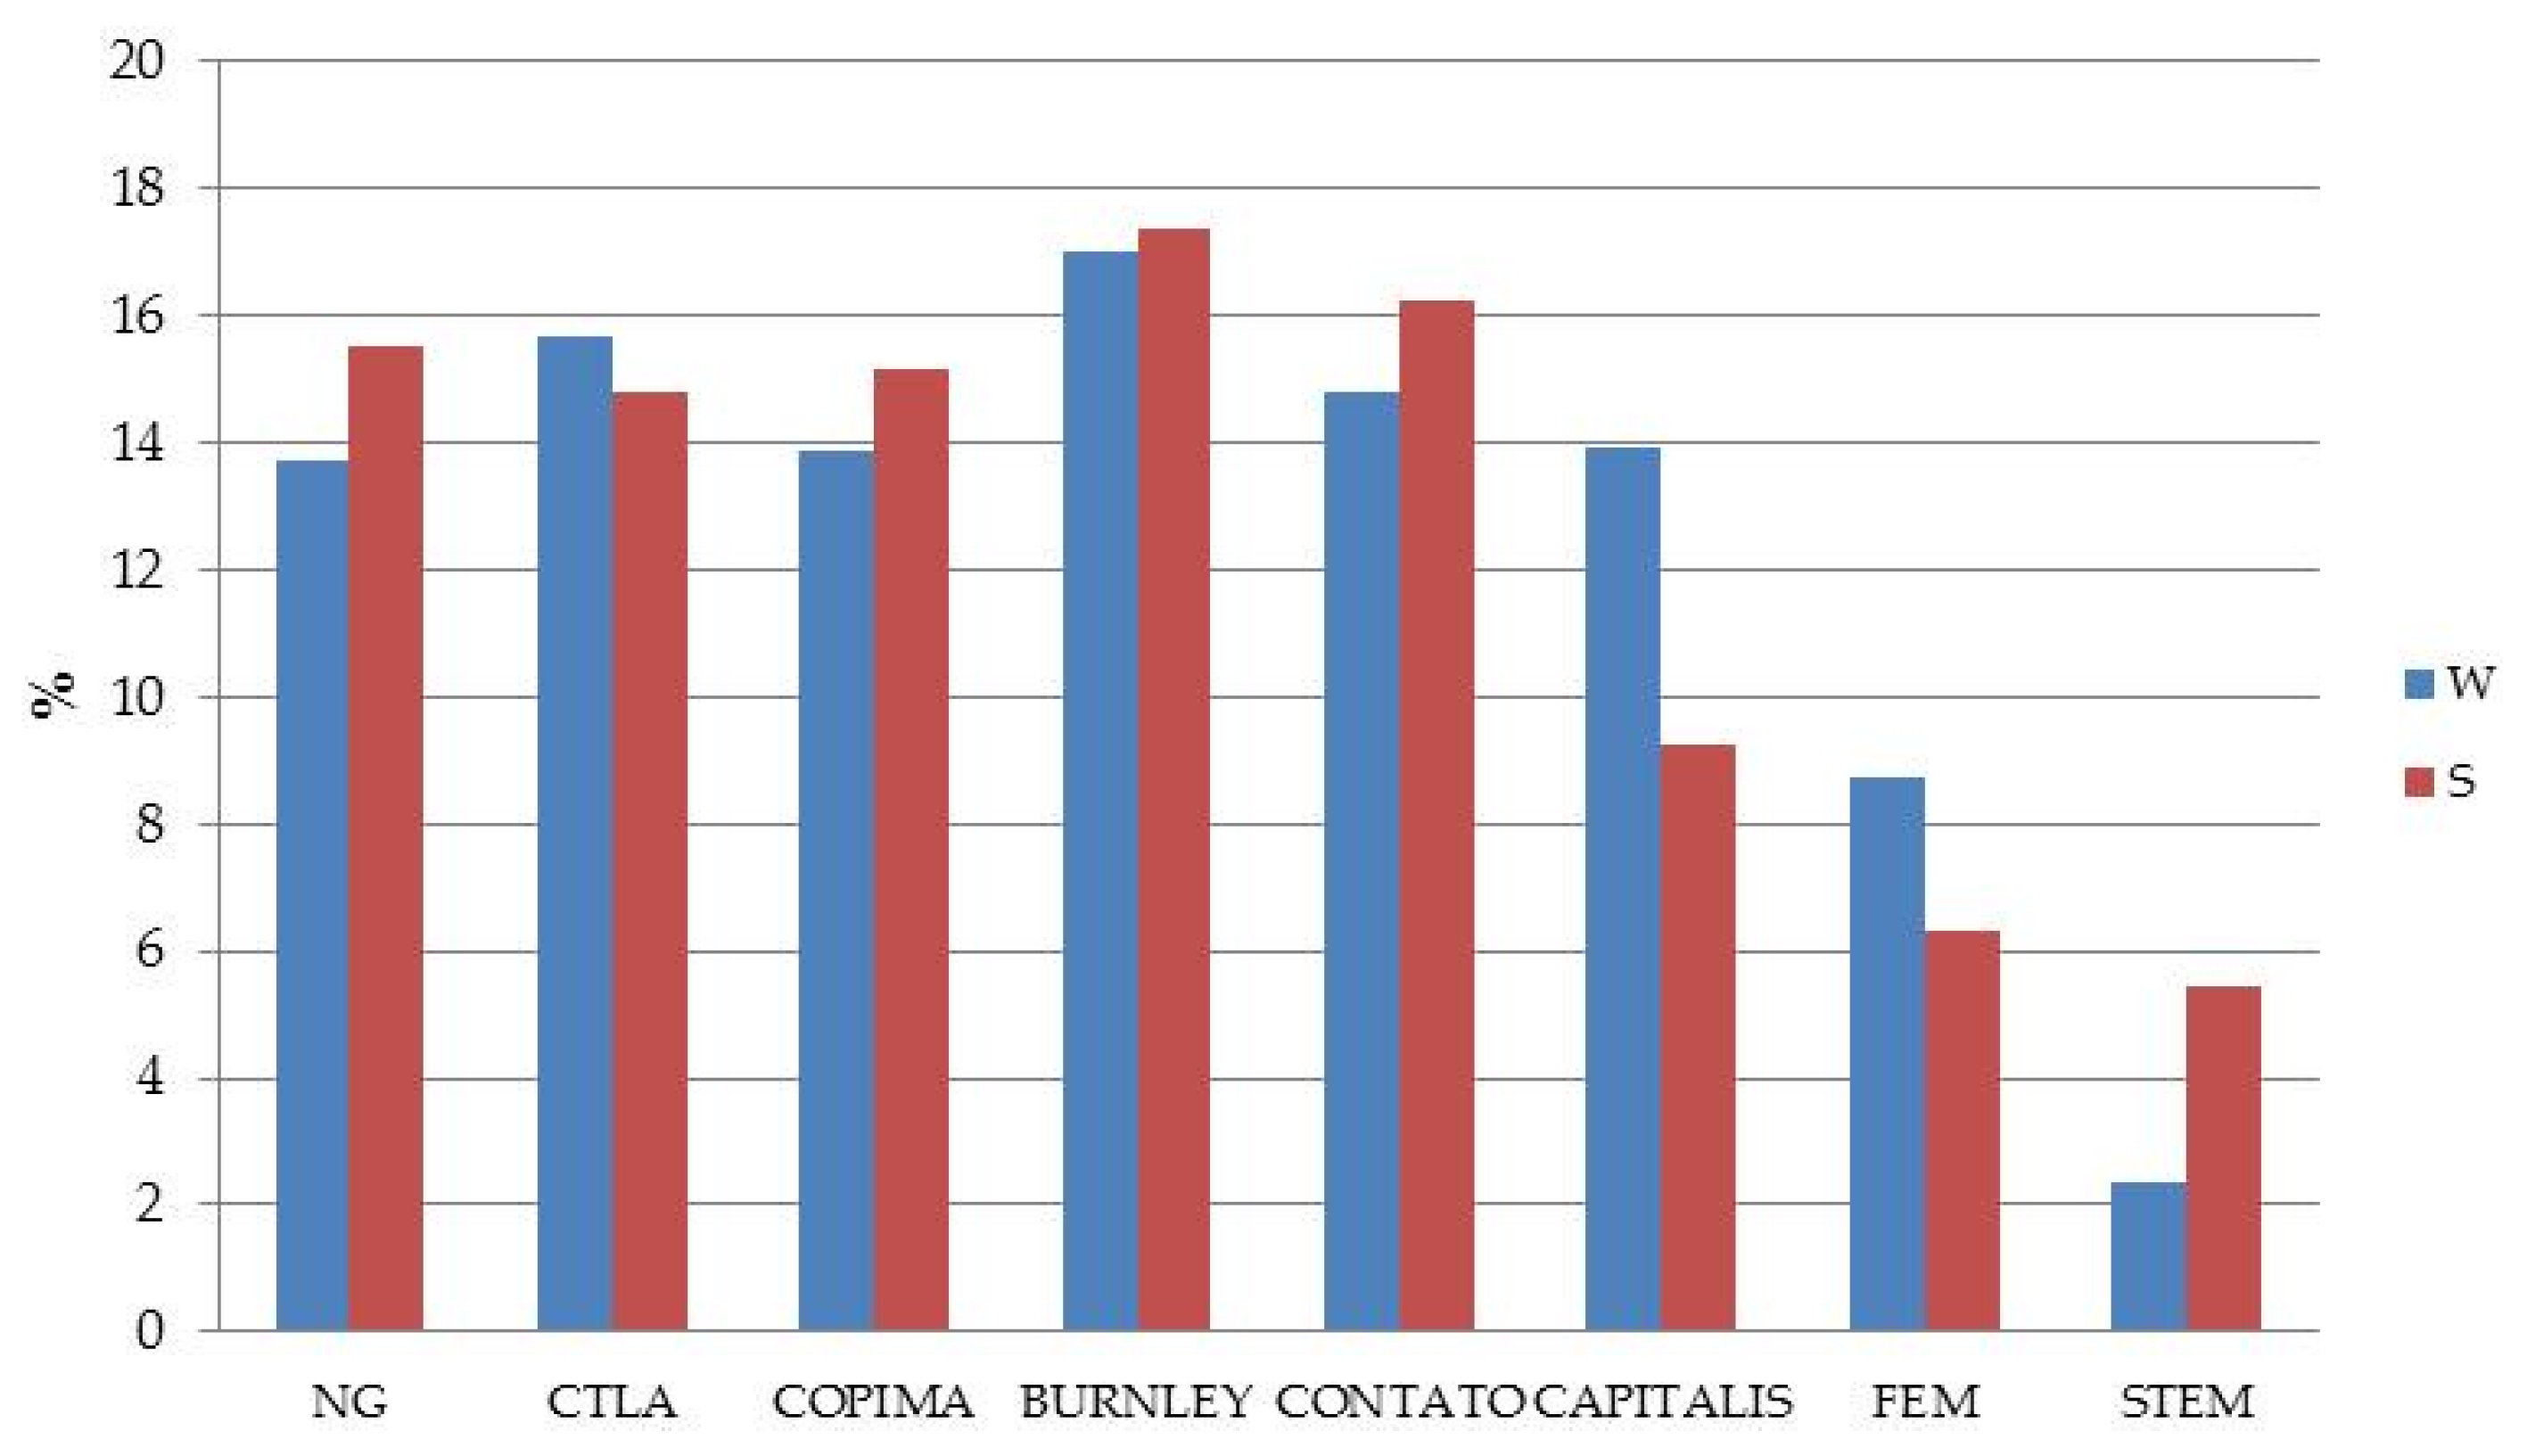
Figure 2 shows the percentage difference in the selection of methods according to the season. The last selected methods are FEM and STEM. Burnley is the most selected method in both seasons and in similar percentages, although it is greater in summer. The same occurs with Copima, Contato, and NG, while the opposite occurs with CTLA and Capitalis.
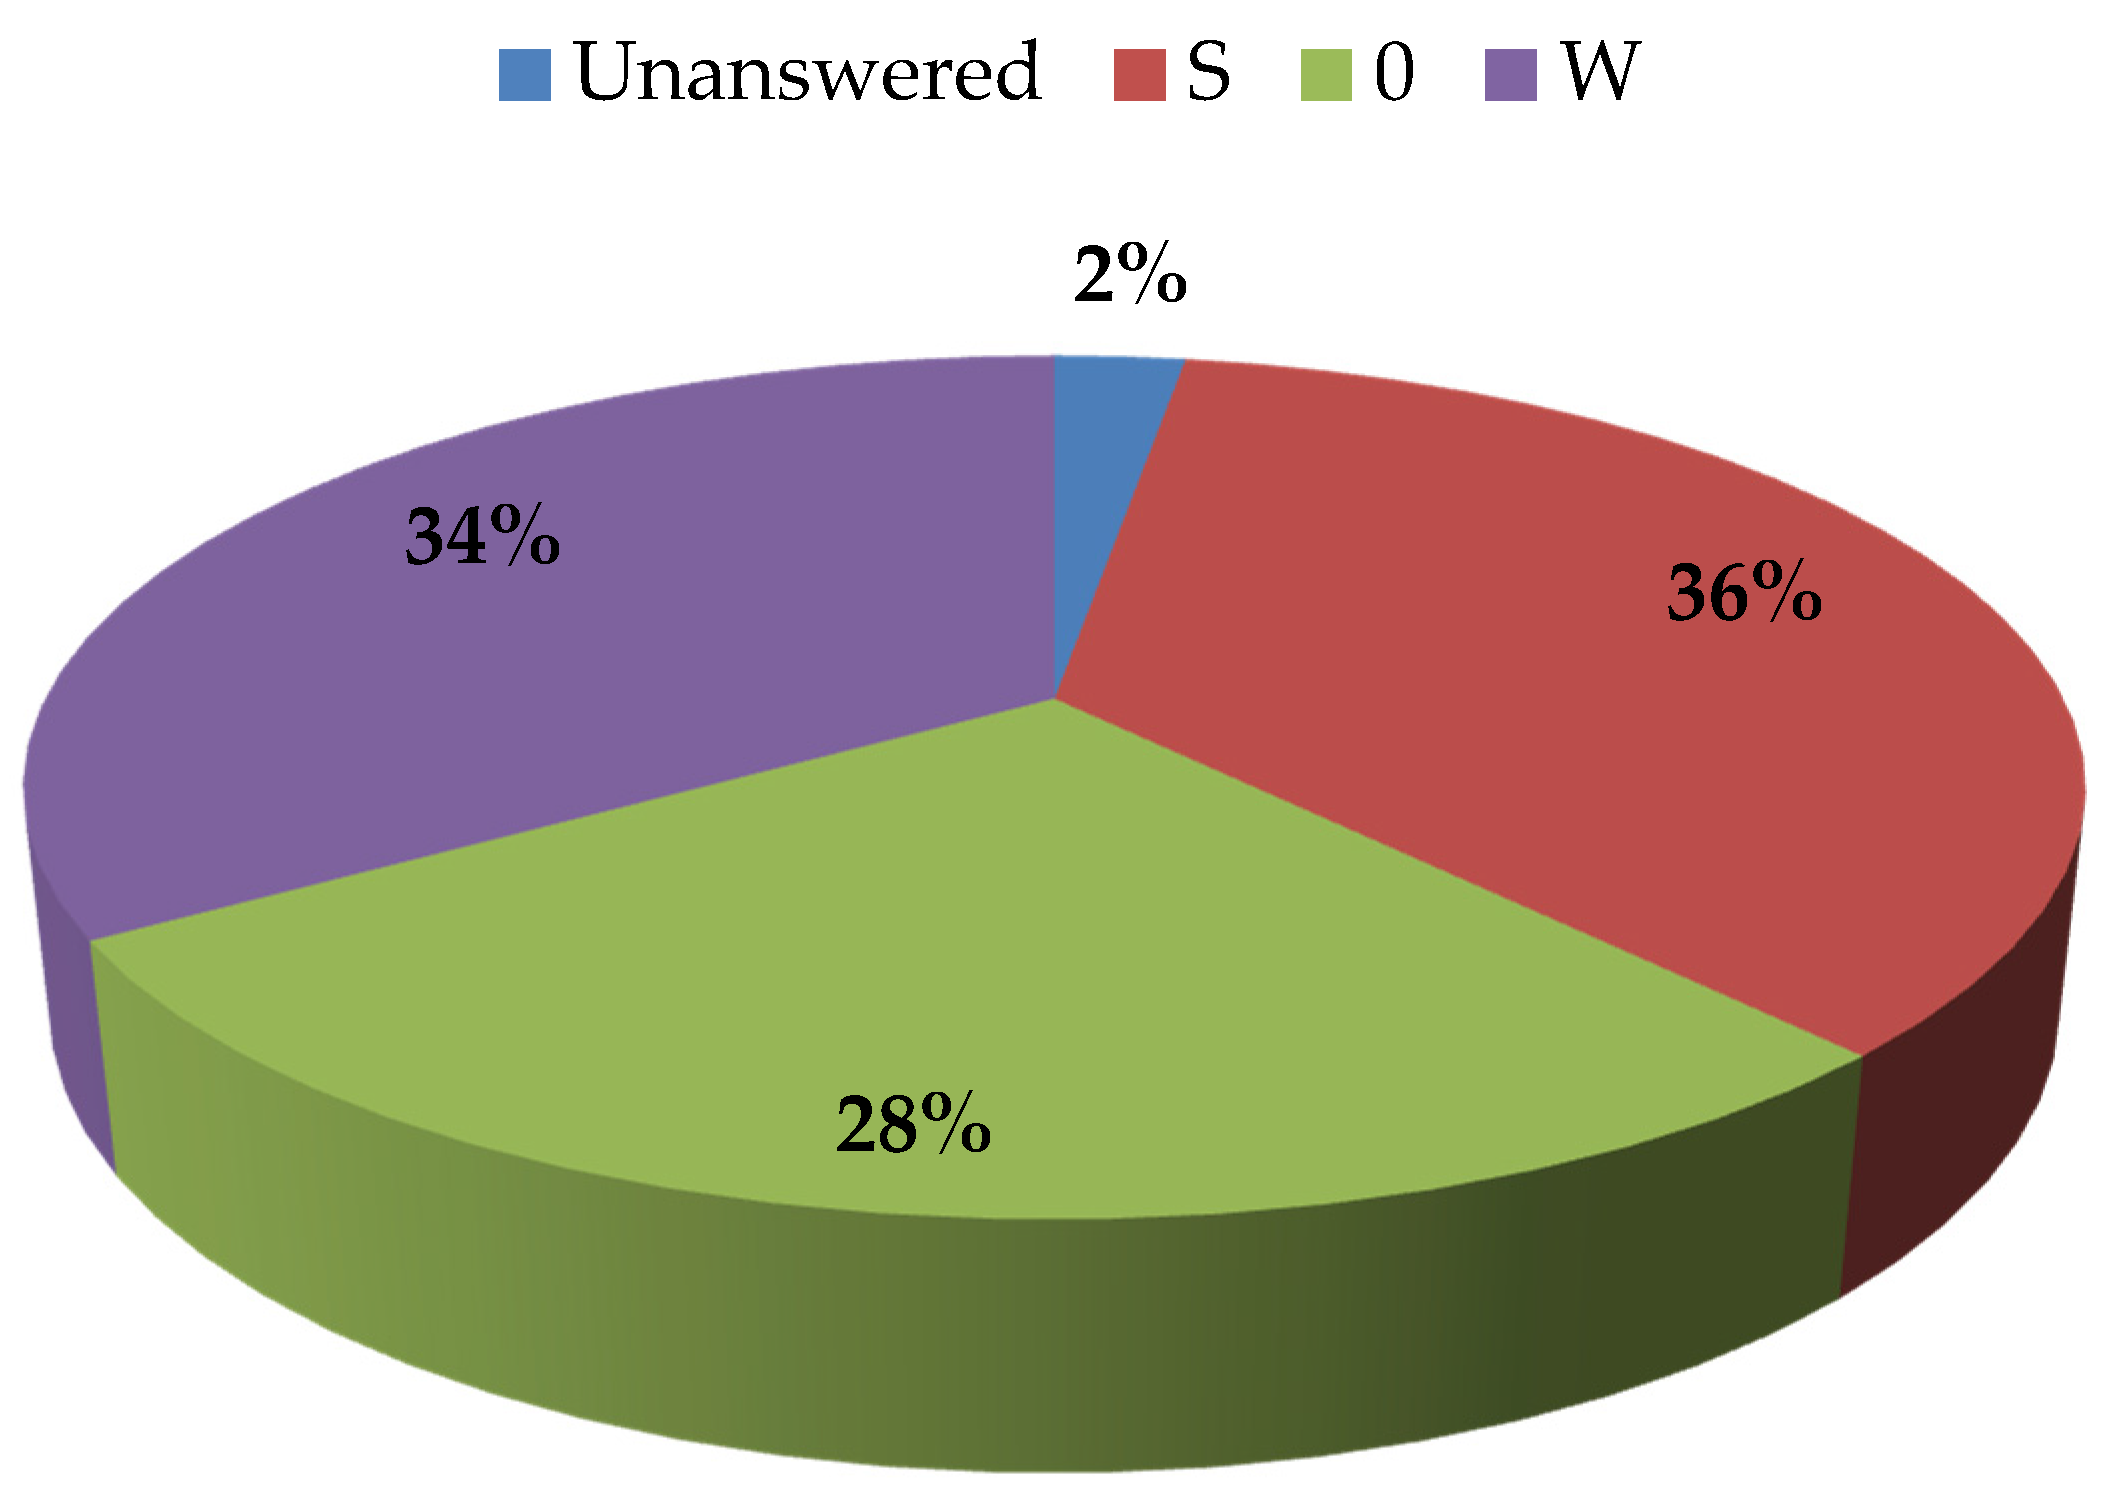
The answers were grouped as follows: number of students who left some valuation unanswered (Unanswered); number of students who chose a method with more value in the summer photos (S); number of students who chose the same value (0) in both seasons (S and W); and number of students who chose a method with more value in the winter photos (W).
The pie chart in
Figure 3 shows that the number of students who assigned a greater value to the specimens in the S photos (36%) is very similar to the number of students who assigned more value to the specimens in the W photos (34%). A total of 28% of the students assigned the same value, and only 2% of cases had photos with no valuation.
The hypothesis that the three variables considered (%S, %0 and %W) have a normal distribution cannot be rejected (Shapiro-Wilk test with
p-value > 0.05).
Table 2 contains a descriptive summary of these variables.
Similar values can be seen in regard to the measures of variability (SD and CV). The mean values show the lowest value for respondents who rate the photos equally and the highest for those who rate the summer photos higher.
Student’s
t test was conducted for the paired samples of percentages calculated in the same tree as shown in
Table 3.
Significant differences between the percentage of students who rate the specimen more highly in summer (% 0); the difference in percentage is estimated at 7.5% in favour of %S.
Significant differences between the percentage of students who rate the specimen more highly in winter (%W) and the percentage of students who rate the specimens the same in both seasons (%0); the difference in percentage is estimated at 5.6% in favour of %W.
Finally, no significant differences are observed between %S and %W.
A simple ANOVA (
Table 4) is done to analyse the possible influence of species (SP), leaf type (Type), and group factors (Group) defined in
Table 1 in each proportion variable (%S, %0, and %W).
The results of
Table 4 show that for the survey data:
there is no influence of the Type factor in any of the percentage variables;
there is no influence of the SP factor in the classes %0 and %W, or in %S for a level of 0.05;
there is no influence of the Group factor in %S;
there is a possible influence of the SP factor in %S at a 10% significance level;
there is a possible influence of the Group factor in %S and %W at a 5% significance level.
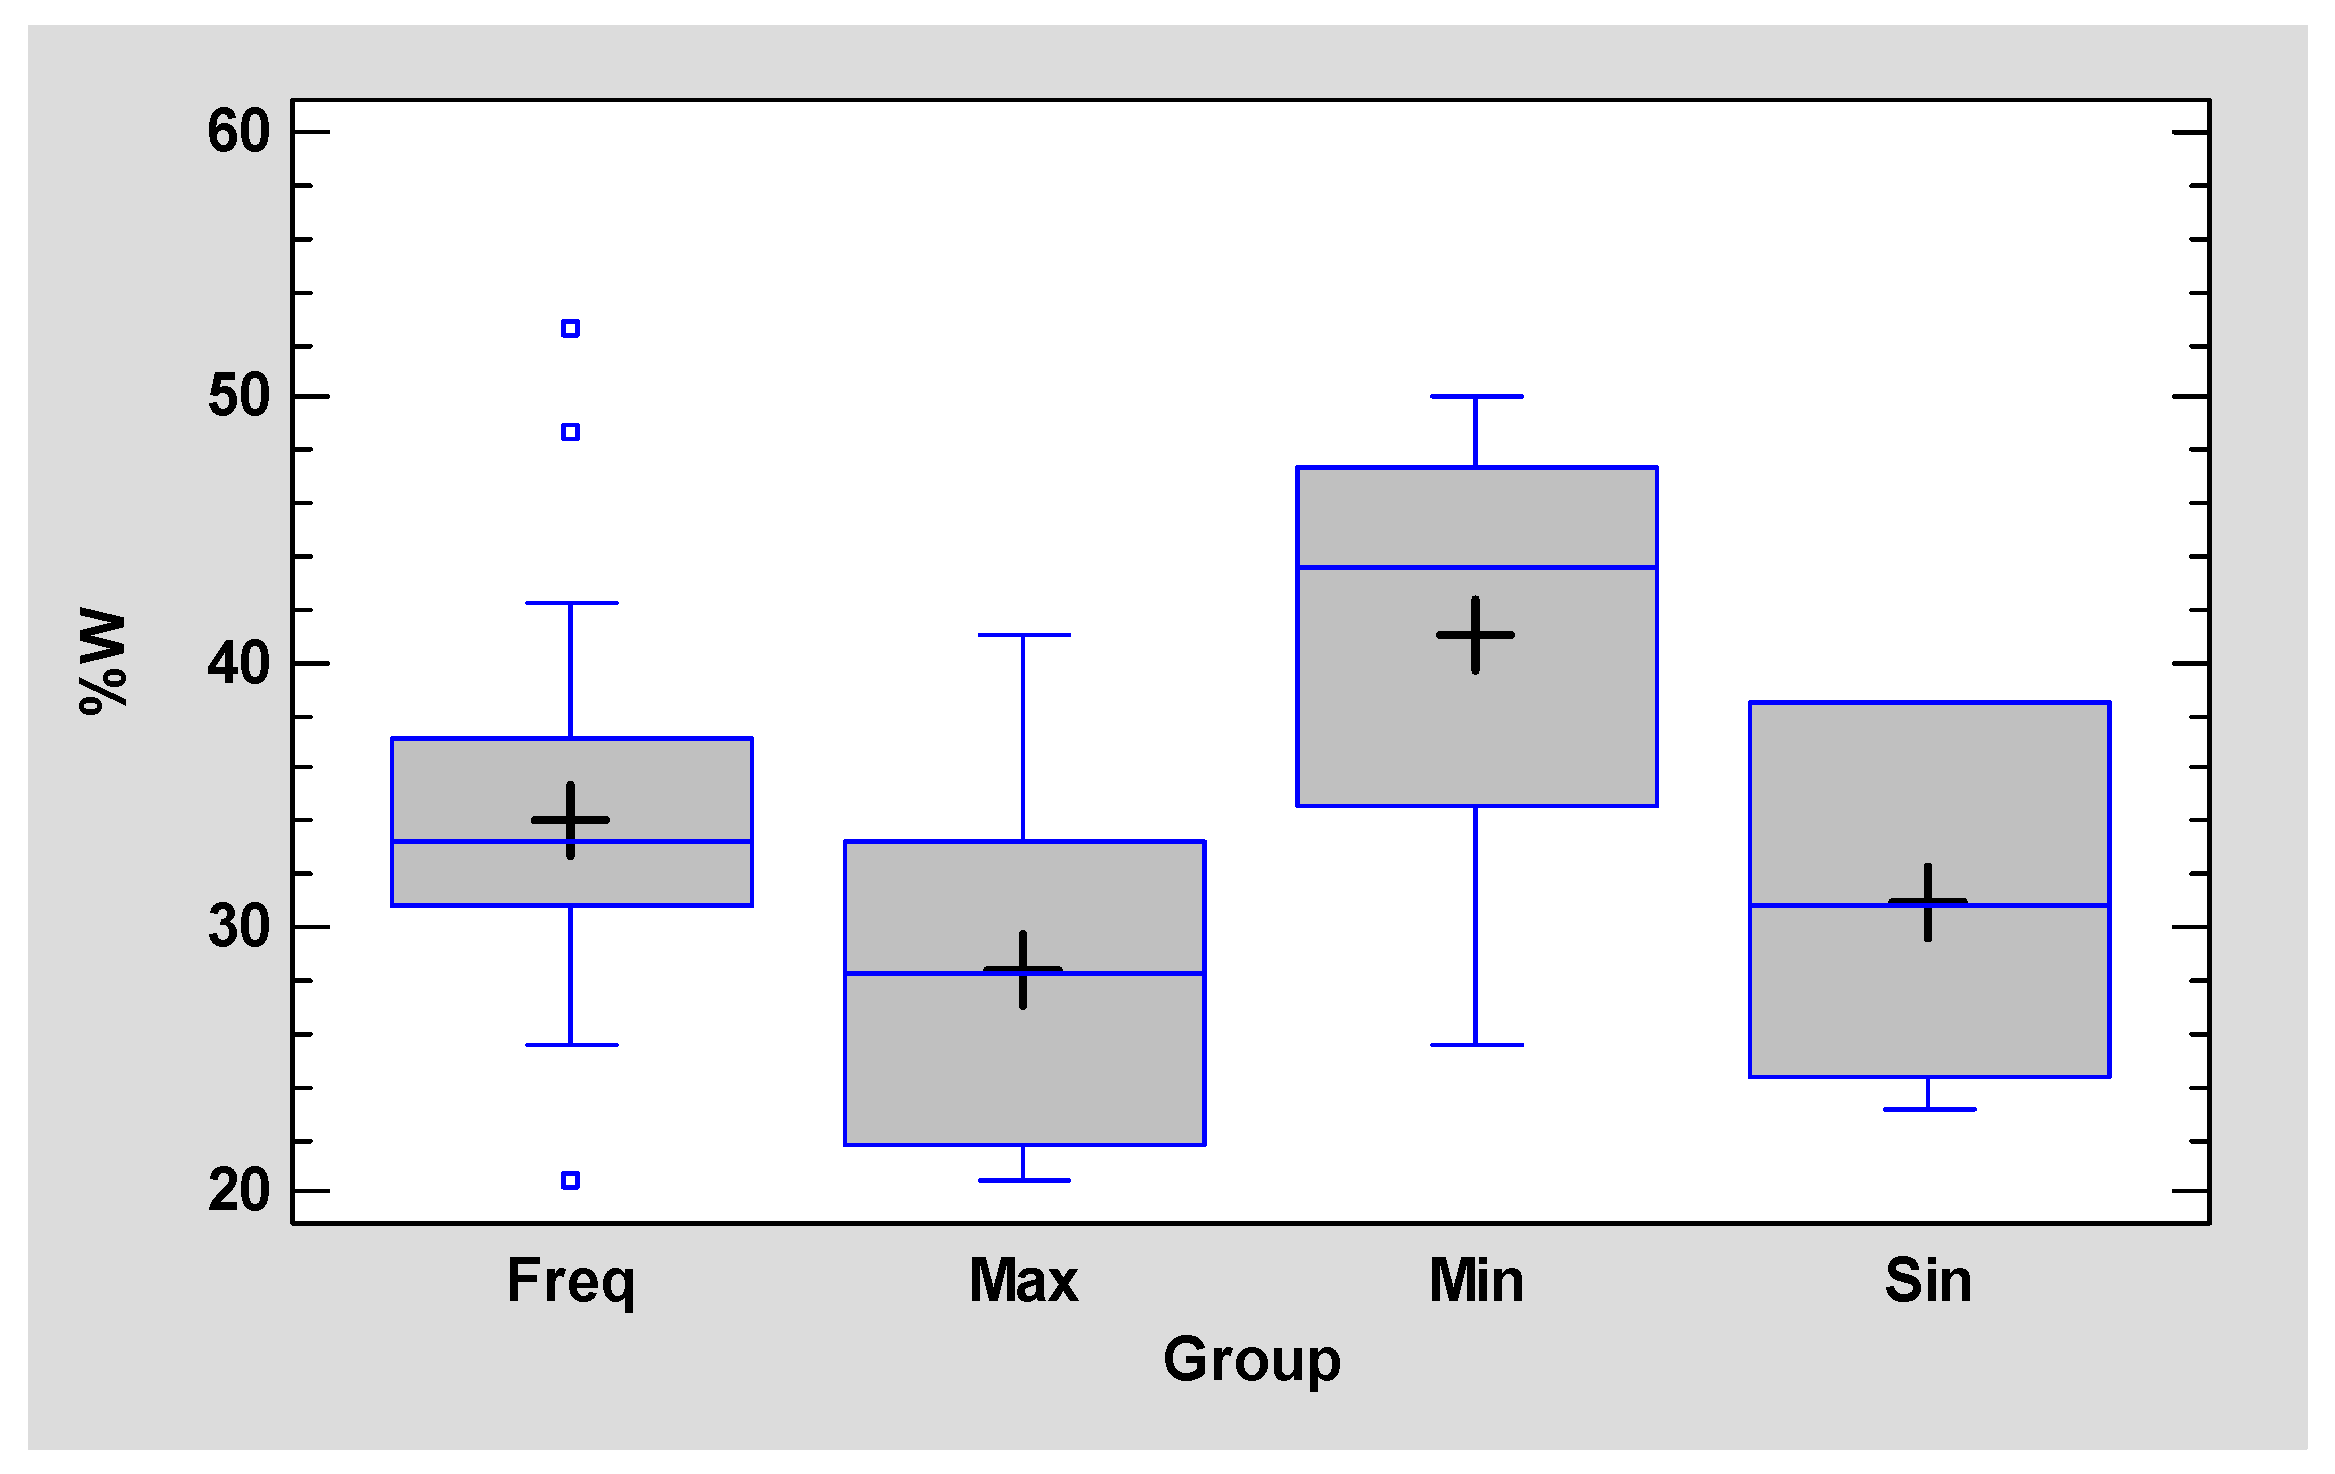
The graphs in
Figure 4 and
Figure 5 show the distribution of the values of the variables %S and %W according to the Group factor levels with statistically significant differences in the ANOVA test (
Table 4).
Figure 4 shows that the specimens that scored highest in all the methods were also rated more highly in the S photos by more students.
Figure 5 show that the specimens with the lowest scores in all the methods (min) had a higher average %W than the rest.
Table 5 and
Table 6 show the comparisons by pairs of levels for the Group factor for the variables %S and %W.
Table 5 shows that the average of %S is significantly lower for specimens with lower economic valuations in all the methods than for the group of maximum valuations and the group of singular trees.
Table 6 shows that the average of %W is significantly higher for the specimens with lower economic valuations in all the methods than for the rest of the Groups.
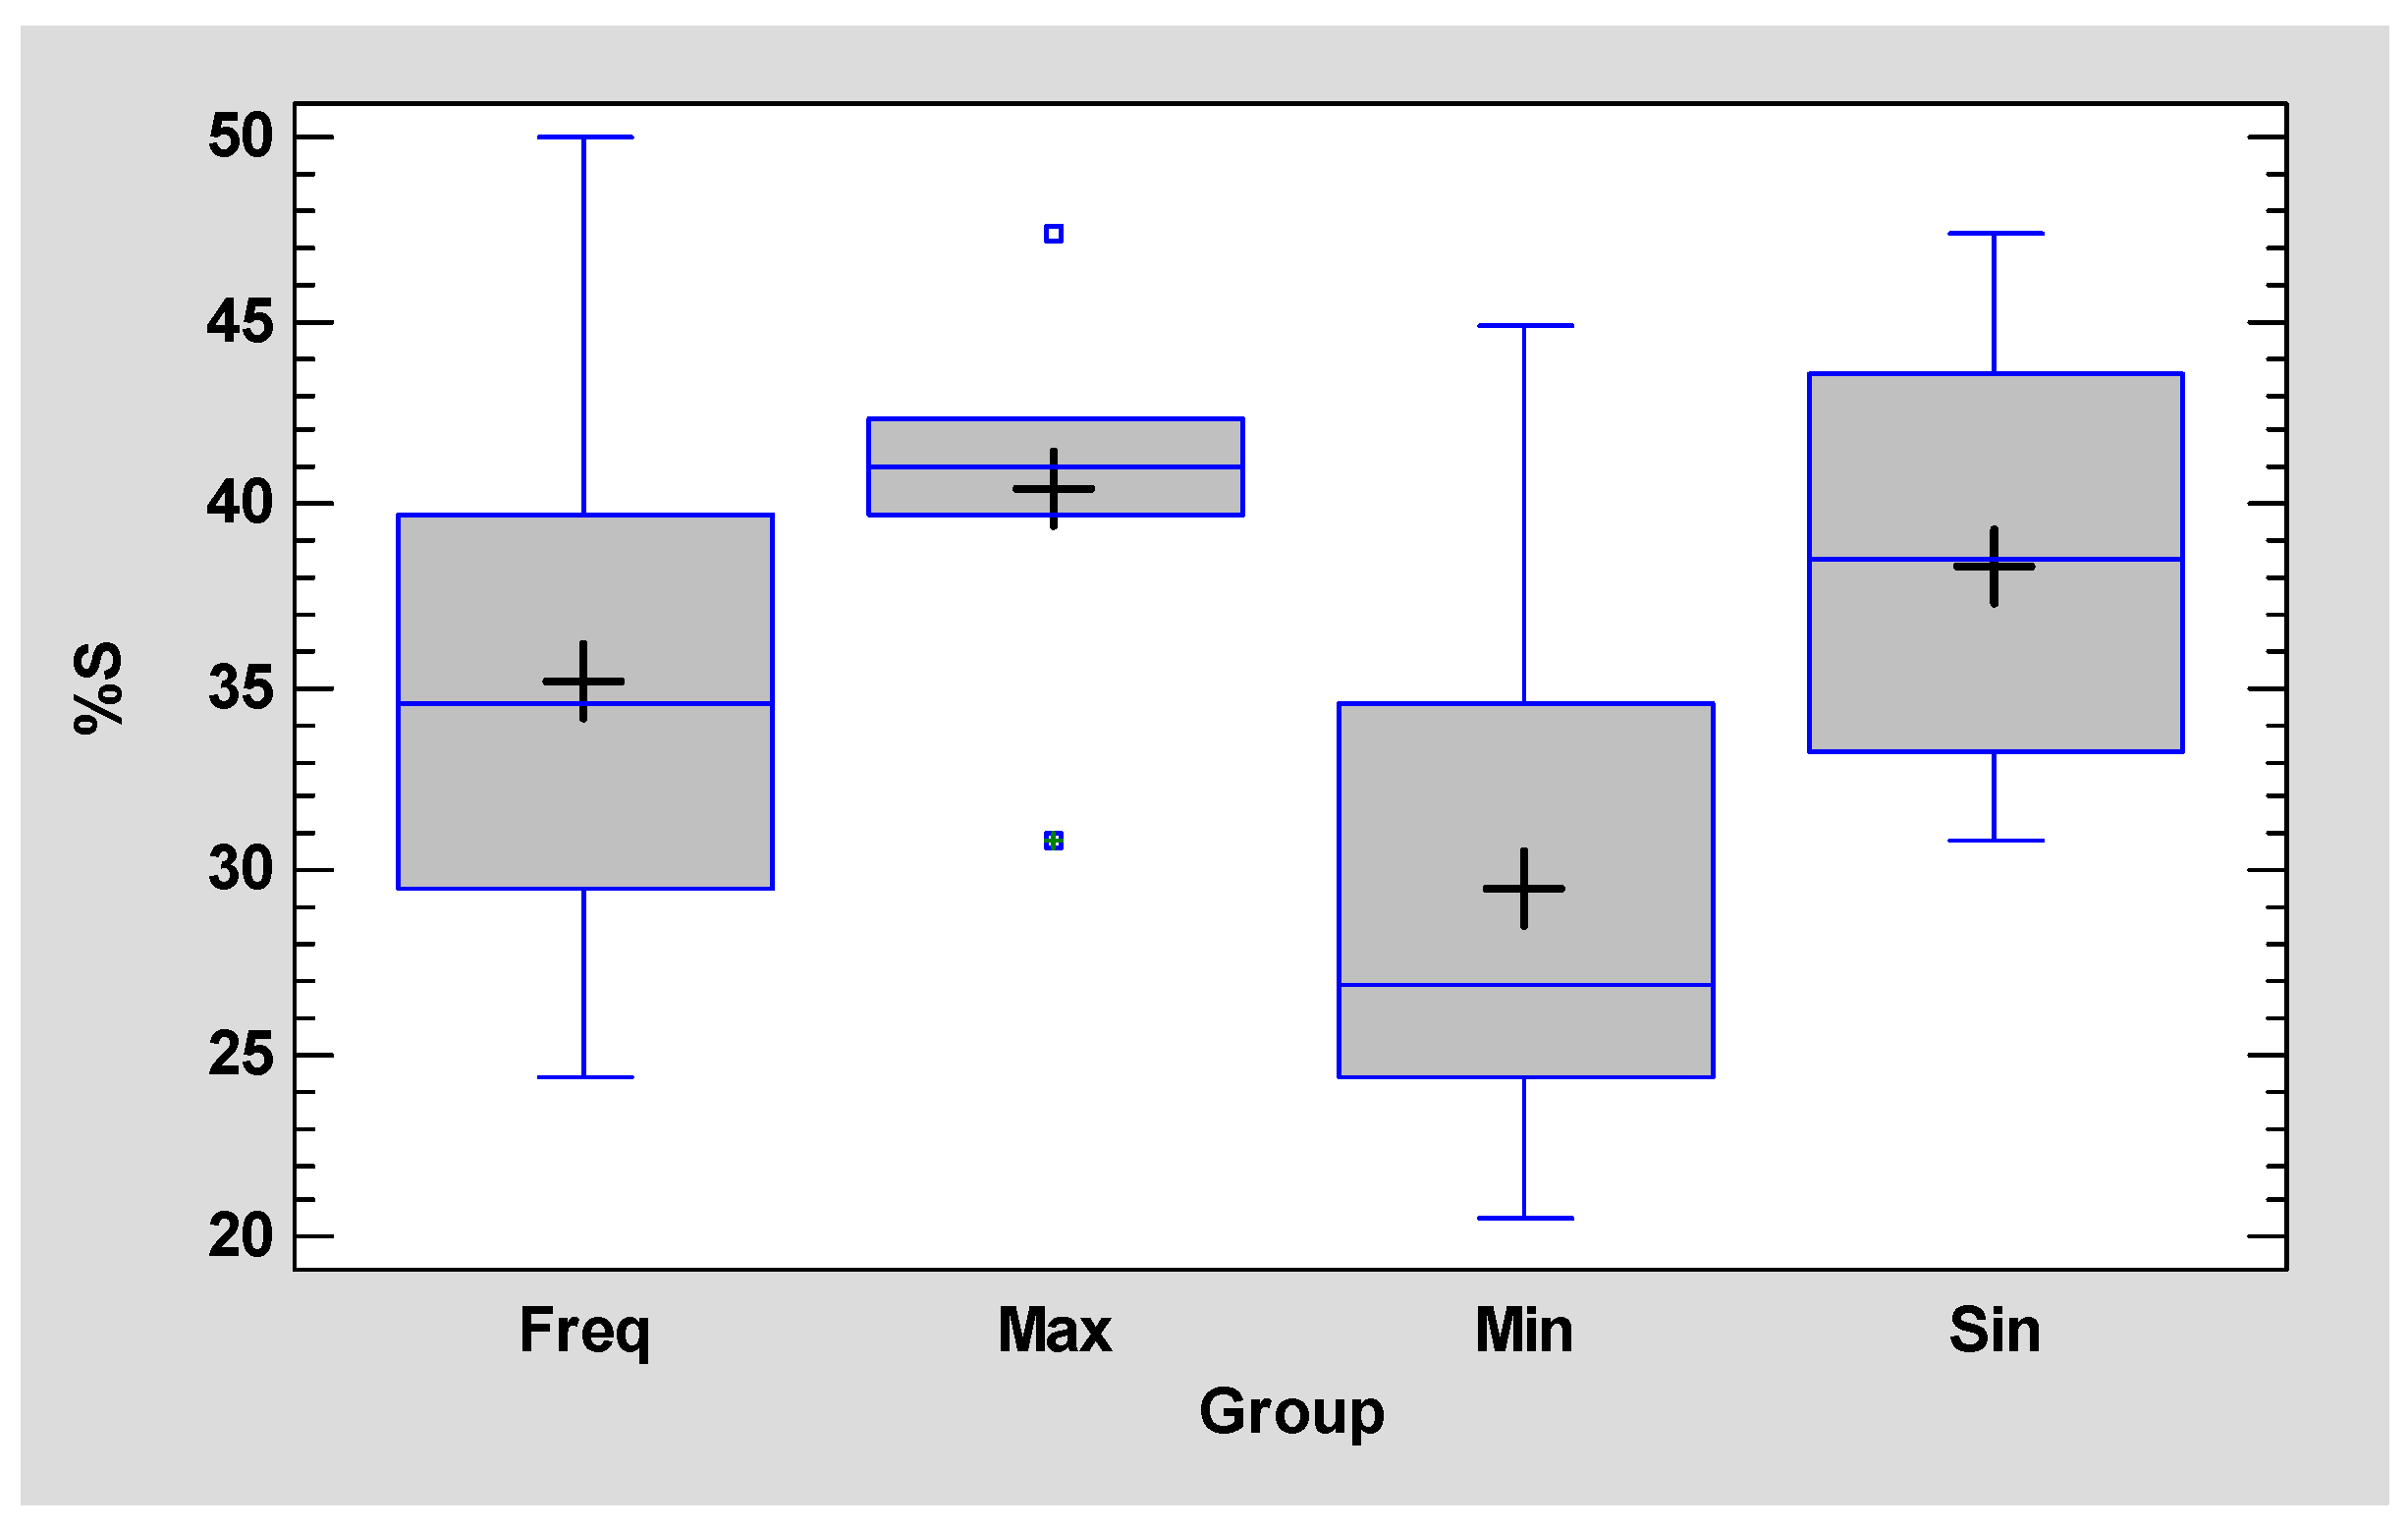
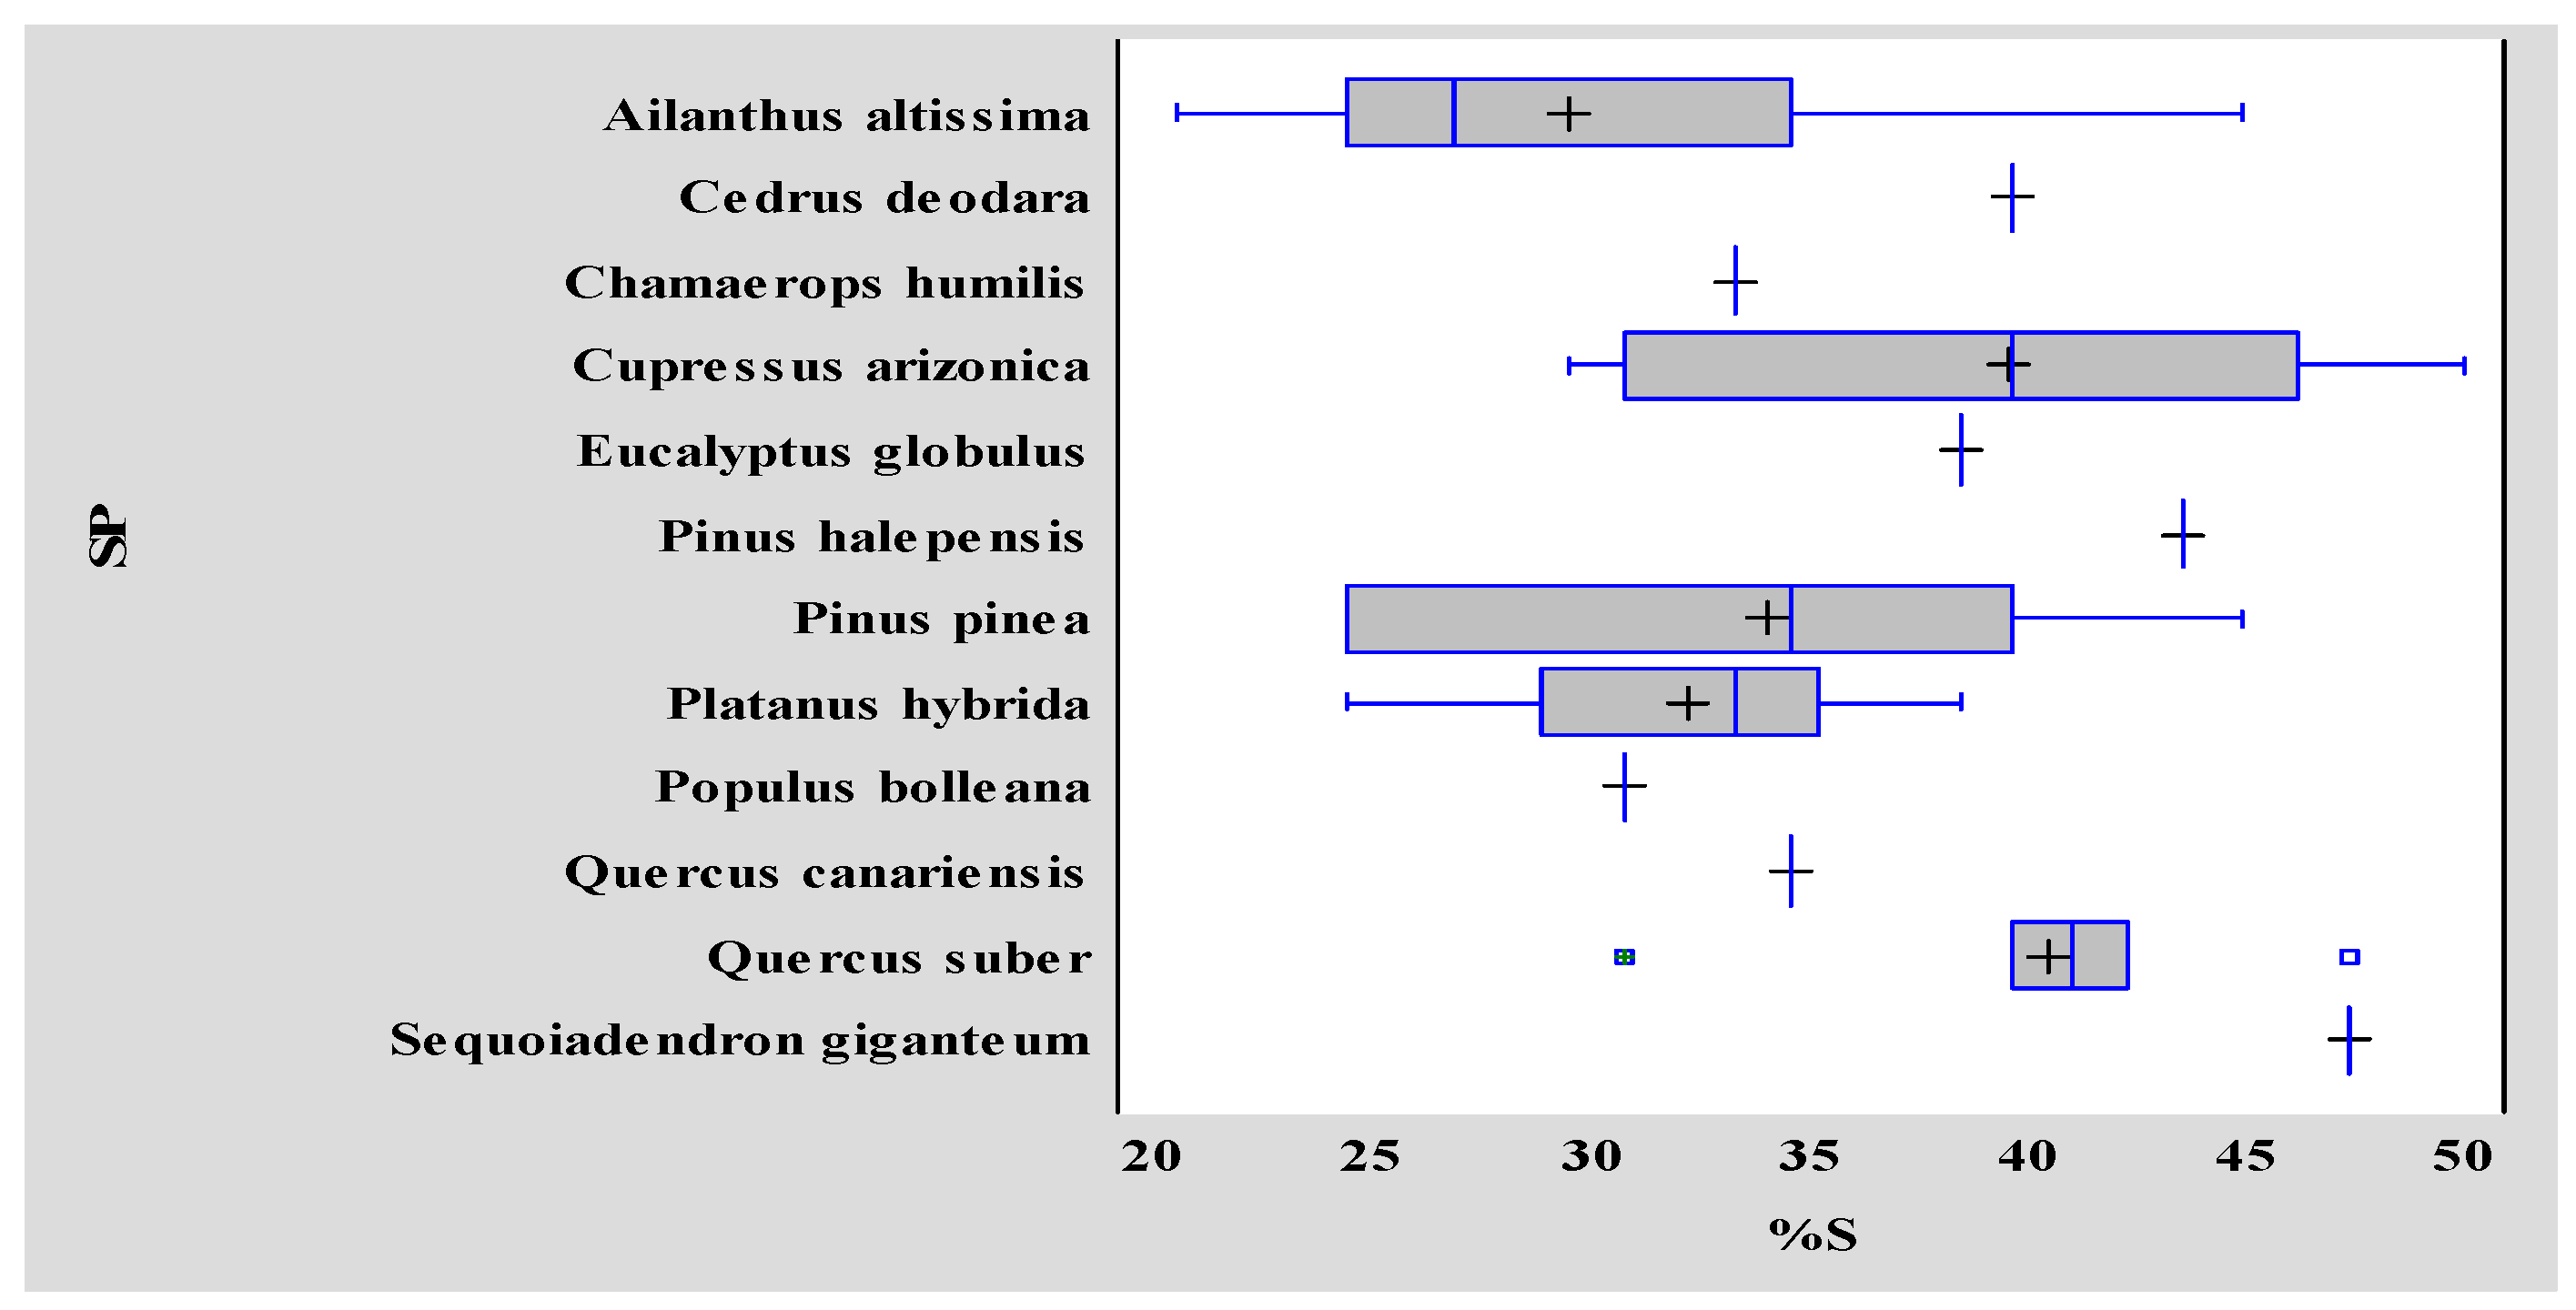
The equalities of variance were verified for all the ANOVA analyses with the Levene test to a confidence level of 95%. This equality was not rejected for Type and for Group, but could not be accepted for SP in any of the % variables. The box chart in
Figure 6 illustrates these differences in the dispersion of the groups of %S, and shows that due to the different sample size of %S according to the SP factor levels, there is homogeneity of variances, which invalidates the ANOVA for this factor.
The equality between the medians of each variable of % between levels of the SP factor can be rejected with the Welch test (
Table 7).
Multiple comparisons are made between %S values by SP pairs resulting in significant differences, as shown in
Table 8. The results with the same tests were done for the variable %0 (
Table 9) and %W (
Table 10).
Comparison of SP shows the SP pair in which the differences in %S are valued.
Difference is the value of the difference in percentage, with negative values when the percentage variable is greater in the second species in the pair and positive otherwise.
Table 8 shows that the median of %S for
Ailanthus altissima is lower than for the species
Cupressus arizonica (negative difference),
Quercus suber, and
Sequoiadendron giganteum. The median of %S is significantly higher for
Cupressus arizonica than for
Platanus ×
hybrida. The median of %S is significantly lower for
Platanus ×
hybrida than for
Quercus suber and
Sequoiadendron giganteum.
Table 9 shows that the median of %0 for
Chamaerops humilis is lower than for the species
Cedrus deodara, Cupressus arizonica, and
Sequoiadendron giganteum.
The results of
Table 10 show that the median of %W for
Ailanthus altissima is higher than for the species
Chamaerops humilis,
Cupressus arizonica,
Pinus halepensis, and
Quercus suber. The mean of %W is significantly higher for
Platanus ×
hybrida than for
Quercus suber.
4. Discussion and Conclusions
The survey results reveal differences between the seasons for the Capitalisation, FEM, and STEM methods. There are barely any differences in the selection percentages for the rest of the methods.
The calculation formulas in the mixed and parametric methods in this study take location into account. The photographs of the specimens show very little of the area around the tree, so the environment does not influence the interviewees’ responses. Similarly, the tree age cannot be seen in the photos, so no relation can be established between this variable and the results of the survey.
The results show that a similar proportion of students award the highest value to the specimen photographed in summer (%S = 36) and in winter (%W = 34), without any significant differences. The %0 percentage is not very different from the previous ones, but in this case, there are significant differences. The CV is similar in all three cases.
The ANOVA analysis reveals significant differences between the Groups of trees for the percentage of students who value the summer trees more highly, and for the percentage who value the winter trees more highly. However, there are no differences between Groups for the respondents who value the specimens equally.
The group of trees with the lowest scores in all the methods are the specimens of Ailanthus altissima. The ailanthus has the highest percentage of students who value the trees more highly in the winter photos. These are in turn the specimens with the lowest percentage of students who assess the summer trees more highly. This may be due to the fact that they are mostly young specimens that shed their leaves in winter, which may improve their valuation when comparing them with other specimens with deciduous leaves at this time of year. In any case, this supposition is still unverified.
The opposite occurs with Quercus suber. These trees achieve high scores with all methods. Cork oaks have the highest percentage of students who rate the summer trees more highly. These are also the specimens with the lowest percentage of students who rate the winter trees more highly.
There are no differences for the factors among the students who rated the specimens in the winter and summer photos the same. The data in this work offer no explanation for this result, which was also obtained in a previous work by the authors [
34].
It is also worth highlighting the lack of any significant differences between the specimens with perennial and deciduous leaves for any of the groups of students. This result contradicts the authors’ results in a previous study [
32], possibly due to the student sample, which had a greater proportion of undergraduate than Master’s students, and where there was an imbalance in their knowledge of trees. On this occasion, the sample is balanced between both. Differences in educational level affect the respondents’ preferences, as can be concluded from other works [
35,
36], and can even be seen between university students with different educational levels [
37].
Differences between species were detected with the Welch test for the three groups of students. In the first group (%S), a lower percentage of students value the ailanthus trees more highly in the summer photos than the cypress, cork oak, and sequoia trees. Plane trees are rated more highly in the summer photos by a lower percentage of students than cypress, cork oak, and sequoia trees. The rest of the species do not show any significant differences.
Fan palms are rated equally (%0) by a higher percentage of students than cedar, cypress, and sequoia trees. That is, fan palms have more similar scores in both seasons of the year.
In the last group of students (%W), the ailanthus has the highest percentage of students who value the trees more in the winter photos than cypress, cork oak, fan palm, and Aleppo pine. Plane trees have a higher percentage of students who value the trees more in winter photos than the cork oak.
These results do not point to any clear conclusions in regard to the differences in valuation between the seasons. The percentages of students are similarly distributed between the three options. It would therefore be advisable to increase the number of specimens per species and to make comparisons between groups that are internally more homogeneous. To verify the results between evergreen and deciduous trees, a study should be designed based solely on that factor, and with fewer photos. It is also necessary to increase the number of answers and maintain a balance between different educational levels. Clearer results can be obtained if the number of valuation methods is reduced.

 and
and 


