High-Resolution Analytical Approach to Describe the Sensitivity of Tree–Environment Dependences through Stem Radial Variation


1
Istituto per la Protezione Sostenibile delle Piante (IPSP), Consiglio Nazionale delle Ricerche (CNR), 50019 Sesto Fiorentino, Italy
2
Dipartimento di Agricoltura, Ambiente e Alimenti, Università degli Studi del Molise, 86100 Campobasso, Italy
3
The EFI Project Centre on Mountain Forests (MOUNTFOR), Edmund Mach Foundation, 38010 San Michele all’Adige, Italy
4
Istituto Valorizzazione Legno e Specie Arboree (IVALSA), Consiglio Nazionale delle Ricerche (CNR), Via Madonna del Piano 10, 50019 Sesto Fiorentino, Italy
*
Author to whom correspondence should be addressed.
Forests 2018, 9(3), 134; https://doi.org/10.3390/f9030134
Submission received: 29 December 2017
/
Revised: 22 February 2018
/
Accepted: 7 March 2018
/
Published: 12 March 2018
(This article belongs to the Special Issue Tree Ecophysiology: Responses and Adaptation to a Changing Environment)
Abstract
:Stem radius variations are remarkably synchronous to weather conditions. Climate fluctuations can forecast the occurrence and severity of environmental disturbance on radial variations, as well as tissue sensitivity and tree growth. Radial variations were detected through dendrometers and were analyzed coupled to environmental conditions to define stem sensitivity in response to experimental (logs in lab) and natural (trees in field) drivers. By using a mathematical approach for the analysis of plant traits and environmental variables, this study aimed at highlighting a methodological framework to analytically unravel the environmental control of stem cycles. A derivative analysis was performed on data derived from experimental measurements, which showed a high degree of agreement between environmental drivers and dendrometer signals. The analytical approach provided information on plant performance in response to environmental variation, removing the confounding effects of different variables. Coding of the dendrometer signal provided a process to quantify stem sensitivity to ambient temperature, to portray synchronicity of time series related to stem radial variations and air temperature events, and to identify time lags of environmental effects on plant traits.
1. Introduction
Dendrometers are automatic instruments to measure short-term changes in stem radius (point-dendrometer) or circumference (band-dendrometer) in temporal detail at resolution of micrometers [1]. Dendrometer measurements provide time series documentation of the water storage fluctuations over the year and seasonal tree growth [2]. The combination of synergic measurements of plant processes provides the quantification of growing rate and the synchronization of environmental drivers with plant physiology [3]. The radial stem variations are detectable during the whole year, both in the growing season and in winter, when large stem variation is caused by alternating frost shrinkage and thaw expansion due to temperature changes [4]. Although dendrometers represent important tools to describe at fine time scale the intra-annual growth pattern and tree water relations, the physiological interpretation of growth signals remains difficult to interpret, because it is the result of a complex interaction between plant phenology, genotype and the environment [5]. The synchronization of time series relevant for signal analysis may provide a key help in simplifying the interpretation of the relationships between short-term fluctuations in stem radial diameters and the effect of environmental drivers. The complexity of the interaction between environmental signals and growth dynamics is a complex issue, defined by different degrees of correspondences between stem variations and climate variables (e.g., [6]). Therefore, dendrometer data require corrections and calibrations in order to remove signal noise, to separate environmental impact from tree growth and to approximate site productivity (in absence of other techniques, e.g., eddy covariance). This approach may provide a tool for unravelling the effects of hygroscopic properties of outer bark on radial variations of tree stem.
Several empirical methods are currently applied on data gathered with dendrometers to monitor tree growth patterns (e.g., [5,7,8,9]). Laborious, time-consuming or technically demanding techniques are required to disentangle radial stem variation due to the co-occurring opposing processes of irreversible stem growth, due to the increase of biomass and stem circumference, and reversible circumference changes, due to the changing of water content into the phloem (and bark thickness). The dynamics of stem water depletion and replenishment modify the water potential of maturing xylem and phloem and cell turgor during the enlargement phase, affecting radial growth, which is detectable through high resolution analysis of dendrometer data [10]. The plant growth responses to water availability detected through dendrometers explicitly forecast the plant adaptation to environmental changes, as well as the strength of the cambial region as carbon sinks under warmer and drier conditions [11]. The detail of measurements provides seasonal courses of day-to-day stem radius variation, and shows remarkable synchronicity to weather conditions [12]. Moreover, tree growth dynamics result by time series synchronization of environmental factors (abiotic and biotic) and tree growth [13]. Therefore, as radial growth is highly synchronized with climate patterns, it is reasonable to hypothesize that climate fluctuations can be used to forecast the response of tree growth on the occurrence and severity of environmental disturbance.
Objective Decoding of Stem Radial Variation Time Series
Several approaches have been used to decode time series of stem radius variations [8,14,15]. The extraction of stem radius variation is the direct method to define the annual continuous time series. Continuous stem contraction and expansion phases occur in daily cycles (a maximum point per each phase in each day, with daily mean and daily maximum) [16] and the stem cycle analyses allow for understanding the tree’s response to short-term changes in environmental conditions [2]. Although the analyses of stem cycles have been successfully used to separate dendrometer-derived phases of contraction, expansion and stem-radius increment (e.g., [16]), the synchronizations of dendrometer records with environmental parameters remain uncertain and difficult to obtain. Within this frame, the development of appropriate algorithms, improving the synchronization between ‘biological’ and ‘environmental’ signals, is needed.
In order to overcome this shortcoming, we propose the alignment of stem radial variations and climatic parameter fluctuations through the derivative function to construct growth profiles in relation to environmental signals. We focused on air temperature, because it is the best kept of climatic records (predicted to keep rising into the future) and the most measured environmental variable, and thus practical for comparing laboratory and field data. This approach allows for generating consensus profiles of time series for a more comprehensive understanding of the stem variation dynamics across individual trees and environmental conditions. A detrending procedure is proposed to increase our understanding of the relationship between stem radial changes and environmental conditions, disentangling endogenous trends and stem cycles. Since environmental conditions influence stem radius fluctuations, the combination of the derivative signals of dendrometer and climatic time series would allow for converting the dendrometer record as an indicator of the operational sensitivity/synchronicity of tree functions to/with environmental disturbance.
2. Methods
2.1. Data Collection and Sensor Calibration
Stem radius variations were collected using automatic point dendrometers [17]. These instruments measure the linear displacement of a sensing rod (mechanical travel, 12.5 mm) pressed against the bark. The operating principle is based on the use of a linear variable transducer (AB Electronics Ltd., Romford, Essex, UK) that records stem radial variation with an average sensitivity of 260.01 mm V−1 (linearity of 62%, linear expansion coefficient of 16 µm m−1 °C−1). The rod transmits the signal of stem expansion and contraction to the transducer. The variable potential (mV, millivolt) is digitized by an analogue-to-digital converter (PCI-1710 pg, Advanthech, Taiwan) connected to a PC-based data recording system. Raw data were recorded every 15 min, and hourly averages were calculated.
The sensor sensitivity to air temperature was determined by a 102-point calibration curve from 1.3 and 11.4 mm (0.1 mm incremental rate). The calibration was determined by use of a screw micrometer (precision 0.01 mm) moving on a slide and performing tests at 5 °C and 25 °C (r2 > 0.999). The linear equation y = a × x + b was used to convert the tension output (mV) to mm.
2.2. Data Analysis
We used the innovative derivative analysis of raw data to quantify the degree of correspondences between stem variations and environmental conditions. This methodological approach detailed the sensitivity of stem diameter to the variation in environmental conditions. We first combined the environmental and stem signals to reveal the impacts of air temperature fluctuation on stem diameter variation (Figure 1). This signal provided a proxy of how stem diameter variations and temperature fluctuation dynamics synchronize from a diurnal to a seasonal time scale. The derivative approach can be used when sensitivity analysis of time series data (in this case, dendrometer records and temperature dynamics) is required to synchronize simultaneous physiological and environmental cycles. Finally, stem radial variation and air temperature fluctuation were employed as input variables to analyse the simultaneous occurrence of their temporal dynamics in tree–environment dependences.
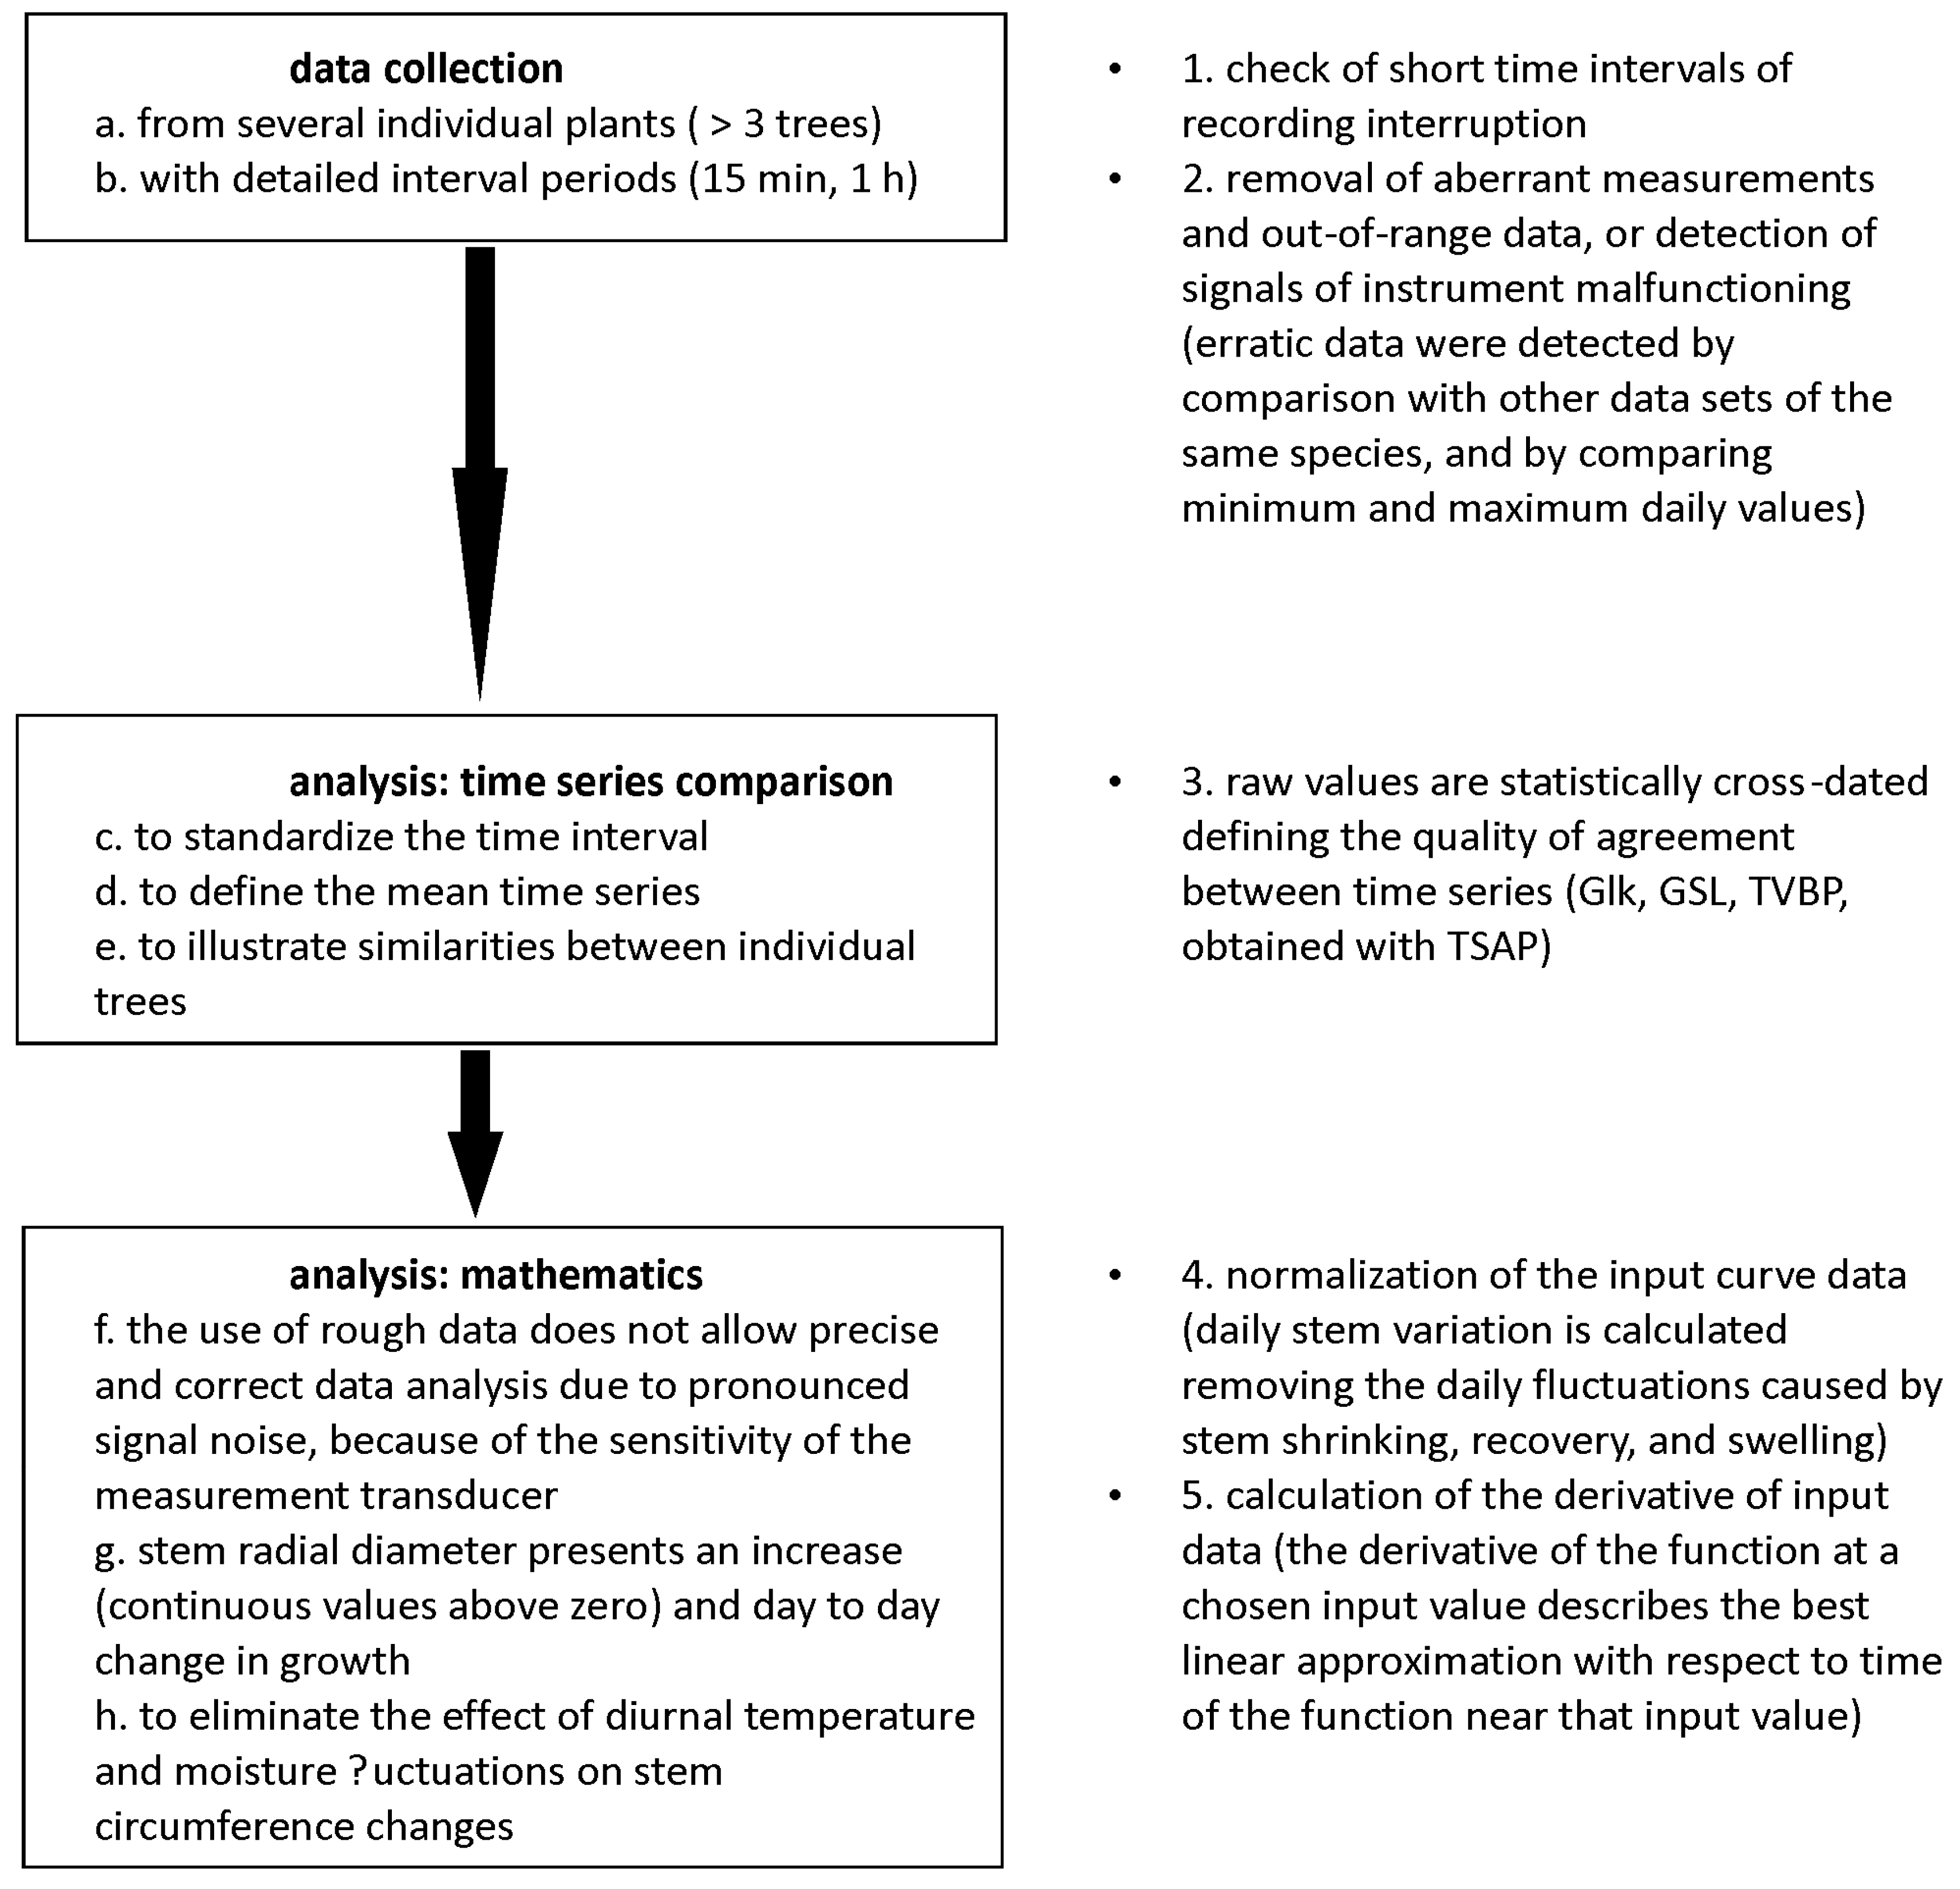
After checking the quality of dendrometer and environmental raw data, time series were statistically compared and normalized, and the derivative function of time series was employed to quantify simultaneity and sensitivity of signals (Figure 1).
2.3. Stem Sensitivity in Cooling Test
Although the most appropriate temperature and duration of cold acclimation treatment may vary in relation to species, in our experiment, we assumed that the acclimation phase was reached in all the species. Therefore, we set the cooling conditions for three species to assess effects of cold hardiness status of wood tissue.
Mature trees of Fagus sylvatica L., Castanea sativa Mill. and Pinus sylvestris L. were felled in November at “Foresta di Rincine” in Tuscany (Italy). Stem segments (100–120 cm long) (Table 1) were collected at breast height and transported to the Laboratory of Xylogenesis at Istituto Valorizzazione Legno e Specie Arboree (IVALSA), Consiglio Nazionale delle Ricerche (CNR, Sesto Fiorentino, Italy). From each fresh stem segment, a log of 41.1 ± 0.8 cm in length long and 19.8 ± 2.9 cm in diameter was obtained. Beech, chestnut and Scots pine were chosen as being representative of the different types of porosity: diffuse-porous (F. sylvatica) and ring-porous (C. sativa) for deciduous species, as well as ring-porous (P. sylvestris) for coniferous species. The logs were rehydrated in an impregnation chamber (vacuum—atmospheric pressure) with a 6 L total capacity. Wood samples were placed into the chamber and air was pumped out for 15 min at 0.7 kPa. Subsequently, the water was allowed to flow in the chamber and then it was slowly brought to atmospheric pressure again. The wood samples were left soaking in the deionized water for 12 h, then after a gentle wipe, they were weighed and placed in the conditioning room. The water saturation process of the logs was characterized through the determination of weight percent gain in reference to the anhydrous mass of untreated wood [18]; logs were exposed to cool treatments in indoor controlled chambers. Thermal excursions were achieved by 10 cyclic thermal excursions in an automatic way, with a high step of temperature at 22 °C for 12 h and a low step at 4.4 °C for 12 h (Figure 2).
Logs were equipped with point dendrometers, installed at the center of the log. Differences in wood porosity between species strongly affect the calibrated values of the hydraulic model parameters [19]. In tree ecophysiology, the relevance to compare intra-annual wood formation of different tree species is related to leaf and bud phenology and non-structural carbohydrate dynamics [20]. In wood technology, diffuse- and ring-porous species have different technological properties and uses within the woody chain supply, due to their different basal densities and xylem traits within tree rings. Basal density is considered the most important woody trait for technologists.
2.4. Stem Diameter Fluctuations during the Growth Season
Raw data of stem diameter variation (Figure 3A–C) in olive (Olea europaea L.), Norway spruce (Picea abies L.) and poplar (Populus deltoides Marshall.) trees were monitored during the growing season in field conditions (Table 2), using automatic point dendrometers installed at breast height [21]. The olive tree experiment was performed with “Canino” cultivar, cultivated at single-trunk free canopy at a spacing of 4 m × 4 m, collecting stem diameter data of four individual trees in the experimental farm of IVALSA, CNR, located in Follonica (GR), Toscana, central Italy (42°55′ N, 10°45′ E, 17 m a.s.l.) [5]. Dendrometer signals of Norway spruce were daily detected on five dominant individual trees (35–40 cm at breast height), in a mixed forest at altitude 680 m a.s.l., in Savignano (TN), Trentino, Northeastern Italy (45°56′ N, 11°03′ E), having a mild continental climate with sub-Mediterranean influences, representative of forests dominated by Quercus pubescens Willd., Quercus robur L., Fraxinus ornus L. and Ostrya carpinifolia Scop., with secondary presence of Castanea sativa, Pinus sylvestris, Larix decidua Mill. and P. abies [22]. The poplar experiment was carried out with “Dvina” clone in two concrete tanks, 10 m long, 1.5 m wide, and 1.2 m deep, set in the soil oriented north–south and physically separated from one another, collecting stem variations of two trees per tank in the experimental plot at the CRA-ISP (Istituto di Sperimentazione per la Pioppicoltura), in Casale Monferrato (AL), Piemonte, Northwestern Italy (45°07′ N, 8°30′ E, 106 m a.s.l.) [21].
The analysis was performed in a 4-day interval during July, considered as a representative time interval of the species-specific growth pattern. The shrinkage values (mm) correspond to stem radius variations (Figure 3D–F), calculated as the difference between two consecutive points (stem radius variation = signaln − signaln−1) in order to standardize the dendrometer signal, removing the growth effects in the record trend (as shown in Figure 3A–C). We considered temperature as the main meteorological driver of tree growth and development (Figure 3G–I), according to [24].
2.5. Time Series Comparison
Data recording of automatic point dendrometers and environmental parameters has a time interval detail depending on the datalogger setting. The comparison between time series requires the definition of the same time interval (e.g., 15 min or h).
Data of automatic point dendrometers are generally recorded in several individuals (e.g., three or more trees). Individual time series for sample trees from a single site are averaged to a mean chronology to enhance the common underlying signal. The strength of the mean signal is estimated by calculating the correlation coefficients between the individual series. In the present study, the time series of stem diameter variation, measured using automatic point dendrometers, was statistically analysed with the Time Series Analysis Programme (TSAP) software package (Frank Rinn, 2003, Heidelberg, Germany), which was originally developed as a tool for cross-timing of tree-ring series. With this procedure, raw values are cross-dated statistically defining the degree of agreement between time series, Gleichlaufigkeit (Glk) values [25] (Table 3). The statistical significance of the Glk is defined by GSL (Table 3). The TVBP, a Student’s t-value modified by [26] and further developed by [27], is used for investigating the significance of the best match identified.
2.6. Mathematics
Rough dendrometer data are frequently disturbed by pronounced background noise that affects the signal, which is due to the sensitivity of the measurement transducer, and that does not allow for objective data analysis. Therefore, dendrometer data, as well as environmental parameters, were processed through the normalization of the curve in the range of input values between 0 and 1. This function was used to adjust the curve to a specific standard level.
Suppose Y is the y values of input curve, and α is a user defined value, the normalized curve, Y′ is divided by a specific value:
normalize to [0,1]:
Successively, the stem radial variation and air temperature fluctuation experimental data were analysed through the calculation of the derivative of input data, as a support to the use of rough data. The derivative analysis was performed through OriginPro, a data analysis and graphing software package (Version 8, 2007, Northampton, Massachusetts, USA). The derivative at a point was computed by taking the average of the slopes between the point and its two closest neighbors, without smoothing. The derivative of a function represents an infinitesimal change in the function with respect to one of its variables. For a function of a single real variable, the derivative at a point is equal to the slope of the tangent line to the graph of the function at that point. As the experimental data are a function of time f(t), the analysis was performed through time derivative f’(t):
where t corresponds to time, and Δt is the time increment.
The derivative of the function at a chosen input value describes the best linear approximation with respect to time of the function near that input value. Derivative function emphasizes the rate of variation of a function; a positive value of the derivative refers to the input function when the graph is increasing, while a negative value to the function when the graph is decreasing. The sensitivity of the dendrometer transducer shows a permanent noise, which means, on the derivative curve, a high number of events (peaks, x-axis intersection). As a consequence, the normalized derivatives allow for amplifying the eventual differences between time series. The derivative curve is simply divided by the maximum absolute value in order to provide data ranging from −1 to 1. The intersection of the derivative curve with the x-axis, i.e., the null value of the derivative, corresponds to an extreme of the input function. A positive (negative) derivative that intersects the x-axis indicates a local maximum (minimum) of the input function. Derivative function procedures allow for defining the time lag between time series through the quantification of the time interval between the intersections of derivative curves along the x-axis.
3. Results
3.1. Stem Sensitivity in Cooling Test
Stem diameter fluctuations of logs subjected to the standardized cooling protocol showed differences in cold hardening among tree species in relation to xylem structure. Cooling showed regular and repeated standard rate of shrinkage, recovery, and swelling in tissues of beech and Scots pine (Figure 2). The duration of cooling cycles was useful to describe a clear cyclic behavior (shrinkage, recovery, swelling) in ring-porous in comparison to diffuse-porous wood (Figure 2). The experimental analysis allowed to evaluate the sensitivity and elasticity of stem tissues to cooling events in a standard (water-saturated) state. As an extension of this procedure, the use of dendrometer in lab conditions can be applied to monitor the process of acclimation treatments and to test technological properties of wood in controlled cooling tests.
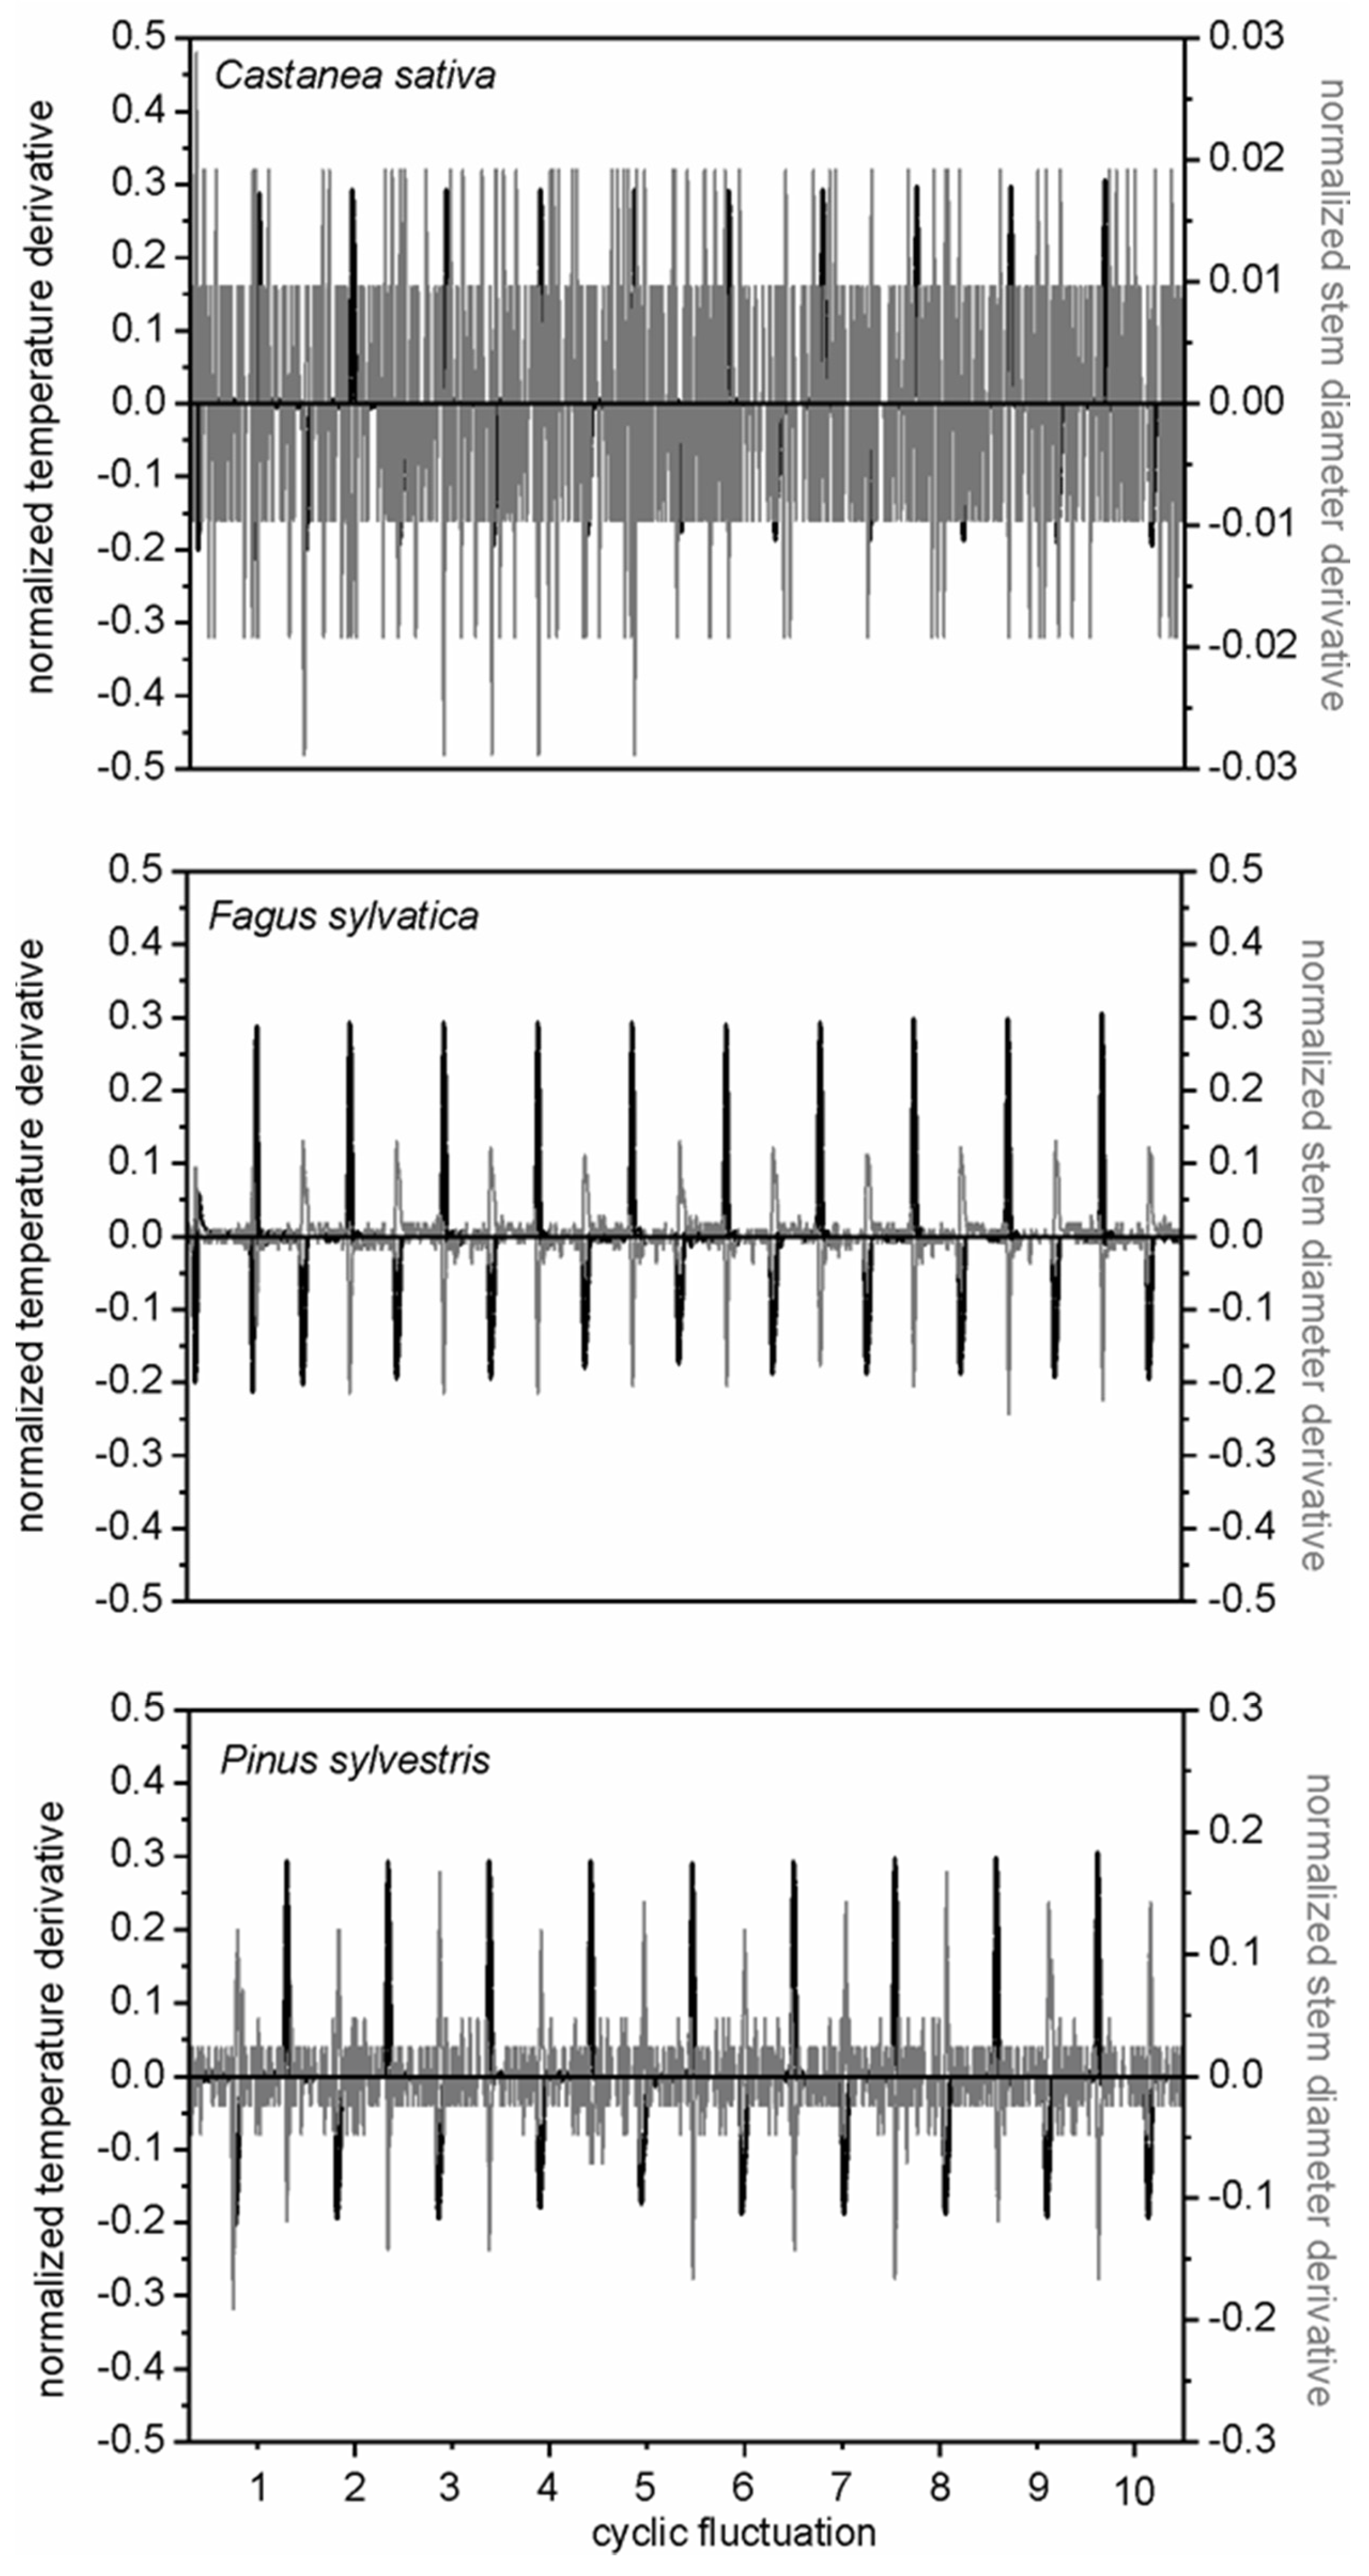
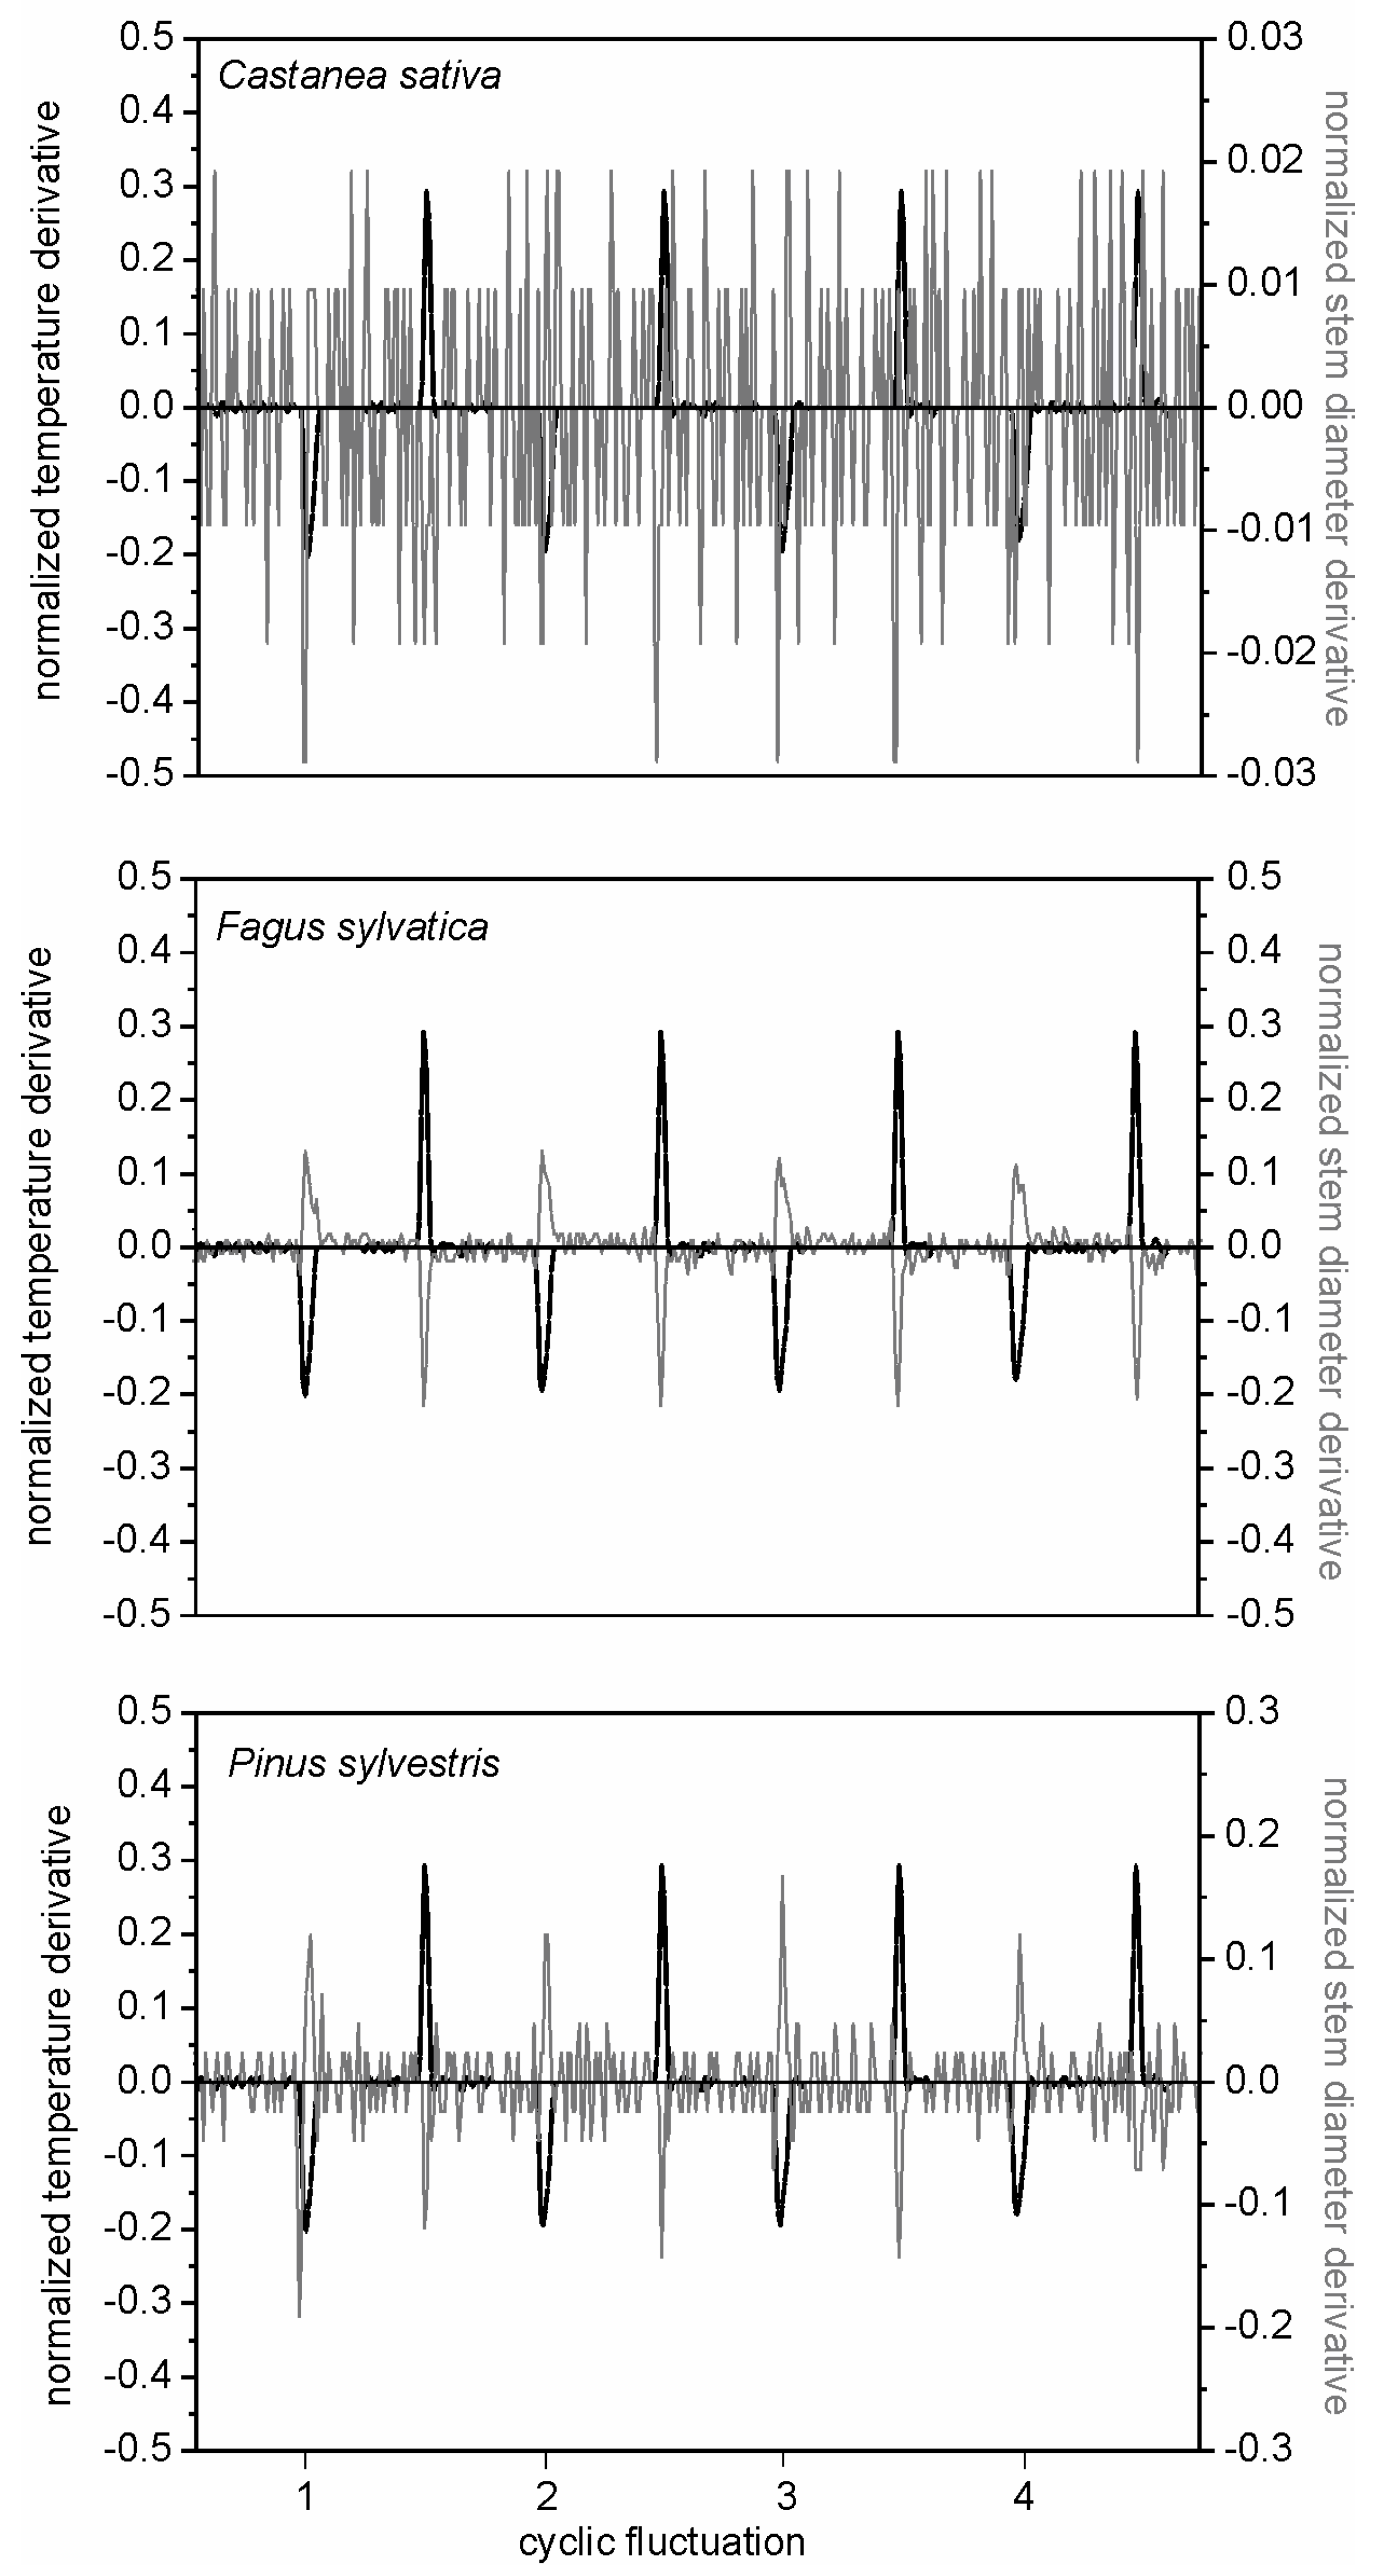
Logs of beech and Scots pine shrank considerably in correspondence to high temperature peak, showing a clear and sharp reactivity to thermal cycles (Figure 2). Stem shrinkage was synchronous with the occurrence of high thermal peak of the cooling test, as clearly shown by associated derivative functions with detail of ten (Figure 4), four (Figure 5) and two (Figure 6) repeated cooling cycles. On the other hand, chestnut logs showed an inconsistent behavior of stem cycles (shrinkage, recovery, and swelling) in response to cooling test (Figure 2). The stem radius variations were not clearly driven by thermal cycle, thus it was not possible to define specific relationships between tissue sensitivity and temperature (Figure 4, Figure 5 and Figure 6).
3.2. Stem Diameter Fluctuations during the Growth Season
High-resolution analysis of stem radius variation provided insights into the temporal patterns in radial growth and water balance, and their relationships with environmental variables (Figure 3). The comparison among three woody species highlighted their different behaviors in terms of growth, as shown by the wider oscillations in stem radius in poplar than in Norway spruce and olive tree (Figure 3). However, the dendrometer signal was suitable in all the three cases to clearly distinguish a stem growth pattern during mid-summer, when air temperature is a major environmental driver (Figure 3), contributing to increase the vapour pressure deficit.
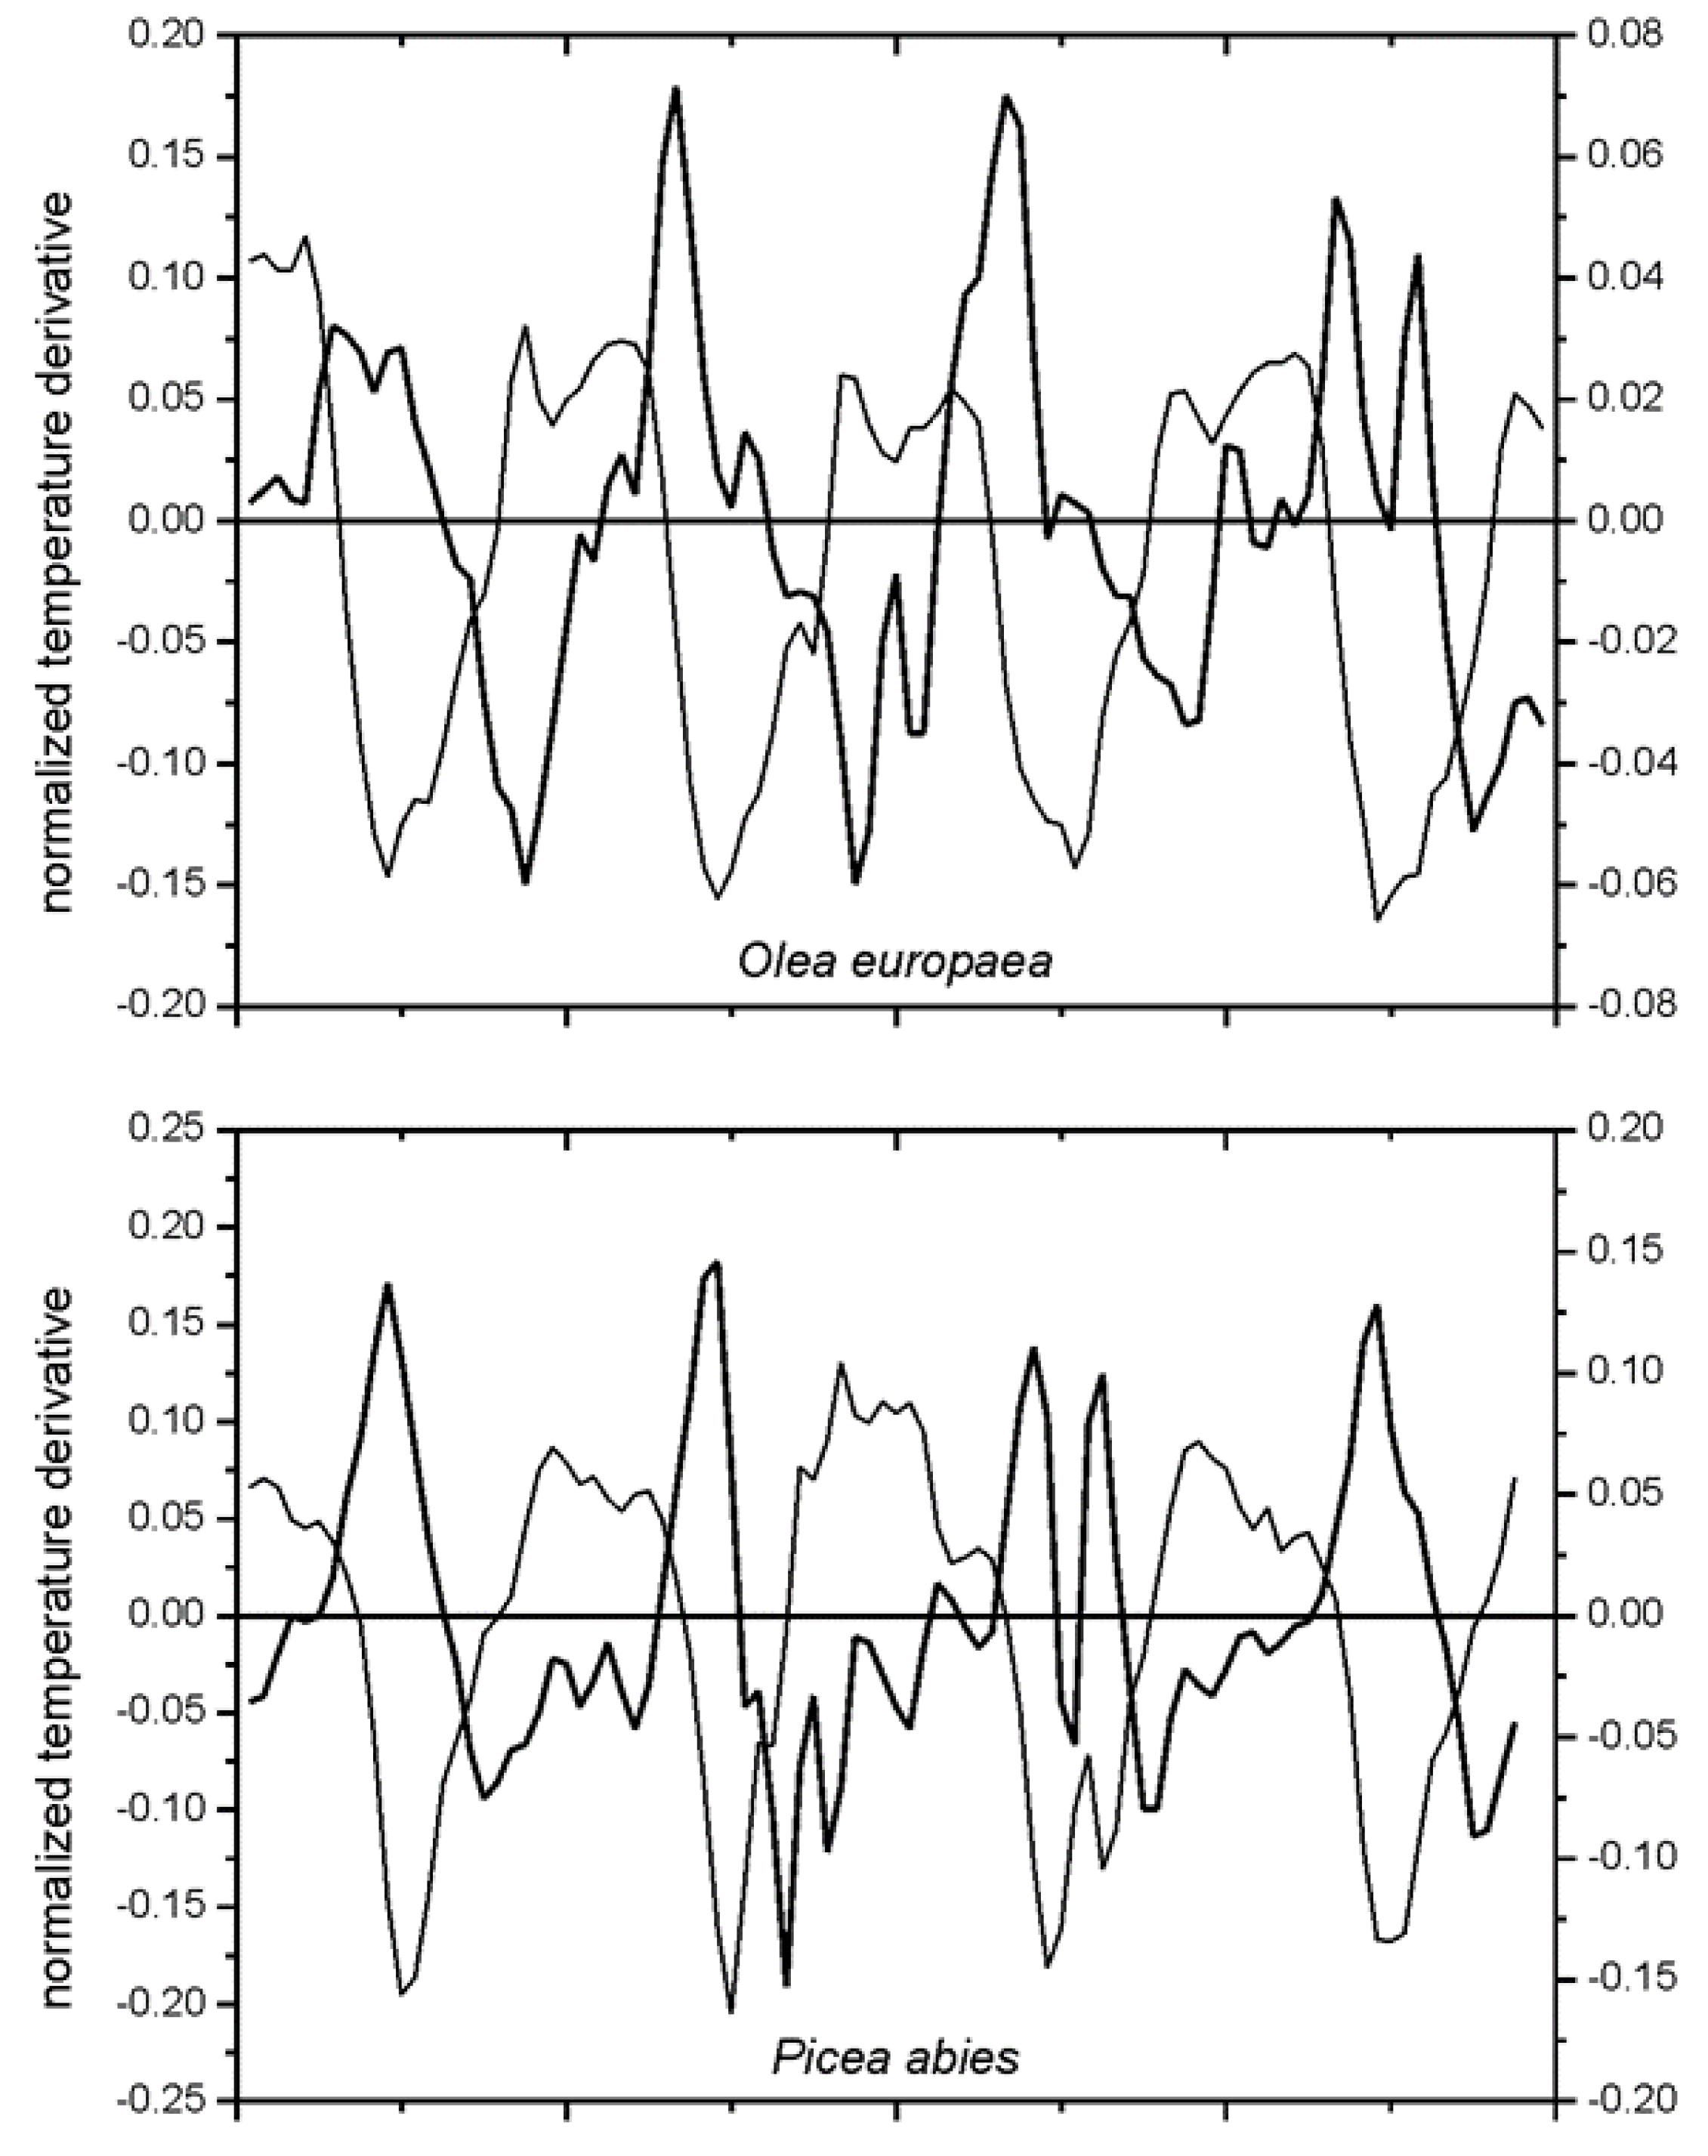
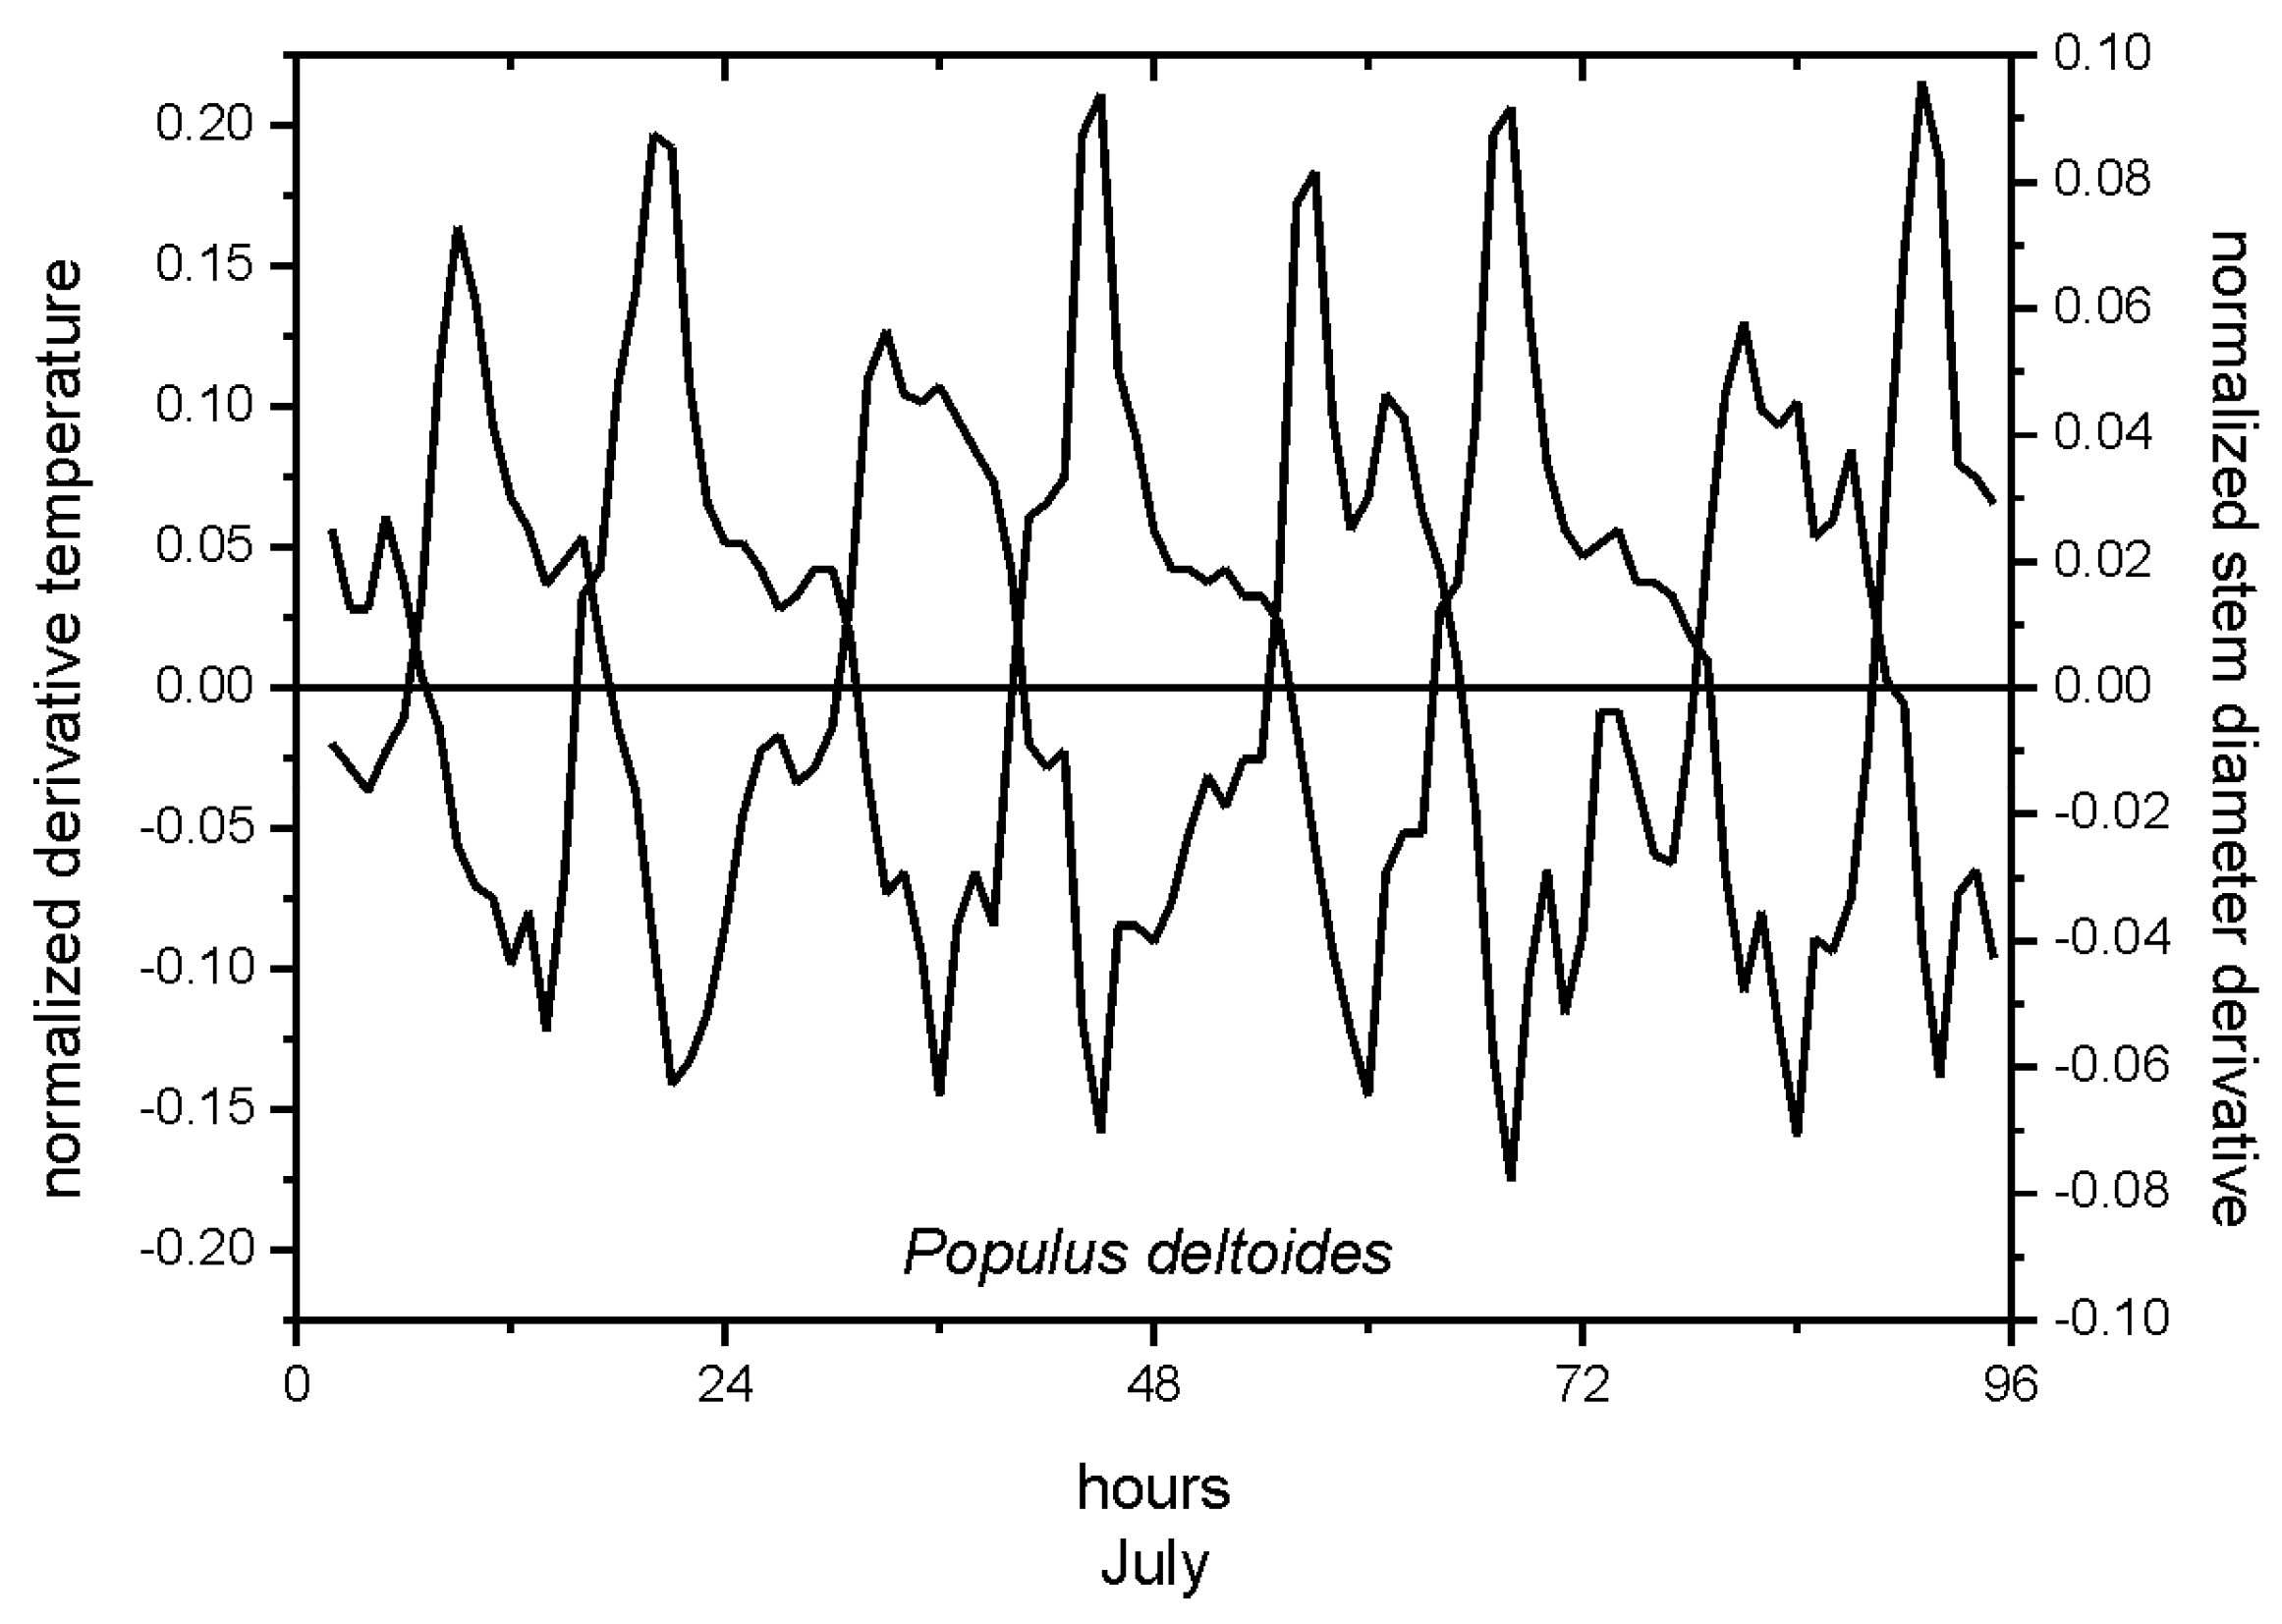
In the considered interval (4 days of July), peak evaporative demand coincides with high stem radial growth. Dendrometers can be used to monitor the range of physiological activity (indicated by plant transpiration cycles and water storage capacity) within which the tree behaves, without suffering from excess stress: transpiration cycles were clearly related to evaporative demand in olive tree (Figure 3A), slow radial growth was described in Norway spruce (Figure 3B), and fast radial growth was shown in poplar (Figure 3C). Stem diameter variation clearly differed among the three species (Figure 3D–F). The derivative approach showed a direct correspondence between stem diameter variations and air temperature events throughout the time series (Figure 7). Moreover, the analytical approach allowed to identify the plant sensitivity to air temperature, showing specular and opposite peaks of the two time series (stem diameter and air temperature) (Figure 7). The negative (or positive) values of stem diameter corresponded to positive (or negative) values of the derivative function of air temperature. The analytical procedure of time series highlighted the potential to quantify time lags between physiological and meteorological events, through the intersections of the associated derivative functions with x-axis (Figure 7).
4. Discussion
High-resolution stem radial variation analyses and derivative function procedures were able to relate shrinkage, recovery, and swelling events to air temperature events, allowing to extrapolate complementary information on tree sensitivity and functionality in comparison with correlation analysis (e.g., [28]). Diameter fluctuation patterns were validated for testing the sensitivity of stem diameter variation to air temperature events, by installing high-resolution dendrometers on both logs in the laboratory and on tree trunks in the field. The sensitivity analysis employed derivative functions, that increased the detail with which time series of tree behaviour and meteorological drivers can be described. The mathematical procedure was applied to describe plant–environment dependences, identifying the synchronism between stem shrinkage, recovery, and swelling cycles, with temperature oscillations. In previous studies, the same procedure was used in correspondence analysis of diameter variation [5], sap flow [29] and environmental drivers (water availability and evaporative demand) in olive trees. Yet, this analytical procedure resolved the synchronization of stem diameter oscillations and low air temperatures in winter season in poplar trees [23].
So far, no numerical solution has been reported for synchronizing stem cycles and meteorological events, quantifying relevant time lags throughout time series. We presented a simple mathematical procedure and its numerical solution, as a tool to describe kinetics of stem radial variations and environmental driver fluctuations, which can also be conveniently used in order to better understand the cycles of stem sap flow and leaf water potential. It is known that the characteristics of stem radial increments differ markedly between different tree species [15]. The present analytical procedure demonstrated to be adaptive and flexible for decoding time series of various types, in the soil-plant-atmosphere continuum, which need to be interrelated for studying temporal dynamics present in agroforestry systems in order to assess resilience quantitatively and scale tree response and adaptation to a changing environment.
The mathematical approach transforms the dendrometer signal in a plant signal, which facilitates the matching of plant traits and environmental parameters, otherwise producing deviation noise when a classical correlation analysis is applied. Indeed, the mathematical approach was adopted for plant traits and environmental variables that have specific unit scale, namely different measurement units, to convert the time series in associated functions with compatible scales, in order to maintain statistical evidence and physiological explanation of stem cycles (shrinkage, recovery, and swelling) and their reaction to environmental disturbances. Dynamics of the relationships between stem growth and environmental factors can be easily compared, with the present procedure, and the information can be simply elicited through the simultaneous decoding of tree and environmental signals.
The mathematical approach adopted for processing data from logs (in the lab) and tree trunks (in the field) highlighted a high degree of agreement between signals of co-occurring positive and negative events. The method demonstrates the relevance of the combination of derivative curves associated with different variables in order to analytically resolve their time series. This provides information on stem shrinkage, recovery, and swelling in response to meteorological events. After stem swelling in response to a rain event, tree stems can shrink over several consecutive days, with relative sap flow reduction of the stem during soil drying (e.g., [8]). Our procedure allows for finely synchronizing negative and positive events (such as those of stem cycles and weather variables, but also sap flow) during consecutive days. As an example, positive stem radial variations can be counterbalanced by negative fluctuations, or stably increase stem diameter, while negative stem radial events may either depend on meteorological conditions or be a consequence of positive peaks in the previous days [23]. Overall, this analytical procedure of dendrometer signals determines a better understanding of the stem sensitivity to air temperature and the identification of time lags between meteorological events and stem cycles [2]. The results of this study are also meaningful to unravel elasticity and hardiness traits of wood tissue to changing water storage conditions.
The derivative test facilitated the check of controlled cooling experiments, useful for the definition of critical thermal factors in wood technology (Figure 4, Figure 5 and Figure 6). The cooling cycles highlighted differences in the response of wood porosity, diffuse-porous (F. sylvatica) and ring-porous (C. sativa) deciduous, and coniferous (P. sylvestris) woody species. While a similar log behaviour to cooling test was observed in beech and Scots pine, chestnut had a distinct pattern (Figure 4, Figure 5 and Figure 6). This behaviour suggests a “traumatic” effect of thermal excursion on this ring-porous hardwood species [30]. Further investigations are required to define thresholds of mechanical failure, as well as their variability, induced by cooling in these species [31], and the usefulness of using high-resolution dendrometers in wood technology laboratories. Different stem cycle signals to the same meteorological events identify specific wood reactions, and the efficiency of the derivative mathematical approach for quantifying stem technological sensitivity to cooling. Although in the analysis of time series, deliberately, we considered daily timings of stem cycles and meteorological events (namely temperature), species-specific dependences of stem radius variation on air temperature (or other weather parameters) conditions are more clearly expressed on a seasonal, rather than daily, basis. Nevertheless, species-to-species responses on weather conditions were clearly demonstrated.
The application of the mathematical procedure on stem cycles of trees in field conditions was applied to normalize and synchronize stem radial fluctuations and air temperature events, and to test the causal effects of these temporal correspondences (Figure 7). The approach provided insights on shrinkage, recovery, and swelling phenomena, related to dehydration and hydration cycles, clearly detecting synchronism of stem radius variations and air temperature records [5,9,23]. The synchronicity of stem cycles and temperature variation, evidenced by the associated normalized derivatives, provided indication of the susceptibility of stem tissues of the selected species to environmental conditions (Figure 7). The intersection of derivative functions with the x-axis highlighted the time lag between the plant response (stem diameter variations) to the environmental driver (air temperature events). The time lag between stem radial variation and environmental conditions may define the range of normal tree operation and plant resilience to climatic disturbance.
The rhythm of cooling in lab conditions and the cycle of micro-climatic factors during the growing season in the field induced a quick response of stem tissues, defining cyclic and reversible processes. Dendrometer records remain, however, often difficult to interpret because the signal recorded represents the non-linear response to complex interactions between environmental conditions and plant traits (structure, genotype and function) [22]. In wood technology, the use of logs provides a suitable tool for the detection of tissue elasticity, highlighting species-specific behaviour to environmental conditions, for instance, in storage place and in structural reaction [32]. In ecophysiological research, stem radius variations provide an effective and sensitive proxy for plant water status assessment, for precise irrigation scheduling and tree growth modelling [11,19,21,33,34]. Although several empirical methods are currently applied on data gathered with dendrometers [6,10,15,27,35], in order to monitor tree growth patterns and to evaluate water storage depletion and replenishment of stems, the synchronism between plant traits and environmental drivers still is a challenge for studying tree adaptation and response to climate change.
5. Conclusions
High-resolution dendrometers were used to investigate the potential of a simple analytical procedure for resolving the synchronicity of time series related to stem radial variations and air temperature. Dendrometers were employed with different tree species and experimental conditions, highlighting the accuracy of the mathematical approach to analyse the timing of stem cycles and meteorological events, as well as time lags between meteorological and physiological variables. This flexible approach gives new possibilities to decode time series in the soil-plant-atmosphere continuum, in order to interpret the physiological range within which different tree species operate (namely transpire water and accumulate carbon) and are resilient to changes in environmental conditions (e.g., drought-induced tree mortality). The additional integration of concurrent information on sap flow, stem hydration, solar radiation, soil moisture, etc. will be important for interpreting the adaptation and mitigation potential of trees and forests under a warming climate scenario.
Acknowledgments
Financial support was provided by Regione Toscana (POR CRO FSE 2012–2014, research project “Sysbiofor”) and by the project SOFIE-2 (Reg. Delib. No. 3012-2007) funded by the Provincia Autonoma di Trento, Italy to Alessio Giovannelli.
Author Contributions
C.C., R.T. and A.G. conceived and designed the experiments; A.G. performed the experiments; C.C. analyzed the data; C.C., R.T. and A.G. wrote the paper.
Conflicts of Interest
The authors declare no conflict of interest.
References
- Pesonen, E.; Mielikäinen, K.; Mäkinen, H. A new girth band for measuring stem diameter changes. Forestry 2004, 77, 431–438. [Google Scholar] [CrossRef]
- Deslauriers, A.; Rossi, S.; Anfodillo, T. Dendrometer and intra-annual tree growth: What kind of information can be inferred? Dendrochronologia 2007, 25, 113–124. [Google Scholar] [CrossRef]
- Stangler, D.F.; Mann, M.; Kahle, H.P.; Rosskopf, E.; Fink, S.; Spiecker, H. Spatiotemporal alignment of radial tracheid diameter profiles of submontane Norway spruce. Dendrochronologia 2016, 37, 33–45. [Google Scholar] [CrossRef]
- Zweifel, R.; Häsler, R. Frost-induced reversible shrinkage of bark of mature, subalpine conifers. Agric. For. Meteorol. 2000, 102, 213–222. [Google Scholar] [CrossRef]
- Cocozza, C.; Giovannelli, A.; Lasserre, B.; Cantini, C.; Lombardi, F.; Tognetti, R. A novel mathematical procedure to interpret the stem radius variation in olive trees. Agric. For. Meteorol. 2012, 161, 80–93. [Google Scholar] [CrossRef]
- Zweifel, R.; Häsler, R. Dynamics of water storage in mature, subalpine Picea abies: Temporal and spatial patterns of change in stem radius. Tree Physiol. 2001, 21, 561–569. [Google Scholar] [CrossRef] [PubMed]
- Kozlowski, T.T.; Winget, C.H. Diurnal and seasonal variation in radii of tree stems. Ecology 1964, 45, 149–155. [Google Scholar] [CrossRef]
- Bouriaud, O.; Leban, J.M.; Bert, D.; Deleuze, C. Intra-annual variations in climate influence growth and wood density of Norway spruce. Tree Physiol. 2005, 25, 651–660. [Google Scholar] [CrossRef] [PubMed]
- Offenthaler, I.; Hietz, P.; Richter, H. Wood diameter indicates diurnal and long term patterns of xylem water potential in Norway spruce. Trees 2001, 15, 215–221. [Google Scholar] [CrossRef]
- Turcotte, A.; Rossi, S.; Deslauriers, A.; Krause, C.; Morin, H. Dynamics of depletion and replenishment of water storage in stem and roots of black spruce measured by dendrometers. Front. Plant Sci. 2011, 2, 21. [Google Scholar] [CrossRef] [PubMed]
- Mendivelso, H.A.; Camarero, J.J.; Gutiérrez, E.; Castaño-Naranjo, A. Climate influences on leaf phenology, xylogenesis and radial stem changes at hourly to monthly scales in two tropical dry forests. Agric. For. Meteorol. 2016, 216, 20–36. [Google Scholar] [CrossRef]
- Van der Maaten, E.; Bouriaud, O.; van der Maaten-Theunissen, M.; Mayer, H.; Spiecker, H. Meteorological forcing of day-to-day stem radius variations of beech is highly synchronic on opposing aspects of a valley. Agric. For. Meteorol. 2013, 181, 85–93. [Google Scholar] [CrossRef]
- Fierravanti, A.; Cocozza, C.; Palombo, C.; Rossi, S.; Deslauriers, A.; Tognetti, R. Environmental-mediated relationships between tree growth of black spruce and abundance of spruce budworm along a latitudinal transect in Quebec, Canada. Agric. For. Meteorol. 2015, 213, 53–63. [Google Scholar] [CrossRef]
- Tardif, J.; Flannigan, M.; Bergeron, Y. An analysis of the daily radial activity of 7 boreal tree species, Northwestern Québec. Environ. Monit. Assess. 2001, 67, 141–160. [Google Scholar] [CrossRef] [PubMed]
- Drew, D.M.; Downes, G.M. The use of precision dendrometers in research on daily stem size and wood property variation: A review. Dendrochronologia 2009, 27, 159–172. [Google Scholar] [CrossRef]
- Van der Maaten, E.; van der Maaten-Theunissen, M.; Smiljaníc, M.; Rossi, S.; Simard, S.; Wilmking, M.; Deslauriers, A.; Fonti, P.; von Arx, G.; Bouriaud, O. dendrometeR: Analyzing the pulse of trees in R. Dendrochronologia 2016, 40, 12–16. [Google Scholar] [CrossRef]
- Label, P.; Beritognolo, I.; Burtin, P.; Dehon, L.; Couée, I.; Breton, C.; Charpentier, J.P.; Jay-Allemand, C. Cambial activity and xylem differentiation in walnut Juglans spp. In Cell and Molecular Biology of Wood Formation; Savidge, R.A., Bernett, J.R., Napier, R., Eds.; BIOS Scientific Publishers: Oxford, UK, 2000; pp. 209–221. [Google Scholar]
- Donath, S.; Militz, H.; Mai, C. Wood modification with alkoxysilanes. Wood Sci. Technol. 2004, 38, 555–566. [Google Scholar] [CrossRef]
- Steppe, K.; Lemeur, R. Effects of ring-porous and diffuse-porous stem wood anatomy on the hydraulic parameters used in a water flow and storage model. Tree Physiol. 2007, 27, 43–52. [Google Scholar] [CrossRef] [PubMed]
- Michelot, A.; Simard, S.; Rathgeber, C.; Dufrêne, E.; Damesin, C. Comparing the intra-annual wood formation of three European species (Fagus sylvatica, Quercus petraea and Pinus sylvestris) as related to leaf phenology and non-structural carbohydrate dynamics. Tree Physiol. 2012, 32, 1033–1043. [Google Scholar] [CrossRef] [PubMed]
- Giovannelli, A.; Deslauriers, A.; Fragnelli, G.; Scaletti, L.; Castro, G.; Rossi, S.; Crivellaro, A. Evaluation of drought response of two poplar clones (Populus x canadensis Mönch ‘I-214’ and P. deltoides Marsh. ‘Dvina’) through high resolution analysis of stem growth. J. Exp. Bot. 2007, 58, 2673–2683. [Google Scholar] [CrossRef] [PubMed]
- Cocozza, C.; Palombo, C.; Tognetti, R.; La Porta, N.; Anichini, M.; Giovannelli, A.; Emiliani, G. Monitoring intra-annual dynamics of wood formation with microcores and dendrometers in Picea abies at two different altitudes. Tree Physiol. 2016, 36, 832–846. [Google Scholar] [CrossRef] [PubMed]
- Cocozza, C.; Lasserre, B.; Giovannelli, A.; Castro, G.; Fragnelli, G.; Tognetti, R. Low temperature induces different cold sensitivity in two poplar clones (Populus X canadensis Mönch ‘I-214’ and P. deltoides Marsh. ‘Dvina’). J. Exp. Bot. 2009, 60, 3655–3664. [Google Scholar] [CrossRef] [PubMed]
- Hatfield, J.L.; Prueger, J.H. Temperature extremes: Effect on plant growth and development. Weather Clim. Extrem. 2015, 10, 4–10. [Google Scholar] [CrossRef]
- Kaennel, M.; Schweingruber, F.H. Multilingual Glossary of Dendrochronology; Swiss Federal Institute for Forest, Snow and Landscape Research: Bern, Switzerland, 1995.
- Baillie, M.G.L.; Pilcher, J.R. A simple cross-dating program for tree-ring research. Tree-Ring Bull. 1973, 33, 7–14. [Google Scholar]
- Munro, M.A.R. An improved algorithm for crossdating tree-ring series. Tree-Ring Bull. 1984, 44, 17–27. [Google Scholar]
- Vieira, J.; Rossi, S.; Campelo, F.; Freitas, H.; Nabais, C. Seasonal and daily cycles of stem radial variation of Pinus pinaster in a drought-prone environment. Agric. For. Meteorol. 2013, 180, 173–181. [Google Scholar] [CrossRef]
- Cocozza, C.; Marino, G.; Giovannelli, A.; Cantini, C.; Centritto, M.; Tognetti, R. Simultaneous measurements of stem radius variation and sap flux density reveal synchronisation of water storage and transpiration dynamics in olive trees. Ecohydrology 2015, 8, 33–45. [Google Scholar] [CrossRef]
- Chan, T.; Hölttä, T.; Berninger, F.; Mäkinen, H.; Nöjd, P.; Mencuccini, M.; Nikinmaa, E. Separating water-potential induced swelling and shrinking from measured radial stem variations reveals a cambial growth and osmotic concentration signal. Plant Cell Environ. 2016, 39, 233–244. [Google Scholar] [CrossRef] [PubMed]
- Fonti, P.; Macchioni, N. Ring shake in chestnut: Anatomical description, extent and frequency of failures. Ann. For. Sci. 2003, 60, 403–408. [Google Scholar] [CrossRef]
- Améglio, T.; Cochard, H.; Ewers, W.F. Stem diameter variations and cold hardiness in walnut trees. J. Exp. Bot. 2001, 52, 2135–2142. [Google Scholar] [CrossRef] [PubMed]
- Tsoumis, G. Science and Technology of Wood: Structure, Properties, Utilization; Van Nostrand Reinhold: New York, NY, USA, 1991; ISBN 0-44223985-8. [Google Scholar]
- Von Arx, G.; Carrer, M. ROXAS-a new tool to build centuries-long tracheid-lumen chronologies in conifers. Dendrochronologia 2014, 32, 290–293. [Google Scholar] [CrossRef]
- Mäkinen, H.; Seo, J.W.; Nöjd, P.; Schmitt, U.; Jalkanen, R. Seasonal dynamics of wood formation: A comparison between pinning, microcoring and dendrometer measurements. Eur. J. For. Res. 2008, 127, 235–245. [Google Scholar] [CrossRef]
Figure 1.
Conceptual diagram explaining the logical sequence of modelling approach. Changes in stem radial fluctuations were collected (data collection) through dendrometer, with recording details (a, b) and checking processes (1, 2). Dendrometer signals were analysed (analysis: time series comparison) through time series comparison (c–e), defining the statistical variability between series (3). Dendrometer series were analysed (analysis: mathematics) by applying normalization and derivative functions (f–h) to define unbiased signals (4, 5). In the present study, the Glk (Gleichlaeufigkeit) was considered a measure of the hour-to-hour (i.e., time-to-time) agreement between the interval trends of two chronologies based upon the sign of agreement, or the sum of the equal slope intervals as a percentage. Statistical significance of the Glk significance (GSL). The Baillie–Pilcher t-value (TVBP) is commonly used as a statistical tool for comparing and cross-timing of time series. Time Series Analysis Programme (TSAP) software package (Frank Rinn, 2003, Heidelberg, Germany) was used.

Figure 2.
Cyclic stem radius variation (24 h) of F. sylvatica, C. sativa and P. sylvestris logs, and cyclic fluctuations (24 h) of air temperature in cooling test.
Figure 2.
Cyclic stem radius variation (24 h) of F. sylvatica, C. sativa and P. sylvestris logs, and cyclic fluctuations (24 h) of air temperature in cooling test.
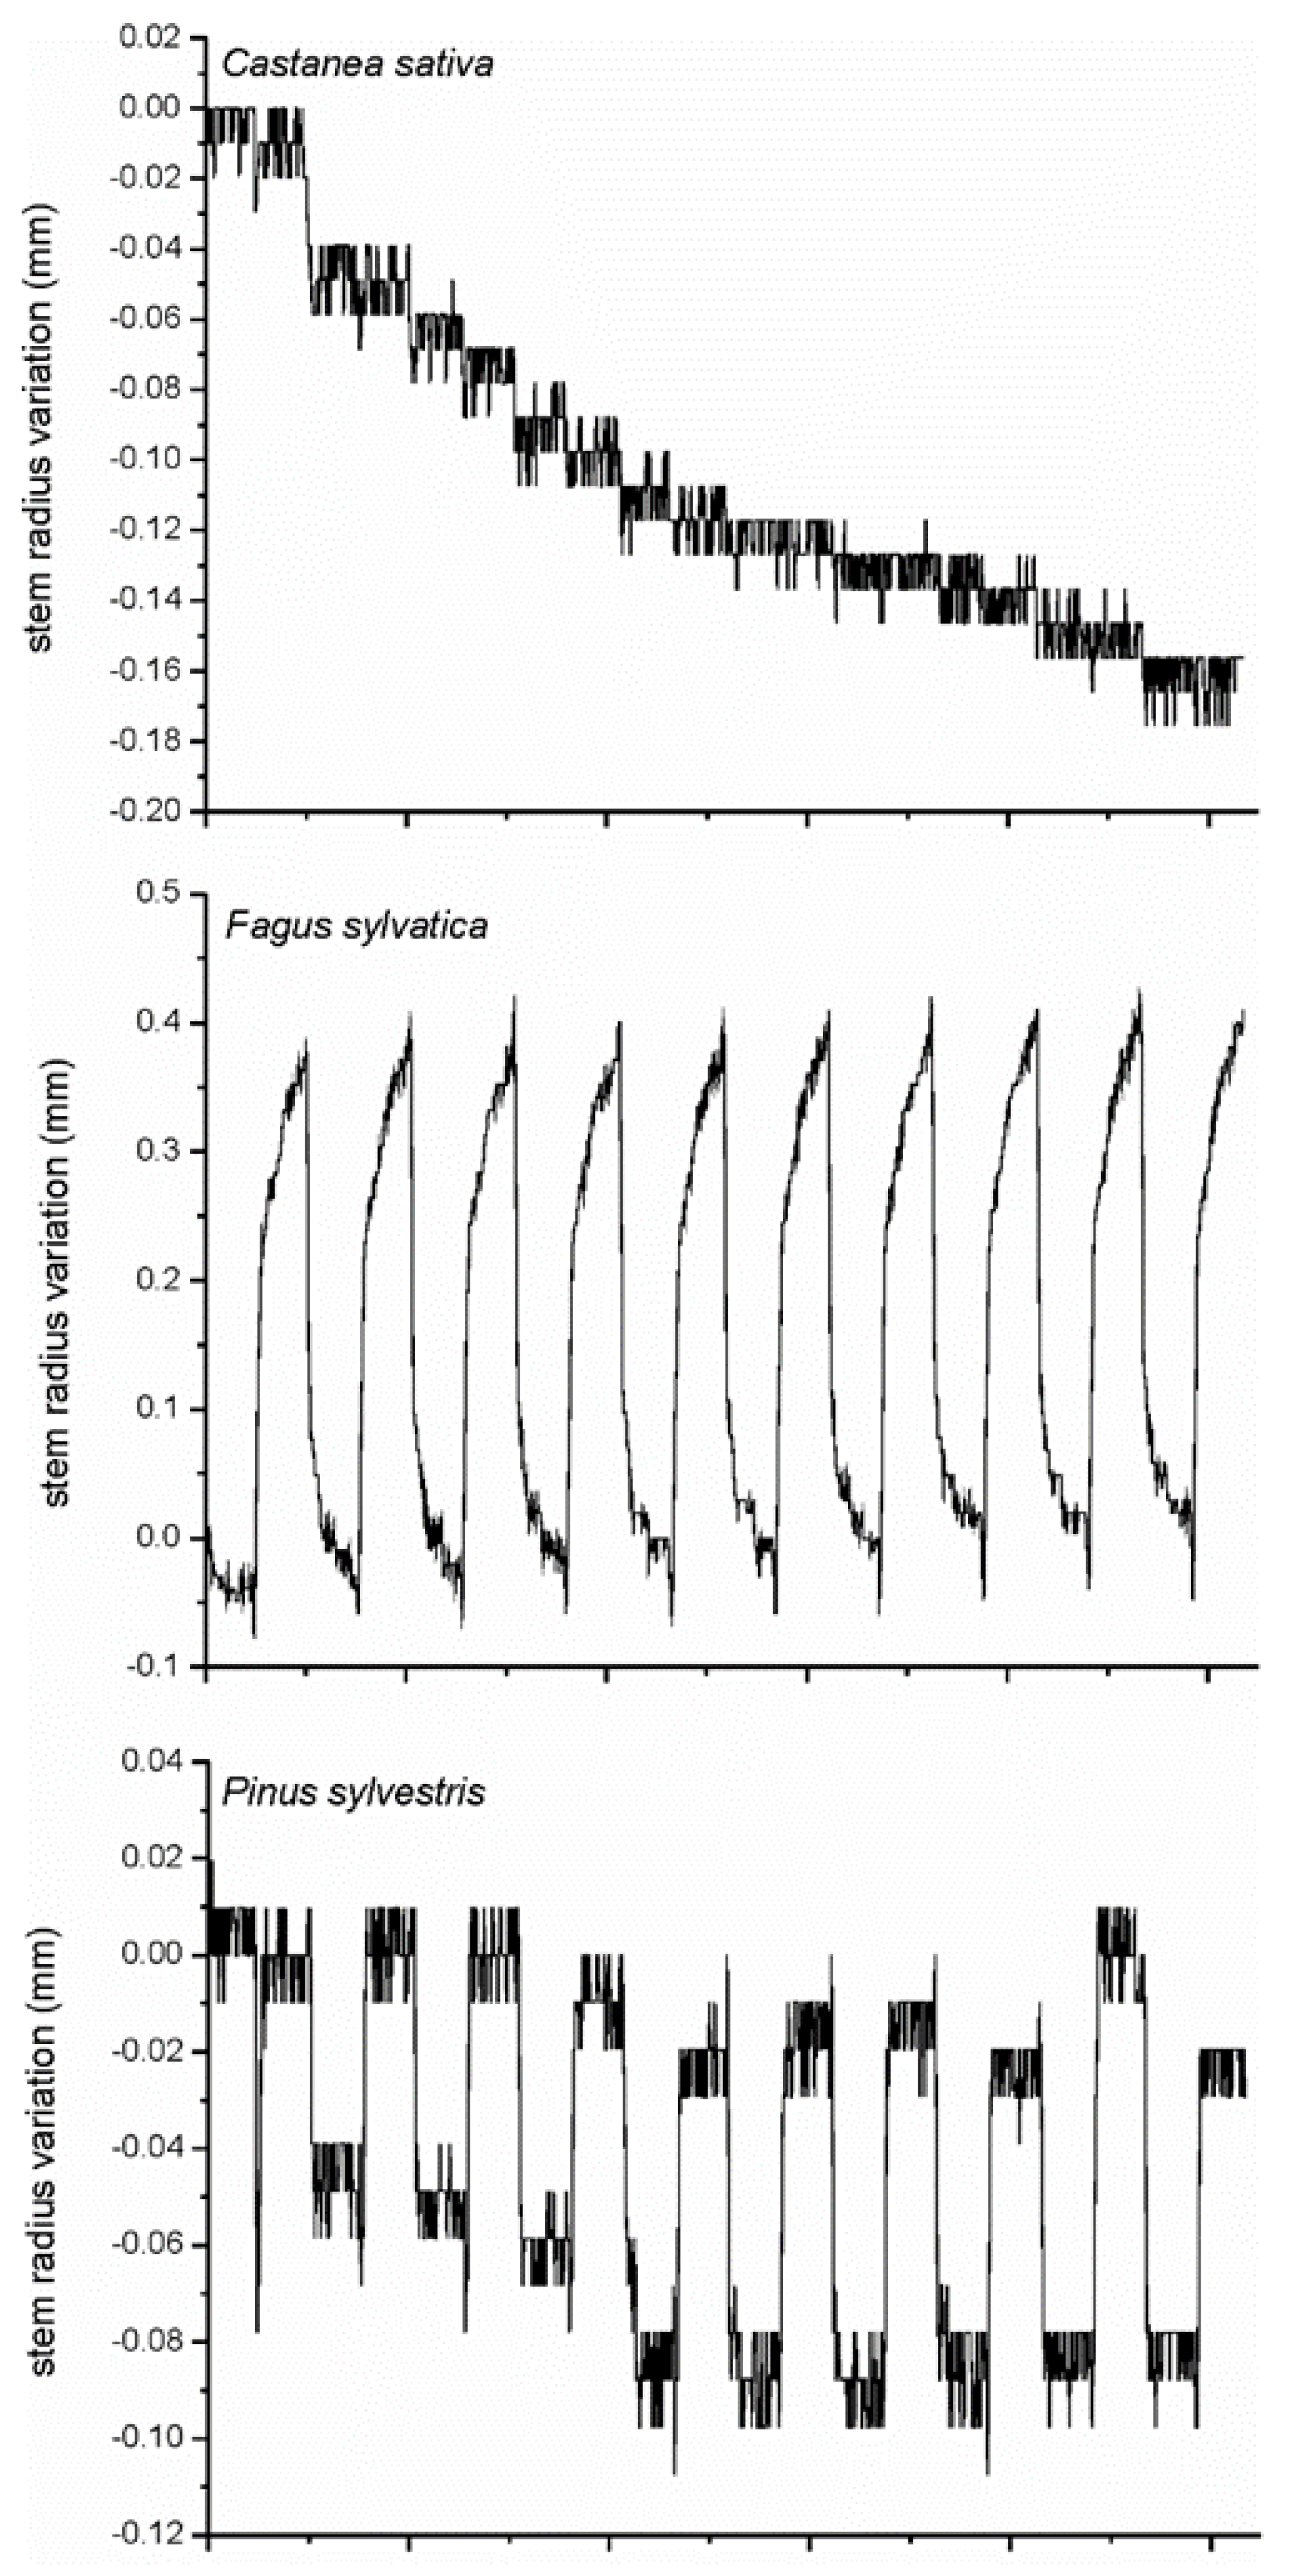
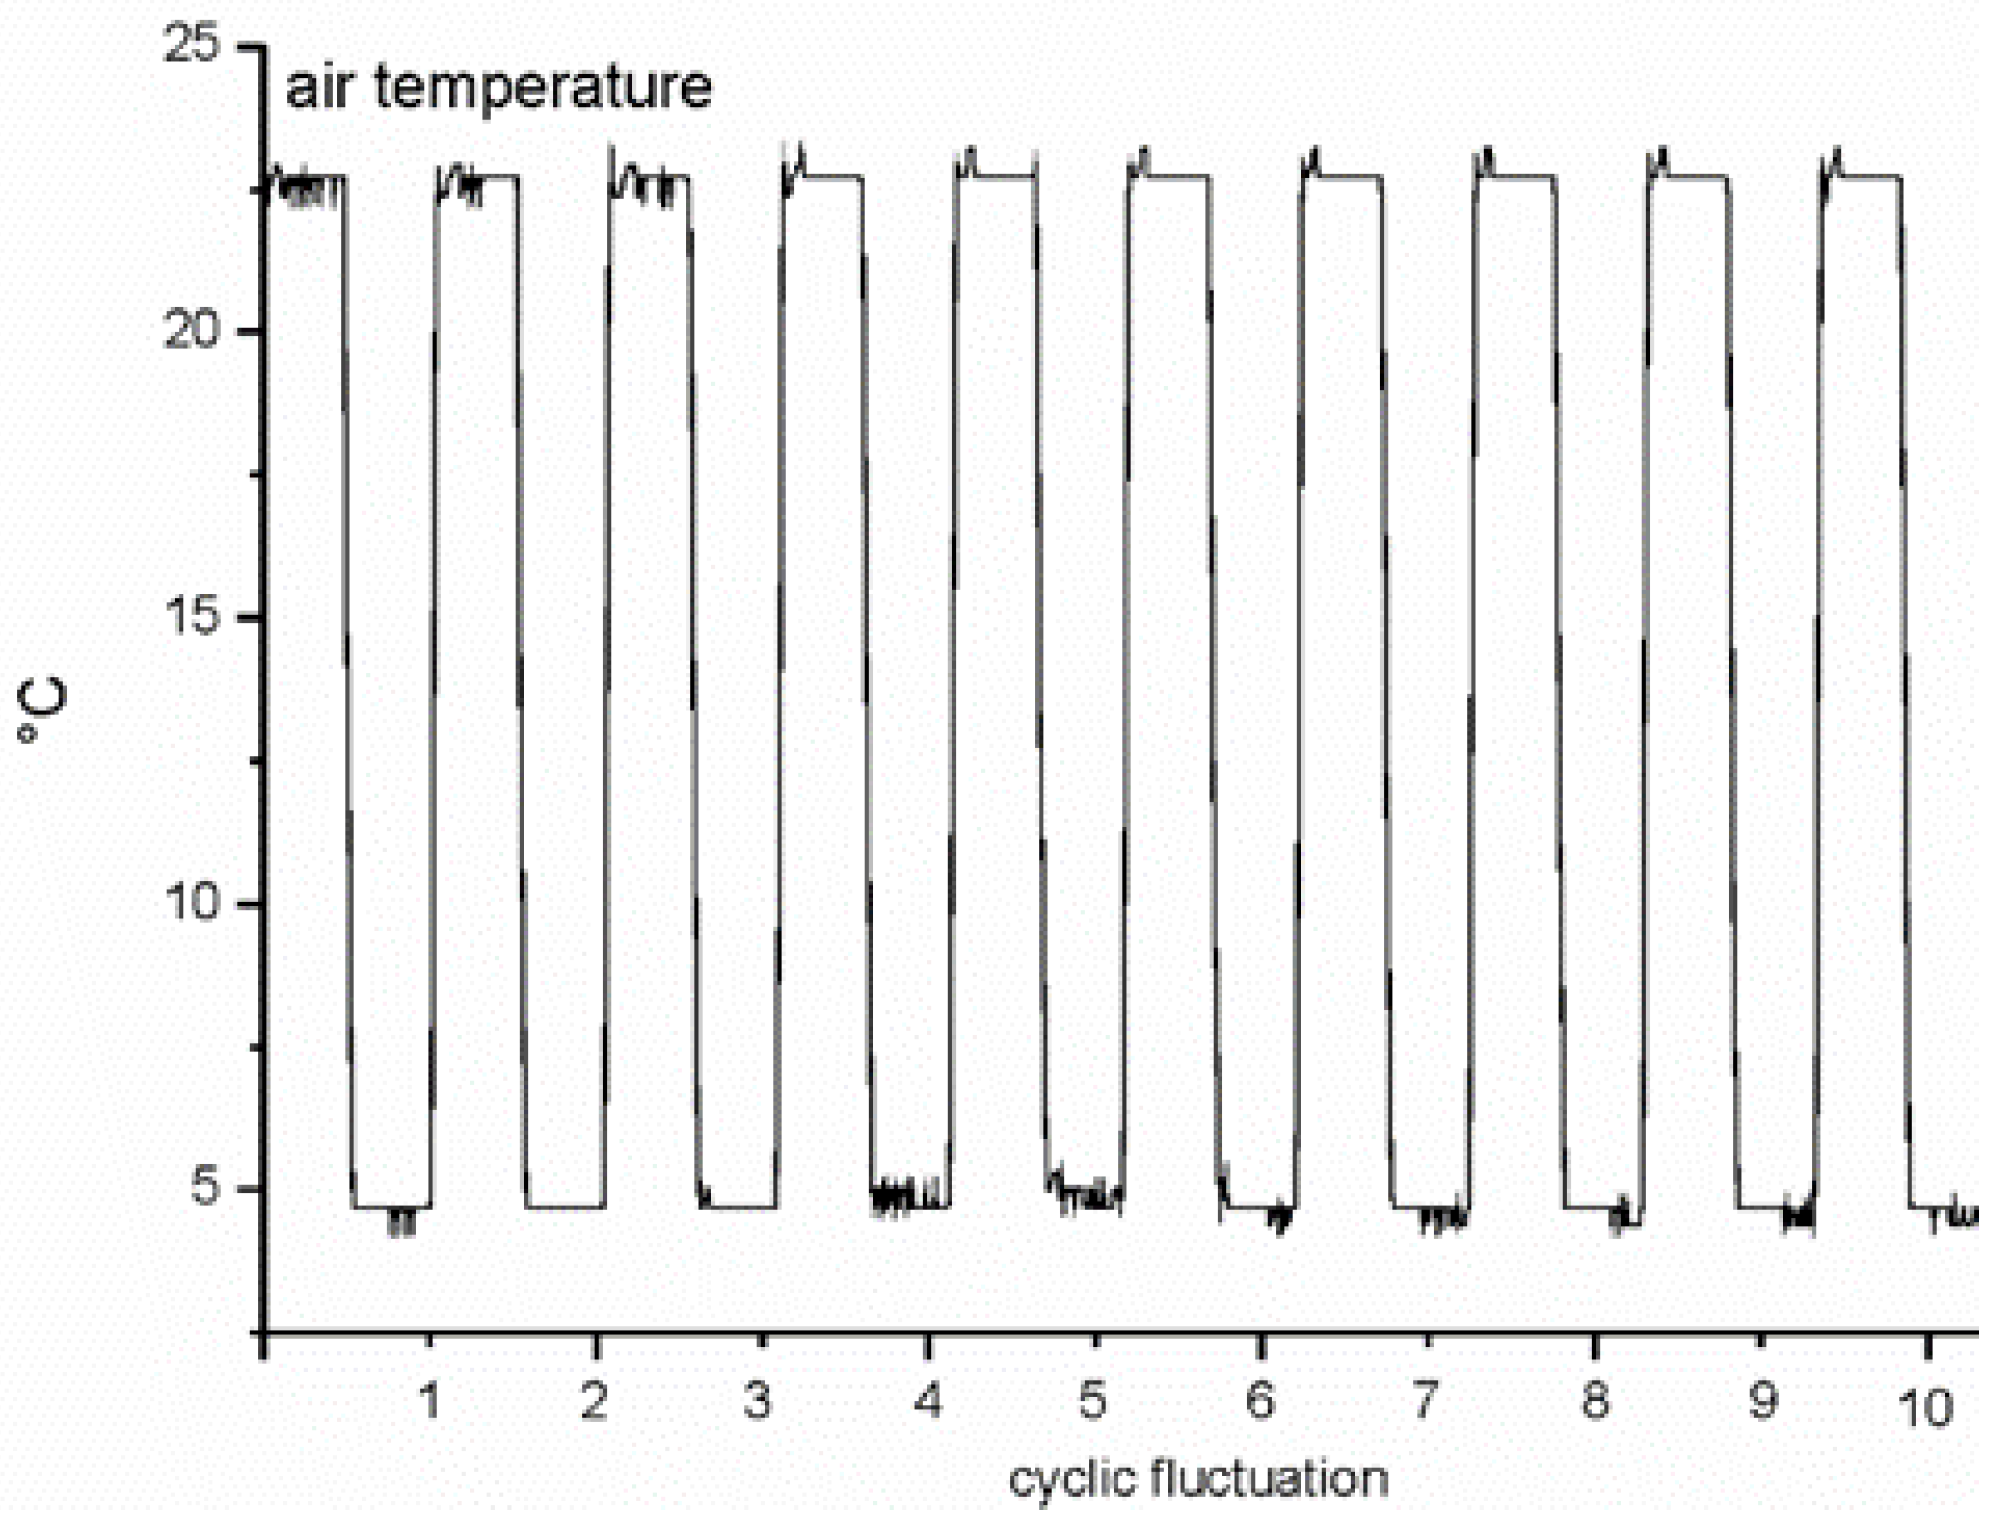
Figure 3.
Raw data of stem diameter (A–C), stem diameter variation (D–F) in O. europaea, P. abies, P. deltoides, and air temperature (G–I) in field conditions.
Figure 3.
Raw data of stem diameter (A–C), stem diameter variation (D–F) in O. europaea, P. abies, P. deltoides, and air temperature (G–I) in field conditions.
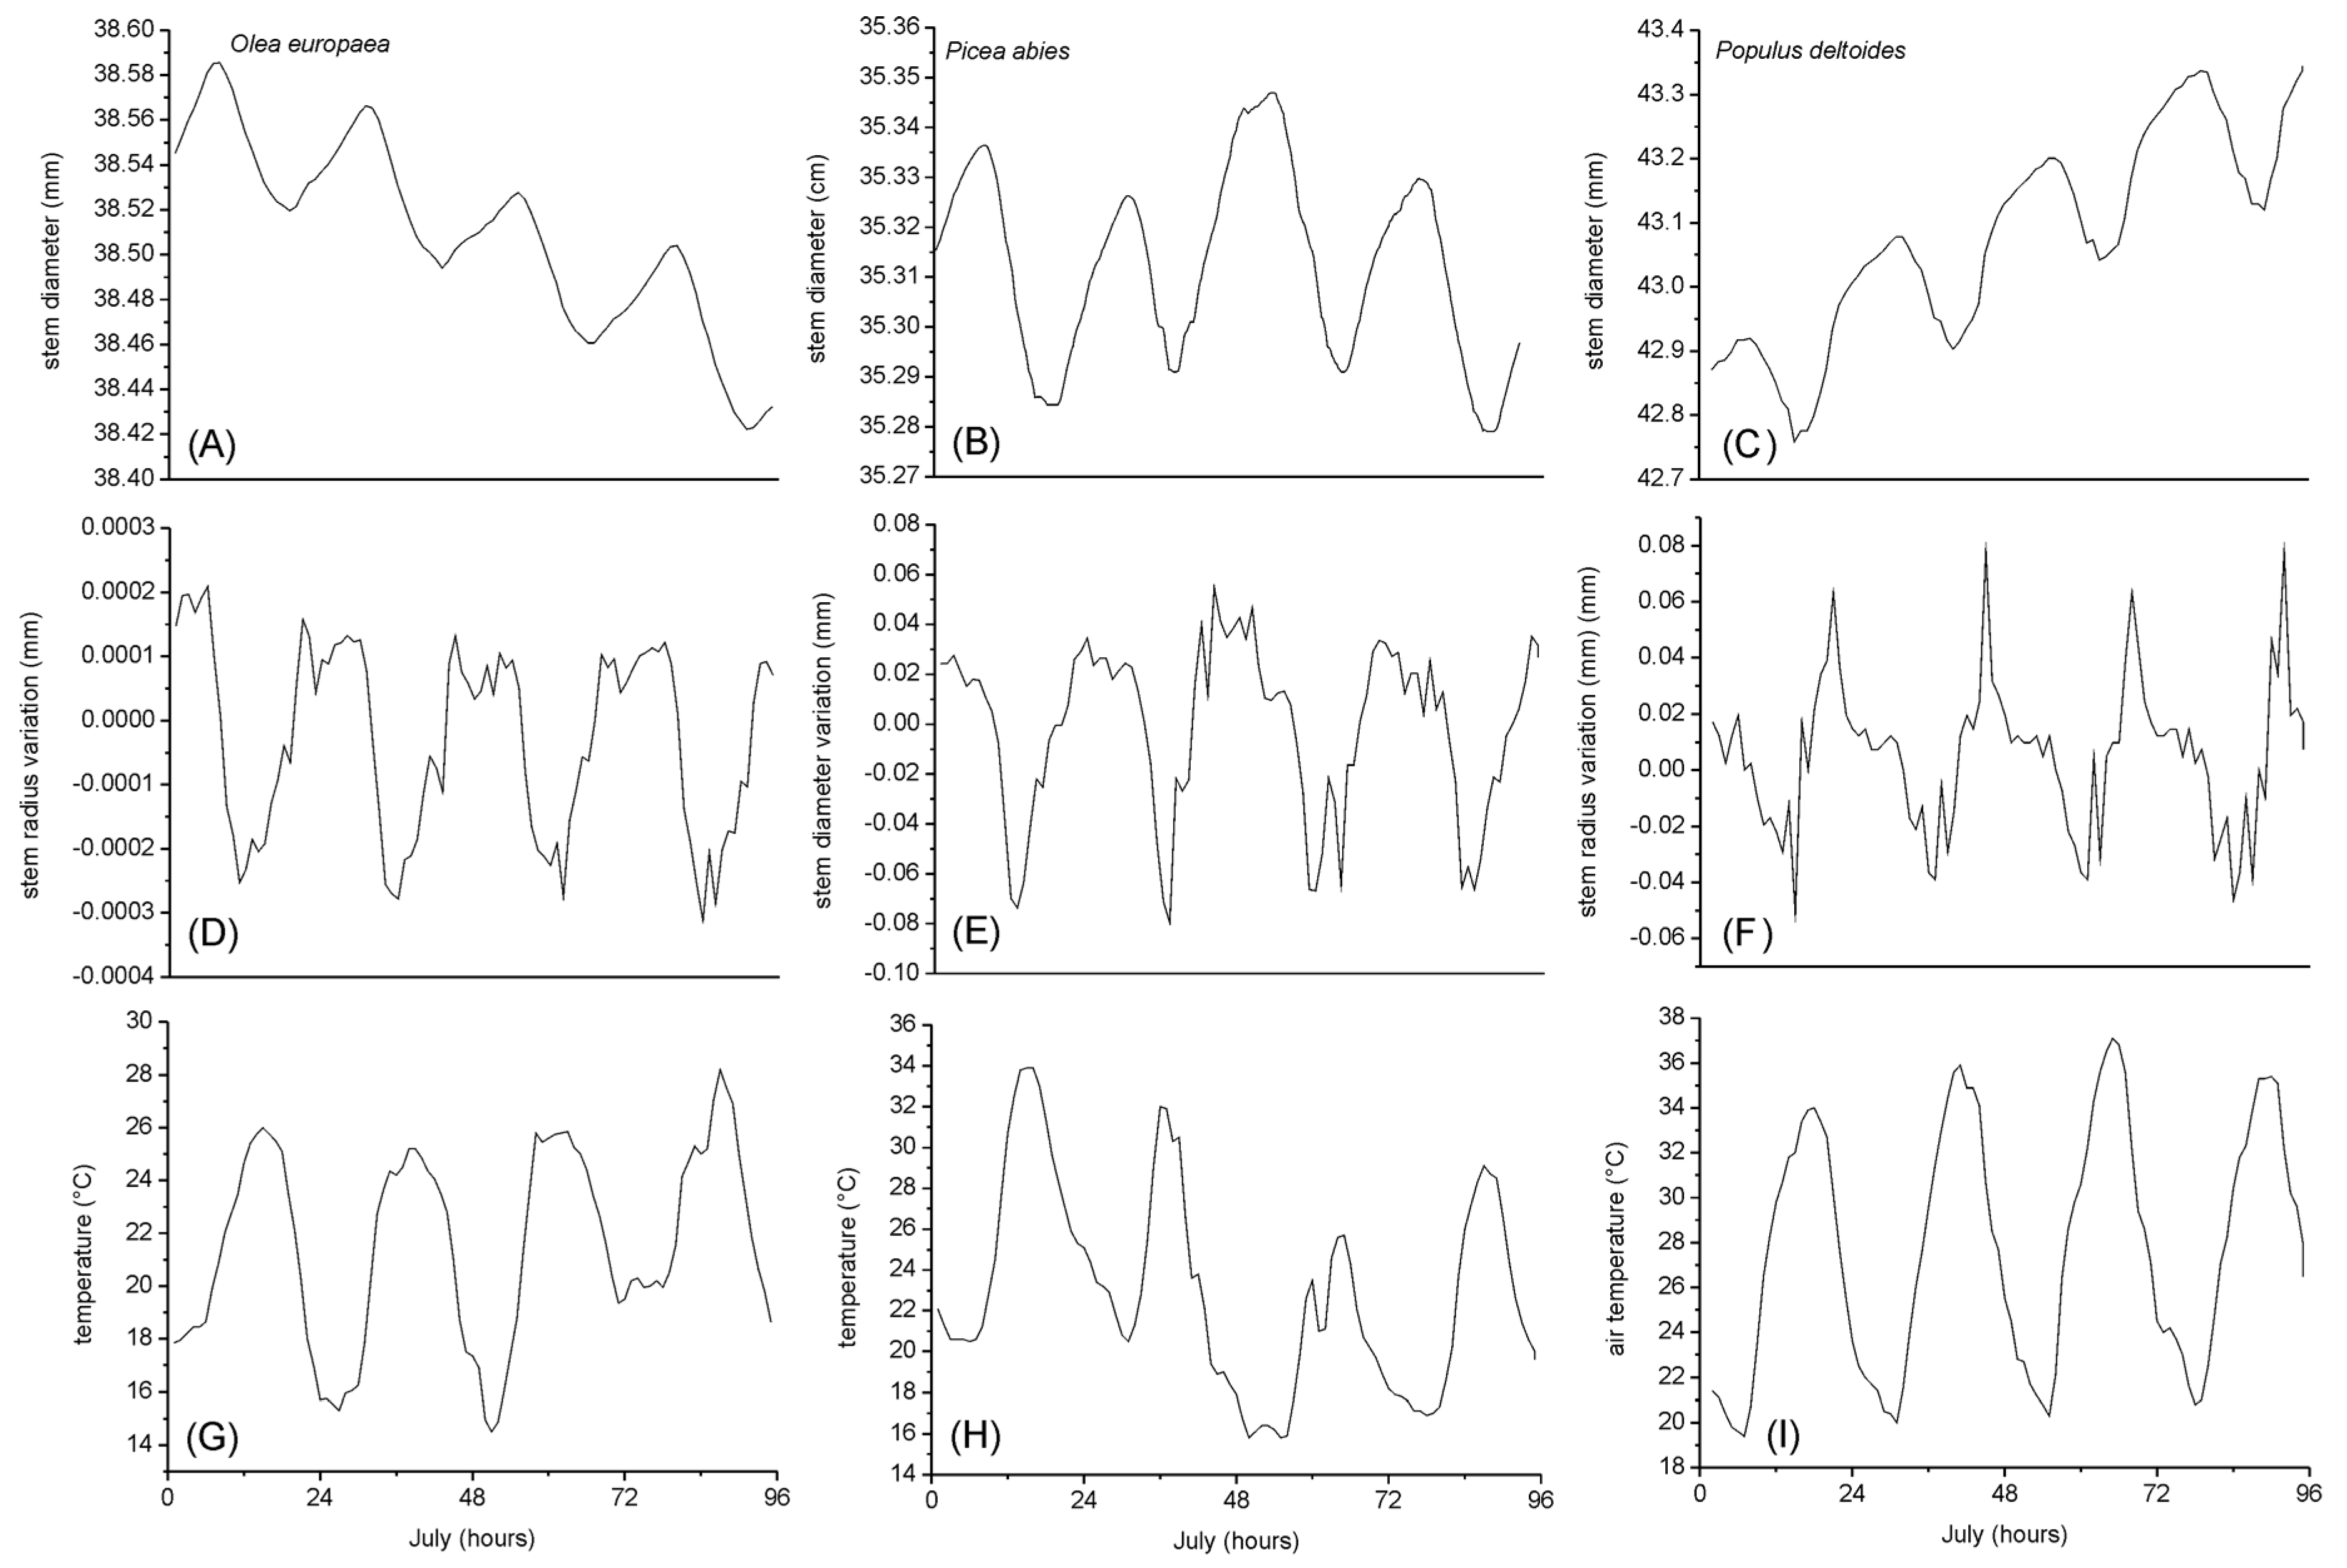
Figure 4.
Normalized derivative of temperature (black line) and stem diameter (grey line) of C. sativa, F. sylvatica and P. sylvestris logs exposed to cooling test, showing detail of ten repeated cooling cycles.
Figure 4.
Normalized derivative of temperature (black line) and stem diameter (grey line) of C. sativa, F. sylvatica and P. sylvestris logs exposed to cooling test, showing detail of ten repeated cooling cycles.

Figure 5.
Normalized derivative of temperature (black line) and stem diameter (grey line) of C. sativa, F. sylvatica and P. sylvestris logs exposed to cooling test, showing detail of four repeated cooling cycles.
Figure 5.
Normalized derivative of temperature (black line) and stem diameter (grey line) of C. sativa, F. sylvatica and P. sylvestris logs exposed to cooling test, showing detail of four repeated cooling cycles.

Figure 6.
Normalized derivative of temperature (black line) and stem diameter (grey line) of C. sativa, F. sylvatica and P. sylvestris logs exposed to cooling test, showing detail of two repeated cooling cycles.
Figure 6.
Normalized derivative of temperature (black line) and stem diameter (grey line) of C. sativa, F. sylvatica and P. sylvestris logs exposed to cooling test, showing detail of two repeated cooling cycles.
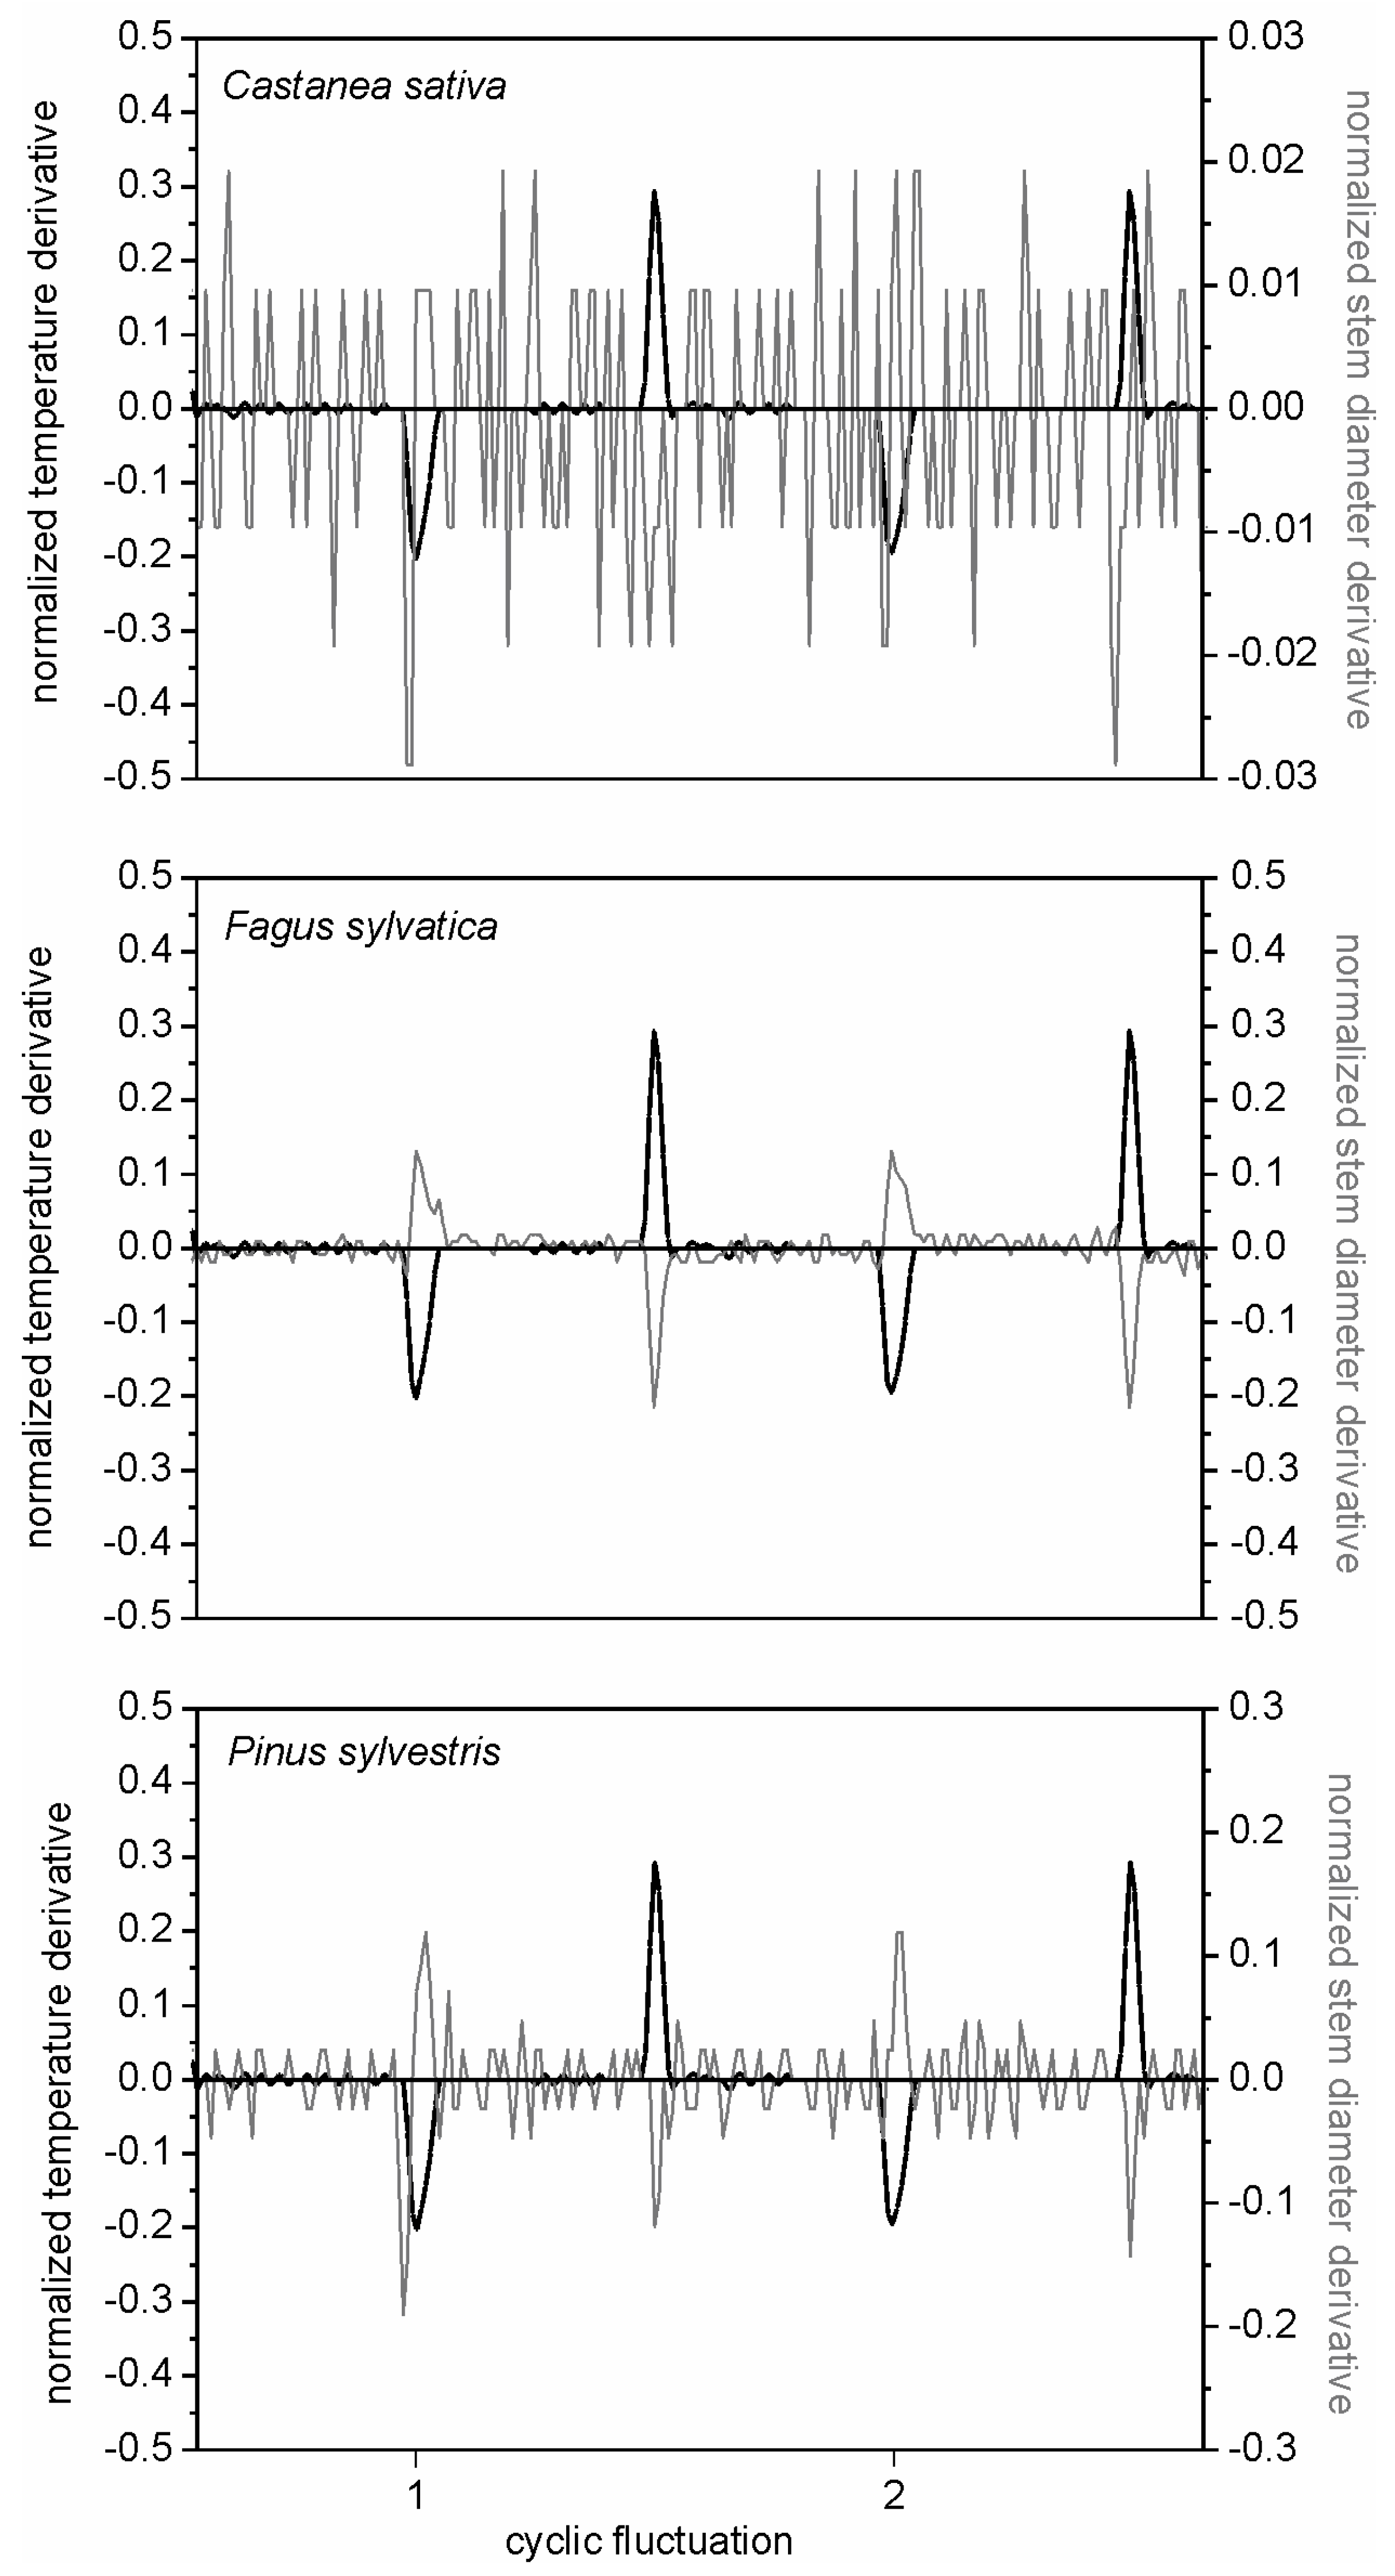
Figure 7.
Normalized derivative of air temperature (black line) and stem diameter (grey line) of O. europaea, P. abies, P. deltoides trees in mid-summer.
Figure 7.
Normalized derivative of air temperature (black line) and stem diameter (grey line) of O. europaea, P. abies, P. deltoides trees in mid-summer.

Table 1.
Details of stem segments of F. sylvatica, C. sativa and P. sylvestris.
| Species | Log Length (cm) | Log Diameter (cm) |
|---|---|---|
| F. sylvatica | 40.4 | 18 |
| P. sylvestris | 42 | 18.3 |
| C. sativa | 41 | 23.2 |
Table 2.
Species used for the data collection of stem diameter variation through.
| Species | Data Collection | Reference | |
|---|---|---|---|
| (Site) | (Year) | ||
| Olea europaea L. | Central Italy | 2004–2006 | [5] |
| 42° 55′ N, 10° 45′ E | |||
| 17 m a.s.l. | |||
| Picea abies (L.) Karst. | Northeastern Italy | 2010–2012 | [22] |
| 45° 56′ N, 11° 03′ E | |||
| 680 m a.s.l. | |||
| Populus deltoides M. | Northwestern Italy | 2005 | [23] |
| 45° 07′ N, 8° 30′ E | |||
| 106 m a.s.l. | |||
Table 3.
Statistical tools of analysis of time series in the cross-timing procedure using Time Series Analysis Programme, TSAP-Win software platform (Rinntech). Statistical significance of the Gleichlaeufigkeit (Glk) values (GSL) and the Baillie–Pilcher t-value (TVBP), used as a statistical tool for comparing and cross-timing of time series, were reported with values of statistical significance (*, **, *** = < 0.05, < 0.01, < 0.001 p-level, respectively; ns = not significant).
| Statistical Tool | Glk | GSL | TVBP |
|---|---|---|---|
| Statistical significance | Percentage agreement in the signs of the first differences of the two time series | Statistical significance of the Glk significance for the Glk-value | Tool for comparing and cross-timing of time series. It determines the degree of correlation between curves. This method eliminates low-frequency variations in the time series, as each value is divided by the corresponding 5 h moving average |
| Statistical value | * = 62%; ** = 67% with an overlap of 50 h; | * = 95%; ** = 99%; *** = 99.9% | * = 3.5 ÷ 2; ** ≥ 3.5; ns ≤= 2 |
| * = 87%; ** = 76% with an overlap of 10 h |
© 2018 by the authors. Licensee MDPI, Basel, Switzerland. This article is an open access article distributed under the terms and conditions of the Creative Commons Attribution (CC BY) license (http://creativecommons.org/licenses/by/4.0/).
Share and Cite
MDPI and ACS Style
Cocozza, C.; Tognetti, R.; Giovannelli, A. High-Resolution Analytical Approach to Describe the Sensitivity of Tree–Environment Dependences through Stem Radial Variation. Forests 2018, 9, 134. https://doi.org/10.3390/f9030134
AMA Style
Cocozza C, Tognetti R, Giovannelli A. High-Resolution Analytical Approach to Describe the Sensitivity of Tree–Environment Dependences through Stem Radial Variation. Forests. 2018; 9(3):134. https://doi.org/10.3390/f9030134
Chicago/Turabian StyleCocozza, Claudia, Roberto Tognetti, and Alessio Giovannelli. 2018. "High-Resolution Analytical Approach to Describe the Sensitivity of Tree–Environment Dependences through Stem Radial Variation" Forests 9, no. 3: 134. https://doi.org/10.3390/f9030134
Note that from the first issue of 2016, this journal uses article numbers instead of page numbers. See further details here.