Resolving Variables Influencing the Residence Time of Biomass in the Old-Age Forest across Climate Gradients

1
Nantong College of Science and Technology in Jiangsu Province, Nantong 226007, China
2
Research Institute of Ecological Function and Forest Carbon Sink, Inner Mongolia Academy of Forestry Science, Hohhot 010010, China
*
Author to whom correspondence should be addressed.
Forests 2018, 9(3), 148; https://doi.org/10.3390/f9030148
Submission received: 31 January 2018
/
Revised: 9 March 2018
/
Accepted: 15 March 2018
/
Published: 16 March 2018
(This article belongs to the Special Issue Old Growth Temperate and Boreal Forests: Processes, Functions, and Dynamics)
Abstract
:Standing biomass stocks represent a balance between a number of processes that lead to biomass accumulation or to biomass loss. The average time of biomass residence (ATr) of an ecosystem is the average period of time that carbon is locked up in the living biomass before it is transferred to the litter pool and is an important variable influencing the process leading to biomass loss. Variation in terrestrial ATr with climate is thought to originate from a direct influence of temperature and precipitation on plant mortality. However, variation in ATr may also result from an indirect influence of climate by means of plant age and growing season length. To identify the relative importance of direct and indirect climate effects, we analyzed published data of ecosystem woody biomass and productivity from forest plots across climate gradients, using three approaches: bayesian linear regression, multiple regression, and structural equation modeling. The three approaches provided special insights and they converged in supporting climate as an indirect driver of ATr across climate gradients. Notably, age and growing season length explained most of the variation in ATr, whereas mean annual temperature and precipitation explained almost none, suggesting that climate indirectly influenced ATr. Our analyses provide novel evidence not only supporting that the old-age forests could be a carbon sink with a longer time of biomass residence at a large scale, but also modifying the key drivers of ecosystem processes for vegetation dynamic models.
1. Introduction
As the largest part of terrestrial ecosystems, forests store over 80% of terrestrial vegetation carbon [1], occupying around 30% of the global land surface with about 4.2 × 10⁹ hm2 [2,3]. In addition, the annual C flux between forests and the atmosphere through photosynthesis and respiration accounts for 50–90% of the total annual flux of terrestrial ecosystems [4,5]. Because of their capacity for carbon storage and high productivity, forests play an important role in regional and global carbon dynamics [1,6].
Old-growth forests provide multiple ecosystem services [7]. Although the aboveground productivity of some forests declines with forest stand age increasing, old-growth forests are recognized as having accumulated large amounts of terrestrial carbon [8], especially that accumulated in the soil [9]. Although a small fraction of the total net primary production (NPP), wood production influences long-term carbon storage more than all other components of NPP, because of the durability of wood [10]. Indeed, the rate of carbon storage accumulation via wood production currently exceeds the rate of losses via tree death, making forests a carbon sink at the global scale [1]. However, there is concern that the carbon sink may be transitory, with forests potentially becoming a carbon source if the climate warms and management practices change [11].
Most ecologists now agree that at least some of the forest carbon sink exists as a consequence of an on-going stimulation of their NPP, probably in response to increasing atmospheric CO2 [4]. However, any carbon absorbed through this CO2 fertilisation would eventually return to the atmosphere because of tree death. Consequently, it is not only the magnitude of any growth stimulation, but also the average amount of time a carbon atom spends as living structural dry matter within an ecosystem (before returning to the atmosphere), the mean residence time, that determines the magnitude of any carbon sink [12,13]. The forest carbon sink will only occur if increases in forest growth rates are not offset by a reduction in residence time. Thus, understanding the drivers of production and residence time is important to predict changes in the global forest carbon sink over the coming century [14,15].
The carbon sink represents a balance between a number of processes that lead to biomass accumulation or to biomass loss [4]. The average time of biomass residence (ATr) of an ecosystem is the average period of time that carbon is locked up in the living woody biomass before it is transferred to the litter pool [13]. Variation in terrestrial ATr with climate is thought to originate from a direct influence of temperature and precipitation on plant mortality [16,17]. However, the relatively weak relationship of mortality rates and ATr with climate in tropical forests has also been observed [13,18,19].
In this paper, our overall aim was to attempt to resolve the variables that influence ATr based on a compiled old-age forests database. We hypothesised that variation in ATr may result from an indirect influence of climate by other factors (e.g., stand age).
2. Materials and Methods
2.1. Data Sources
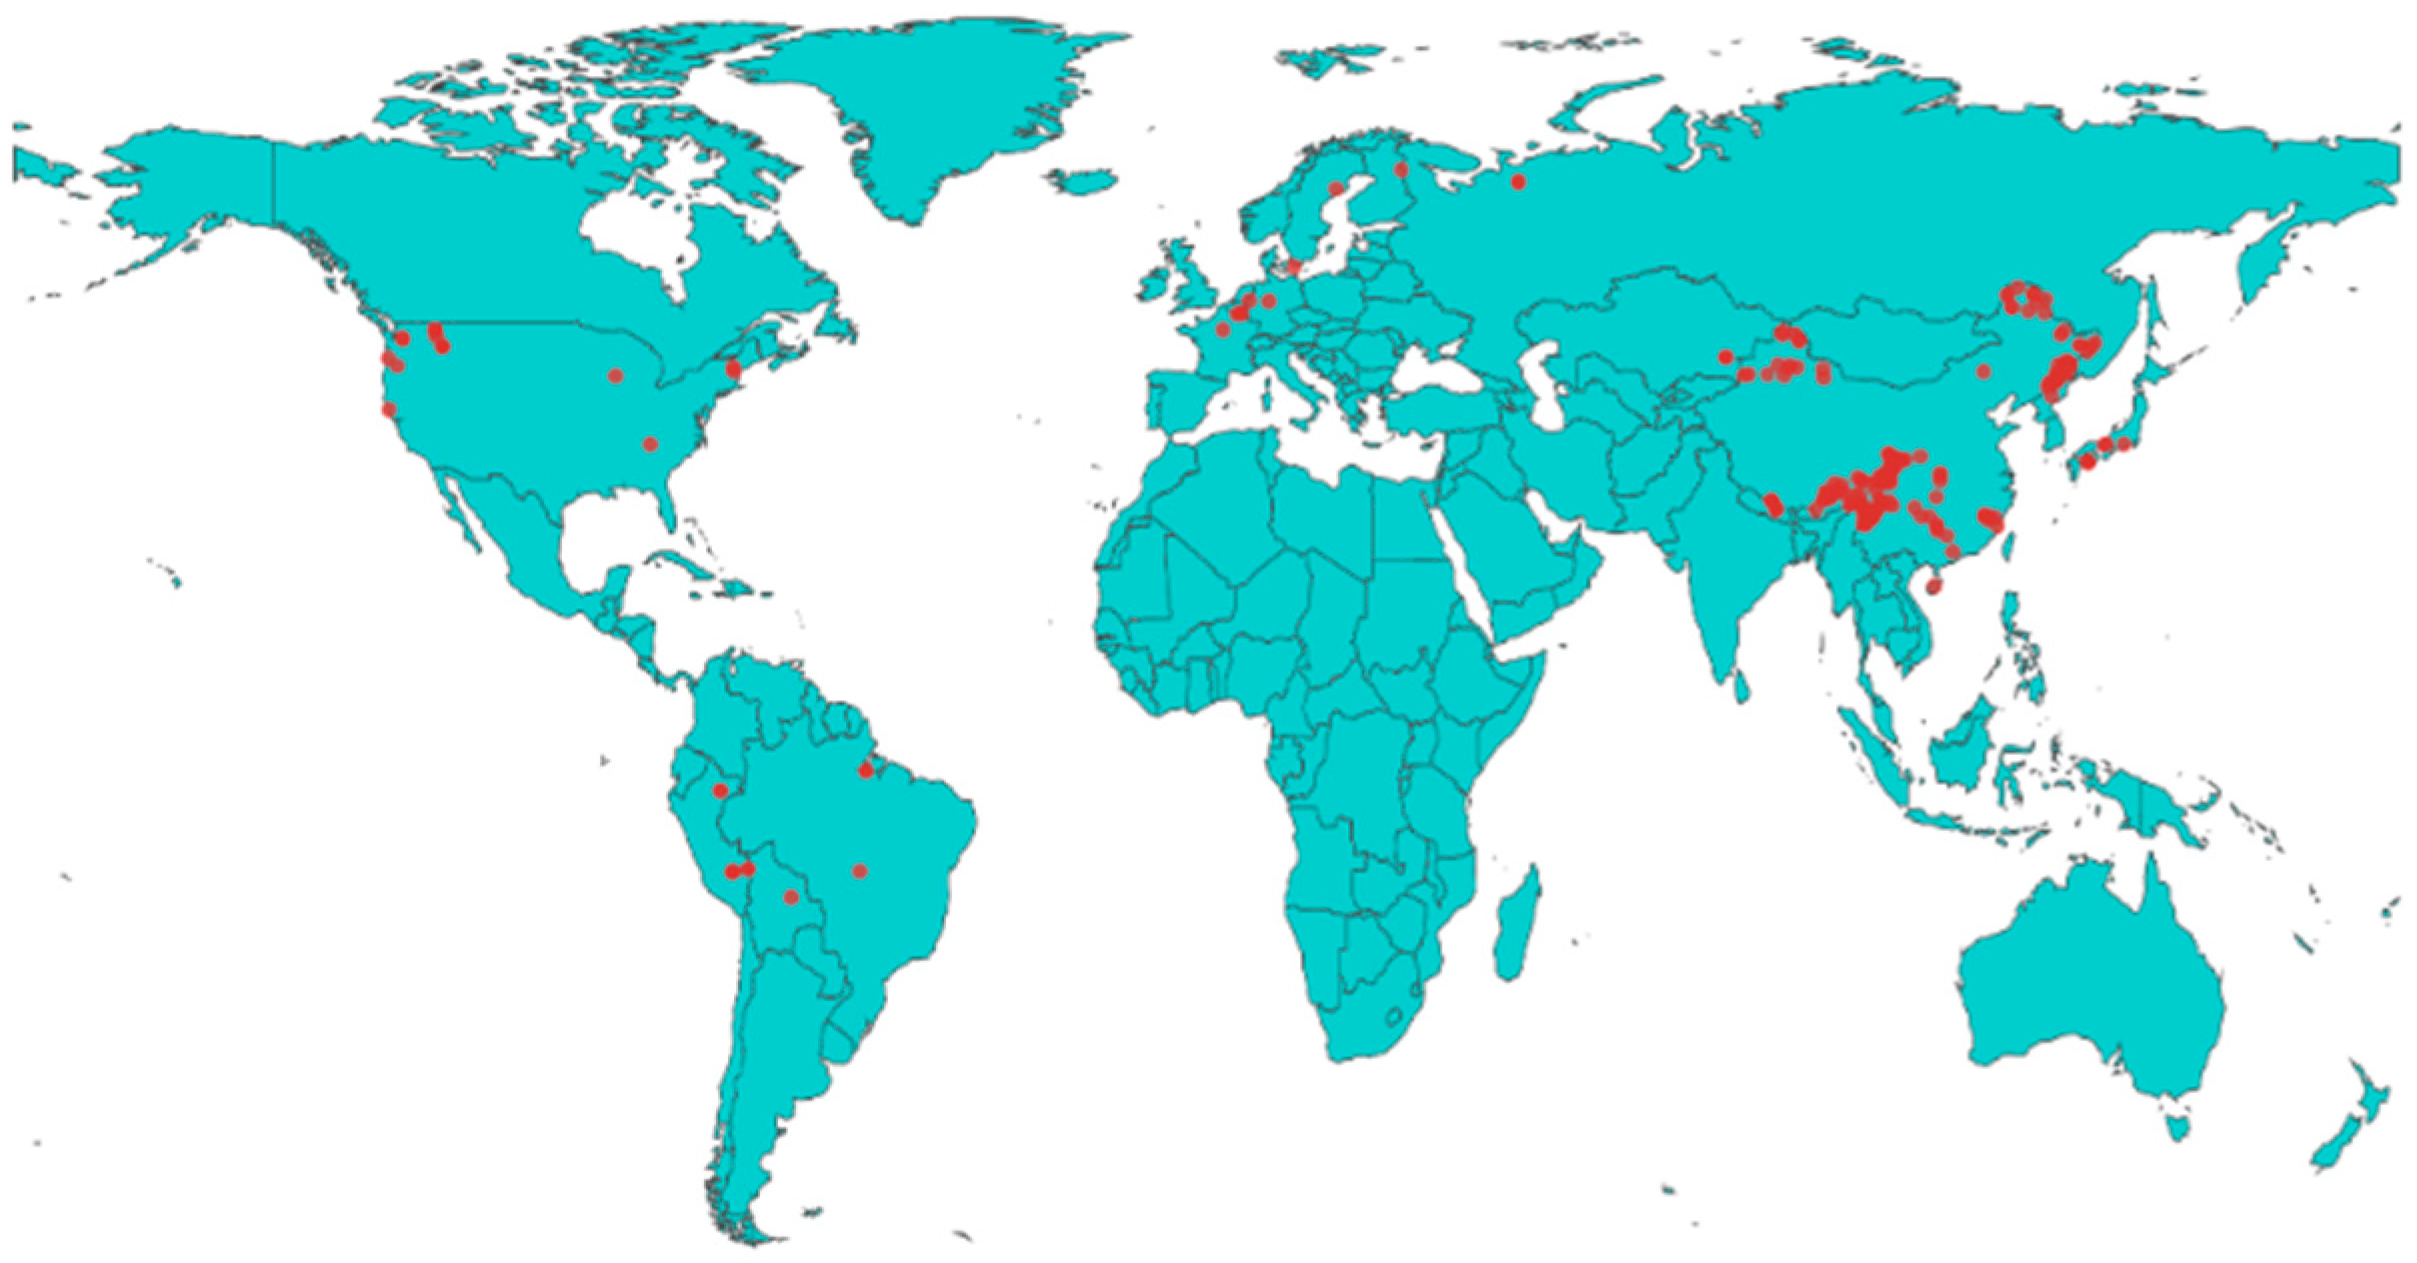
The dataset used in this study, including woody plant biomass and production data and climate data, was compiled from the dataset of Michaletz et al. [20]. Our dataset included data for 262 woody plant communities across Asia, Europe, Africa, and America (Figure 1). The forest age ranged from 101 to 450 years. The forest stand biome types included temperate forest, temperate rainforest, tropical rainforest, and tropical seasonal forest, etc. Climate data for each plot in this dataset were obtained from a 10-min resolution gridded climatology (see details in [20]). Mean annual temperature (MAT, eV−1) was calculated as the 12-month average of mean monthly air temperatures and was expressed as the Boltzmann factor exponent 1/kT, where k is the Boltzmann constant (8.617 × 10⁻⁵ eV K−1) and T is temperature (K). Mean annual precipitation (MAP, mm) was calculated as the 12-month sum of mean monthly values. Growing season length (GSL, month) was the number of months with a mean minimum temperature greater than 0.6 and a moisture index >0.048 [20].
2.2. Analytical Framework
To resolve the variables that influence ATr and to identify the relative importance of direct and indirect climate effects on ATr, we first estimated values of ATr and then applied three approaches: bayesian linear regression, multiple regression, and structural equation modeling. The approaches testing our hypotheses were described in the following sections (a–c).
(a) Estimating values of ATr
The change in biomass (M) of an individual plant compartment i over a period of time can be described as:
where ai represents the fraction of NPP allocated to the biomass pool i, and ti is the mean residence time of that biomass pool, usually expressed in years.
The most common approach recasted from Equation (1) for estimating ATr is to calculate it as the ratio of mean biomass (Wm) and mean productivity (Wp):
The Wp term above is the sum of the stem growth of standing vegetation and a small recruitment term [18]. This approach for calculating ATr is only valid for near-equilibrium systems, such as old-growth forests. Thus, we calculated the ATr of forest age >101 years using Equation (2).
(b) Bayesian linear regression and Multiple regression
First, we applied bayesian linear regression to the compiled dataset (Table 1, Figure 2) to compare the candidate models. GLS, MAP, and MAT were selected as candidate climate variables. The bayesian model with the largest bayes factor (BF10, quantifying evidence for the alternative model relative to the null model) was selected as the final model to describe the variables that influence ATr. Second, multiple regression and partial/semipartial correlation analysis were conducted for resolving the influence of climate variables.
(c) Structural equation modeling (SEM)
In SEM, a hypothetical model is usually proposed firstly according to a priori knowledge, and is then evaluated based on empirical data. In order to partition the direct and indirect effects of variables on ATr values, we proposed two hypothetical models. In the first model, MAT, MAP, AGE, and GSL would have direct effects on ATr values (Figure 3A). In addition, MAT and MAP would also have indirect effects on ATr values via AGE and GSL. Meanwhile, we also proposed the second model in which only AGE and GSL would have direct effects on ATr values (Figure 3B). However, MAT and MAP would only have indirect effects on ATr values via AGE and GSL. All the path coefficients were standardized. Support for the model was determined using the Chi-square test. Statistical analyses were used to compare model performance. Two statistical criteria were examined: the Akaike’s Information (AIC) and the Bayesian Information Criteria (BIC). The model that passed the Chi-square test with the lower AIC and BIC had a better performance.
The bayesian linear regression and multiple regression analyses were performed using JASP software (version 0.8.5). The structural equation modeling was performed using Stata software (Stata/MP 14.0 for Mac; StataCorp LLC, College Station, TX, USA).
3. Results
The three approaches applied to test our hypothesis each provided special insights and they converged in supporting climate as an indirect driver of ATr across ecosystems.
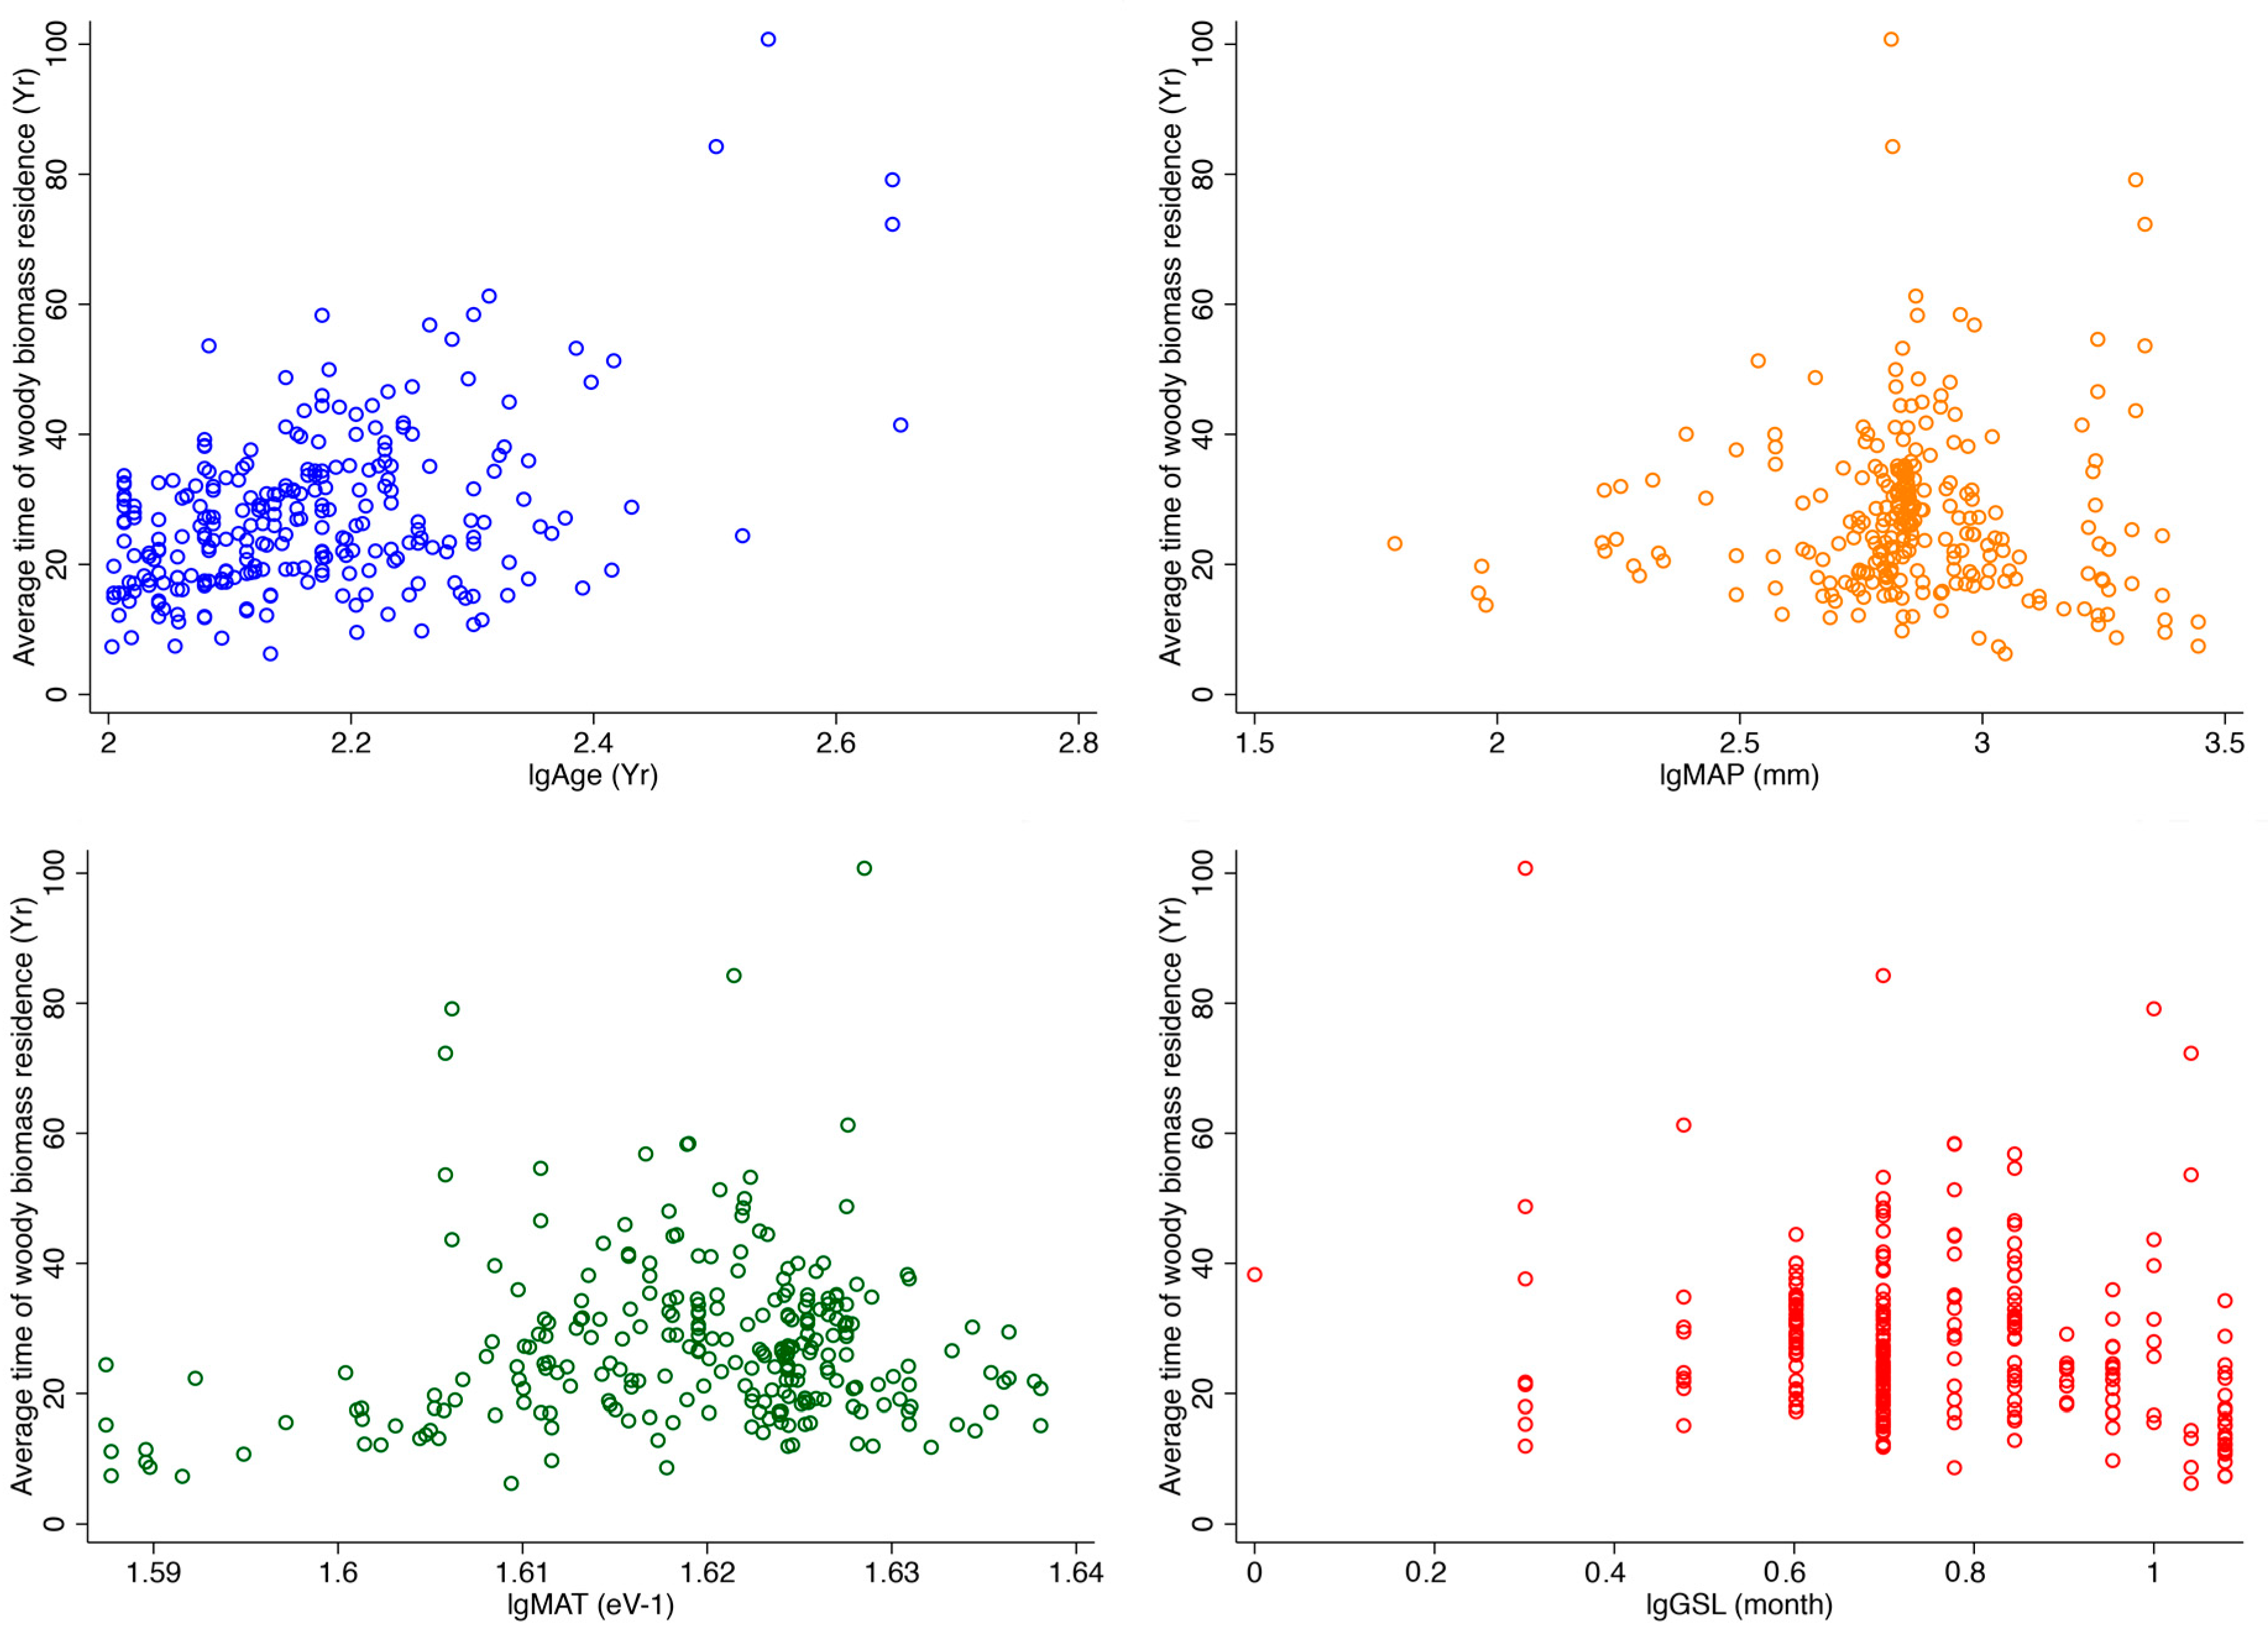
First, the results of the bayesian approach showed that the model ATr ~ Age + GSL was the best fitted model compared to the null model (BF10 = 3.412 × 10¹⁵, Table 2). According to this model, variation in forest stand age and grown season length drove variation in ATr. A similar visual verification could also be obtained from Figure 2. This analysis demonstrates that climate variables MAT and MAP have weak influences on ATr.
Second, the multivariate approach revealed that GSL (partial r2 = −0.200, semipartial r2 = −0.173), MAP (partial r2 = 0.060, semipartial r2 = 0.051), and MAT (partial r2 = −0.062, semipartial r2 = −0.052) explained little of the variation in ATr. AGE explained most of the variation in ATr (partial r2 = 0.483, semipartial r2 = 0.469) (Table 3). This analysis indicates that forest stand age has a strong influence on ATr, and the impact of climate on ATr is weak.
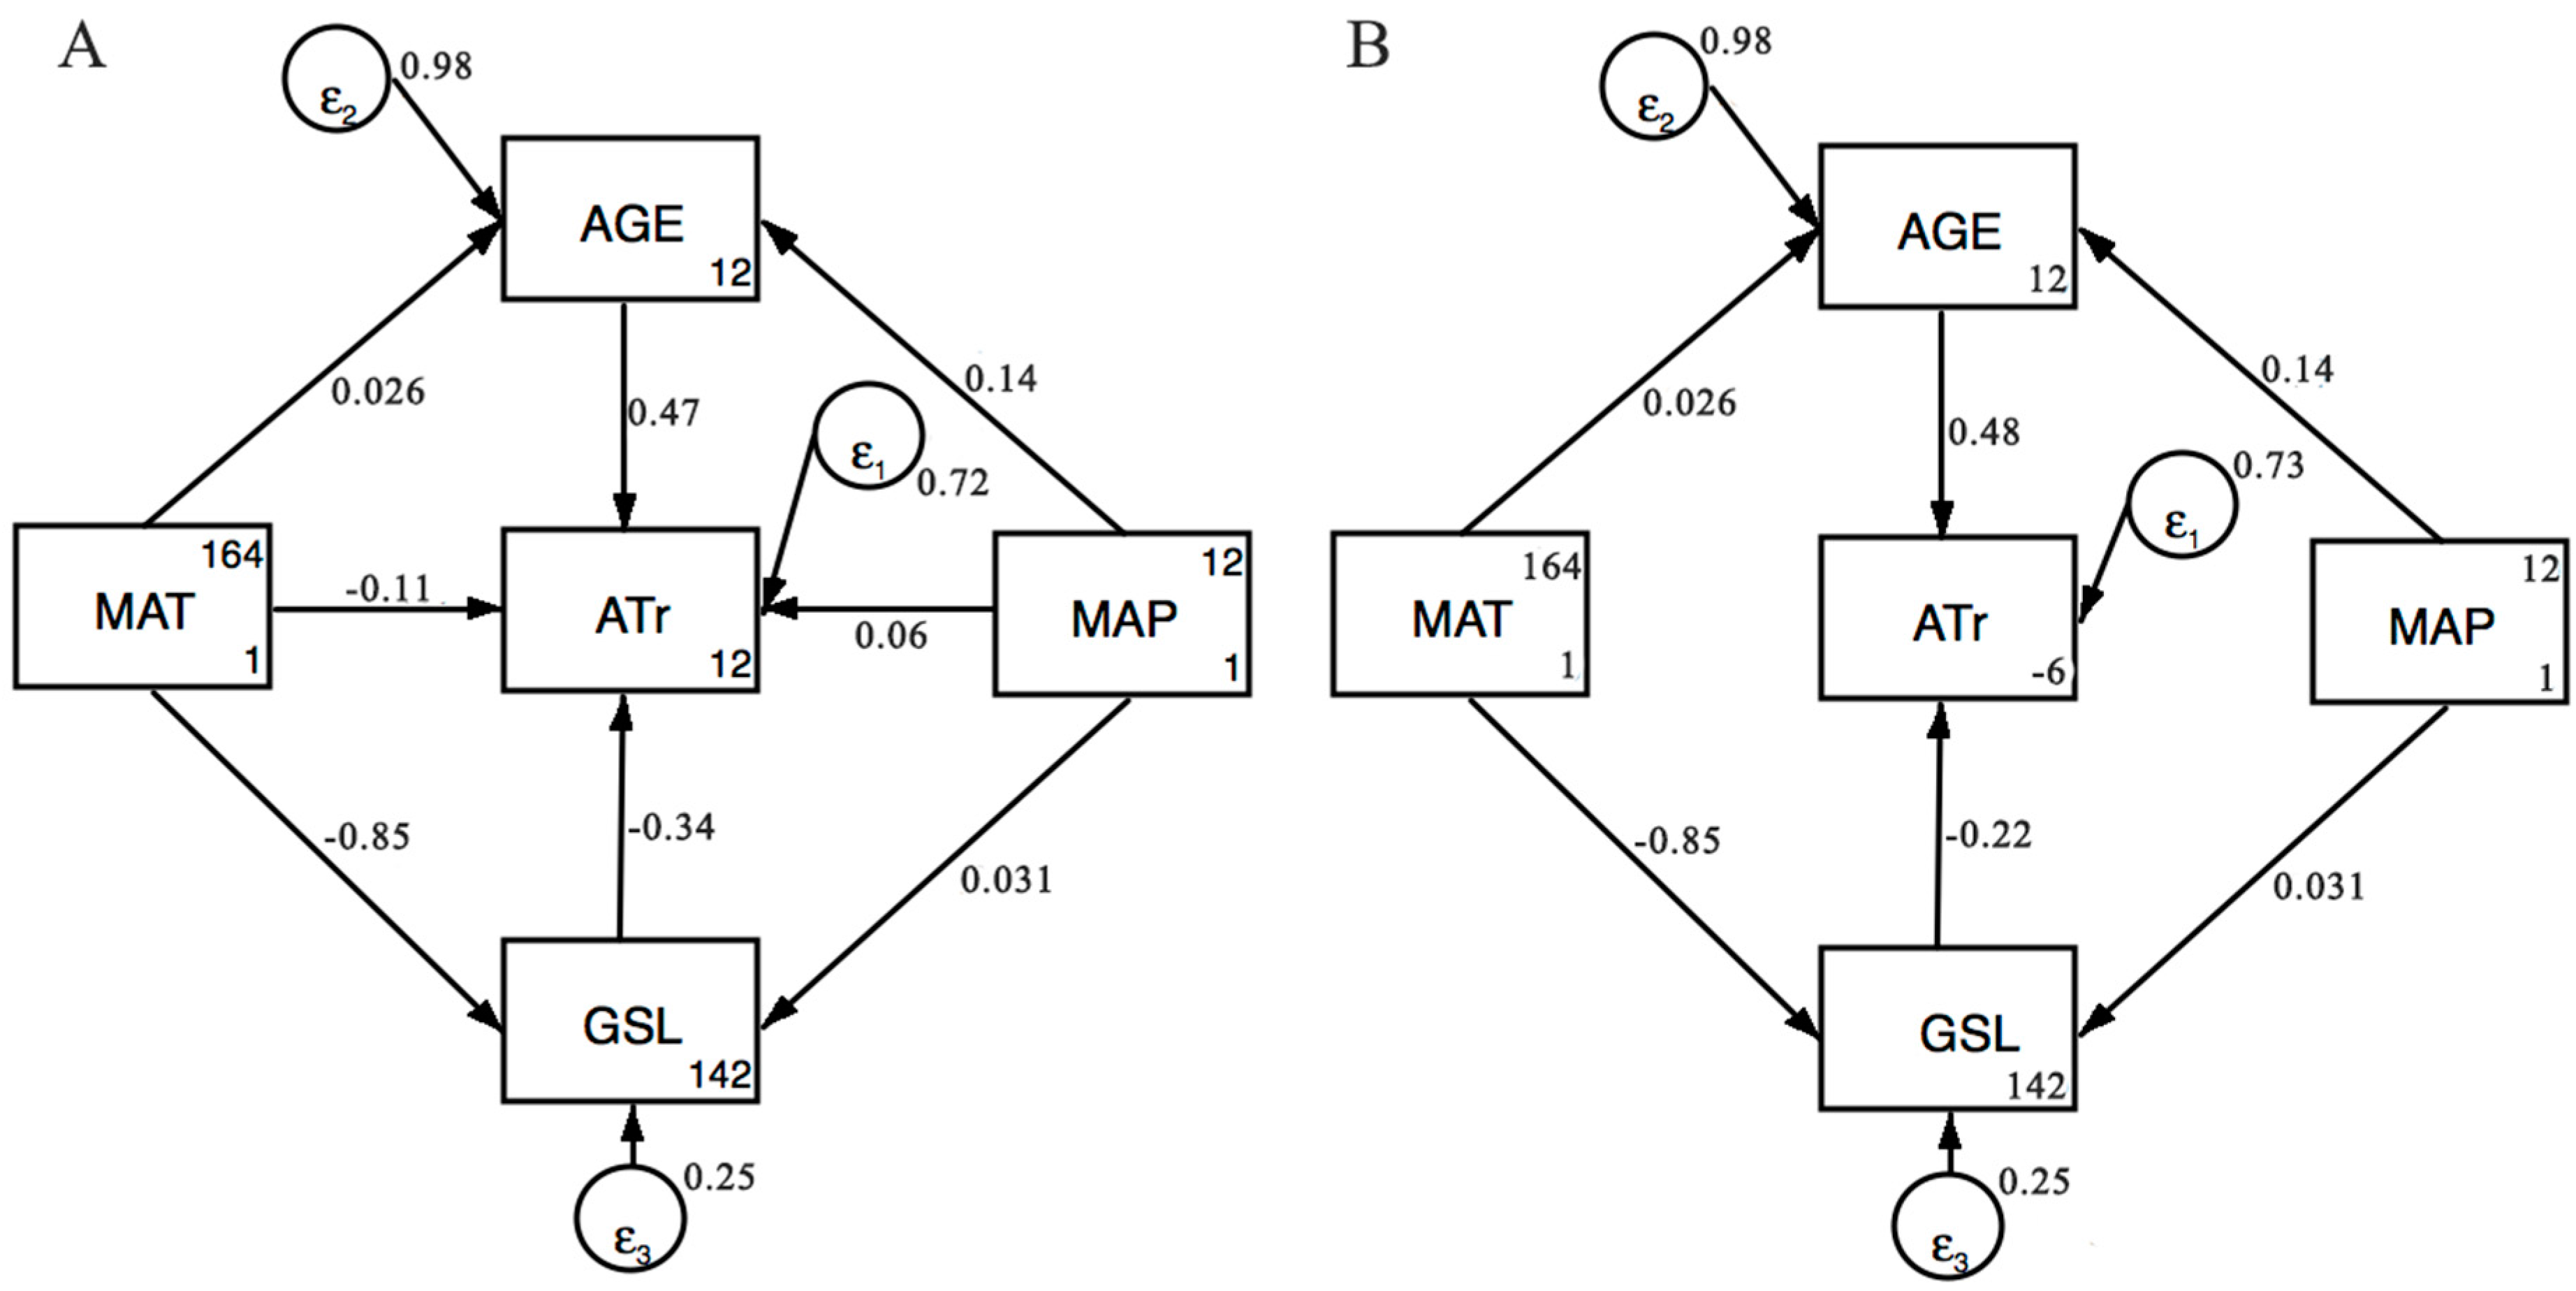
Third, we conducted structural equation modeling (SEM) to explicitly test for the direct and indirect influence of climate variables on ATr. The first Model (Figure 3A) represents that MAT, MAP, AGE, and GSL would have direct effects on ATr values. In addition, MAP and MAT also had indirect effects on ATr values via AGE and GSL. Meanwhile, in the second model (Figure 3B), we removed the pathways between MAT/MAP and ATr, representing that MAT and MAP only had indirect effects on ATr. We found that the two models were highly supported and the second model (Figure 3B) had a better performance with lower AIC and BIC. Furthermore, the SEM approach revealed that the direct effect of AGE (standardized path coefficient = 0.481) and GSL (standardized path coefficient = −0.224) explained most of the variation in ATr, whereas MAP and MAT almost explained variation in ATr as an indirect effect, suggesting that climate variables indirectly influenced ATr via Age and GSL (Figure 3, Table 4).
4. Discussion
Field estimates of forest biomass are usually generated through allometric equations which estimate biomass through relationships with easily measurable tree properties, such as tree height and/or diameter at breast height, and in some cases, wood density [21]. These allometric equations are usually applicable to aboveground biomass only, and relatively crude approaches based on multiplying factors are used to calculate belowground woody biomass and productivity [22]. An alternative approach to estimate ATr, which bypasses the need for specific allometric equations, is to simply divide the plot basal area by basal area productivity [18]. A metric related to ATr is the mean stem residence time, MSr, a measure of the mean lifetime of individual trees. However, David et al. found that the relationship between ATr and MSr deviated considerably from a 1:1 relationship, and that there is also considerable scatter in the relationship [13]. Furthermore, David et al. also found that the modified MSr indicated that ATr was better by including the stem recruitment rate [13].
In a previous analysis of data on above-ground wood production from 104 plots in Amazonia, Malhi et al. did not find any strong relationships between wood production and climate (average rainfall, average length of the dry season, average incoming radiation flux density), although there was a suggestion of declining wood production with increasing temperature [18]. In addition, Quesada et al. also found that climate was not generally a strong predictor of geographical variations in stem turnover rates, above-ground biomass, and woody productivity across Amazonia [19]. Correlation analyses conducted on the David et al. dataset [13] generally confirmed the findings of the studies of Malhi et al. [18] and Quesada et al. [19] as they could find only weak insignificant correlations. However, the relatively weak relationship of mortality rates and ATr with climate in tropical forests contrasts with studies in temperate ecosystems where climatic factors (precipitation, maximum and minimum temperatures) have been inferred to be significant drivers in geographical patterns in tree mortality rates [17].
The sequestered carbon dioxide is stored in live woody tissues and slowly decomposing organic matter in litter and soil [9]. The carbon sink in forest ecosystems was determined by forest growth, mortality, and the time of biomass residence. Former research revealed that the aboveground productivity would decline with increasing age and size of individual trees, because of the decrease in growth rate [23]. However, a recent study focusing on temperate and tropical tree species revealed that biomass increases with size increasing, regardless of age [24]. Xu et al. also found that the decline in aboveground biomass accumulation in old forests was attributed to the mortality of large dominant trees and not to a decrease in growth of the surviving trees [25]. Furthermore, Luyssaert et al. reported a search of literature and databases for forest carbon-flux estimates [26]. They found that net ecosystem productivity (the difference between NPP and the decomposition rate of dead organic matter) in forests of a wide age range is usually positive. Their results demonstrate that old-growth forests can continue to accumulate carbon, against to the long- standing view that they are carbon neutral. Our analyses provide new evidence supporting that old-age forests could be a carbon sink with a longer time of woody biomass residence at a large scale.
Forests are very sensitive to climate and levels of atmospheric CO2 [27]. Adaptive forest management can help forest ecosystems to adapt to climate change for achieving management goals, maintaining desired forest ecosystem services, and reducing the risks of forest degradation [28]. Therefore, it is necessary to analyse the potential responses of terrestrial vegetation to future changes in climate and atmospheric CO2 [27]. However, the dynamics of carbon turnover have been largely ignored in most global vegetation models [27]. The notion of a constant ATr across all global forests may be of limited utility, given the large observed variation in ATr. We found that while there was little relationship between MAT/MAP and ATr, there was evidence that AGE and GSL exerted a strong influence on ATr. There is considerable uncertainty in how ATr will be affected by global environmental change, especially by increased atmospheric CO2. Even small changes in ATr could significantly reduce the future forest carbon sink predicted by many vegetation models [13].
5. Conclusions
This article is the first time that researchers have tested whether the biomass residence time (ATr) of an ecosystem is influenced indirectly by climate variables across climate gradients. Our analyses provide reference for statistical analyses to disentangle the direct and indirect effects of climate variables in determining ATr. Our analyses provide novel evidence not only supporting that the old-age forests could be a carbon sink with a longer time of biomass residence at a large scale, but also modifying the key drivers of ecosystem processes for vegetation dynamic models.
Acknowledgments
This research was supported by Start-up funds for doctoral research of Nantong college of science and technology (No. NTKY-Dr2015005), Inner Mongolia adaptation to climate change and low-carbon development finance special fund projects (No. 2740046), and Inner Mongolia natural science foundation project (No. 2015BS0323).
Author Contributions
Weifeng Wang conceived and designed the experiments; Yangrui Han, Weiyan Zhang, Jun Zhang, Dandan Shan, and Weifeng Wang analyzed the data; Weifeng Wang and Yangrui Han wrote the paper.
Conflicts of Interest
The authors declare no conflict of interest.
References
- Pan, Y.; Birdsey, R.A.; Fang, J.; Houghton, R.; Kauppi, P.E.; Kurz, W.A.; Phillips, O.L.; Shvidenko, A.; Lewis, S.L.; Canadell, J.G. A large and persistent carbon sink in the world’s forests. Science 2011, 333, 988. [Google Scholar] [CrossRef] [PubMed]
- Bonan, G.B. Forests and climate change: Forcings, feedbacks, and the climate benefits of forests. Science 2008, 320, 1444. [Google Scholar] [CrossRef] [PubMed]
- Kramer, P.J. Carbon dioxide concentration, photosynthesis, and dry matter production. Bioscience 1981, 31, 29–33. [Google Scholar] [CrossRef]
- Malhi, Y.; Doughty, C.; Galbraith, D. The allocation of ecosystem net primary productivity in tropical forests. Philos. Trans. R. Soc. Lond. 2011, 366, 3225–3245. [Google Scholar] [CrossRef] [PubMed]
- Winjum, J.K.; Dixon, R.K.; Schroeder, P.E. Forest management and carbon storage: An analysis of 12 key forest nations. Water Air Soil Pollut. 1993, 70, 239–257. [Google Scholar] [CrossRef]
- Fang, J.; Guo, Z.; Hu, H.; Kato, T.; Muraoka, H.; Son, Y. Forest biomass carbon sinks in east asia, with special reference to the relative contributions of forest expansion and forest growth. Glob. Chang. Biol. 2014, 20, 2019–2030. [Google Scholar] [CrossRef] [PubMed]
- Creutzburg, M.K.; Scheller, R.M.; Lucash, M.S.; LeDuc, S.D.; Johnson, M.G. Forest management scenarios in a changing climate: Trade-offs between carbon, timber, and old forest. Ecol. Appl. 2017, 27, 503–518. [Google Scholar] [CrossRef] [PubMed]
- Soloway, A.D.; Amiro, B.D.; Dunn, A.L.; Wofsy, S.C. Carbon neutral or a sink? Uncertainty caused by gap-filling long-term flux measurements for an old-growth boreal black spruce forest. Agric. For. Meteorol. 2017, 233, 110–121. [Google Scholar] [CrossRef]
- Zhou, G.; Liu, S.; Li, Z.; Zhang, D.; Tang, X.; Zhou, C.; Yan, J.; Mo, J. Old-growth forests can accumulate carbon in soils. Science 2006, 314, 1417. [Google Scholar] [CrossRef] [PubMed]
- Chambers, J.Q.; Higuchi, N.; Tribuzy, E.S.; Trumbore, S.E. Carbon sink for a century. Nature 2001, 410, 429. [Google Scholar] [CrossRef] [PubMed]
- Lutz, D.A.; Shugart, H.H.; White, M.A. Sensitivity of russian forest timber harvest and carbon storage to temperature increase. Forestry 2013, 86, 283–293. [Google Scholar] [CrossRef]
- Lloyd, J.; Farquhar, G.D. The CO2 dependence of photosynthesis, plant growth responses to elevated atmospheric CO2 concentrations and their interaction with soil nutrient status. I. General principles and forest ecosystems. Funct. Ecol. 1996, 10, 4–32. [Google Scholar] [CrossRef]
- Galbraith, D.; Malhi, Y.; Affum-Baffoe, K.; Castanho, A.D.; Doughty, C.E.; Fisher, R.A.; Lewis, S.L.; Peh, K.S.-H.; Philips, O.L.; Quesada, C.A.; et al. Residence times of woody biomass in tropical forests. Trans. Bot. Soc. Edinb. 2013, 6, 139–157. [Google Scholar] [CrossRef]
- Coomes, D.A.; Flores, O.; Holdaway, R.; Jucker, T.; Lines, E.R.; Vanderwel, M.C. Wood production response to climate change will depend critically on forest composition and structure. Glob. Chang. Biol. 2015, 20, 3632–3645. [Google Scholar] [CrossRef] [PubMed]
- Luo, Y.; Chen, H.Y. Climate change-associated tree mortality increases without decreasing water availability. Ecol. Lett. 2015, 18, 1207–1215. [Google Scholar] [CrossRef] [PubMed]
- Dietze, M.C.; Moorcroft, P.R. Tree mortality in the eastern and central United States: Patterns and drivers. Glob. Chang. Biol. 2011, 17, 3312–3326. [Google Scholar] [CrossRef]
- Lines, E.R.; Coomes, D.A.; Purves, D.W. Influences of forest structure, climate and species composition on tree mortality across the eastern us. PLoS ONE 2010, 5, e13212. [Google Scholar] [CrossRef] [PubMed]
- Malhi, Y.; Baker, T.R.; Phillips, O.L.; Almeida, S.; Alvarez, E.; Arroyo, L.; Chave, J.; Czimczik, C.I.; Fiore, A.D.; Higuchi, N. The above-ground coarse wood productivity of 104 neotropical forest plots. Glob. Chang. Biol. 2004, 10, 563–591. [Google Scholar] [CrossRef]
- Quesada, C.A.; Phillips, O.L.; Schwarz, M.; Czimczik, C.I.; Baker, T.R.; Patiño, S.; Fyllas, N.M.; Hodnett, M.G.; Herrera, R.; Almeida, S.; et al. Basin-wide variations in amazon forest structure and function are mediated by both soils and climate. Biogeosci. Discuss. 2012, 9, 2203–2246. [Google Scholar] [CrossRef] [Green Version]
- Michaletz, S.T.; Cheng, D.; Kerkhoff, A.J.; Enquist, B.J. Convergence of terrestrial plant production across global climate gradients. Nature 2014, 512, 39. [Google Scholar] [CrossRef] [PubMed]
- Zheng, J.; Wei, X.; Liu, Y.; Liu, G.; Wang, W.; Liu, W. Review of regional carbon counting methods for the chinese major ecological engineering programs. J. For. Res. 2016, 27, 727–738. [Google Scholar] [CrossRef]
- Metcalfe, D.B.; Meir, P.; Aragcdo, L.E.O.C.; Lobo-Do-Vale, R.; Galbraith, D.; Fisher, R.A.; Chaves, M.M.; Maroco, J.P.; Costa, A.C.L.D.; De Almeida, S.S. Shifts in plant respiration and carbon use efficiency at a large-scale drought experiment in the eastern amazon. New Phytol. 2010, 187, 608–621. [Google Scholar] [CrossRef] [PubMed]
- Meinzer, F.C.; Lachenbruch, B.; Dawson, T.E. Size- and Age-Related Changes in Tree Structure and Function; Springer: Dordrecht, The Netherlands, 2011; pp. 6891–6892. [Google Scholar]
- Stephenson, N.L.; Das, A.J.; Condit, R.; Russo, S.E.; Baker, P.J.; Beckman, N.G.; Coomes, D.A.; Lines, E.R.; Morris, W.K.; Ruger, N.; et al. Rate of tree carbon accumulation increases continuously with tree size. Nature 2014, 50, 7490. [Google Scholar] [CrossRef] [PubMed]
- Xu, C.Y.; Turnbull, M.H.; Tissue, D.T.; Lewis, J.D.; Carson, R.; Schuster, W.S.F.; Whitehead, D.; Walcroft, A.S.; Li, J.; Griffin, K.L. Age-related decline of stand biomass accumulation is primarily due to mortality and not to reduction in NPP associated with individual tree physiology, tree growth or stand structure in a quercus-dominated forest. J. Ecol. 2012, 100, 428–440. [Google Scholar] [CrossRef]
- Luyssaert, S.; Schulze, E.D.; Börner, A.; Knohl, A.; Hessenmöller, D.; Law, B.E.; Ciais, P.; Grace, J. Old-growth forests as global carbon sinks. Nature 2008, 455, 213. [Google Scholar] [CrossRef] [PubMed]
- Friend, A.D.; Lucht, W.; Rademacher, T.T.; Keribin, R.; Betts, R.; Cadule, P.; Ciais, P.; Clark, D.B.; Dankers, R.; Falloon, P.D. Carbon residence time dominates uncertainty in terrestrial vegetation responses to future climate and atmospheric co2. Proc. Natl. Acad. Sci. USA 2014, 111, 3280–3285. [Google Scholar] [CrossRef] [PubMed]
- Andreas, B.; Christian, A.; Magnus, L.; Palle, M.; Gertjan, N.; Peter, S.; Peter, S.; Joachim, R. Adaptive forest management in central europe: Climate change impacts, strategies and integrative concept. Scand. J. For. Res. 2009, 24, 473–482. [Google Scholar]
Figure 1.
Map of study plots (n = 262). Study plots are represented by red dots (collected from [20]).
Figure 1.
Map of study plots (n = 262). Study plots are represented by red dots (collected from [20]).

Figure 2.
Variation in average time of woody biomass residence for 262 woody plant communities. Age: Forest age, year; GSL: Growing season length, month; MAP: Mean annual precipitation, mm; MAT: Mean annual temperature, eV−1. The variables were transformed by Log10 (lg).
Figure 2.
Variation in average time of woody biomass residence for 262 woody plant communities. Age: Forest age, year; GSL: Growing season length, month; MAP: Mean annual precipitation, mm; MAT: Mean annual temperature, eV−1. The variables were transformed by Log10 (lg).

Figure 3.
Structural equation models (SEM) for average time of woody biomass residence as determined by climate variables, stand age, and growing season length applied to the 262 woody plant communities. ATr: Average time of biomass residence; AGE: Forest age; GSL: Growing season length; MAP: Mean annual precipitation; MAT: Mean annual temperature; εi: Error. Directional arrows linking two variables depict direct effects with the standardized path coefficients. (A) Chi-square = 0.00, Prob > chi-square = 0.96, AIC = −615.69, BIC = −565.733; (B) Chi-square = 2.58, Prob > chi-square = 0.462, AIC = −617.117, BIC = −574.297.


Table 1.
Summary statistics for the fitting data.
| Variable | Mean | Std. Deviation | Minimum | Maximum |
|---|---|---|---|---|
| Age | 152.1 | 51.45 | 101 | 450 |
| MAT | 41.63 | 0.94 | 38.67 | 43.46 |
| MAP | 825.0 | 475.2 | 61.5 | 2784 |
| GSL | 6.2 | 2.64 | 1 | 12 |
| ATr | 27.46 | 12.69 | 6.26 | 100.8 |
Note: ATr: Average time of biomass residence; Age: Forest age, year; GSL: Growing season length, month; MAP: Mean annual precipitation, mm; MAT: Mean annual temperature, eV−1.
Table 2.
Model comparison based on bayesian linear regression.
| Models | P(M) | P(M|Data) | BFM | BF10 | Error % |
|---|---|---|---|---|---|
| Null model | 0.063 | 1.719 × 10⁻¹⁶ | 2.579 × 10⁻¹⁵ | 1 | |
| lgAge | 0.063 | 0.001 | 0.017 | 6.473 × 10¹² | 0.004 |
| lgMAP | 0.063 | 2.413 × 10⁻¹⁷ | 3.620 × 10⁻¹⁶ | 0.140 | 0.002 |
| lgAge + lgMAP | 0.063 | 1.887 × 10⁻⁴ | 0.003 | 1.098 × 10¹² | 5.165 × 10⁻⁴ |
| lgMAT | 0.063 | 2.340 × 10⁻¹⁶ | 3.510 × 10⁻¹⁵ | 1.361 | 0.004 |
| lgAge + lgMAT | 0.063 | 0.009 | 0.131 | 5.029 × 10¹³ | 0.001 |
| lgMAP + lgMAT | 0.063 | 1.643 × 10⁻¹⁶ | 2.464 × 10⁻¹⁵ | 0.956 | 0.01 |
| lgAge + lgMAP + lgMAT | 0.063 | 0.002 | 0.026 | 9.964 × 10¹² | 0.004 |
| lgGSL | 0.063 | 3.975 × 10⁻¹⁵ | 5.962 × 10⁻¹⁴ | 23.121 | 0.004 |
| lgAge + lgGSL | 0.063 | 0.587 | 21.281 | 3.412 × 10¹⁵ | 0.002 |
| lgMAP + lgGSL | 0.063 | 5.525 × 10⁻¹⁵ | 8.288 × 10⁻¹⁴ | 32.141 | 0.001 |
| lgAge + lgMAP + lgGSL | 0.063 | 0.176 | 3.197 | 1.022 × 10¹⁵ | 0.003 |
| lgMAT + lgGSL | 0.063 | 1.503 × 10⁻¹⁵ | 2.255 × 10⁻¹⁴ | 8.746 | 0.004 |
| lgAge + lgMAT + lgGSL | 0.063 | 0.18 | 3.289 | 1.046 × 10¹⁵ | 0.003 |
| lgMAP + lgMAT + lgGSL | 0.063 | 1.593 × 10⁻¹⁵ | 2.390 × 10⁻¹⁴ | 9.268 | 0.004 |
| lgAge + lgMAP + lgMAT + lgGSL | 0.063 | 0.046 | 0.727 | 2.690 × 10¹⁴ | 0.002 |
Note: Dependent variable: ATr (Average time of woody biomass residence). Best model in bold.
Table 3.
Multiple regression fits to a global compilation of data from 262 woody plant communities.
| Covariates | Standardized Coefficients | t-Value | p-Value | 2.50% | 97.50% | VIF | Partial | Semipartial |
|---|---|---|---|---|---|---|---|---|
| Intercept | 0.641 | 0.522 | −307.512 | 604.639 | ||||
| lgAge | 0.473 | 8.853 | < 0.001 | 39.545 | 62.171 | 1.018 | 0.483 | 0.469 |
| lgMAP | 0.06 | 0.964 | 0.336 | −3.215 | 9.377 | 1.382 | 0.060 | 0.051 |
| lgMAT | −0.107 | −0.988 | 0.324 | −410.229 | 136.055 | 4.175 | −0.062 | −0.052 |
| lgGSL | −0.344 | −3.274 | 0.001 | −38.184 | −9.503 | 3.927 | −0.200 | −0.173 |
Note. Dependent variable: ATr (Average time of woody biomass residence). Age: Forest age; GSL: Growing season length; MAP: Mean annual precipitation; MAT: Mean annual temperature. 2.50%: Lower bound of the 95% confidence intervals for the regression coefficients, 97.50%: Upper bound of the 95% confidence intervals, VIF: Variance Inflation Factor. Model summary: R2 = 0.278, Adjusted R² = 0.267, RMSE (Root-mean-square error) = 10.87, p-value < 0.001.
Table 4.
Direct, indirect, and total standardized effects on ATr based on structural equation models.
Table 4.
Direct, indirect, and total standardized effects on ATr based on structural equation models.
| SEM Model | Predictor | Pathway to ATr | Effect |
|---|---|---|---|
| Model in Figure 3A | AGE | direct | 0.473 *** |
| GSL | direct | −0.344 *** | |
| MAT | direct | −0.107 | |
| indirect | 0.303 *** | ||
| total | 0.196 *** | ||
| MAP | direct | 0.060 | |
| indirect | 0.058 | ||
| total | 0.118 | ||
| Model in Figure 3B | AGE | direct | 0.481 *** |
| GSL | direct | −0.224 *** | |
| MAT | indirect | 0.202 *** | |
| MAP | indirect | 0.063 |
Significant effects are at p < 0.001 (***). AGE: Forest age; GSL: Growing season length; MAP: Mean annual precipitation; MAT: Mean annual temperature.
© 2018 by the authors. Licensee MDPI, Basel, Switzerland. This article is an open access article distributed under the terms and conditions of the Creative Commons Attribution (CC BY) license (http://creativecommons.org/licenses/by/4.0/).
Share and Cite
MDPI and ACS Style
Han, Y.; Wang, W.; Zhang, W.; Zhang, J.; Shan, D. Resolving Variables Influencing the Residence Time of Biomass in the Old-Age Forest across Climate Gradients. Forests 2018, 9, 148. https://doi.org/10.3390/f9030148
AMA Style
Han Y, Wang W, Zhang W, Zhang J, Shan D. Resolving Variables Influencing the Residence Time of Biomass in the Old-Age Forest across Climate Gradients. Forests. 2018; 9(3):148. https://doi.org/10.3390/f9030148
Chicago/Turabian StyleHan, Yangrui, Weifeng Wang, Weiyan Zhang, Jun Zhang, and Dandan Shan. 2018. "Resolving Variables Influencing the Residence Time of Biomass in the Old-Age Forest across Climate Gradients" Forests 9, no. 3: 148. https://doi.org/10.3390/f9030148
Note that from the first issue of 2016, this journal uses article numbers instead of page numbers. See further details here.