Seasonal Effects on Microbial Community Structure and Nitrogen Dynamics in Temperate Forest Soil


1
Graduate School of Agriculture, Kyoto University, Oiwake-cho, Kitashirakawa, Sakyo-ku, Kyoto 6068502, Japan
2
Research Core for Interdisciplinary Sciences, Okayama University, 3-1-1 Tsushimanaka, Okayama 7008530, Japan
3
Field Science Education and Research Center, Kyoto University, Oiwake-cho, Kitashirakawa, Sakyo-ku, Kyoto 6068502, Japan
*
Author to whom correspondence should be addressed.
Forests 2018, 9(3), 153; https://doi.org/10.3390/f9030153
Submission received: 25 January 2018
/
Revised: 8 March 2018
/
Accepted: 13 March 2018
/
Published: 19 March 2018
(This article belongs to the Special Issue Carbon, Nitrogen and Phosphorus Cycling in Forest Soils)
Abstract
:The soil microbial community and nitrogen (N) dynamics change seasonally due to several factors. The microbial community structure (MCS) can regulate N dynamics. However, there is insufficient information on seasonal changes in MCS and the relationship between MCS and N dynamics. We investigated MCS and N dynamics in forest soils with two different fertilities throughout a year. MCS, measured with phospholipid fatty acid (PLFA) analysis, showed a consistent seasonal trend, regardless of the fertility. Microbial indices (particularly the Saturated-/monounsaturated-PLFA ratio; Sat/mono) indicated a major PLFA shift among seasons, with temperature likely the most important factor. The fungal-/bacterial-PLFA ratio in the dormant season (December–April) was approximately 1.3 times greater than in the growing season (June–November). The trend in N dynamics showed that in summer (June–August), the gross N mineralization potential was greater than immobilization, whereas in winter (December–April), immobilization was dominant. The net mineralization potential in the growing season was approximately 1.6 times higher than in the dormant season. Moreover, a relationship was found between Sat/mono and N transformation potentials. We highlight the microbial sensitivity to seasonal dynamics which can be associated with temperature, as well as carbon and N dynamics.
1. Introduction
Soil microorganisms play a critical role in the nitrogen (N) dynamics of forest ecosystems, where N often limits primary production [1]. Microbial community structure (MCS) is associated with numerous ecosystem functions [2,3]. For example, fungal versus bacterial dominance can be determined through the C:N stoichiometry of biomass, as fungi are often reported to have a higher C:N ratio than bacteria [4], leading to differences in N usage efficiency during the decomposition of plant litter [5,6]. Also, various extracellular enzyme activities (e.g., labile or recalcitrant C degradation and N release) derived from the MCS can cause differences in the C and N mineralization rates [3,7].
One essential factor affecting MCS is seasonality. For instance, in soils at oak forest and grassland sites in a Mediterranean ecosystem, similar seasonal patterns were observed in soil MCS phospholipid fatty acid (PLFA) levels despite different MCS between two soils [8]. Moreover, in an altitudinal soil transplantation experiment using subalpine grassland soil, a clear shift in the soil MCS was observed between winter and summer, whereas transplanting soils to different altitudes did not affect MCS [9]. Such temporal changes in MCS are derived from a number of factors [10], such as soil moisture [11], tree species (e.g., spatial and temporal substrate inputs, such as leaf and root litter and root exudate [12]), and temperature [13,14].
Among seasonal N dynamics, the pools of water-extractable N species (dissolved organic N, ammonium, and nitrate) and the net ammonification and nitrification rates were higher during summer than during autumn or winter in a northern hardwood forest soil [15] and a temperate beech forest soil [16]. Microorganisms are the driver of these seasonal patterns. Thus, to understand the association between microorganisms and N dynamics, both of these factors must be observed in all seasons. In previous studies, seasonal associations between MCS (e.g., fungi and bacteria) and N dynamics were found in alpine ecosystems [17,18] and temperate forests [16,19]. For instance, Kaiser et al. [16] found that the summer was dominated by microbial N mineralization, measured as a high ammonification rate, whereas winter was the immobilization period, measured as a high N immobilization rate and a large amount of microbial N, likely due to fungal N immobilization in winter. These seasonal patterns are important for N retention in the ecosystem [16], particularly in alpine systems [17]. However, due to the scarcity of studies to date, it is important to confirm the seasonal patterns and associations between microorganisms and N dynamics in various ecosystems.
The aims of our study were to investigate (1) seasonal changes in MCS and N dynamics and (2) the relationships between MCS and N dynamics in a temperate natural forest soil and a nearby plantation forest soil (50-year-old stand). These forests can be represented as N-rich and N-poor systems, respectively, and the importance of N for microbes may differ between them. In N-poor systems, fungi are frequently found to be dominant over bacteria, and a low abundance of available N (e.g., ammonium and nitrate) is often observed [20]. In such a system, the dominant fungi, which have lower biomass turnover rates than bacteria [21], may maintain N in their biomass throughout the year, so no seasonal patterns are apparent. We examined seasonal variation in basic soil properties over the course of a year, including the N pool, microbial biomass, the MCS, and N transformation potentials (net and gross) at two depths, namely the organic layer (O-layer) and the top mineral soil layer (S-layer).
2. Materials and Methods
2.1. Study Sites and Seasonal Soil Sampling
Soil samples were collected in the Tanakami Mountains from a natural forest (NF, N 34°55′, E 135°58′, 510 m a.s.l., 0.10 ha) and a restored forest (RF, N 34°57′, E 135°59′, 250 m a.s.l., 0.68 ha) located in Shiga Prefecture, central Japan (Table 1). This area has a warm temperate climate influenced by the Asiatic monsoon. The mean annual temperature and precipitation were 14.9 °C and 1542 mm, respectively, at the Otsu observation point of the Japan Meteorological Agency (1981–2010, N 34°59′, E 135°54′, 86 m a.s.l., Figure S1), which is near the two sampling sites (middle slope). We expected that seasonal meteorological phenomena would be similar to each other because the locations were 5 km apart.
Land use history, vegetation, and properties of the organic layer and soil are provided in Table 1. The RF area was deforested approximately 1300 years ago due excessive timber harvest, and it remained denuded for a long period. Since the last century, hillside restoration and afforestation projects have been undertaken. In RF, vegetation cover is complete, but the soil nutrient content remains poor [22]. The bedrock is composed of granite at both sites. As both areas are located on steep slopes (20–30°), the soil depths are shallow relative to nearby flat areas. The two soil types differed, i.e., the soil in NF was a Cambisol, whereas the soil in RF was a Regosol due to soil erosion (removal of the A and B horizons) that occurred until recently.
A 20 × 20 m experimental plot was set up at each site. In each plot, five subplots (1.5 × 1.5 m) were established: one subplot was at the intersection of the plot diagonals, and four subplots were at 10 m intervals from the intersection of the diagonals. Seasonal sampling was conducted at each subplot six times a year. The organic layer (Oe+a: O-layer) and top mineral soil layer (0–10 cm: S-layer) were collected in each subplot. O- and S-layer samples were sieved through a 2- and 4-mm mesh, respectively, and visible roots were removed by hand. The samples were stored at 4 °C, except those for MCS analysis (−20 °C), until further processing.
2.2. Soil Chemical Characteristics
Water content (WC) was determined gravimetrically as water loss. Total C (TC) and N (TN) were measured with an NC analyzer (Sumigraph NC-22A, Sumika Chemical Analysis Service, Ltd., Osaka, Japan) after drying and grinding. Soil pH was measured in water (fresh sample: water, 1:2.5 (w/v)). The N pool and water-extractable organic carbon (WEOC) were extracted with 2 M KCl (fresh soil layer: solution, 1:10 (w/v) or fresh O-layer: solution, 3:50 (w/v)). The extracts were frozen at −20 °C until further analysis. Water-extractable total N (WETN) and WEOC were measured using a TOC/TN analyzer (TOC-L CPH/CPN, Shimadzu, Kyoto, Japan). Ammonium-N (NH4+-N) and nitrate-N (NO3−-N) were also determined using a colorimetric method with a flow injection analyzer (AutoAnalyzer, BL-Tech, Tokyo, Japan). Water-extractable organic N (WEON) was calculated as the difference between WETN and inorganic N (NH4+-N + NO3−-N).
2.3. Microbial Biomass (MB)
MB-C and -N were measured through a fumigation–extraction procedure [24]. Briefly, subsamples were fumigated with chloroform for 24 h at 25 °C, and then extracted in 0.5 M K2SO4 (sample: solution, 1:5 (w/v)) along with non-fumigated subsamples. WEOC and WETN of the extracts were measured with a TOC/TN analyzer. MB-C and -N were estimated as the difference in C or N content of extracts from fumigated and non-fumigated subsamples. An extraction coefficient of 0.45 was used for calculating MB-C [25] and N [26].
2.4. Microbial Community Structure (MCS)
In order to assess MCS, the phospholipid fatty acid (PLFA) content of soils was measured [27,28]. Lipids were extracted from freeze-dried samples with an extraction solvent (chloroform: methanol: 0.15 M citric acid buffer, 1:2:0.8, v/v/v) and separated into neutral lipids, glycolipids, and phospholipids on a silica acid column. Subsequently, the phospholipids were subjected to mild alkaline methanolysis. Methyl nonadecanoate (19:0) was added as an internal standard. The samples were analyzed using a gas chromatograph equipped with a flame ionization detector (GC-2014, Shimadzu, Kyoto, Japan). Each sample was injected onto a column (DB-5, 30-m length, 0.25-mm i.d., film thickness 0.25 mm; Agilent J & W Scientific, Santa Clara, CA, USA). Peaks were identified by a comparison of retention times with commercial standards (BAMEs, Supelco Bacterial Acid Methyl Esters CP Mix #47080-U, Sigma–Aldrich, Bellefonte, PA, USA). The abundance of individual PLFA markers was determined by comparison to internal standard peak areas in µmol PLFA kg−1. Fatty acid nomenclature was determined following Frostegård et al. [27]. The sum of BAME markers excluding 19:0 was calculated as the abundance of total PLFA. The abundance of each PLFA marker was also determined as mol % relative to the total PLFA abundance. To characterize MCS, we used specific microbial indices closely associated with N dynamics, substrate quality, and temperature (Table 2). The ratios of saturated to monounsaturated PLFAs (Sat/mono) and cyclopropyl to precursors (Cy/pre) were probably associated with the change in MCS and physiological stress or starvation, which cannot be separated [29,30]. Gram-positive and -negative bacteria are important bacteria groups for C and N cycling [31], although their PLFA markers do not coincide completely [29,30]. We used 18:2ω6,9 as fungal-PLFA and the sum of i15:0, a15:0, 15:0, i16:0, i17:0, cy17:0, 17:0, 18:1ω7, and cy19:0 as bacterial-PLFA [27,28].
2.5. Gross N Transformation Potential
The gross N transformation potential was estimated using the 15N isotopic dilution method [42]. Briefly, after the addition of 15NH4+ or 15NO3− solution, each subsample was incubated for 2 h or 26 h at 25 °C, and then NH4+-N and NO3−-N were extracted and their concentrations measured in the solution, as described above. The 15N atom% of NH4+ and NO3− were also measured in the solutions via the denitrifier method [43] using gas chromatography with a mass spectrometer (GCMS-QP2010 Plus, Shimadzu, Kyoto, Japan) after the conversion of NH4+ into NO3− and finally N2O. The gross N (NH4+-N and NO3−-N) production and consumption potentials were calculated according to Davidson et al. [44] and Kuroiwa et al. [42]. NH4+-N immobilization was calculated as the difference between NH4+-N consumption and NO3−-N production, and NO3−-N consumption was represented as NO3−-N immobilization. Also, the specific potentials for gross NH4+-N production and immobilization [45] were defined per unit of MB-N for estimating microbial N processes.
2.6. Net N Transformation Potential
The net transformation potential was estimated with a four-week incubation procedure at 25 °C. First, the samples were incubated in plastic bottles sealed with Parafilm. The initial moisture level was maintained by adding water weekly. After four weeks, the N pool, i.e., NH4+-N, NO3−-N, WEON, and WETN, was analyzed as described above. The net transformation potential was calculated as the difference in the N content of extract between the initial and incubated samples. Rates were expressed in units per day, and the specific potential of net (NH4+-N + NO3−-N) transformation was defined per unit of MB-N for an estimation of microbial N processes.
2.7. Statistical Analyses
All variables measured in each seasonal sampling are expressed as the mean (n = 5 subplots) and standard error (SE). The effect of sampling date on each variable was assessed by a mixed model using a restricted maximum likelihood (REML) estimate for each site and for each depth. The fixed factor was sampling date, while subplot was added as a random factor. Subsequently, if a significant seasonal effect (p < 0.05) was found, pairwise comparisons were further analyzed with Tukey’s honestly significant differences (HSD) test (p < 0.05). Furthermore, the effects of sampling date, sites, and their interactions were assessed by a mixed model using an REML estimate. Fixed factors were sampling date, site, and their interactions, while subplot was added as a random factor. Additionally, the annual mean (n = 30) and SE at both sites are represented for several variables.
To elucidate the seasonal pattern of MCS, principal component analysis (PCA) was performed for PLFA markers (relative abundance; mol %). The mean (n = 5) of each PLFA marker during each season was used. To clarify the seasonal pattern, PLFA markers that were not detected in a season were removed from PCA. Indices of the PC2 (Figure S4) of each site generally reflected the seasonal pattern of MCS. Thus, PC2 scores were adopted for the following statistical analyses as a proxy for seasonal shifts in MCS.
To identify relationships between MCS and variables, Pearson’s correlation analysis was performed. Meteorological data were obtained from the Automated Meteorological Data Acquisition System (AMeDAS) [46] Otsu observation station. Temperature, precipitation, and sunshine data used in this analysis were averaged to mean daily values for the 7, 14, 21, or 28 days before the sampling date. These meteorological parameters may directly or indirectly affect MCS and N dynamics.
The effects of microbial indices and several other variables on N transformation potential were analyzed using partial least-square (PLS) regression analysis. PLS regression is used for an estimation of the regression model between one dependent variable and several explanatory variables. PLS regression is similar to multivariate analysis, but it can utilize data with correlated explanatory variables [47,48]. The variable importance of projection (VIP), which indicates the relative importance of each explanatory variable, and standardized coefficients were calculated for each dependent variable. VIP values above 1 represent a significant result [47]. For explanatory variables, we used meteorological phenomena (temperature, precipitation, and sunshine), soil characteristics (WC and pH (H2O)), substrate availability (WEON and WEOC/WEON), microbial biomass (MB-N, MB-C/N, fungal-PLFA, and bacteria-PLFA), PC2 scores (shown in Figure S4), and the microbial biomarker indices (Sat/mono, Cy/pre, G+/G−, and F/B).
All analyses were conducted using XLSTAT 2017 (Addinsoft, Paris, France). The significance level was set to α = 0.05.
3. Results
3.1. Basic Soil Characteristics
The WC exhibited significant temporal changes, especially in the O-layer (Table S1). Overall, WC was higher in the cool season than in the warm season. Seasonal changes in pH (H2O) were noted, especially in the O-layer, but an interaction (site × season) effect was also found.
3.2. N Pool
Seasonal changes in the N pool were significant, especially changes in NF (Figure S2). NH4+-N concentrations in the warm season were greater than those in the cool season. NO3−-N seasonal changes were only significant in NF (O-layer), whereas seasonal changes in WEON were only significant in NF. The inorganic N-to-WEON ratio can be represented as the available N composition index, which had greater values in the warm season than in the cool season.
The NH4+-N in both layers was significantly lower in RF than in NF. Similarly, NO3−-N also tended to be lower in both layers in RF than in NF. Meanwhile, although WEON in the S-layer was significantly lower in RF than in NF, WEON in the O-layer was not significantly different between sites.
3.3. Microbial Biomass (MB) and Fungal and Bacterial PLFA
MB-C and -N significantly changed over time only in NF (Figure S3). In the O-layer, MB-C and -N were higher in February than at other times. MB-C/N significantly changed over time only in RF, while in a comparison between sites, MB-C/N was higher in the O-layer in RF than in NF.
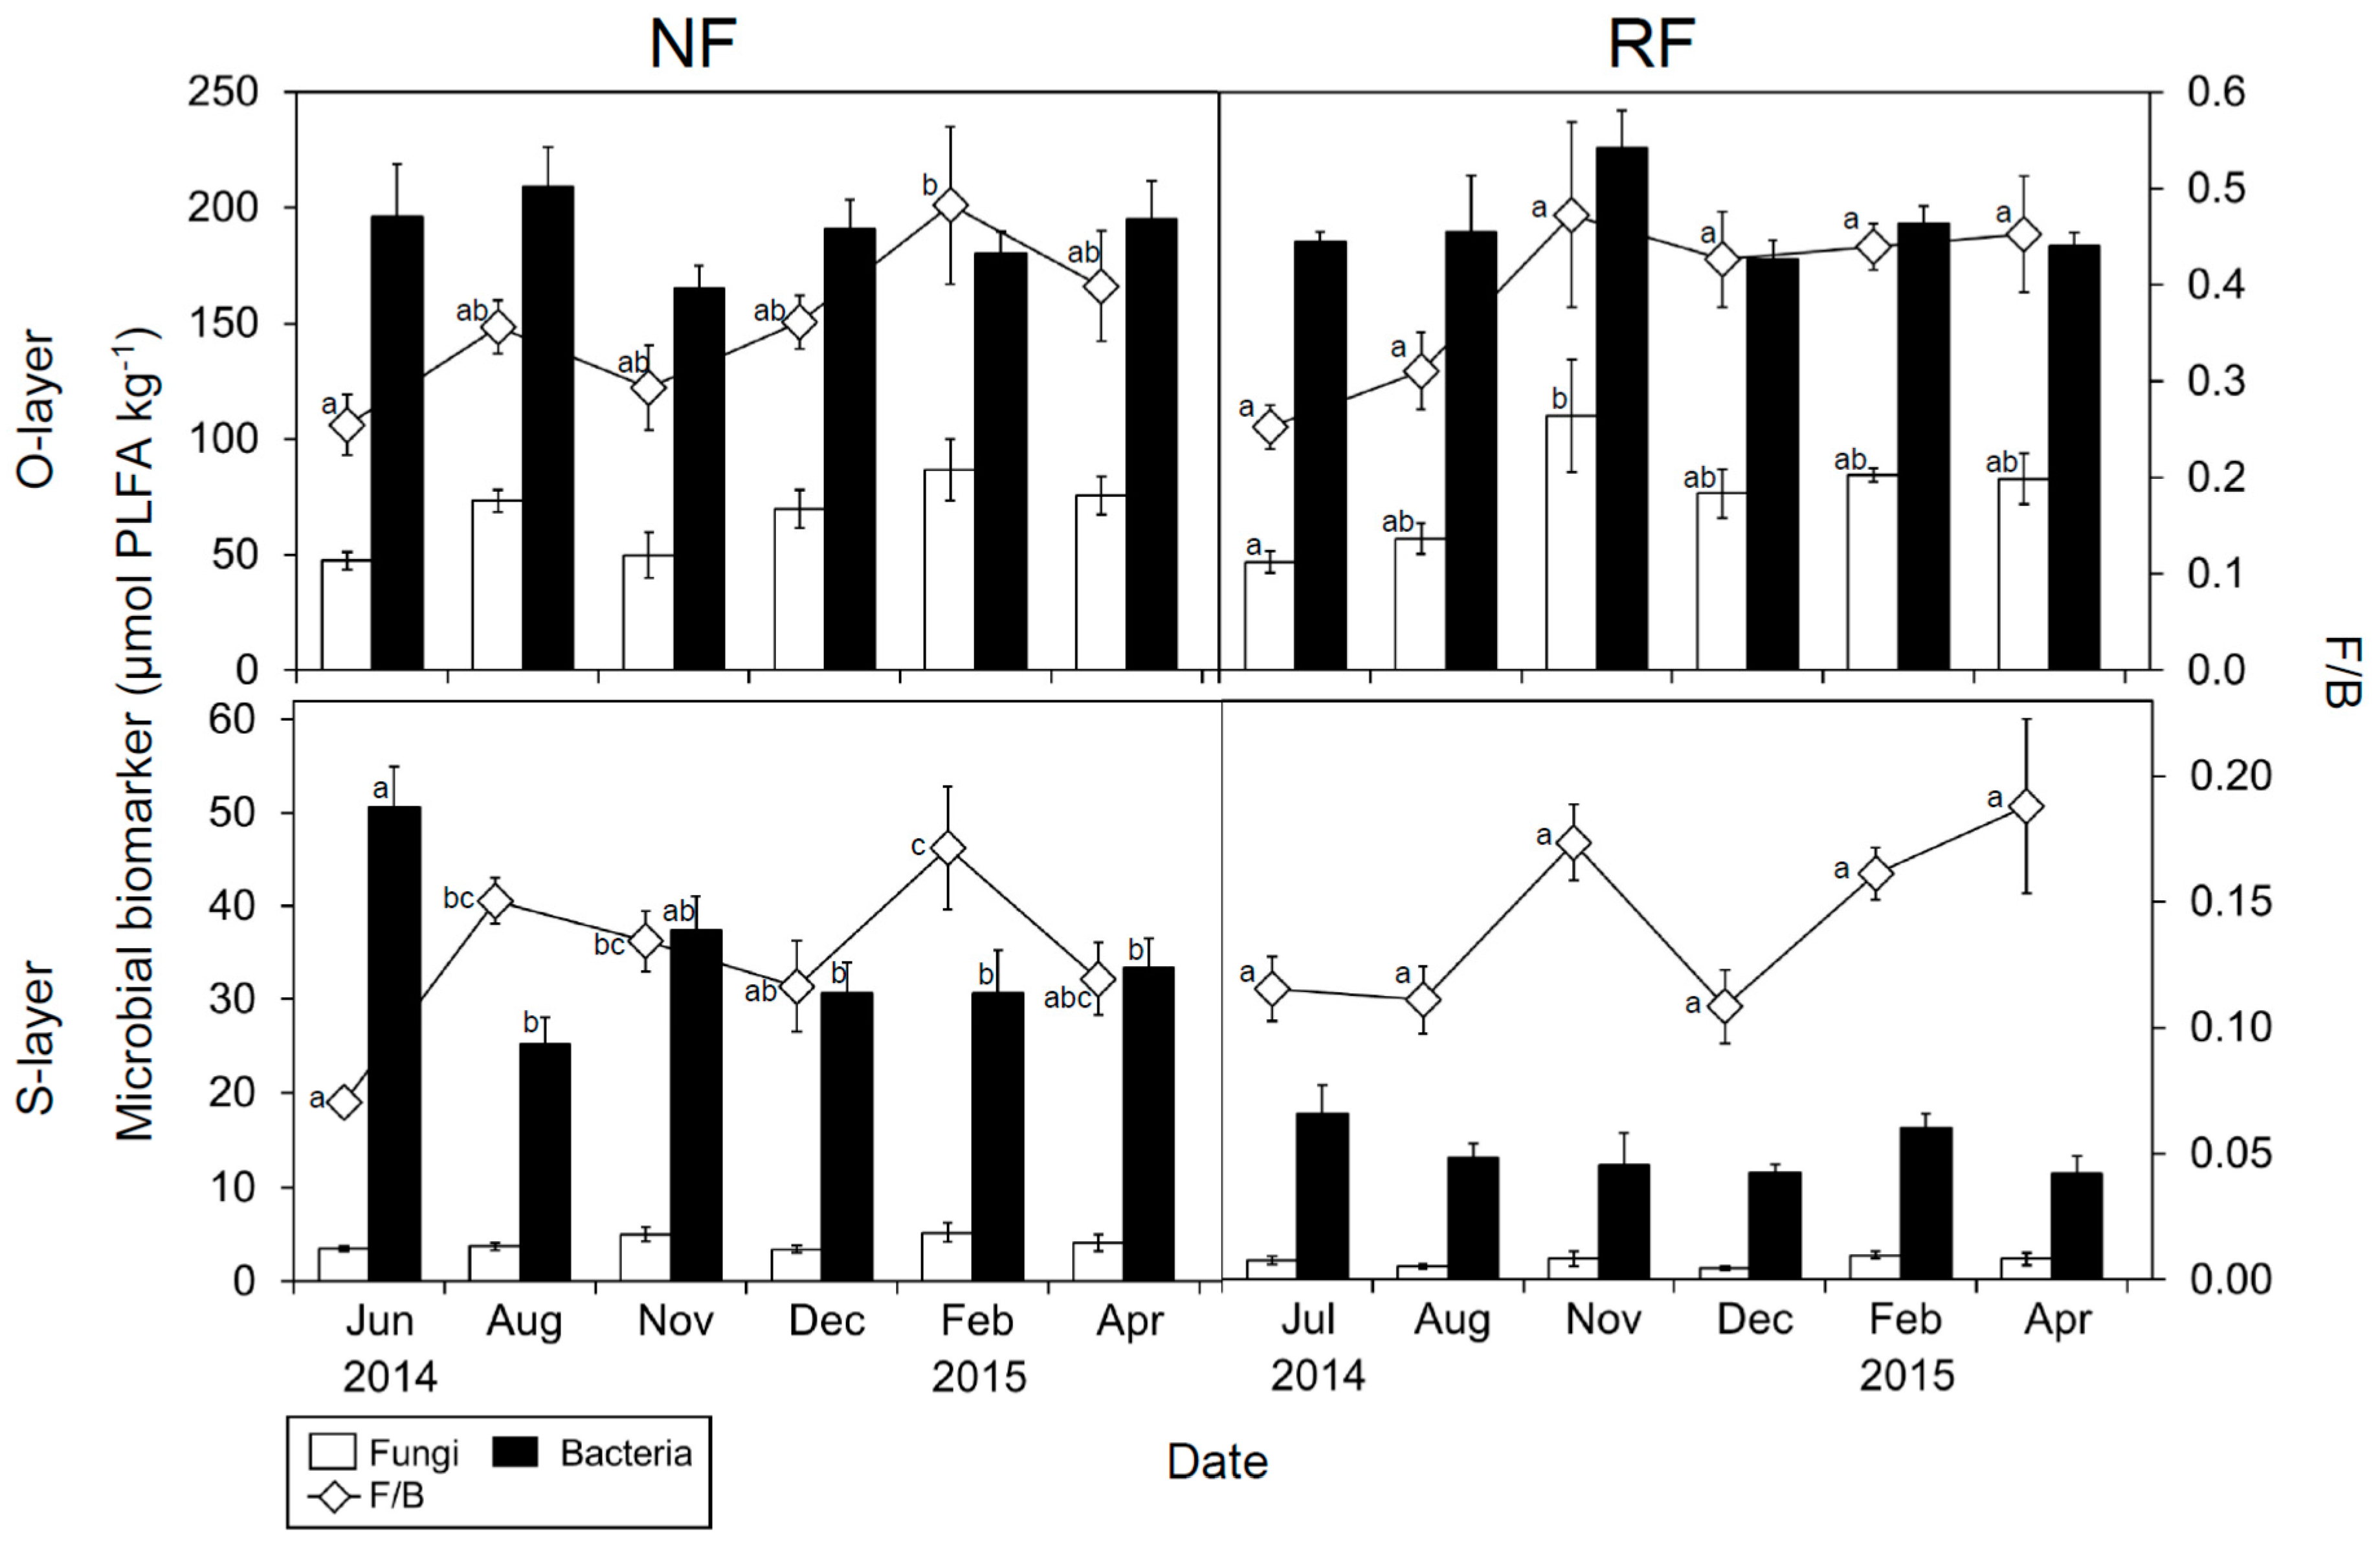
Bacterial PLFA had significant temporal changes in the S-layer in NF (Figure 1). The seasonal trend was similar to MB-C (and weakly similar to MB-N) only in the S-layer. Fungal PLFA significantly changed in the O-layer in RF. Overall, fungal PLFA in the cool season was higher than that in the warm season.
3.4. Microbial Community Structure (MCS)
PCAs of the PLFA data at each site showed changes in MCS, not only between depths, but also among seasons (Figure S4). PC1 explained 58.0% and 49.8% of the total variance in NF and RF soils, respectively, clearly separating the O-layer and S-layer. Meanwhile, PC2 for NF and RF explained 22.7% and 24.3%, respectively, generally splitting the sampling dates.
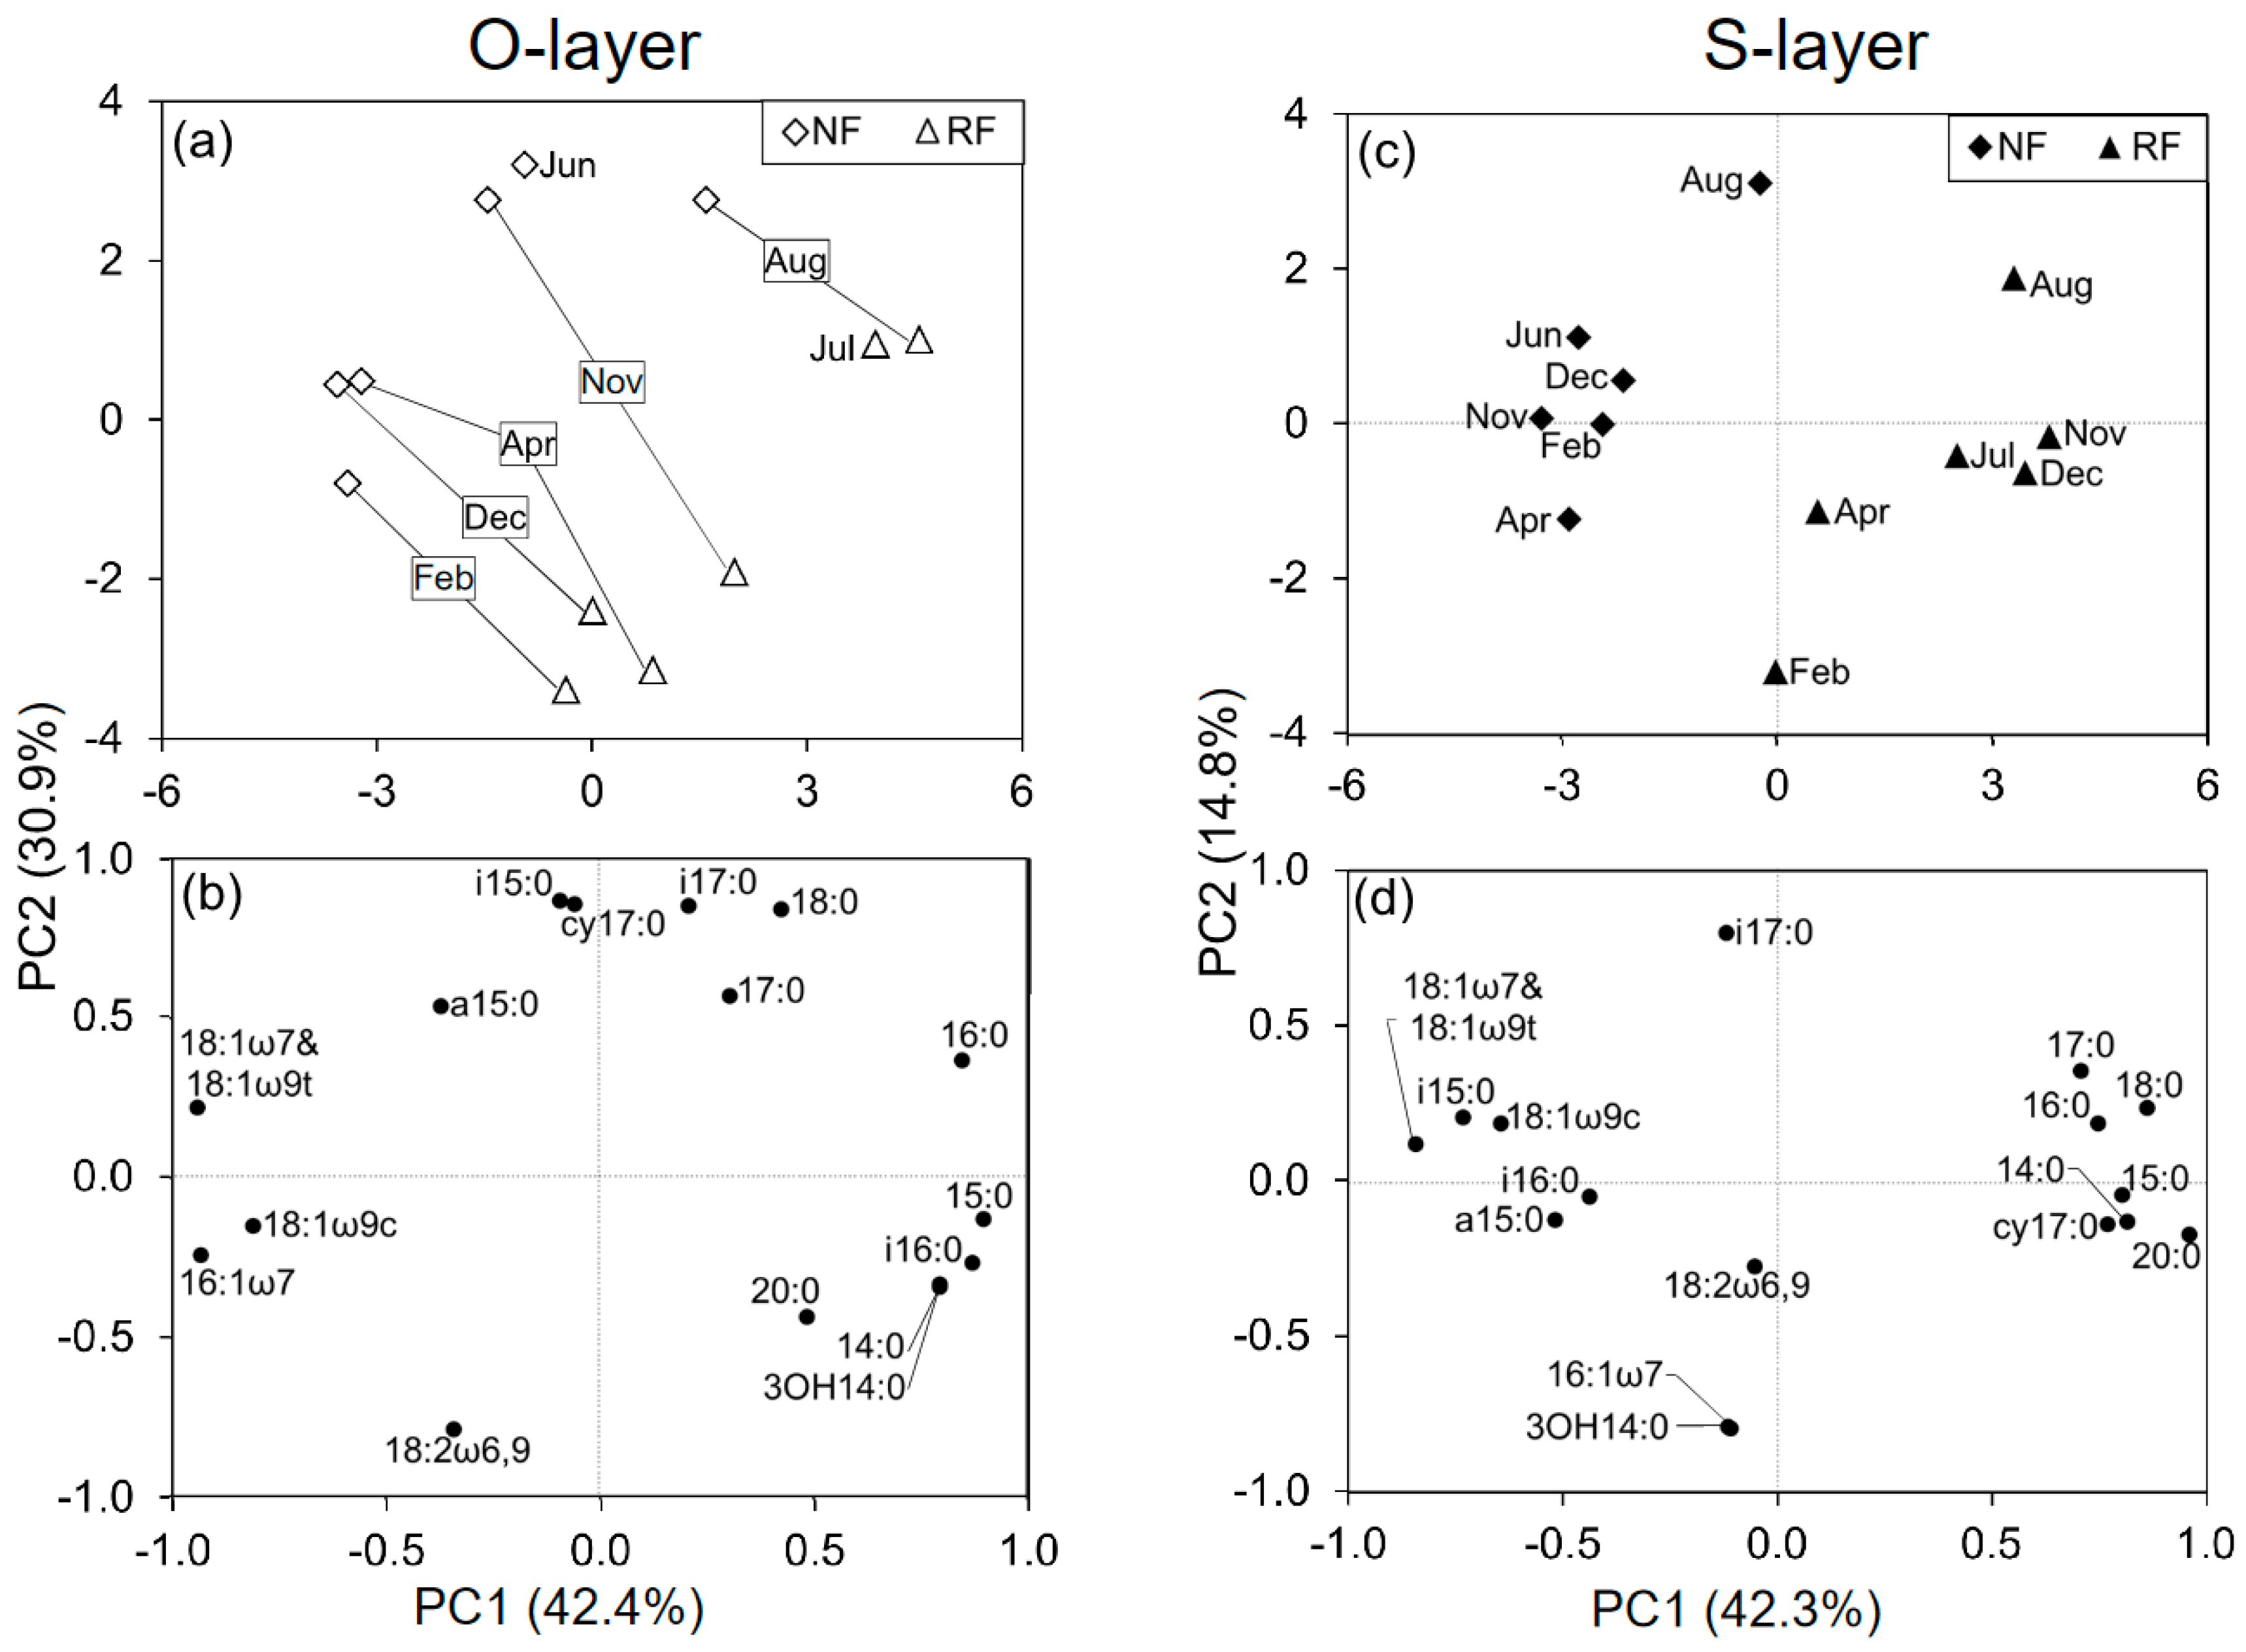
In a comparison between NF and RF among seasons, the PCAs at each depth revealed changes in MCS related to both site and season (Figure 2). PC1 in the O- and S-layer explained 42.4% and 42.3%, respectively, while PC2 in NF and RF explained 30.9% and 14.8%, respectively. These PCs did not closely reflect either site or season.
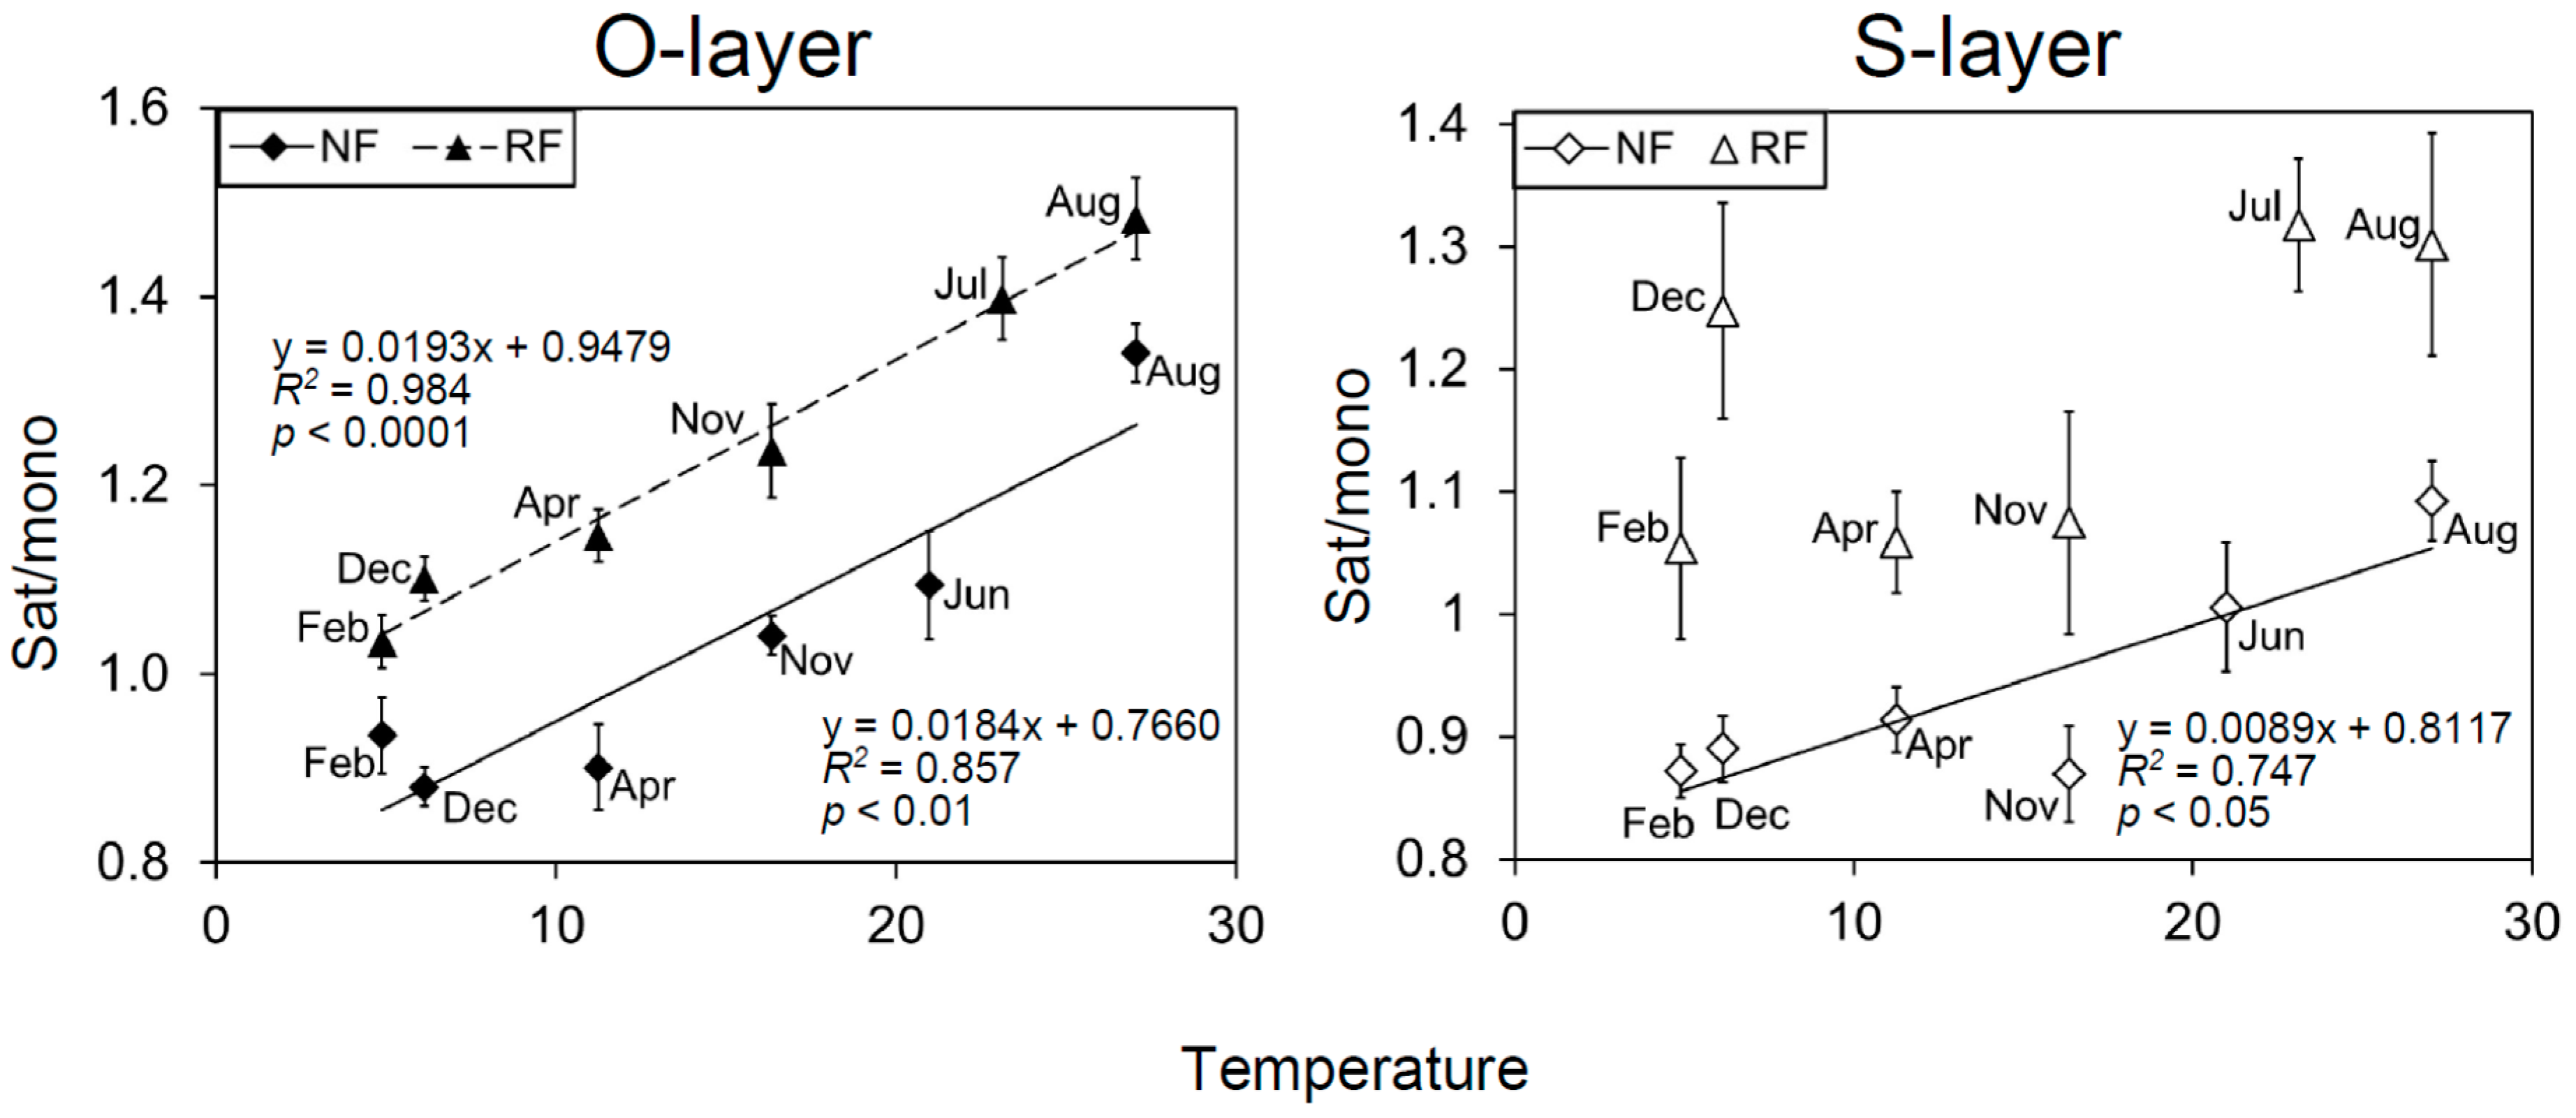
The loading scores of some PLFAs for all PCAs (PC1 and 2) were mostly or partly characterized by seasonal shifts (Figure 2 and Figure S4). To identify which PLFAs were associated with seasonal changes, we assessed seasonal changes in microbial indices (Figure 1 and Figure S5). There were significant temporal changes in all microbial indices. G+/G−, Sat/mono, and Cy/pre were greater in June, July, and August than in December, February, and April. Additionally, the three microbial indices were generally significantly correlated with PC2, as shown in Figure S4, and were also correlated with temperature, especially in the O-layer (Table S2 and Figure 3). In contrast, F/B values were greater in February than in June or July (Figure 1). Comparing NF and RF, Sat/mono was significantly greater at both depths in RF than in NF, but there were no significant differences in the other indices between sites.
3.5. N Transformation Potential
3.5.1. Gross N Transformation Potential
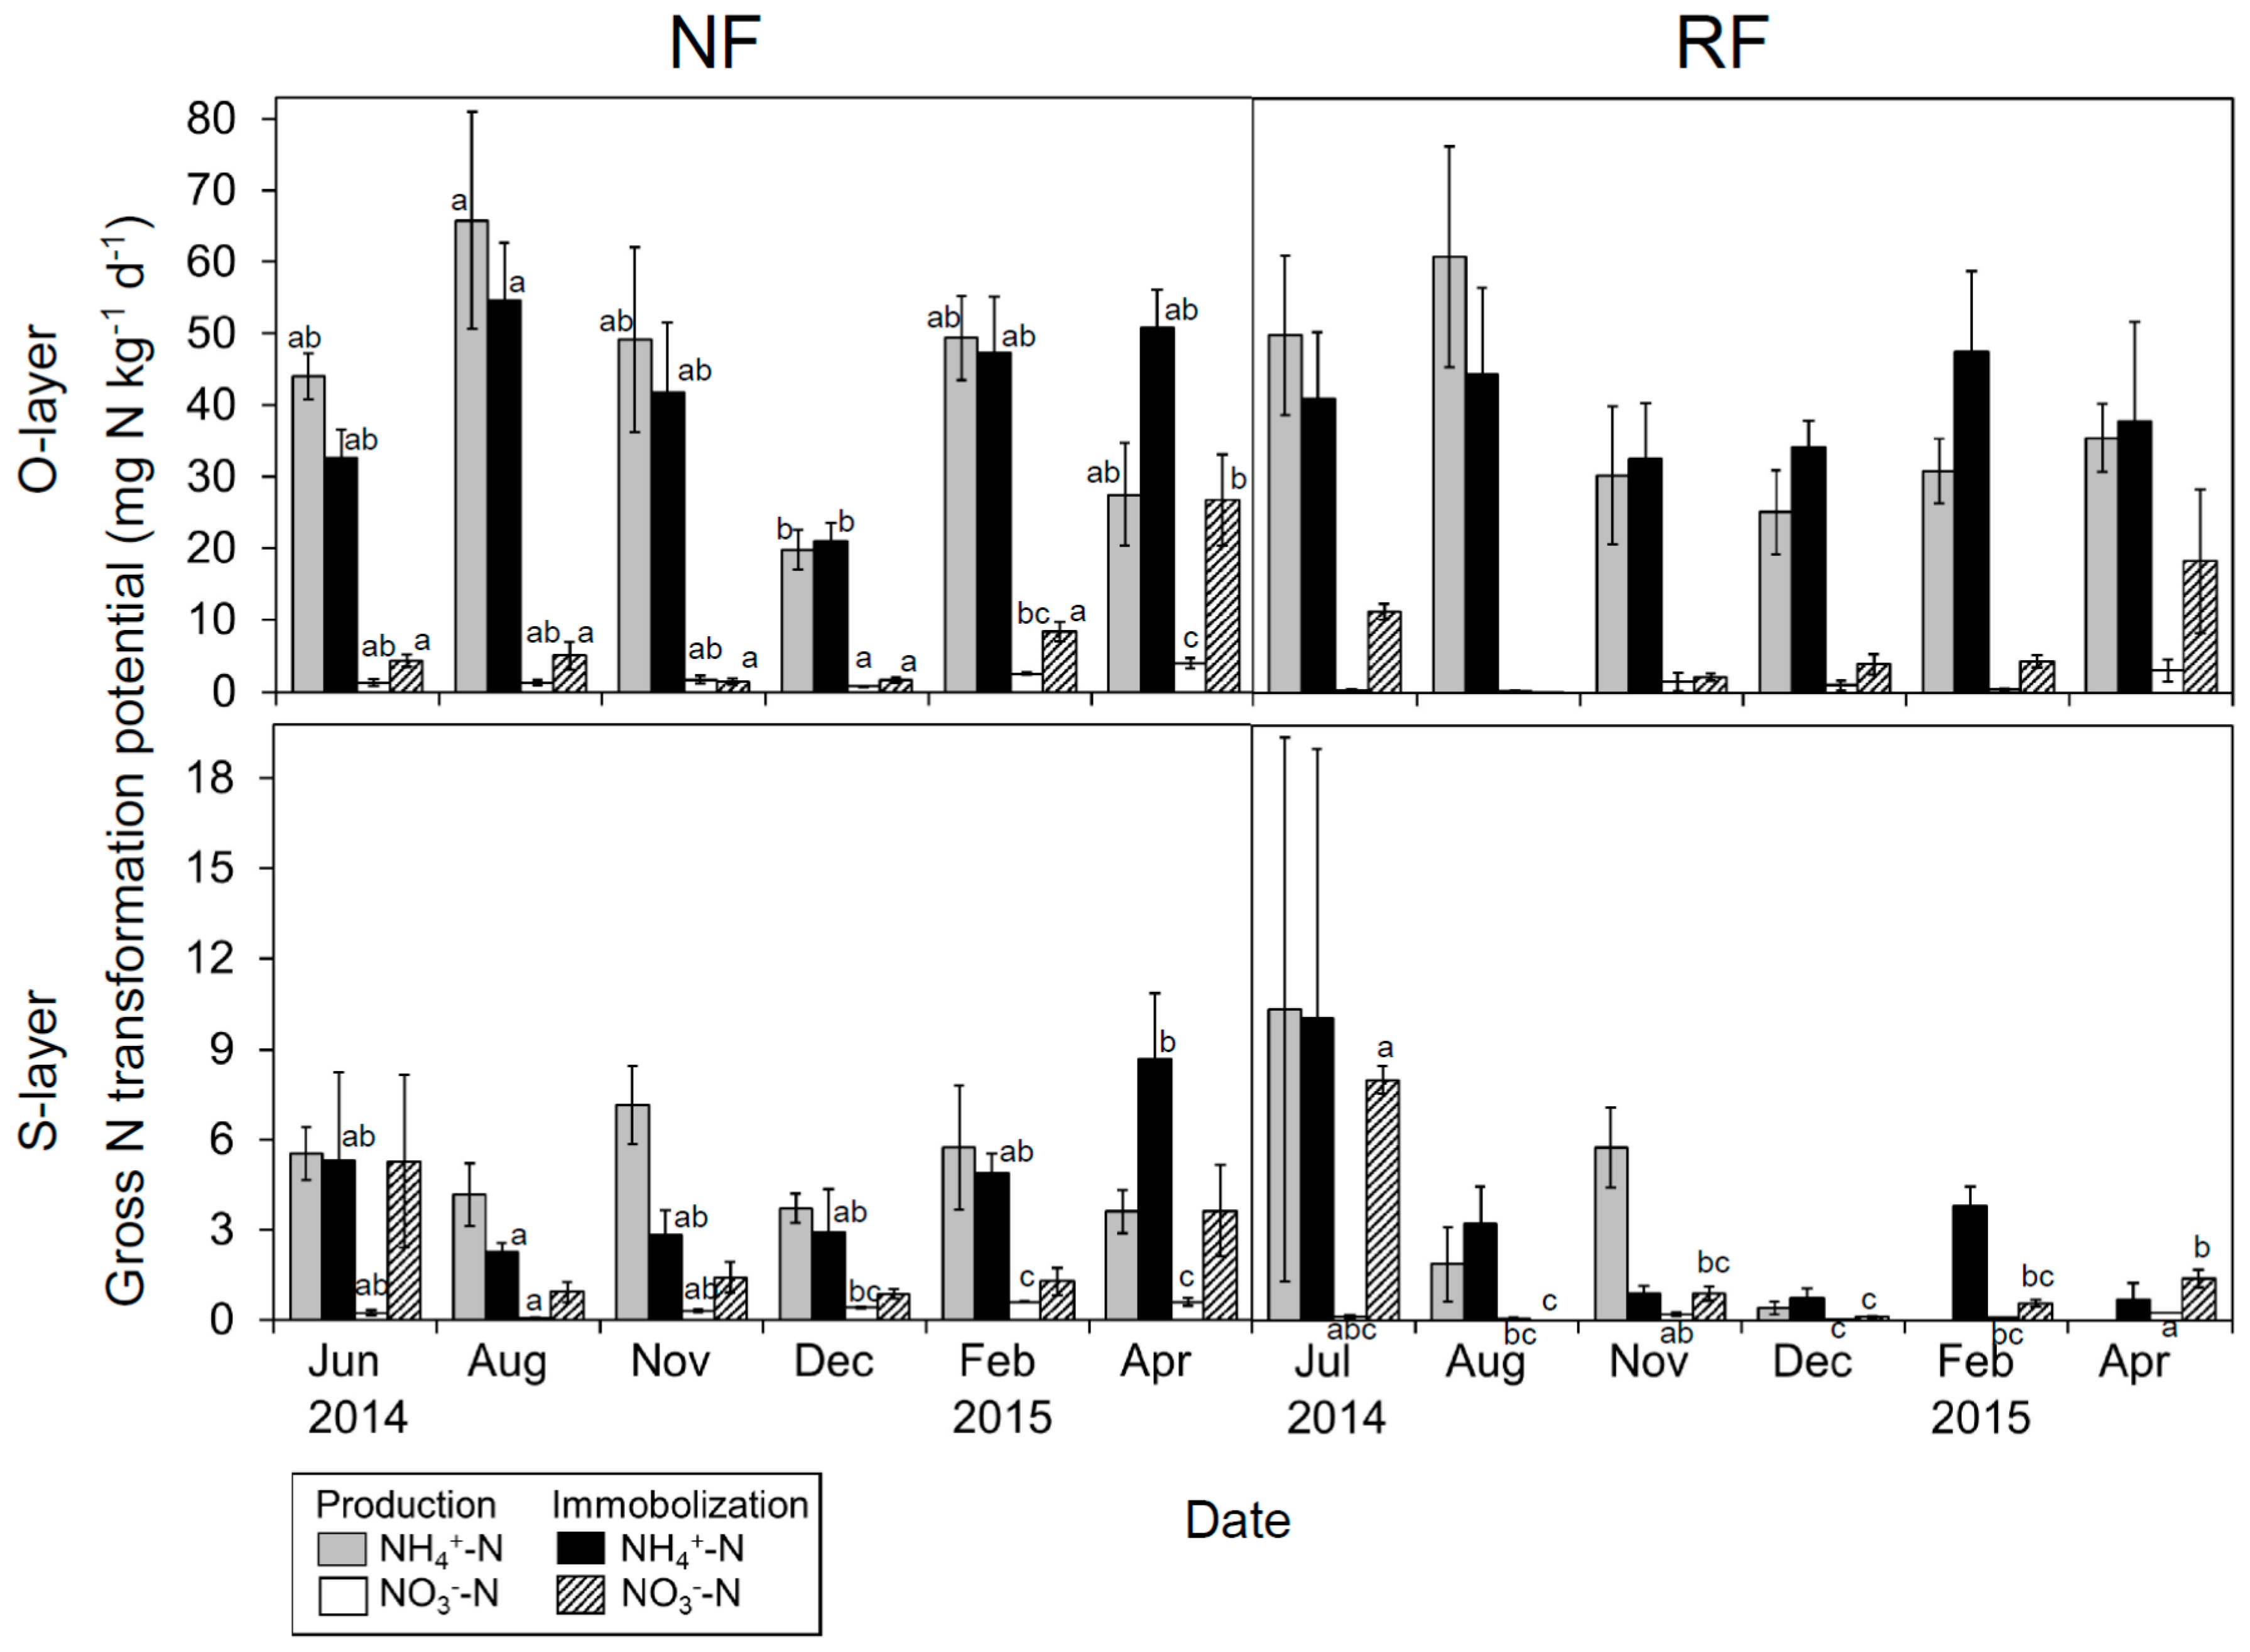
Seasonal changes in gross NH4+-N production and immobilization potential (25 °C) were observed in the O-layer in NF (Figure 4), with the highest values in August. Meanwhile, seasonal changes in the S-layer were less apparent at both sites. As a mean of six measuring seasons, N production potential was approximately equal to immobilization potential, but production potential tended to be greater in the warm than in the cool season.
Seasonal changes in gross NO3−-N production potential were observed in the O-layer in NF. Production potential was higher in April than in other seasons, whereas the immobilization potential was highest in April and June (or July). Immobilization potential tended to be much higher than production potential.
Gross NH4+-N production and immobilization potential at both depths exhibited no significant differences between sites. Gross NO3−-N immobilization potential at both depths also did not differ significantly between sites, whereas gross NO3−-N production potential in the S-layer was significantly lower in RF than in NF.
3.5.2. Net N Transformation Potential
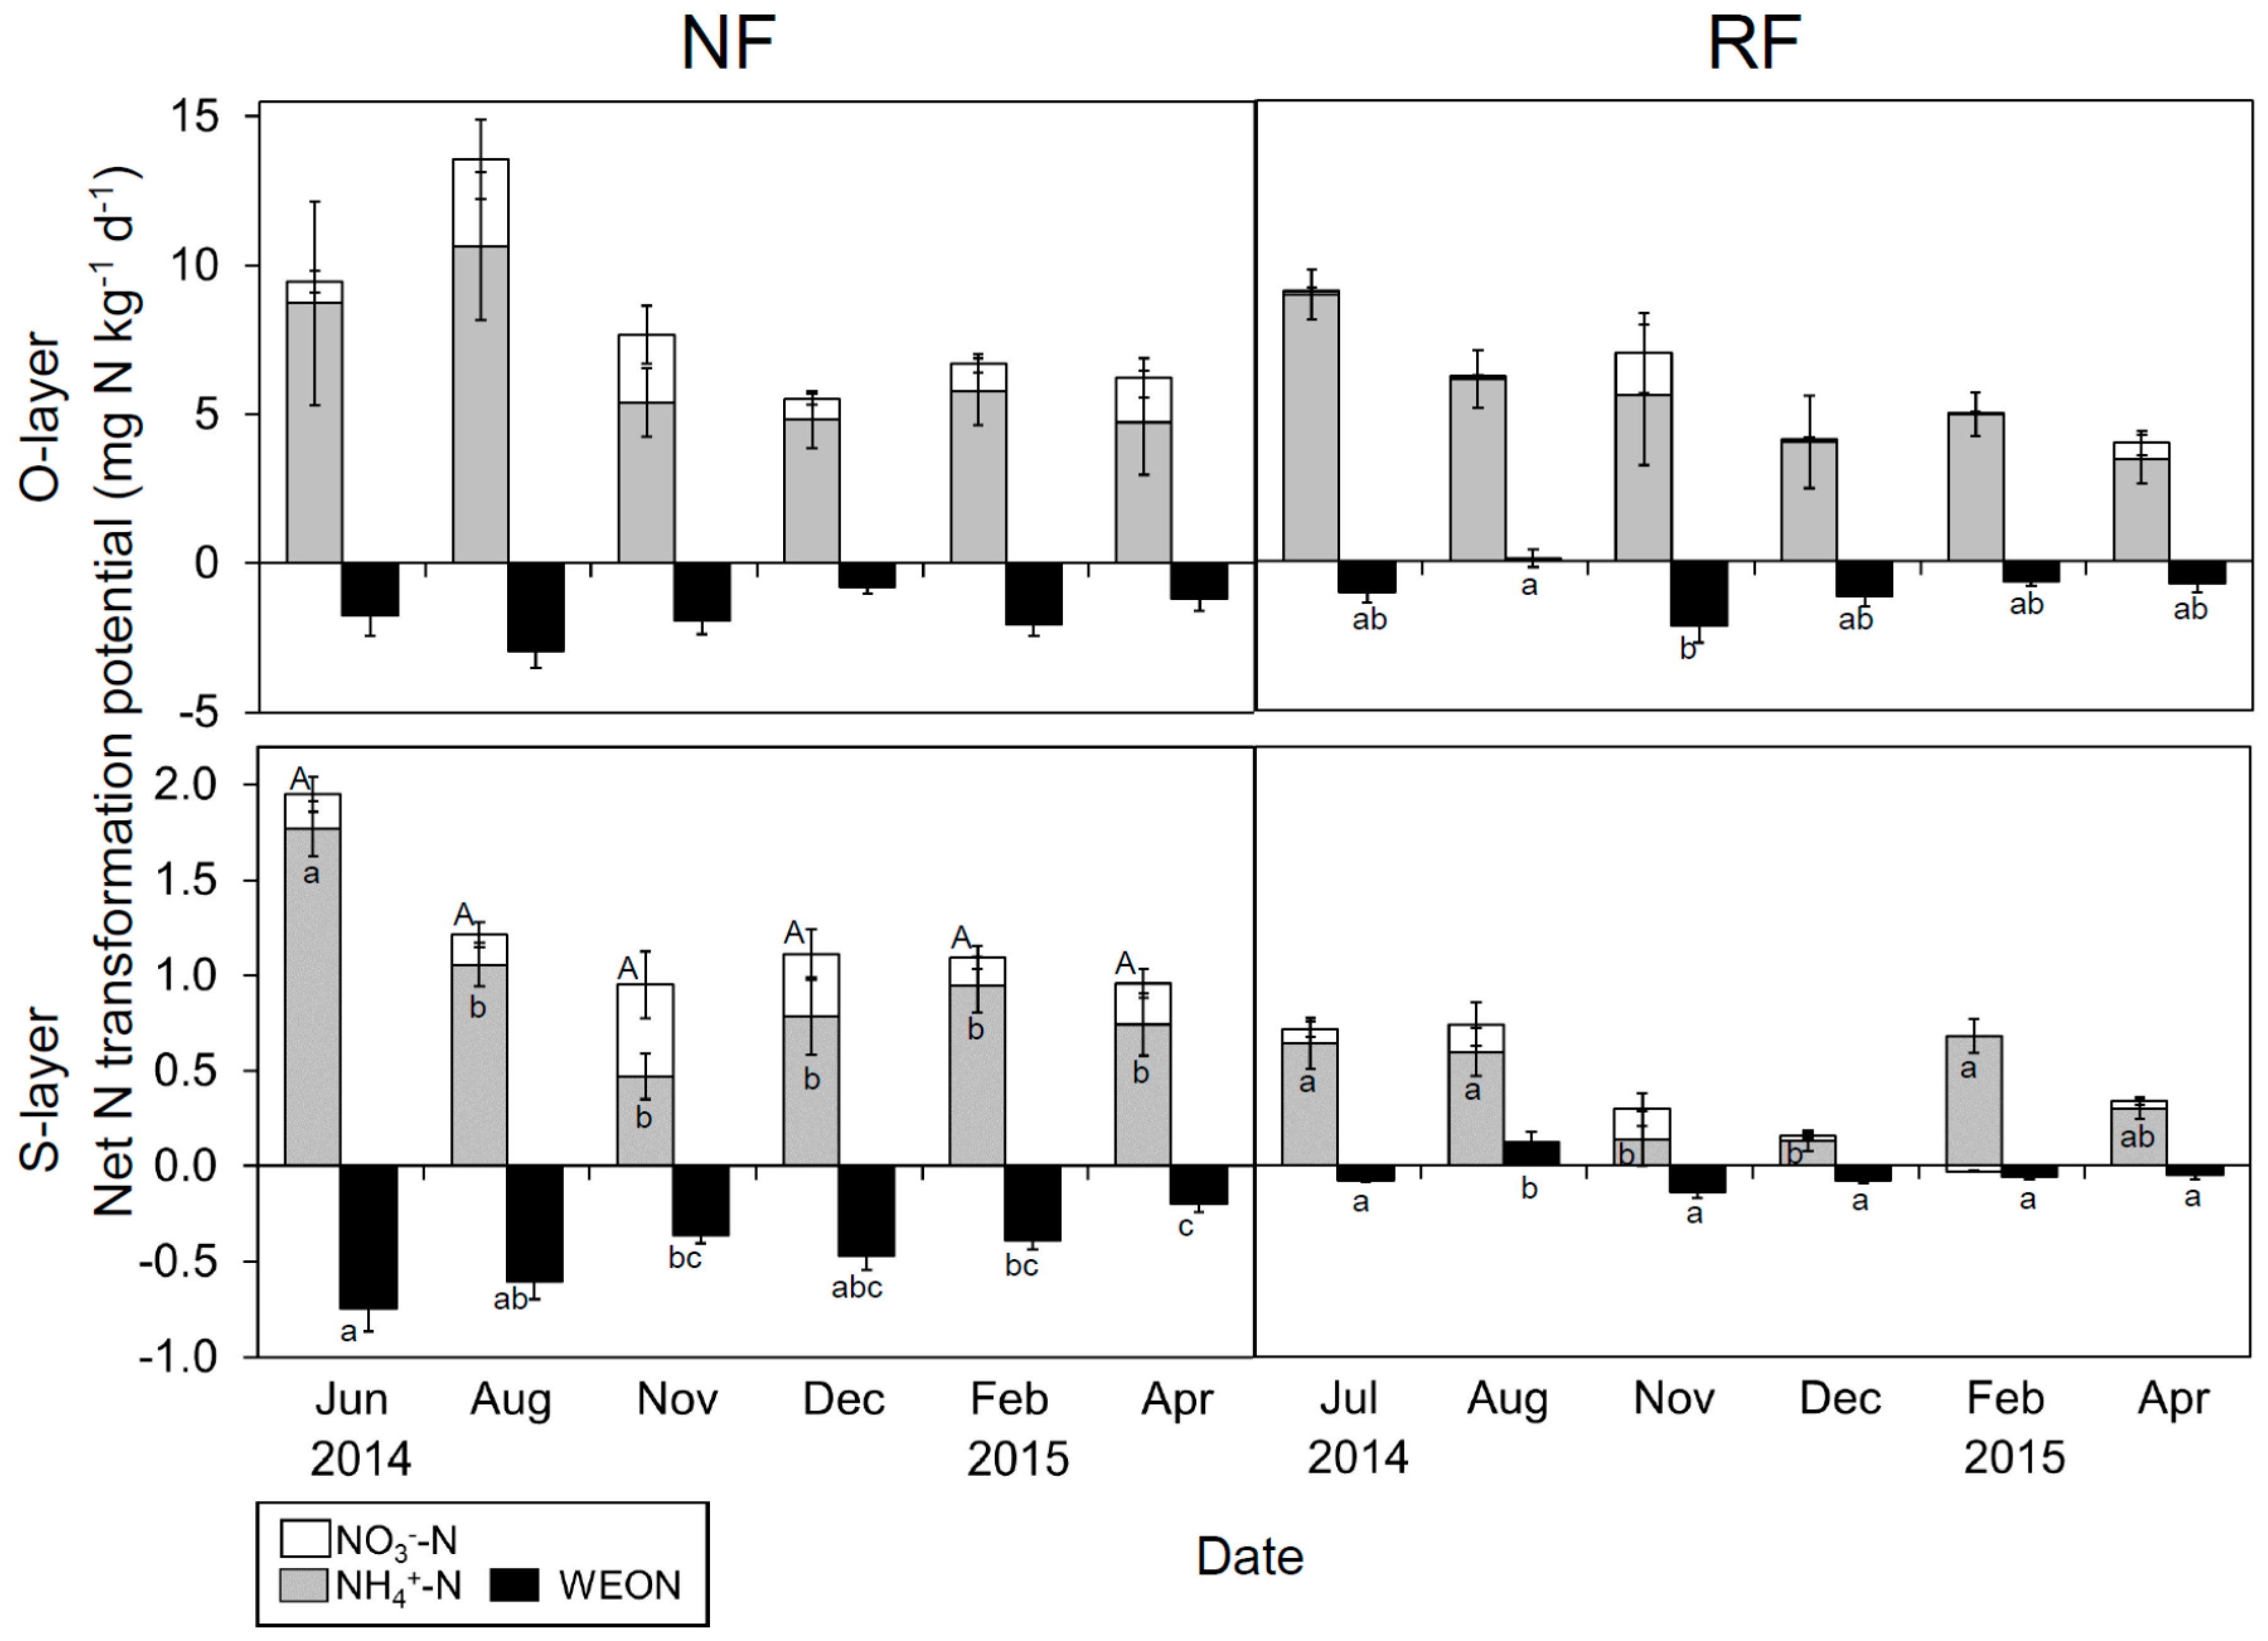
Seasonal changes in net N transformation potential (25 °C) were clear in the S-layer, but not in the O-layer (Figure 5). Overall, the potential for inorganic N transformation was greater in the warm than in the cool season.
The net NH4+-N transformation potential in the O-layer did not differ significantly between sites, whereas that in the S-layer was significantly lower in RF than in NF. The net NO3−-N transformation potential in the O-layer was significantly lower in RF than in NF, whereas that in the S-layer did not show a significant difference between sites. The net WEON transformation potential in both layers was significantly greater in RF than in NF.
3.6. Relationship between N Dynamics and Multi-Variables
In analyzing the seasonal changes in inorganic N, the most important variables from the PLS regression model were temperature, soil environment, substrate availability, and MCS (Table S3). For seasonal changes in gross NH4+-N production potential, the major variables from the PLS regression model were temperature, WEON, MB-N bacterial-PLFA, and MCS (Table S4). For the seasonal changes in gross NH4+-N immobilization potential, the primary variables from the PLS regression model were WC, substrate availability, and MB-N (Table S5). For seasonal changes in net inorganic N production potential, the major variables from the PLS regression model were temperature, bacterial-PLFA, and MCS (Table S6). In particular, seasonal changes in the specific gross NH4+-N and net inorganic N production potential were strongly correlated with Sat/mono (Figure S6).
4. Discussion
4.1. Seasonal Changes in Microbial Community Structure (MCS)
In this study, differences in MCS, as represented by PCAs, were identified between soil depths (Figure S4) and between sites (Figure 2). The difference in the microbial index Sat/mono between sites agreed with McKinley et al. [49] and Bach et al. [50] across ecosystems of differing restoration histories, indicating a relationship between MCS and the amount of organic matter accumulation (total C and N) or nutrient status, e.g., C/N (Table 1; McKinley et al. [49]). Moreover, the difference in F/B between soil depths coincided with the findings of Joergensen and Wichern [51], largely reflecting C/N.
Many field studies have illustrated seasonal shifts in MCS through PLFA patterns [9,52], bacterial communities [53], and fungal communities [54]. The essential factor driving this shift is likely plant C inputs, i.e., leaf and root litter and root exudate [7,12]. First, fresh leaf litter is available mainly in autumn, when it likely changes MCS, e.g., bacterial [55] and fungal communities [54]. In addition, root litter may affect MCS; root exudate is present mainly in summer, when it is essential for specific microbes, such as mycorrhizal fungi [56,57,58,59]. Although the relative importance of litter and root exudate for microorganisms is unclear, it is clear that plant C inputs can alter MCS [55,60]. In this study, trends toward lower G+/G− and Sat/mono in winter were identified (Figure S5), and the higher WEOC/WEON in winter seemed to be associated with the large amount of plant litter input in autumn. The responses of the MCS agree with previous studies based on substrate-amended experiments [32,39]. The seasonal C input probably affected MCS at both sites.
Another pivotal driver is likely temperature [61,62,63]. Our data showed a correlation between MCS and temperature among seasons. These correlations were found regardless of the N fertility. Specifically, the PLFA indices G+/G−, Sat/mono, and Cy/pre were correlated with temperature, consistent with previous microcosm experiments [37]. Dominant G+ compared with G− at high temperatures may be associated with G+ use of relatively recalcitrant soil organic matter (SOM), while dormant G− are found at low temperatures and use labile SOM [31,62,64]. Associations between temperature and Sat/mono have been frequently reported from in vitro [65,66] and microcosm experiments [37], but the association between temperature and Sat/mono has been reported less often in field studies. The shift in Sat/mono is generally considered to maintain microbial membrane fluidity against temperature change [29]. These findings show the importance of temperature for natural microbial communities.
4.2. Seasonal Changes in N Dynamics
Despite the differing N fertility among sites, represented in the variation between WEOC/WEON and MB-C/N (Figure S3), similar seasonal N dynamics were observed. Overall, the gross N mineralization potential tended to be higher than immobilization potential in June–August, while in December–April, immobilization potential was dominant, in agreement with previous studies [16,67]. The net WEON transformation potential tended to be negatively correlated with the net inorganic N transformation potential, especially in NF, suggesting that WEON is important as a source of N mineralization [68]. Also, the potential value was almost negative among seasons, probably due to the disappearance of dissolved organic matter input (e.g., root exudate and compounds from plant litter) in incubation soil.
Contributions to seasonal N dynamics are made by abiotic (e.g., meteorological phenomena and soil environment [15]) and biotic factors (e.g., MB-N [15,16]). Among abiotic factors, temperature seems to be important for the seasonality of N mineralization (Tables S3–S6), although this study did not allow for the precise control of temperature during experiments (i.e., N transformation potential). Precipitation was not a significant determinant of seasonal changes in N dynamics in this study, but it may be critical to short-term or interannual variability [15,69]. In general, precipitation had a less consistent seasonal pattern than temperature (e.g., Figure S1), and thus its effect may be ambiguous. This ambiguity is further confounded by sunshine, which is associated with plant allocation of C to soil [70]. Among biotic factors, the principal direct driver is microbes, with MB-N especially frequently associated with N dynamics [16,71]. However, MB-N only represents the pool size, and thus is insufficient for a full understanding of N dynamics (Tables S3–S6; Bohlen et al. [15]). It is important to note the extent to which microorganisms put available-N into soil, such as N use efficiency (NUE; Mooshammer et al. [6]). In particular, seasonal shifts in the abundance and quality of plant inputs and seasonal differences in MCS likely alter enzyme activities [7], NUE, and subsequent N mineralization.
4.3. Seasonal Changes in the Relationships between MCS and N Dynamics
Our results imply that temperature (and likely plant C inputs) affected MCS, and imply an association between MCS and N dynamics at both sites. Higher F/B in winter is important for N retention in temperate ecosystems [16,72,73], consistent with our results, especially in NF. A trend of greater F/B in the cool season was identified (Figure 1), and MB-N and MB-C/N were also greater in the cool season (Figure S3; Tokuchi et al. [74]). This provides a mechanism for N retention in winter. However, the direct relationship between F/B and N transformation potential was unclear (Tables S4–S6), probably due to the spatial and temporal dependence of different fungal groups (e.g., non-mycorrhizal and mycorrhizal fungi) on different substrates [54,62]. It is likely that greater amounts of plant root exudates lead to an increased biomass of mycorrhizal fungi in summer [75], whereas greater plant leaf and root litter inputs stimulate an increased biomass of saprotrophic fungi in autumn and winter [54], which can cause a functional difference in C and N dynamics.
Microbial indices (Sat/mono, G+/G−, and Cy/pre) explained seasonal changes in N dynamics, except for gross N immobilization potential, better than other variables did. In particular, Sat/mono was positively correlated with the specific N transformation potentials (N transformation potentials normalized by MB-N; Figure S6). Similar relationships have been previously found in several field and laboratory studies using N additions or an N-deposition gradient (Table 2). Here, microbial indices were related to the gross production and net transformation potentials, but not to the gross immobilization potential. Although there was a close association between the production and immobilization (or consumption) of ammonium [76,77], the cause may be the greater control of production (relative to immobilization) through seasonal MCS changes.
Seasonal changes in MCS, specifically in the relative dominance of fungi and bacteria, may be associated with C:N-stoichiometry and N dynamics. In temperate forest ecosystems, plants and microbes are frequently subject to N limitation of growth [1,78], and the extent of this N limitation likely differs with ecosystem age [79,80] and forest stand age [81]. That is, old forests tend to be C limited relative to N, whereas immature forests are more N limited. These differences in the limiting element may lead to different seasonal patterns of MCS and associated differences in N dynamics. However, in this study, similar changes in MCS and N dynamics were found in forest stands of different ages. These findings can be interpreted as indicating similar seasonal changes in the element limitation of soil microbes. Overall, in summer, higher temperatures are likely to cause rapid substrate use along with increasing soil microbial respiration and Cy/pre [41] (possibly explaining our finding of high Cy/pre in summer), higher microbial biomass turnover [82,83], and higher decomposition of SOM [84]. Unless plants can supply enough fresh substrate inputs to exceed the increased decomposition, higher temperatures should convey a lower C/N of the available substrate, which means a stronger demand for C relative to N, i.e., C limitation [85]. In winter, fresh litter inputs with high C/N relative to SOM arrive in late autumn and likely lead to N limitation [6]. In our results, high WEOC/WEON, representing high substrate quality [68], was also observed in winter, which suggests N limitation. In summary, changes in the limiting elements among seasons based on temperature and plant substrate inputs can influence MCS and N dynamics, regardless of differences in fertility.
4.4. Limitations
In this study, we established two temperate forest sites, but there were no replicated sites with different fertilities. Therefore, we will need to confirm their seasonal effects in systems under different backgrounds, such as with different ratios of C:N:P in the environment [78], which were caused by different parent materials and forest ages. Additionally, we measured the gross and net N transformation potentials of soil among seasons at a constant temperature of 25 °C. However, the results should be interpreted with caution. This method has the advantage of comparability between N dynamics generated by microbial communities among seasons under a constant condition, whereas it has the disadvantage of a difference between laboratory experiments and in situ measurements. The actual N mineralization rates of the cool seasons under field conditions were likely lower than the potentials (25 °C) [86]. Therefore, the difference between warm and cool seasons was probably much greater.
5. Conclusions
We investigated seasonal changes in MCS and N dynamics in temperate forest soils at two sites with differing fertilities over the course of one year. Consistent seasonal trends in MCS were found in both the organic and mineral soil layers, and the specific indicators of PLFA also changed among seasons. These results were mainly attributable to temperature, although we should note that the changes in PLFA were caused not only by the changes in MCS, but also by the microbial physiological response to temperature [30,65,66]. To understand the effects of temperature among seasons, a fully temperature-controlled field study is needed. For N dynamics, summer is likely the N mineralization phase, whereas winter appears to be the immobilization phase. These results imply the importance of gross N production compared with immobilization. Moreover, a relationship between MCS and N dynamics was also found, despite the disclaimer above about PLFA. Plant inputs such as root exudates and fine roots are essential contributors to the seasonal MCS and N dynamics. However, the seasonal allocation of these inputs remains mostly unknown in terms of quantity and spatiotemporal trends. Whether microorganisms can utilize old or fresh substrate (i.e., SOM or plant inputs with different C:N stoichiometries [62]) depends strongly on temperature [64] and the microbial groups present (e.g., G+ and G− [31]). Therefore, to understand the seasonal N dynamics associated with the microbial use of different substrates and with temperature, we recommend PLFA along with stable isotope probing, which can identify the substrate based on δ13C (e.g., Waldrop and Firestone [62]; Kramer and Gleixner [31]).
Supplementary Materials
Supplementary materials can be found at https://www.mdpi.com/1999-4907/9/3/153/s1. Table S1: WC, pH, and WEOC in the O-layer and S-layer on each sampling date at both sites, Table S2: Pearson correlation coefficients between microbial community structure (MCS) and other variables among all seasons, Table S3: Variable importance of projection (VIP) and standardized coefficient (SC) of explanatory variables from the PLS regression models for seasonal changes in inorganic N, Table S4: VIP and SC of explanatory variables from the PLS regression models for seasonal changes in gross NH4+-N production potential, Table S5: VIP and SC of explanatory variables from the PLS regression models for seasonal changes in gross NH4+-N immobilization potential, Table S6: VIP and SC of explanatory variables from the PLS regression models for seasonal changes in net N transformation potential, Figure S1: Seasonal dynamics of sunshine, precipitation, and temperature at Otsu observation station of the Japan Meteorological Agency, Figure S2: Seasonal changes of NH4+-N, NO3−-N, water-extractable organic nitrogen (WEON), and inorganic N/WEON in both layers at both sites, Figure S3: Seasonal changes of microbial biomass (MB)-C, -N, MB-C/N, and WEOC/WEON, Figure S4: Principal component analysis (PCA) of the phospholipid fatty acid (PLFA) data for both sites among all seasons, Figure S5: Seasonal changes in microbial indices determined from PLFA data for both sites and both layers, Figure S6: Relationship between the microbial index (Sat/mono) and specific N transformation potentials at each depth and site among all seasons.
Acknowledgments
We thank Kazuo Isobe for technical support and advice on the 15N isotopic dilution method, the members of Soil Science Laboratory, the University of Tokyo for technical help, and Takahito Yoshioka for useful comments and suggestions. This study was supported by Grants-in-Aid for Scientific Research from the Japanese Society for the Promotion of Science (No. 15H04515).
Author Contributions
Tomohiro Yokobe and Naoko Tokuchi conceived and designed the experiments; Tomohiro Yokobe and Naoko Tokuchi contributed to the field work; Tomohiro Yokobe performed the experiments and analyzed the data; Fujio Hyodo contributed to PLFA analysis; Tomohiro Yokobe wrote the paper; Naoko Tokuchi and Fujio Hyodo reviewed the manuscript and contributed to editing of the manuscript.
Conflicts of Interest
The authors declare no conflict of interest.
References
- LeBauer, D.S.; Treseder, K.K. Nitrogen limitation of net primary productivity in terrestrial ecosystems is globally distributed. Ecology 2008, 89, 371–379. [Google Scholar] [CrossRef] [PubMed]
- Strickland, M.S.; Lauber, C.; Fierer, N.; Bradford, M.A. Testing the functional significance of microbial community composition. Ecology 2009, 90, 441–451. [Google Scholar] [CrossRef] [PubMed]
- Waldrop, M.P.; Balser, T.C.; Firestone, M.K. Linking microbial community composition to function in a tropical soil. Soil Biol. Biochem. 2000, 32, 1837–1846. [Google Scholar] [CrossRef]
- Strickland, M.S.; Rousk, J. Considering fungal: Bacterial dominance in soils—Methods, controls, and ecosystem implications. Soil Biol. Biochem. 2010, 42, 1385–1395. [Google Scholar] [CrossRef]
- Waring, B.G.; Averill, C.; Hawkes, C.V. Differences in fungal and bacterial physiology alter soil carbon and nitrogen cycling: Insights from meta-analysis and theoretical models. Ecol. Lett. 2013, 16, 887–894. [Google Scholar] [CrossRef] [PubMed]
- Mooshammer, M.; Wanek, W.; Hämmerle, I.; Fuchslueger, L.; Hofhansl, F.; Knoltsch, A.; Schnecker, J.; Takriti, M.; Watzka, M.; Wild, B.; et al. Adjustment of microbial nitrogen use efficiency to carbon: Nitrogen imbalances regulates soil nitrogen cycling. Nat. Commun. 2014, 5, 3694. [Google Scholar] [CrossRef] [PubMed]
- Koranda, M.; Kaiser, C.; Fuchslueger, L.; Kitzler, B.; Sessitsch, A.; Zechmeister-Boltenstern, S.; Richter, A. Seasonal variation in functional properties of microbial communities in beech forest soil. Soil Biol. Biochem. 2013, 60, 95–104. [Google Scholar] [CrossRef] [PubMed]
- Waldrop, M.P.; Firestone, M.K. Seasonal dynamics of microbial community composition and function in oak canopy and open grassland soils. Microb. Ecol. 2006, 52, 470–479. [Google Scholar] [CrossRef] [PubMed]
- Puissant, J.; Cécillon, L.; Mills, R.T.E.; Robroek, B.J.M.; Gavazov, K.; De Danieli, S.; Spiegelberger, T.; Buttler, A.; Brun, J.J. Seasonal influence of climate manipulation on microbial community structure and function in mountain soils. Soil Biol. Biochem. 2015, 80, 296–305. [Google Scholar] [CrossRef]
- Lauber, C.L.; Ramirez, K.S.; Aanderud, Z.; Lennon, J.; Fierer, N. Temporal variability in soil microbial communities across land-use types. ISME J. 2013, 7, 1641–1650. [Google Scholar] [CrossRef] [PubMed]
- Brockett, B.F.T.; Prescott, C.E.; Grayston, S.J. Soil moisture is the major factor influencing microbial community structure and enzyme activities across seven biogeoclimatic zones in western Canada. Soil Biol. Biochem. 2012, 44, 9–20. [Google Scholar] [CrossRef]
- Thoms, C.; Gleixner, G. Seasonal differences in tree species’ influence on soil microbial communities. Soil Biol. Biochem. 2013, 66, 239–248. [Google Scholar] [CrossRef]
- Wu, J.; Xiong, J.; Hu, C.; Shi, Y.; Wang, K.; Zhang, D. Temperature sensitivity of soil bacterial community along contrasting warming gradient. Appl. Soil Ecol. 2015, 94, 40–48. [Google Scholar] [CrossRef]
- Treseder, K.K.; Marusenko, Y.; Romero-Olivares, A.L.; Maltz, M.R. Experimental warming alters potential function of the fungal community in boreal forest. Glob. Chang. Biol. 2016, 22, 3395–3404. [Google Scholar] [CrossRef] [PubMed]
- Bohlen, P.J.; Groffman, P.M.; Driscoll, C.T.; Fahey, T.J.; Siccama, T.G. Plant-soil-microbial interactions in a northern hardwood forest. Ecology 2001, 82, 965–978. [Google Scholar] [CrossRef]
- Kaiser, C.; Fuchslueger, L.; Koranda, M.; Gorfer, M.; Claus, F.; Kitzler, B.; Rasche, F.; Strauss, J.; Sessitsch, A.; Zechmeister, S.; et al. Plants control N cycling the seasonal dynamics of microbial in a beech forest soil by belowground С allocation. Ecology 2011, 92, 1036–1051. [Google Scholar] [CrossRef] [PubMed]
- Bardgett, R.D.; Bowman, W.D.; Kaufmann, R.; Schmidt, S.K. A temporal approach to linking aboveground and belowground ecology. Trends Ecol. Evol. 2005, 20, 634–641. [Google Scholar] [CrossRef] [PubMed]
- Schmidt, S.K.; Costello, E.K.; Nemergut, D.R.; Cleveland, C.C.; Reed, S.C.; Meyer, A.F.; Martin, A.M.; Nemergut, R.; Meyer, F.; Reed, S.C. Biogeochemical consequences of rapid microbial turnover and seasonal succession in soil. Ecology 2007, 88, 1379–1385. [Google Scholar] [CrossRef] [PubMed]
- Kaiser, C.; Koranda, M.; Kitzler, B.; Fuchslueger, L.; Schnecker, J.; Schweiger, P.; Rasche, F.; Zechmeister-Boltenstern, S.; Sessitsch, A.; Richter, A. Belowground carbon allocation by trees drives seasonal patterns of extracellular enzyme activities by altering microbial community composition in a beech forest soil. New Phytol. 2010, 187, 843–858. [Google Scholar] [CrossRef] [PubMed]
- Högberg, M.N.; Chen, Y.; Högberg, P. Gross nitrogen mineralisation and fungi-to-bacteria ratios are negatively correlated in boreal forests. Biol. Fertil. Soils 2007, 44, 363–366. [Google Scholar] [CrossRef]
- Rousk, J.; Bååth, E. Growth of saprotrophic fungi and bacteria in soil. FEMS Microbiol. Ecol. 2011, 78, 17–30. [Google Scholar] [CrossRef] [PubMed]
- Hobara, S.; Tokuchi, N.; Ohte, N.; Koba, K.; Katsuyama, M.; Kim, S.-J.; Nakanishi, A. Mechanism of nitrate loss from a forested catchment following a small-scale, natural disturbance. Can. J. For. Res. 2001, 31, 1326–1335. [Google Scholar] [CrossRef]
- IUSS Working Group WRB. World Reference Base for Soil Resources 2014. International Soil Classification System for Naming Soils and Creating Legends for Soil Maps; IUSS Working Group WRB: Rome, Italy, 2014; ISBN 9789251083697.
- Brookes, P.C.; Landman, A.; Pruden, G.; Jenkinson, D.S. Chloroform fumigation and the release of soil nitrogen: A rapid direct extraction method to measure microbial biomass nitrogen in soil. Soil Biol. Biochem. 1985, 17, 837–842. [Google Scholar] [CrossRef]
- Wu, J.; Joergensen, R.G.; Pommerening, B.; Chaussod, R.; Brookes, P.C. Measurement of soil microbial biomass C by fumigation-extraction-an automated procedure. Soil Biol. Biochem. 1990, 22, 1167–1169. [Google Scholar] [CrossRef]
- Jenkinson, D.S. The determination of microbial biomass carbon and nitrogen in soil. In Advances in Nitrogen Cycling in Agricultural Ecosystems; Wilson, J.R., Ed.; C.A.B. International: Wallingford, UK, 1988; pp. 368–386. ISBN 085198603X. [Google Scholar]
- Frostegård, Å.; Tunlid, A.; Bååth, E. Phospholipid fatty acid composition, biomass, and activity of microbial communities from two soil types experimentally exposed to different heavy metals. Appl. Environ. Microbiol. 1993, 59, 3605–3617. [Google Scholar] [PubMed]
- Bardgett, R.D.; Hobbs, P.J.; Frostegård, Å. Changes in soil fungal: Bacterial biomass ratios following reductions in the intensity of management of an upland grassland. Biol. Fertil. Soils 1996, 22, 261–264. [Google Scholar] [CrossRef]
- Wixon, D.L.; Balser, T.C. Toward conceptual clarity: PLFA in warmed soils. Soil Biol. Biochem. 2013, 57, 769–774. [Google Scholar] [CrossRef]
- Frostegård, Å.; Tunlid, A.; Bååth, E. Use and misuse of PLFA measurements in soils. Soil Biol. Biochem. 2011, 43, 1621–1625. [Google Scholar] [CrossRef]
- Kramer, C.; Gleixner, G. Variable use of plant- and soil-derived carbon by microorganisms in agricultural soils. Soil Biol. Biochem. 2006, 38, 3267–3278. [Google Scholar] [CrossRef]
- Bossio, D.A.; Scow, K.M. Impacts of carbon and flooding on soil microbial communities: Phospholipid fatty acid profiles and substrate utilization patterns. Microb. Ecol. 1998, 35, 265–278. [Google Scholar] [CrossRef] [PubMed]
- Högberg, M.N.; Högbom, L.; Kleja, D.B. Soil microbial community indices as predictors of soil solution chemistry and N leaching in Picea abies (L.) Karst. forests in S. Sweden. Plant Soil 2013, 372, 507–522. [Google Scholar] [CrossRef]
- Blaško, R.; Högberg, P.; Bach, L.H.; Högberg, M.N. Relations among soil microbial community composition, nitrogen turnover, and tree growth in N-loaded and previously N-loaded boreal spruce forest. For. Ecol. Manag. 2013, 302, 319–328. [Google Scholar] [CrossRef]
- Högberg, M.N.; Blaško, R.; Bach, L.H.; Hasselquist, N.J.; Egnell, G.; Näsholm, T.; Högberg, P. The return of an experimentally N-saturated boreal forest to an N-limited state: Observations on the soil microbial community structure, biotic N retention capacity and gross N mineralisation. Plant Soil 2014, 381, 45–60. [Google Scholar] [CrossRef]
- Zechmeister-Boltenstern, S.; Michel, K.; Pfeffer, M. Soil microbial community structure in European forests in relation to forest type and atmospheric nitrogen deposition. Plant Soil 2011, 343, 37–50. [Google Scholar] [CrossRef]
- Feng, X.; Simpson, M.J. Temperature and substrate controls on microbial phospholipid fatty acid composition during incubation of grassland soils contrasting in organic matter quality. Soil Biol. Biochem. 2009, 41, 804–812. [Google Scholar] [CrossRef]
- Demoling, F.; Ola Nilsson, L.; Bååth, E. Bacterial and fungal response to nitrogen fertilization in three coniferous forest soils. Soil Biol. Biochem. 2008, 40, 370–379. [Google Scholar] [CrossRef]
- Stevenson, B.A.; Hunter, D.W.F.; Rhodes, P.L. Temporal and seasonal change in microbial community structure of an undisturbed, disturbed, and carbon-amended pasture soil. Soil Biol. Biochem. 2014, 75, 175–185. [Google Scholar] [CrossRef]
- Frey, S.D.; Drijber, R.; Smith, H.; Melillo, J. Microbial biomass, functional capacity, and community structure after 12 years of soil warming. Soil Biol. Biochem. 2008, 40, 2904–2907. [Google Scholar] [CrossRef]
- Schindlbacher, A.; Rodler, A.; Kuffner, M.; Kitzler, B.; Sessitsch, A.; Zechmeister-Boltenstern, S. Experimental warming effects on the microbial community of a temperate mountain forest soil. Soil Biol. Biochem. 2011, 43, 1417–1425. [Google Scholar] [CrossRef] [PubMed]
- Kuroiwa, M.; Koba, K.; Isobe, K.; Tateno, R.; Nakanishi, A.; Inagaki, Y.; Toda, H.; Otsuka, S.; Senoo, K.; Suwa, Y.; et al. Gross nitrification rates in four Japanese forest soils: Heterotrophic versus autotrophic and the regulation factors for the nitrification. J. For. Res. 2011, 16, 363–373. [Google Scholar] [CrossRef]
- Isobe, K.; Suwa, Y.; Ikutani, J.; Kuroiwa, M.; Makita, T.; Takebayashi, Y.; Yoh, M.; Otsuka, S.; Senoo, K.; Ohmori, M.; et al. Analytical techniques for quantifying (15)N/(14)N of nitrate, nitrite, total dissolved nitrogen and ammonium in environmental samples using a gas chromatograph equipped with a quadrupole mass spectrometer. Microbes Environ. 2011, 26, 46–53. [Google Scholar] [CrossRef] [PubMed]
- Davidson, E.A.; Hart, S.C.; Shanks, C.A.; Firestone, M. Measuring gross nitrogen mineralization, and nitrification by 15 N isotopic pool dilution in intact soil cores. J. Soil Sci. 1991, 42, 335–349. [Google Scholar] [CrossRef]
- Corre, M.D.; Beese, F.O.; Brumme, R. Soil nitrogen cycle in high nitrogen deposition forest: Changes under nitrogen saturation and liming. Ecol. Appl. 2003, 13, 287–298. [Google Scholar] [CrossRef]
- Japan Meteorological Agency Statistical Report for Weather in Japan. Available online: http://www.data.jma.go.jp/obd/stats/etrn/index.php (accessed on 18 December 2015).
- Wold, S.; Sjöström, M.; Eriksson, L. PLS-regression: A basic tool of chemometrics. Chemom. Intell. Lab. Syst. 2001, 58, 109–130. [Google Scholar] [CrossRef]
- Esposito Vinzi, V.; Chin, W.W.; Henseler, J.; Wang, H. Handbook of Partial Least Squares. Concepts, Methods and Applications; Springer: Berlin/Heidelberg, Germany, 2010; ISBN 9783540328278. [Google Scholar]
- McKinley, V.L.; Peacock, A.D.; White, D.C. Microbial community PLFA and PHB responses to ecosystem restoration in tallgrass prairie soils. Soil Biol. Biochem. 2005, 37, 1946–1958. [Google Scholar] [CrossRef]
- Bach, E.M.; Baer, S.G.; Meyer, C.K.; Six, J. Soil texture affects soil microbial and structural recovery during grassland restoration. Soil Biol. Biochem. 2010, 42, 2182–2191. [Google Scholar] [CrossRef]
- Joergensen, R.G.; Wichern, F. Quantitative assessment of the fungal contribution to microbial tissue in soil. Soil Biol. Biochem. 2008, 40, 2977–2991. [Google Scholar] [CrossRef]
- Bardgett, R.D.; Lovell, R.D.; Hobbs, P.J.; Jarvis, S.C. Seasonal changes in soil microbial communities along a fertility gradient of temperate grasslands. Soil Biol. Biochem. 1999, 31, 1021–1030. [Google Scholar] [CrossRef]
- Lipson, D.A. Relationships between temperature responses and bacterial community structure along seasonal and altitudinal gradients. FEMS Microbiol. Ecol. 2007, 59, 418–427. [Google Scholar] [CrossRef] [PubMed]
- Voříšková, J.; Brabcová, V.; Cajthaml, T.; Baldrian, P. Seasonal dynamics of fungal communities in a temperate oak forest soil. New Phytol. 2014, 201, 269–278. [Google Scholar] [CrossRef] [PubMed]
- Chemidlin Prevost-Boure, N.; Maron, P.-A.; Ranjard, L.; Nowak, V.; Dufrene, E.; Damesin, C.; Soudani, K.; Lata, J.-C. Seasonal dynamics of the bacterial community in forest soils under different quantities of leaf litter. Appl. Soil Ecol. 2011, 47, 14–23. [Google Scholar] [CrossRef]
- Brant, J.B.; Myrold, D.D.; Sulzman, E.W. Root controls on soil microbial community structure in forest soils. Oecologia 2006, 148, 650–659. [Google Scholar] [CrossRef] [PubMed]
- Yarwood, S.A.; Myrold, D.D.; Högberg, M.N. Termination of belowground C allocation by trees alters soil fungal and bacterial communities in a boreal forest. FEMS Microbiol. Ecol. 2009, 70, 151–162. [Google Scholar] [CrossRef] [PubMed]
- De Graaff, M.A.; Classen, A.T.; Castro, H.F.; Schadt, C.W. Labile soil carbon inputs mediate the soil microbial community composition and plant residue decomposition rates. New Phytol. 2010, 188, 1055–1064. [Google Scholar] [CrossRef] [PubMed]
- Eilers, K.G.; Lauber, C.L.; Knight, R.; Fierer, N. Shifts in bacterial community structure associated with inputs of low molecular weight carbon compounds to soil. Soil Biol. Biochem. 2010, 42, 896–903. [Google Scholar] [CrossRef]
- Brant, J.B.; Sulzman, E.W.; Myrold, D.D. Microbial community utilization of added carbon substrates in response to long-term carbon input manipulation. Soil Biol. Biochem. 2006, 38, 2219–2232. [Google Scholar] [CrossRef]
- Zogg, G.P.; Zak, D.R.; Ringelberg, D.B.; White, D.C.; MacDonald, N.W.; Pregitzer, K.S. Compositional and Functional Shifts in Microbial Communities Due to Soil Warming. Soil Sci. Soc. Am. J. 1997, 61, 475. [Google Scholar] [CrossRef]
- Waldrop, M.P.; Firestone, M.K. Altered utilization patterns of young and old soil C by microorganisms caused by temperature shifts and N additions. Biogeochemistry 2004, 67, 235–248. [Google Scholar] [CrossRef]
- Oliverio, A.M.; Bradford, M.A.; Fierer, N. Identifying the microbial taxa that consistently respond to soil warming across time and space. Glob. Chang. Biol. 2017, 23, 2117–2129. [Google Scholar] [CrossRef] [PubMed]
- Biasi, C.; Rusalimova, O.; Meyer, H.; Kaiser, C.; Wanek, W.; Barsukov, P.; Junger, H.; Richter, A. Temperature-dependent shift from labile to recalcitrant carbon sources of arctic heterotrophs. Rapid Commun. Mass Spectrom. 2005, 19, 1401–1408. [Google Scholar] [CrossRef] [PubMed]
- Zhang, Y.-M.; Rock, C.O. Membrane lipid homeostasis in bacteria. Nat. Rev. Microbiol. 2008, 6, 222–233. [Google Scholar] [CrossRef] [PubMed]
- Suutari, M.; Liukkonen, K.; Laakso, S. Temperature adaptation in yeasts: The role of fatty acids. J. Gen. Microbiol. 1990, 136, 1469–1474. [Google Scholar] [CrossRef] [PubMed]
- Jaeger, C.H.; Monson, R.K.; Fisk, M.C.; Schmidt, S.K. Seasonal partitioning of nitrogen by plants and soil microorganisms in an alpine ecosystem. Ecology 1999, 80, 1883–1891. [Google Scholar] [CrossRef]
- Marschner, B.; Kalbitz, K. Controls of bioavailability and biodegradability of dissolved organic matter in soils. Geoderma 2003, 113, 211–235. [Google Scholar] [CrossRef]
- Tiemann, L.K.; Billings, S.A. Changes in variability of soil moisture alter microbial community C and N resource use. Soil Biol. Biochem. 2011, 43, 1837–1847. [Google Scholar] [CrossRef]
- Rowland, L.; Hill, T.C.; Stahl, C.; Siebicke, L.; Burban, B.; Zaragoza-Castells, J.; Ponton, S.; Bonal, D.; Meir, P.; Williams, M. Evidence for strong seasonality in the carbon storage and carbon use efficiency of an Amazonian forest. Glob. Chang. Biol. 2014, 20, 979–991. [Google Scholar] [CrossRef] [PubMed] [Green Version]
- Tahovská, K.; Kaňa, J.; Bárta, J.; Oulehle, F.; Richter, A.; Šantrůčková, H. Microbial N immobilization is of great importance in acidified mountain spruce forest soils. Soil Biol. Biochem. 2013, 59, 58–71. [Google Scholar] [CrossRef]
- De Vries, F.T.; van Groenigen, J.W.; Hoffland, E.; Bloem, J. Nitrogen losses from two grassland soils with different fungal biomass. Soil Biol. Biochem. 2011, 43, 997–1005. [Google Scholar] [CrossRef]
- De Vries, F.T.; Bloem, J.; Quirk, H.; Stevens, C.J.; Bol, R.; Bardgett, R.D. Extensive Management Promotes Plant and Microbial Nitrogen Retention in Temperate Grassland. PLoS ONE 2012, 7, 1–12. [Google Scholar] [CrossRef] [PubMed] [Green Version]
- Tokuchi, N.; Yoneda, S.; Ohte, N.; Usui, N.; Koba, K.; Kuroiwa, M.; Toda, H.; Suwa, Y. Seasonal changes and controlling factors of gross N transformation in an evergreen plantation forest in central Japan. J. For. Res. 2014, 19, 77–85. [Google Scholar] [CrossRef]
- Högberg, P.; Johannisson, C.; Yarwood, S.; Callesen, I.; Näsholm, T.; Myrold, D.D.; Högberg, M.N. Recovery of ectomycorrhiza after “nitorgen saturation” of a coniferous forest. New Phytol. 2010, 189, 515–525. [Google Scholar] [CrossRef] [PubMed]
- Fisk, M.C.; Schmidt, S.K.; Seastedt, T.R. Topographic patterns of above- and belowground production and nitrogen cycling in alpine tundra. Ecology 1998, 79, 2253–2266. [Google Scholar] [CrossRef]
- Christenson, L.M.; Lovett, G.M.; Weathers, K.C.; Arthur, M.A. The Influence of Tree Species, Nitrogen Fertilization, and Soil C to N ratio on Gross Soil Nitrogen Transformations. Soil Sci. Soc. Am. J. 2009, 73, 638. [Google Scholar] [CrossRef]
- Zechmeister-Boltenstern, S.; Keiblinger, K.M.; Mooshammer, M.; Peñuelas, J.; Richter, A.; Sardans, J.; Wanek, W. The application of ecological stoichiometry to plant-microbial-soil organic matter transformations. Ecol. Monogr. 2015, 85, 133–155. [Google Scholar] [CrossRef]
- De Vries, F.T.; Bardgett, R.D. Plant-microbial linkages and ecosystem nitrogen retention: Lessons for sustainable agriculture. Front. Ecol. Environ. 2012, 10, 425–432. [Google Scholar] [CrossRef]
- Blaško, R.; Holm Bach, L.; Yarwood, S.A.; Trumbore, S.E.; Högberg, P.; Högberg, M.N. Shifts in soil microbial community structure, nitrogen cycling and the concomitant declining N availability in ageing primary boreal forest ecosystems. Soil Biol. Biochem. 2015, 91, 200–211. [Google Scholar] [CrossRef]
- Goodale, C.L.; Aber, J.D. The long-term effects of land-use history on nitrogen cycling in northern hardwood forests. Ecol. Appl. 2001, 11, 253–267. [Google Scholar] [CrossRef]
- Joergensen, R.G.; Brookes, P.C.; Jenkinson, D.S. Survival of the soil microbial biomass at elevated temperatures. Soil Biol. Biochem. 1990, 22, 1129–1136. [Google Scholar] [CrossRef]
- Hagerty, S.B.; van Groenigen, K.J.; Allison, S.D.; Hungate, B.A.; Schwartz, E.; Koch, G.W.; Kolka, R.K.; Dijkstra, P. Accelerated microbial turnover but constant growth efficiency with warming in soil. Nat. Clim. Chang. 2014, 4, 903–906. [Google Scholar] [CrossRef]
- Manzoni, S.; Taylor, P.; Richter, A.; Porporato, A.; Ågren, G.I. Environmental and stoichiometric controls on microbial carbon-use efficiency in soils. New Phytol. 2012, 196, 79–91. [Google Scholar] [CrossRef] [PubMed]
- Cookson, W.R.; Osman, M.; Marschner, P.; Abaye, D.A.; Clark, I.; Murphy, D.V.; Stockdale, E.A.; Watson, C.A. Controls on soil nitrogen cycling and microbial community composition across land use and incubation temperature. Soil Biol. Biochem. 2007, 39, 744–756. [Google Scholar] [CrossRef]
- Cookson, W.R.; Cornforth, I.S.; Rowarth, J.S. Winter soil temperature (2–15 °C) effects on nitrogen transformations in clover green manure amended or unamended soils; A laboratory and field study. Soil Biol. Biochem. 2002, 34, 1401–1415. [Google Scholar] [CrossRef]
Figure 1.
Seasonal changes in fungal and bacterial PLFA, and the F/B ratio of both layers at both sites. Data represent the mean (n = 5) ± SE. Letters indicate significant differences on a sampling date (Tukey’s HSD test, p < 0.05).
Figure 1.
Seasonal changes in fungal and bacterial PLFA, and the F/B ratio of both layers at both sites. Data represent the mean (n = 5) ± SE. Letters indicate significant differences on a sampling date (Tukey’s HSD test, p < 0.05).

Figure 2.
Principal component analysis (PCA) of phospholipid fatty acid (PLFA) data at two depths among seasons (n = 6), including the data from both NF and RF (a,c) and loading scores for individual PLFAs (b,d).
Figure 2.
Principal component analysis (PCA) of phospholipid fatty acid (PLFA) data at two depths among seasons (n = 6), including the data from both NF and RF (a,c) and loading scores for individual PLFAs (b,d).

Figure 3.
Relationship between the microbial index Sat/mono and temperature (28 day) at each depth, each site, and each season. The data are represented as mean (n = 5) ± SE.
Figure 3.
Relationship between the microbial index Sat/mono and temperature (28 day) at each depth, each site, and each season. The data are represented as mean (n = 5) ± SE.

Figure 4.
Seasonal changes in gross NH4+- and NO3−-N production potential and gross NH4+- and NO3−-N immobilization potential in both layers at both sites. Data are shown as mean (n = 5) ± SE. Letters indicate significant differences on a sampling date (Tukey’s HSD test, p < 0.05).
Figure 4.
Seasonal changes in gross NH4+- and NO3−-N production potential and gross NH4+- and NO3−-N immobilization potential in both layers at both sites. Data are shown as mean (n = 5) ± SE. Letters indicate significant differences on a sampling date (Tukey’s HSD test, p < 0.05).

Figure 5.
Seasonal changes in net NH4+-N, NO3−-N and water-extractable organic nitrogen (WEON) transformation potential in both layers at both sites. Data are presented as mean (n = 5) ± SE. Letters indicate significant differences on a sampling date (Tukey’s HSD test, p < 0.05).
Figure 5.
Seasonal changes in net NH4+-N, NO3−-N and water-extractable organic nitrogen (WEON) transformation potential in both layers at both sites. Data are presented as mean (n = 5) ± SE. Letters indicate significant differences on a sampling date (Tukey’s HSD test, p < 0.05).


Table 1.
Land use history, vegetation, organic layer, and soil properties of the study sites. Organic layer amount and bulk density are represented as mean values (n = 5) ± SE. Total C and N, and C/N are represented as mean values (n = 30) ± SE. Letters indicate significant differences between the two sites (Tukey’s HSD test, p < 0.05).
| Natural Forest (NF) | Restored Forest (RF) | |
|---|---|---|
| Land use history | Natural | Soil erosion over a long period and subsequent reforestation (ca. 100 years ago) |
| Vegetation | A mature natural forest dominated mainly by Japanese cypress (Chamaecyparis obtusa (Siebold & Zucc.) Endl.) and oaks | A semi-mature forest dominated mainly by Japanese cypress (Chamaecyparis obtusa (Siebold & Zucc.) Endl.) and oaks |
| Organic layer amount | ||
| >4 mm (Mg ha-1) | 3.69 ± 0.33 | 2.39 ± 0.48 |
| <4 mm (Mg ha-1) | 11.64 ± 4.81 | 29.50 ± 2.46 |
| C/N (Organic layer) | ||
| <4 mm | 23.8 ± 0.3A | 28.3 ± 0.5B |
| Soil type 1 | Cambisols | Regosols |
| Bulk density 2 (0–10 cm) | ||
| >2 mm (g cm-3) | 0.26 ± 0.02 | 0.26 ± 0.04 |
| <2 mm (g cm-3) | 0.61 ± 0.04 | 0.77 ± 0.04 |
| Total C 3 (g C kg-1) | 53.4 ± 3.2A | 17.0 ± 1.3B |
| Total N 3 (g N kg-1) | 2.87 ± 0.17A | 0.96 ± 0.06B |
| C/N 3 | 18.5 ± 0.2 | 17.6 ± 0.4 |
1 Soil classification by IUSS Working Group WRB [23]. 2 Bulk density was separated into two fractions; the coarse (>2 mm) and fine (<2 mm). 3 Soil layer (0–10 cm; <2 mm).
Table 2.
Definition of microbial indices.
| Indices (Specific Ratios) | Phospholipid Fatty Acids | Major Association with Increase in PLFA Index |
|---|---|---|
| Sat/mono [32,33] | High N loading | |
| Saturated | 14:0 + 15:0 + 16:0 + 17:0 + 18:0 | (addition [34,35], deposition [33,36]) |
| Monounsaturated | 16:1ω7 + 18:1ω7 + 18:1ω9t + 18:1ω9c | Small amount of substrate [32] |
| High temperature [37] | ||
| G+/G– [19,32,33] | High N loading (addition [34,38]) | |
| Gram-positive bacteria | i15:0 + a15:0 + i16:0 + i17:0 | Small amount of substrate [32,39] |
| Gram-negative bacteria | 16:1ω7 + cy17:0 | High temperature [37,40] |
| Cy/pre [32,33] | High N loading | |
| Cyclopropyl | cy17:0 | (addition [35], deposition [33]) |
| Precursor | 16:1ω7 | High temperature [37] |
| High microbial respiration [41] | ||
| F/B [27,28] | Low N loading | |
| Fungi | 18:2ω6,9 | (addition [35,38], deposition [33,36]) |
| Bacteria | i15:0 + a15:0 + 15:0 + i16:0 + i17:0 + | Large amount of substrate [32,39] |
| cy17:0 + 17:0 + 18:1ω7 + cy19:0 | Low temperature [37,40] |
© 2018 by the authors. Licensee MDPI, Basel, Switzerland. This article is an open access article distributed under the terms and conditions of the Creative Commons Attribution (CC BY) license (http://creativecommons.org/licenses/by/4.0/).
Share and Cite
MDPI and ACS Style
Yokobe, T.; Hyodo, F.; Tokuchi, N. Seasonal Effects on Microbial Community Structure and Nitrogen Dynamics in Temperate Forest Soil. Forests 2018, 9, 153. https://doi.org/10.3390/f9030153
AMA Style
Yokobe T, Hyodo F, Tokuchi N. Seasonal Effects on Microbial Community Structure and Nitrogen Dynamics in Temperate Forest Soil. Forests. 2018; 9(3):153. https://doi.org/10.3390/f9030153
Chicago/Turabian StyleYokobe, Tomohiro, Fujio Hyodo, and Naoko Tokuchi. 2018. "Seasonal Effects on Microbial Community Structure and Nitrogen Dynamics in Temperate Forest Soil" Forests 9, no. 3: 153. https://doi.org/10.3390/f9030153
Note that from the first issue of 2016, this journal uses article numbers instead of page numbers. See further details here.