Article

Development of an Integrated DBH Estimation Model Based on Stand and Climatic Conditions

1
Department of Environmental Science and Ecological Engineering, Korea University, Seoul 02841, Korea
2
International Institute for Applied Systems Analysis, A-2361 Laxenburg, Austria
3
Korea Forest Inventory Center, National Forestry Cooperative Federation, Seoul 02455, Korea
4
Forest Welfare Division, National Institute of Forest Science, Seoul 02455, Korea
5
Department of Geography, Yanbian University, Yanji 133002, China
*
Author to whom correspondence should be addressed.
Forests 2018, 9(3), 155; https://doi.org/10.3390/f9030155
Submission received: 6 February 2018 / Revised: 9 March 2018 / Accepted: 19 March 2018 / Published: 20 March 2018
(This article belongs to the Special Issue Simulation Modeling of Forest Ecosystems)

Abstract

:
Using Korean National Forest Inventory (NFI) data, our study developed a model to estimate stand mean diameter at breast height (DBH) reflecting the influence of site and climate factors on forest growth for the major tree species in South Korea. A DBH estimation model was developed using stand-level variables (stand age, site index and number of trees per hectare) as independent factors. The spatial autocorrelation of residuals of the model was identified using semi-variogram analysis for each tree species. Further, a residual model, in which residuals were estimated by climatic factors (mean temperature, sum temperature in the growing season and precipitation), was developed assuming that the spatial autocorrelation of residuals reflects the differences in regional climatic conditions. Linear regression analysis showed that residuals of all tree species were significantly correlated with temperature and precipitation. The DBH and residual models were integrated to estimate the current DBH under different climatic factors (temperature and precipitation) and stand-level variables. This model had high reliability (R2 = 0.74–0.79), and no obvious dependencies or patterns in residuals were noted. Our results indicated that temperature increases caused by climate change would negatively affect the DBH estimate of coniferous trees, but not of oak species.

1. Introduction

Many tree growth models that can effectively project changes in forest resources have been developed to establish forest management planning practices [1,2,3]. Various stand-level factors and indicators such as stand age, site quality and density are considered as integral components of tree growth models to reflect the characteristics of stands and their natural environments [4,5,6]. It is necessary to develop a forest growth model for the establishment of rational management [7,8]. Ji et al. [9] used observed data (such as stand age, site quality and density) from fixed sample plots to develop a stand growth model in Lishui City; then, using the model, predicted forest growth. Forest growth can also be influenced by climate factors. Efforts have been undertaken to include climatic condition as a core component of growth models [10,11,12]. According to Tian et al. [13], net primary productivity (NPP) has decreased due to global warming over the past century in the Amazon rain forest.
Stand-level factors have been recognized as essential for forest growth models because growth rates can vary according to mean age, site quality and stand density [14,15,16]. Climatic and topographic factors can be used to localize growth models to specific regions [17,18]. Nirmal and Mahadev [19] reported that higher temperatures can increase the diameter of Jack pine (Pinus banksiana Lamb.) in the boreal forest in Ontario, Canada. Gao et al. [20] showed that the diameter at breast height (DBH) of Korean pine (Pinus koraiensis Siebold & Zucc.) in Changbai Mountains was negatively correlated with winter temperature. In addition, the changes in tree growth over time can be explained by both tree age and climate factors [12,21]. Byun et al. [12] found that temperature adversely affects red pine growth, whereas it improves the growth of oak tree species.
However, previous studies had a major limitation. Some previous studies [12,22] included climate indicators within the regression equation. Unlike stand-level environmental factors that are traditionally used to generate tree estimation models, climate factors have spatially-continuous attributes. They can exert strong spatial autocorrelation. Not using different attributes of factors or using both spatial and non-spatial factors in a single model can result in low reliability of the model and overestimation of uncertainties [23,24]. Therefore, this study aimed to analyze quantitatively the influence of climate on diameter development and identifying the characteristics of diameter development for the major tree species (Pinus densiflora Siebold & Zucc., Larix kaempferi (Lamb.) Carr., Pinus koraiensis, Quercus variabilis Blume and Quercus mongolica Fisch. ex Ledeb.) in South Korea by using the DBH estimation model developed based on surveyed age, site quality and stand density.

2. Data and Methods

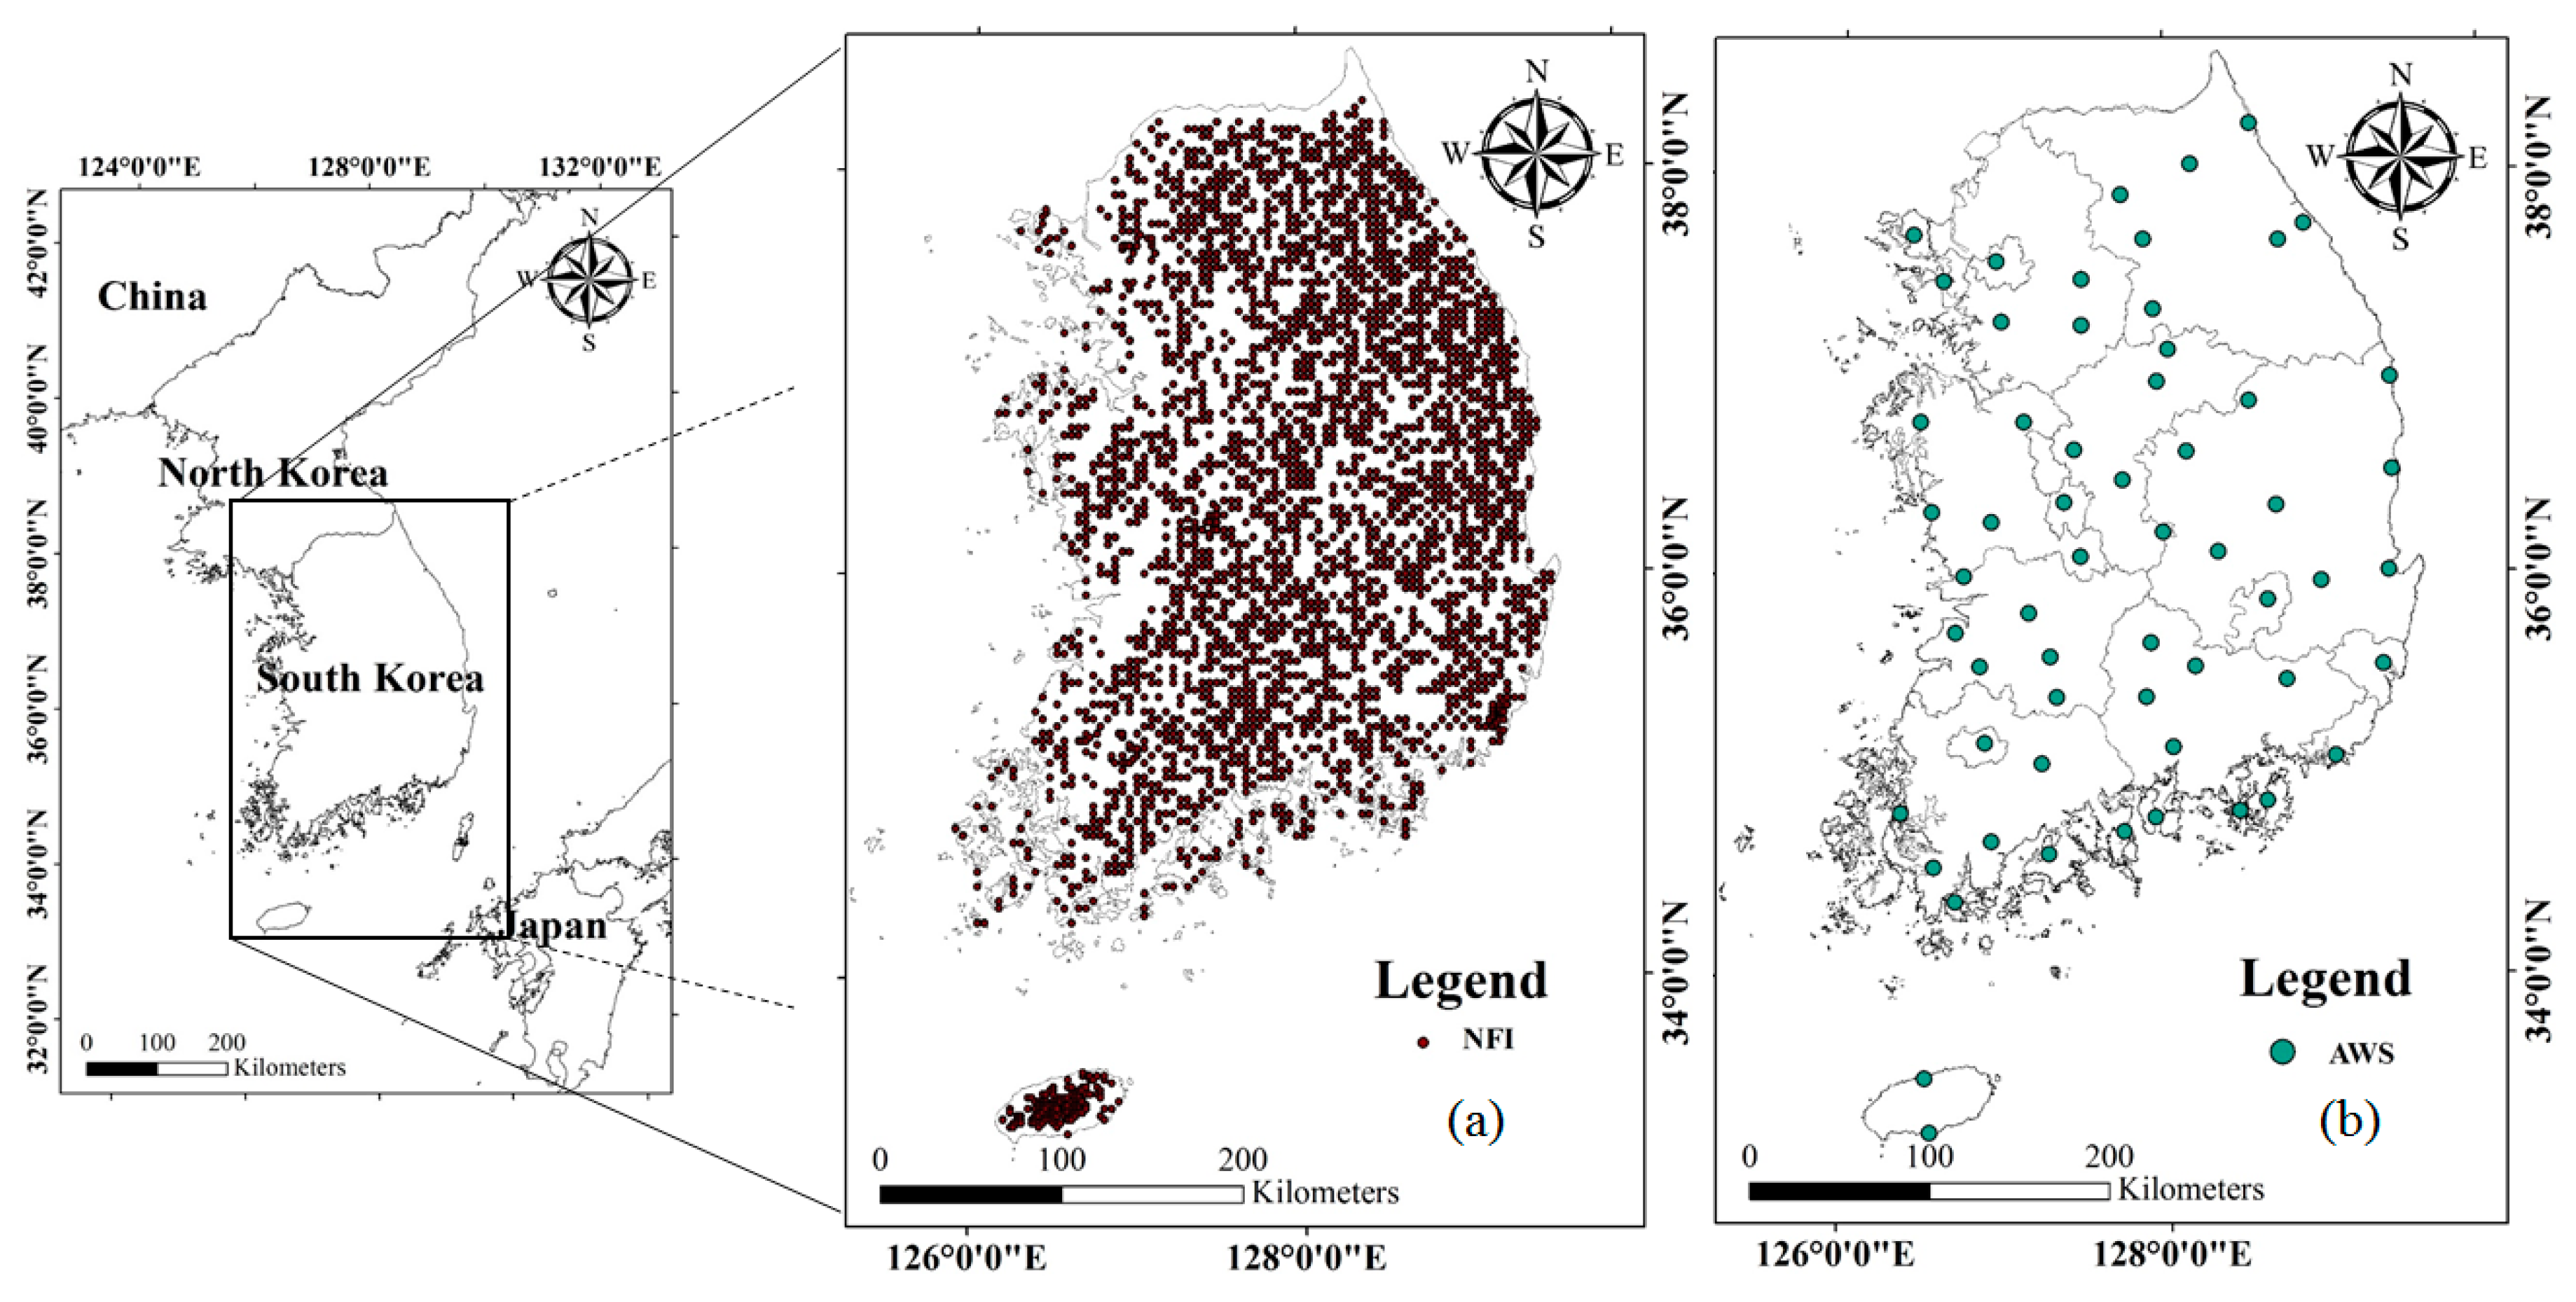
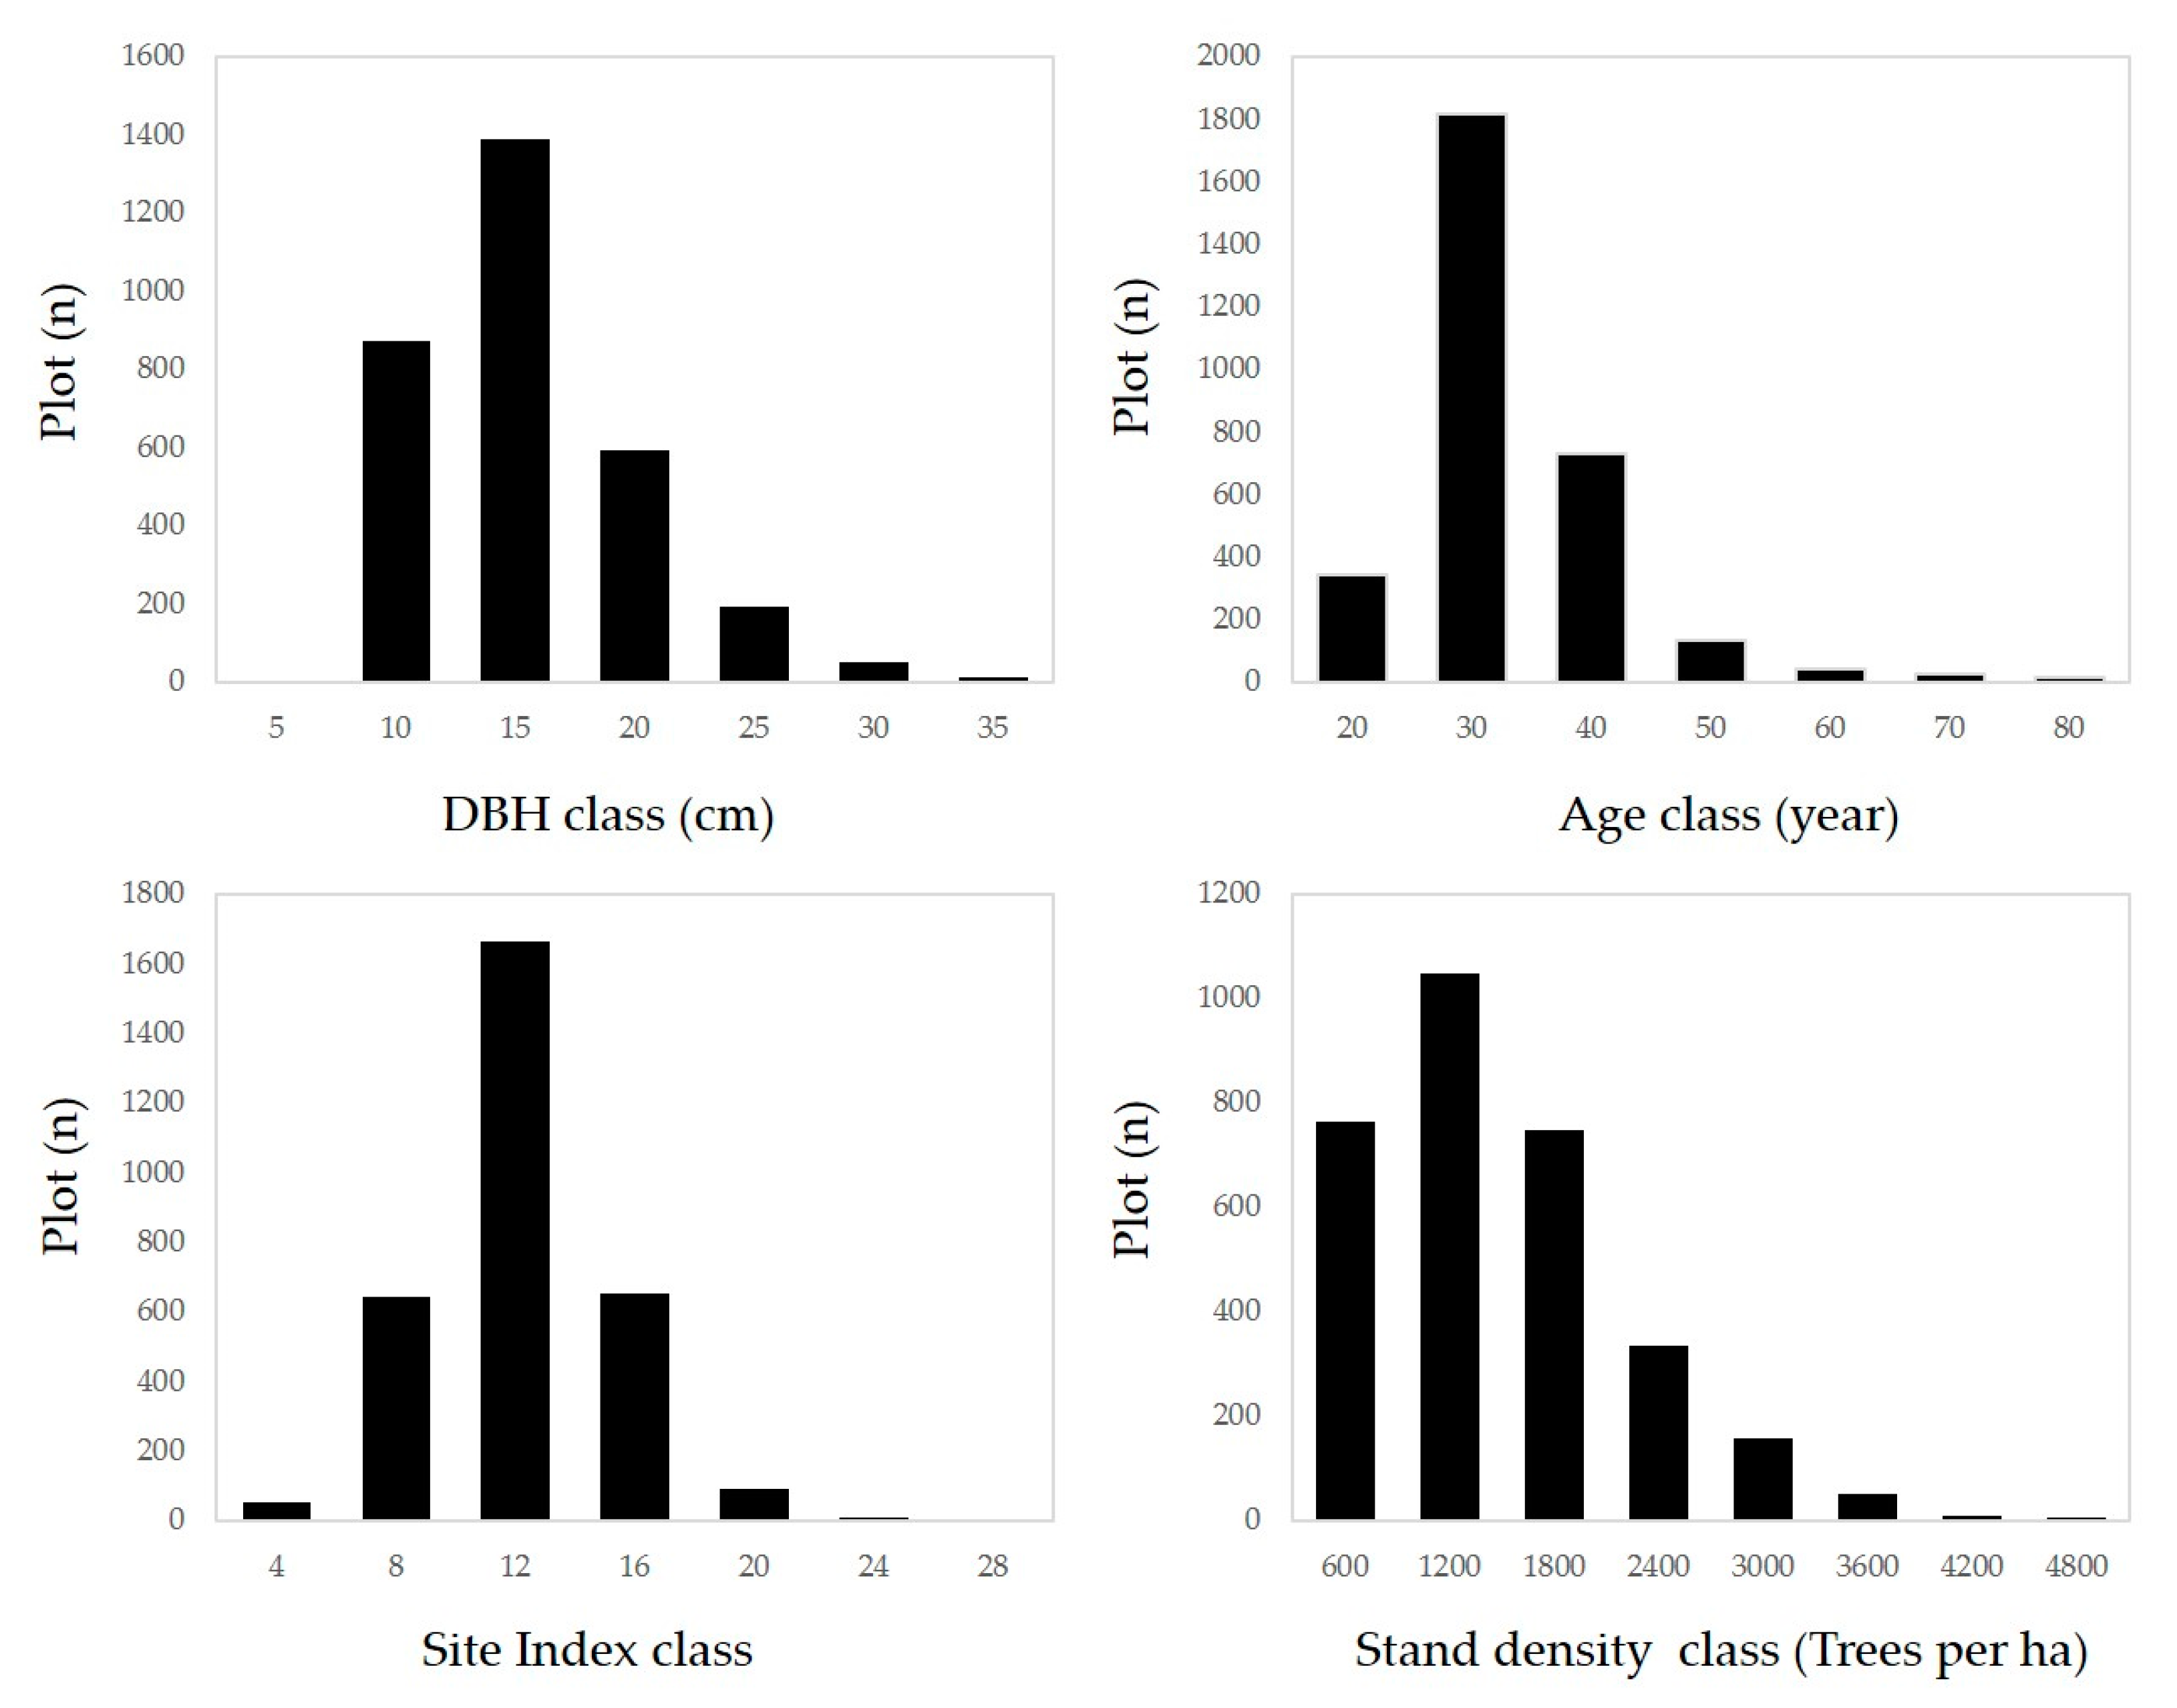
2.1. Study Area and Materials
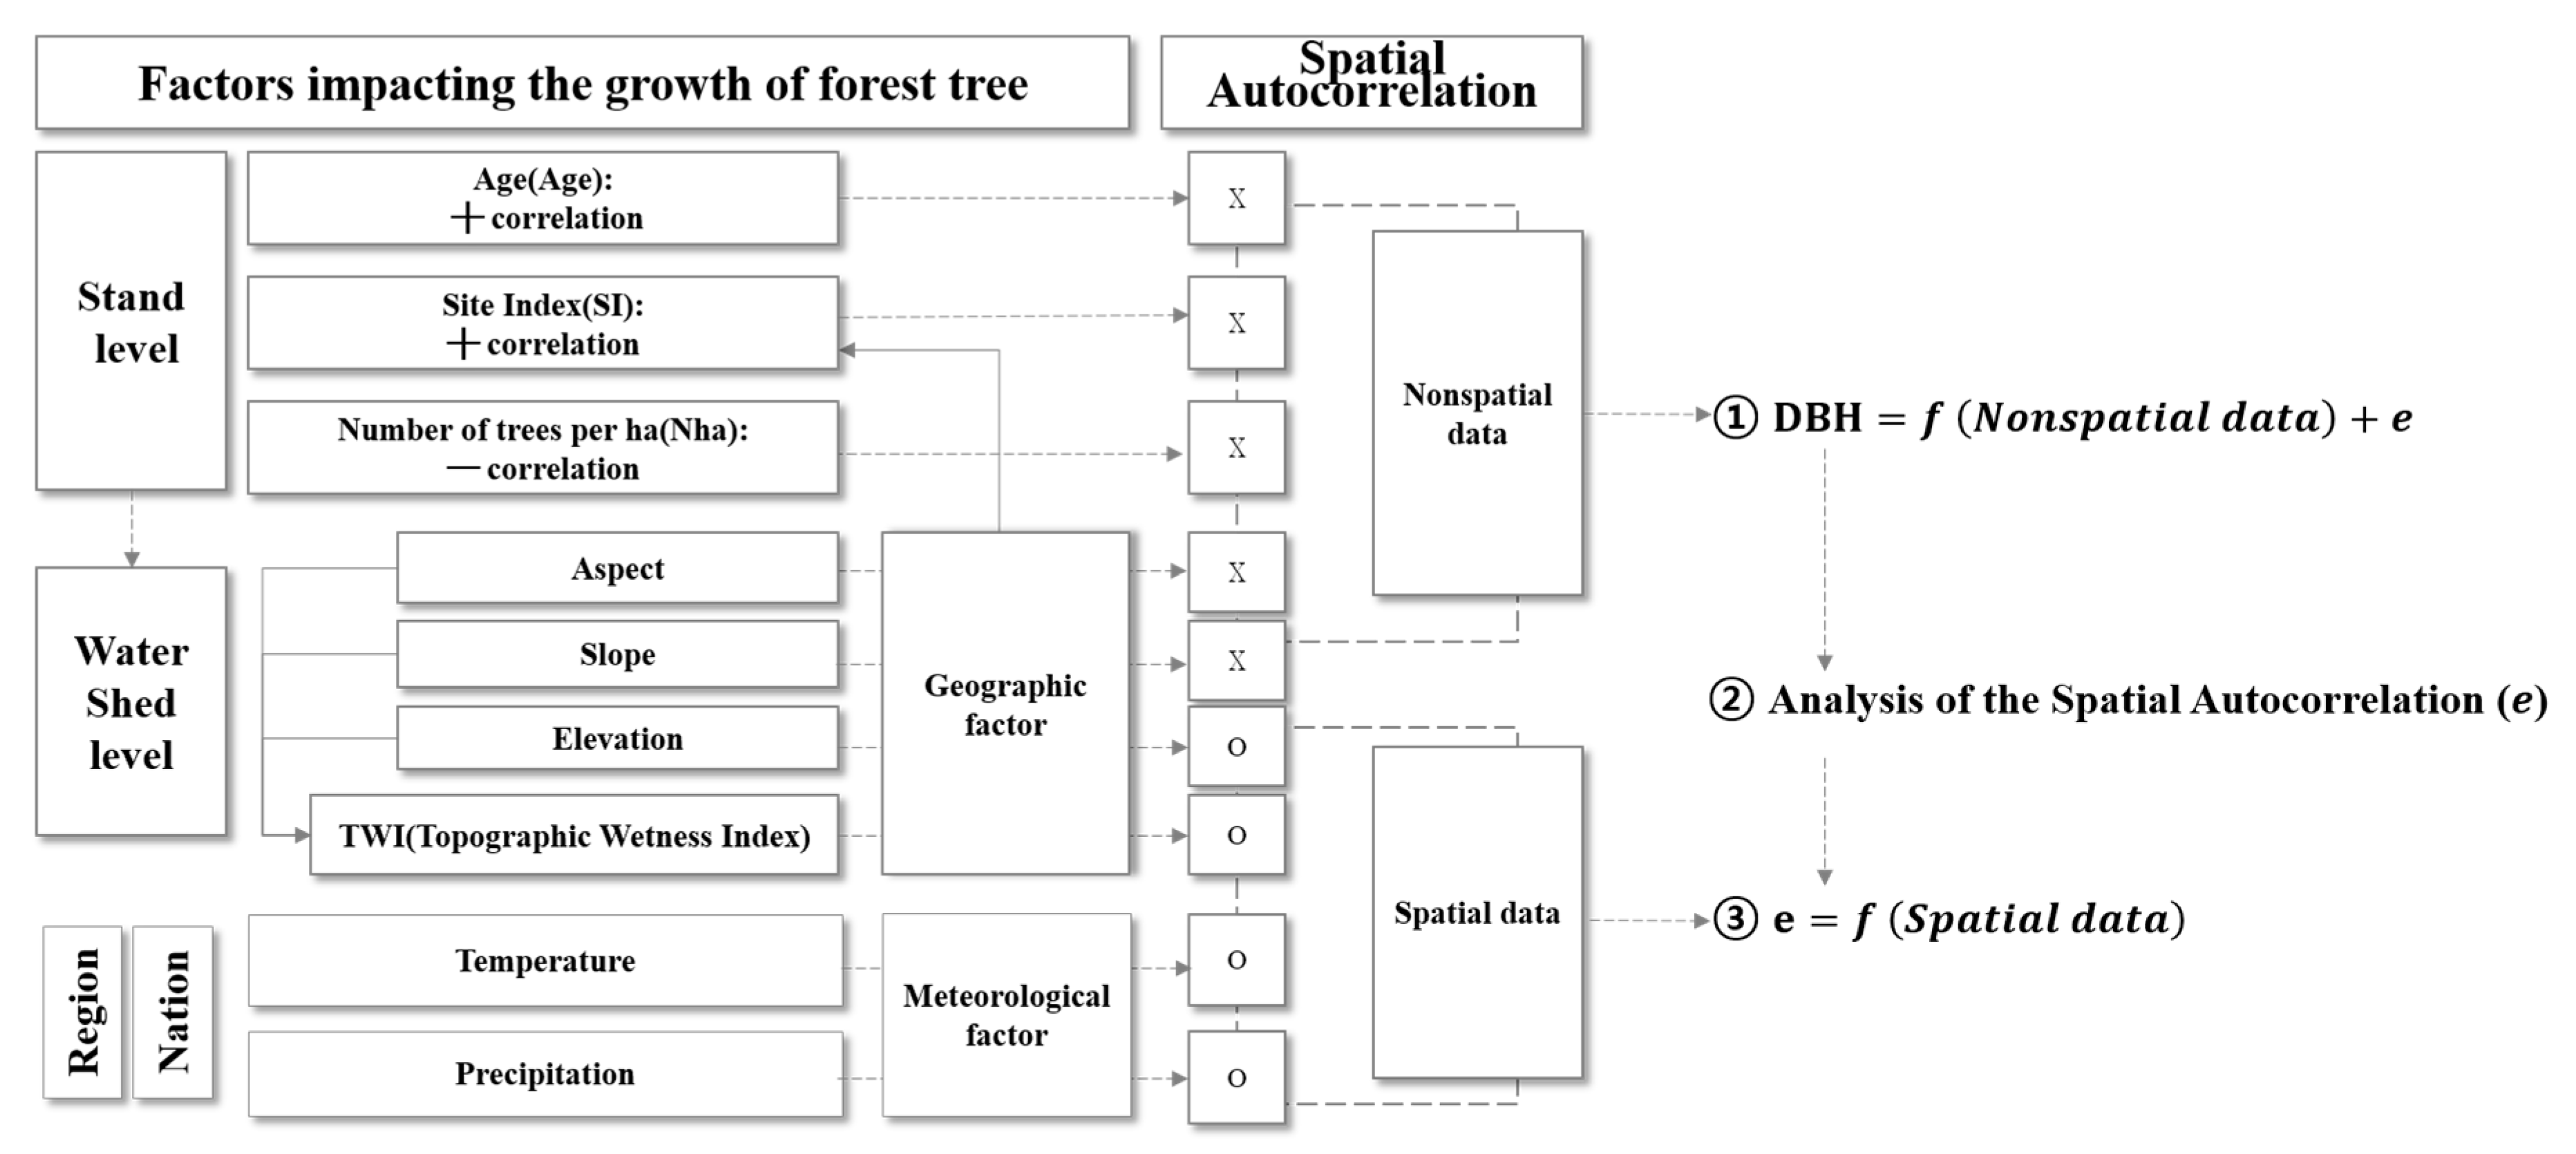
The study area (approximately 124°54′–131°06′ E and 33°09′–38°45′ N) covered the entire country of South Korea (100,201 km2). It has a wide variety of forest habitats, ranging from a warm temperate climate zone to a cold climate zone. The total forest area (6,450,438 ha) accounts for 64% of the total land area of South Korea. Forests of South Korea consist of coniferous forest (approximately 38%), oak forest (47%), mixed forest (12%) and other types (3%) [25].
The Korean National Forest Inventory (NFI) uses a standard design, in which sample points are placed at nodes of each a 4 × 4 km grid (Figure 1) [26]. A systematic 4-km grid was created for permanent plots in South Korea when the Korean NFI was established in 2006–2010 [27]. Four circular sample plots were located at the intersection of each 4 × 4 km grid line. Each sample plot (31.6 m radius) covered 0.16 ha. Each year, 20% of grid locations were sampled. As such, the entirety of South Korea was sampled during the inventory period. Forest characteristics (tree species, age and height), DBH, number of trees with a diameter greater than 6 cm and topographical factors (coordinates, elevation, slope and aspect) were measured at all sites. In addition, in each plot, increment cores were obtained from approximately six dominant or co-dominant trees. One core per tree was extracted from trees at breast height from a direction parallel to the slope using an increment borer. Each tree age was defined using an increment core. The stand age of a plot was defined by the mean age of six trees. Tree species in plots were identified according to basal area of the dominant species. If the basal area of red pine occupied more than 75% in a plot, the plot was considered a “red pine” stand.
In this study, NFI data were used. The data investigated approximately 4000 fixed sites nationwide. Each site consisted of four subplots and a total of 16,000 stand survey data (species, age, site index, diameter, etc.). In addition, the data included all observed management information such as thinning and harvesting and observed disturbance information such as wind damage, forest fire and landslides. This study did not consider the effect of human activities (management) and disturbances on DBH development. In order to estimate the DBH development site and climate, a total of 1647 plots were excluded under the consideration of the management and disturbance information listed above. In addition, a total of 5292 plots (among 6939) corresponding to the major species that exist in Korea were used in our analyses (Table 1). These included Pinus densiflora Siebold & Zucc., Larix kaempferi (Lamb.) Carr., Pinus koraiensis Siebold & Zucc., Quercus variabilis Blume and Quercus L. total (Quercus variabilis Blume and Quercus mongolica Fisch. ex Ledeb.). This study was conducted based on detailed and comprehensive data collected at national scales; the conditions of the stands, such as age, site index and stand density, were very diverse in each space, such as for Pinus densiflora Siebold & Zucc. (Figure 2).
Recent (2000–2013) automated weather station (AWS) observed data such as temperature and precipitation obtained from the Korean Meteorological Administration (KMA) were used to analyze the relationship between the DBH development and climatic indicators. These data were converted to grid-type data with a spatial resolution of 1 × 1 km by using an interpolation method described previously [28]. NFI data were split into two sets: the majority (90%) was used for model development, and the remaining data (10%) in each diameter class for each species were randomly selected and reserved for model validation. Results of basic statistics for the datasets are summarized in Table 1.

2.2. Method

This study was conducted to develop an integrated DBH estimation model by considering both climatic factors and stand-level variables. Factors that might influence tree growth were classified into three spatial categories, namely stand-level, watershed-level and regional-level (Figure 3).
Stand-level factors (age, site index and stand density) and some watershed-level factors such as aspect and slope can be called “non-spatial data” because they do not show any spatial autocorrelation. Factors such as age, site index, number of trees per ha, aspect and slope, within the range of 4 km, did not elicit spatial autocorrelations, whereas elevation, the topographic wetness index (TWI), temperature and precipitation yielded spatial autocorrelation at ranges over 4 km (Figure 4). Therefore, they are called “spatial data.” When these non-spatial data and spatial data are used together in a regression model, the fitting performance of the spatial data might lead to low significance. To address this issue, we developed an integrated DBH estimation model in the following three steps.
First, a diameter model for DBH estimation was developed using stand-level factors without spatial autocorrelation. According to previous research in forestry science, forest growth is largely indicated by stand-level factors such as age, site index and stand density [16,30,31,32]. Therefore, stand-level factors that could affect tree growth were assumed as the main indicators of DBH estimation. They were used in the DBH estimation model to estimate DBH. The model is simple and can be applied in practical forest management and planning.
Second, a residual model was developed to predict the relationship between residuals and climate factors with spatial autocorrelation by including temperature and precipitation as sub-indicators. Climate has spatial patterns at any spatial scale. Although the estimation model might have a good statistical fit with a random pattern of residuals, residuals might exhibit spatial autocorrelation if climate influences tree growth [33]. In addition, residuals of tree estimate models might serve as indicators of altered environmental conditions [34].
Finally, the diameter model and residual model were integrated to develop an integrated DBH estimation model, in which DBH could be predicted by climate factors (mean temperature, temperature (sum) in the growing season and precipitation in the growing season) and stand-level factors (age, site index (SI) and number of trees per ha (Nha)).

2.2.1. DBH Estimation Model with Stand Age, SI and Nha

Among various factors, age, SI and Nha from NFI data were used to develop the DBH estimation model in this study. According to Moore et al. [35], the NFI data have been split into two sets: the majority (90%) was used for model development; 10% of trees in each diameter class for each species were randomly selected and reserved for model validation. In addition, three candidate curve equations were carefully designed to reflect the characteristics of each tree species (Equations (1)–(3)). This study focused on the DBH estimation model in accordance with previous studies. Elicited results showed that nonlinear regression had a better performance than linear regression of DBH development in a stand [36,37]. Therefore, we did not implement additional linear regressions. The best regression among these three equations was selected for each tree species. Therefore, in this study, nonlinear regression was adopted and performed using SAS 9.2 software (SAS Institute, Cary, NC, USA).
D B H = a a g e b S I c N h a d
D B H = e ( a + b a g e + c S I + d N h a )
D B H = a e b ( 1 a g e ) S I c N h a d
where DBH is diameter at breast height; age refers to stand age; SI is the site index; Nha is the stem number per hectare (stand density index); and a, b, c and d are coefficients.

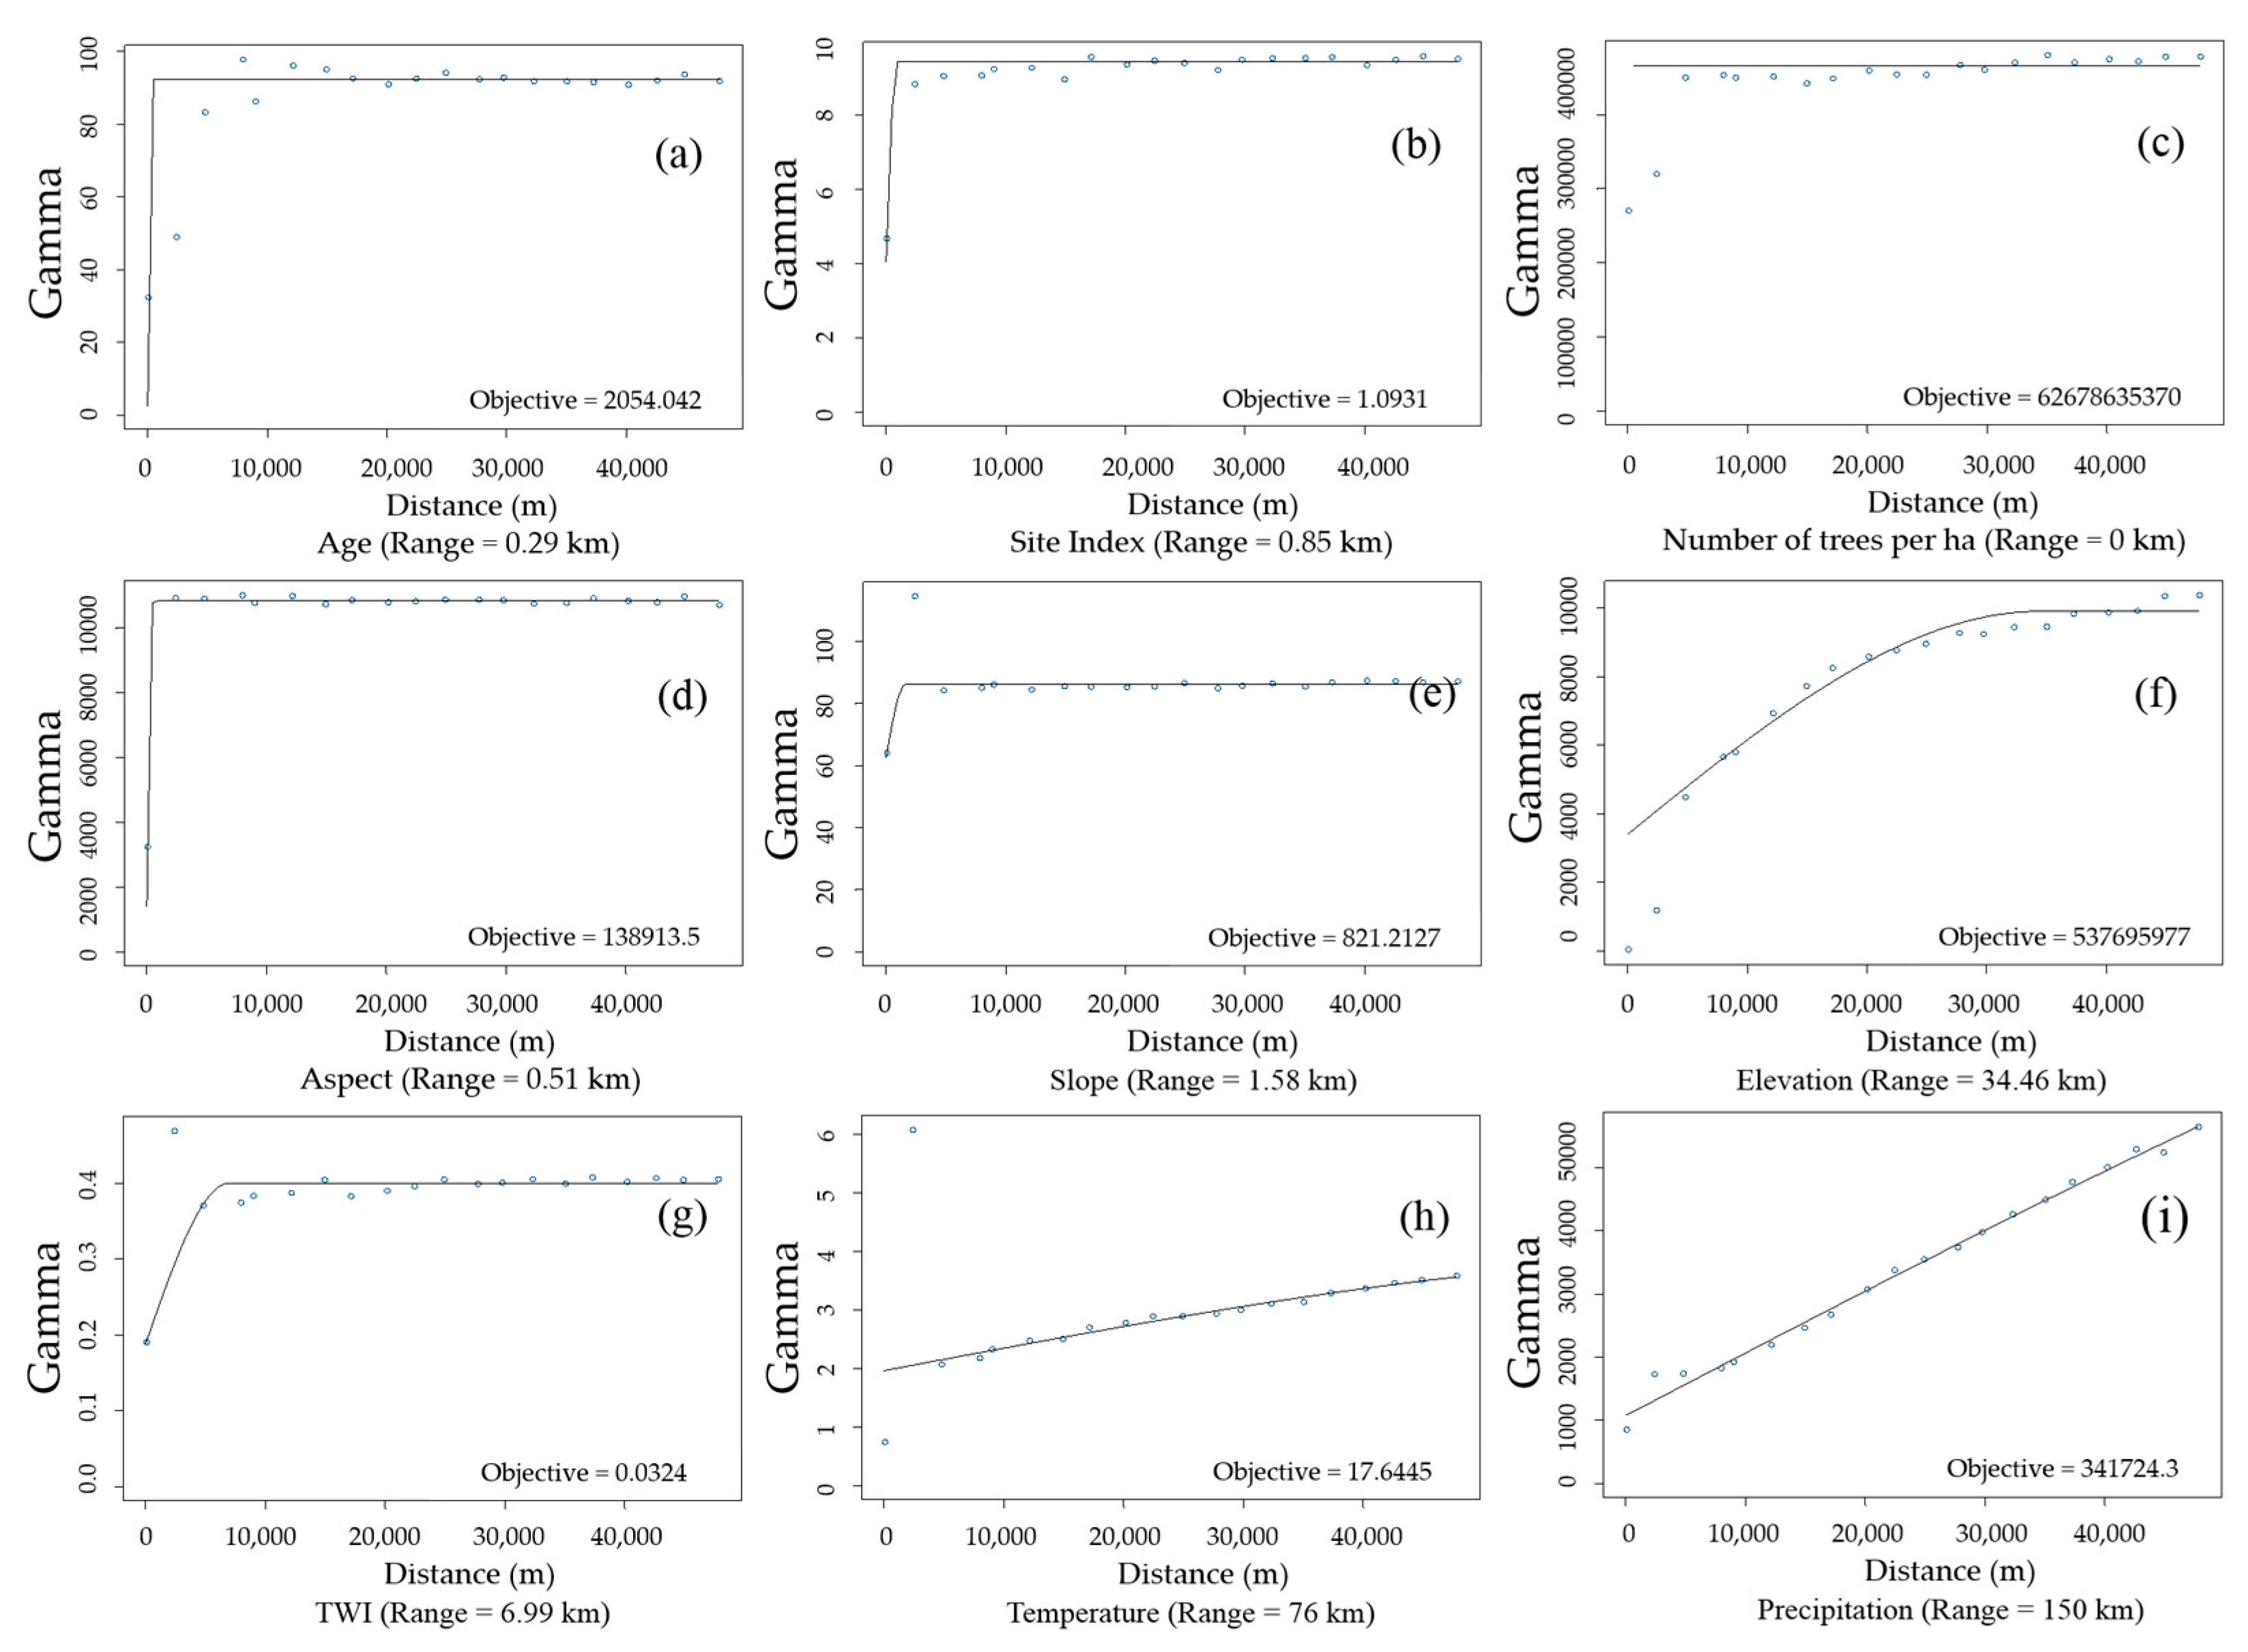
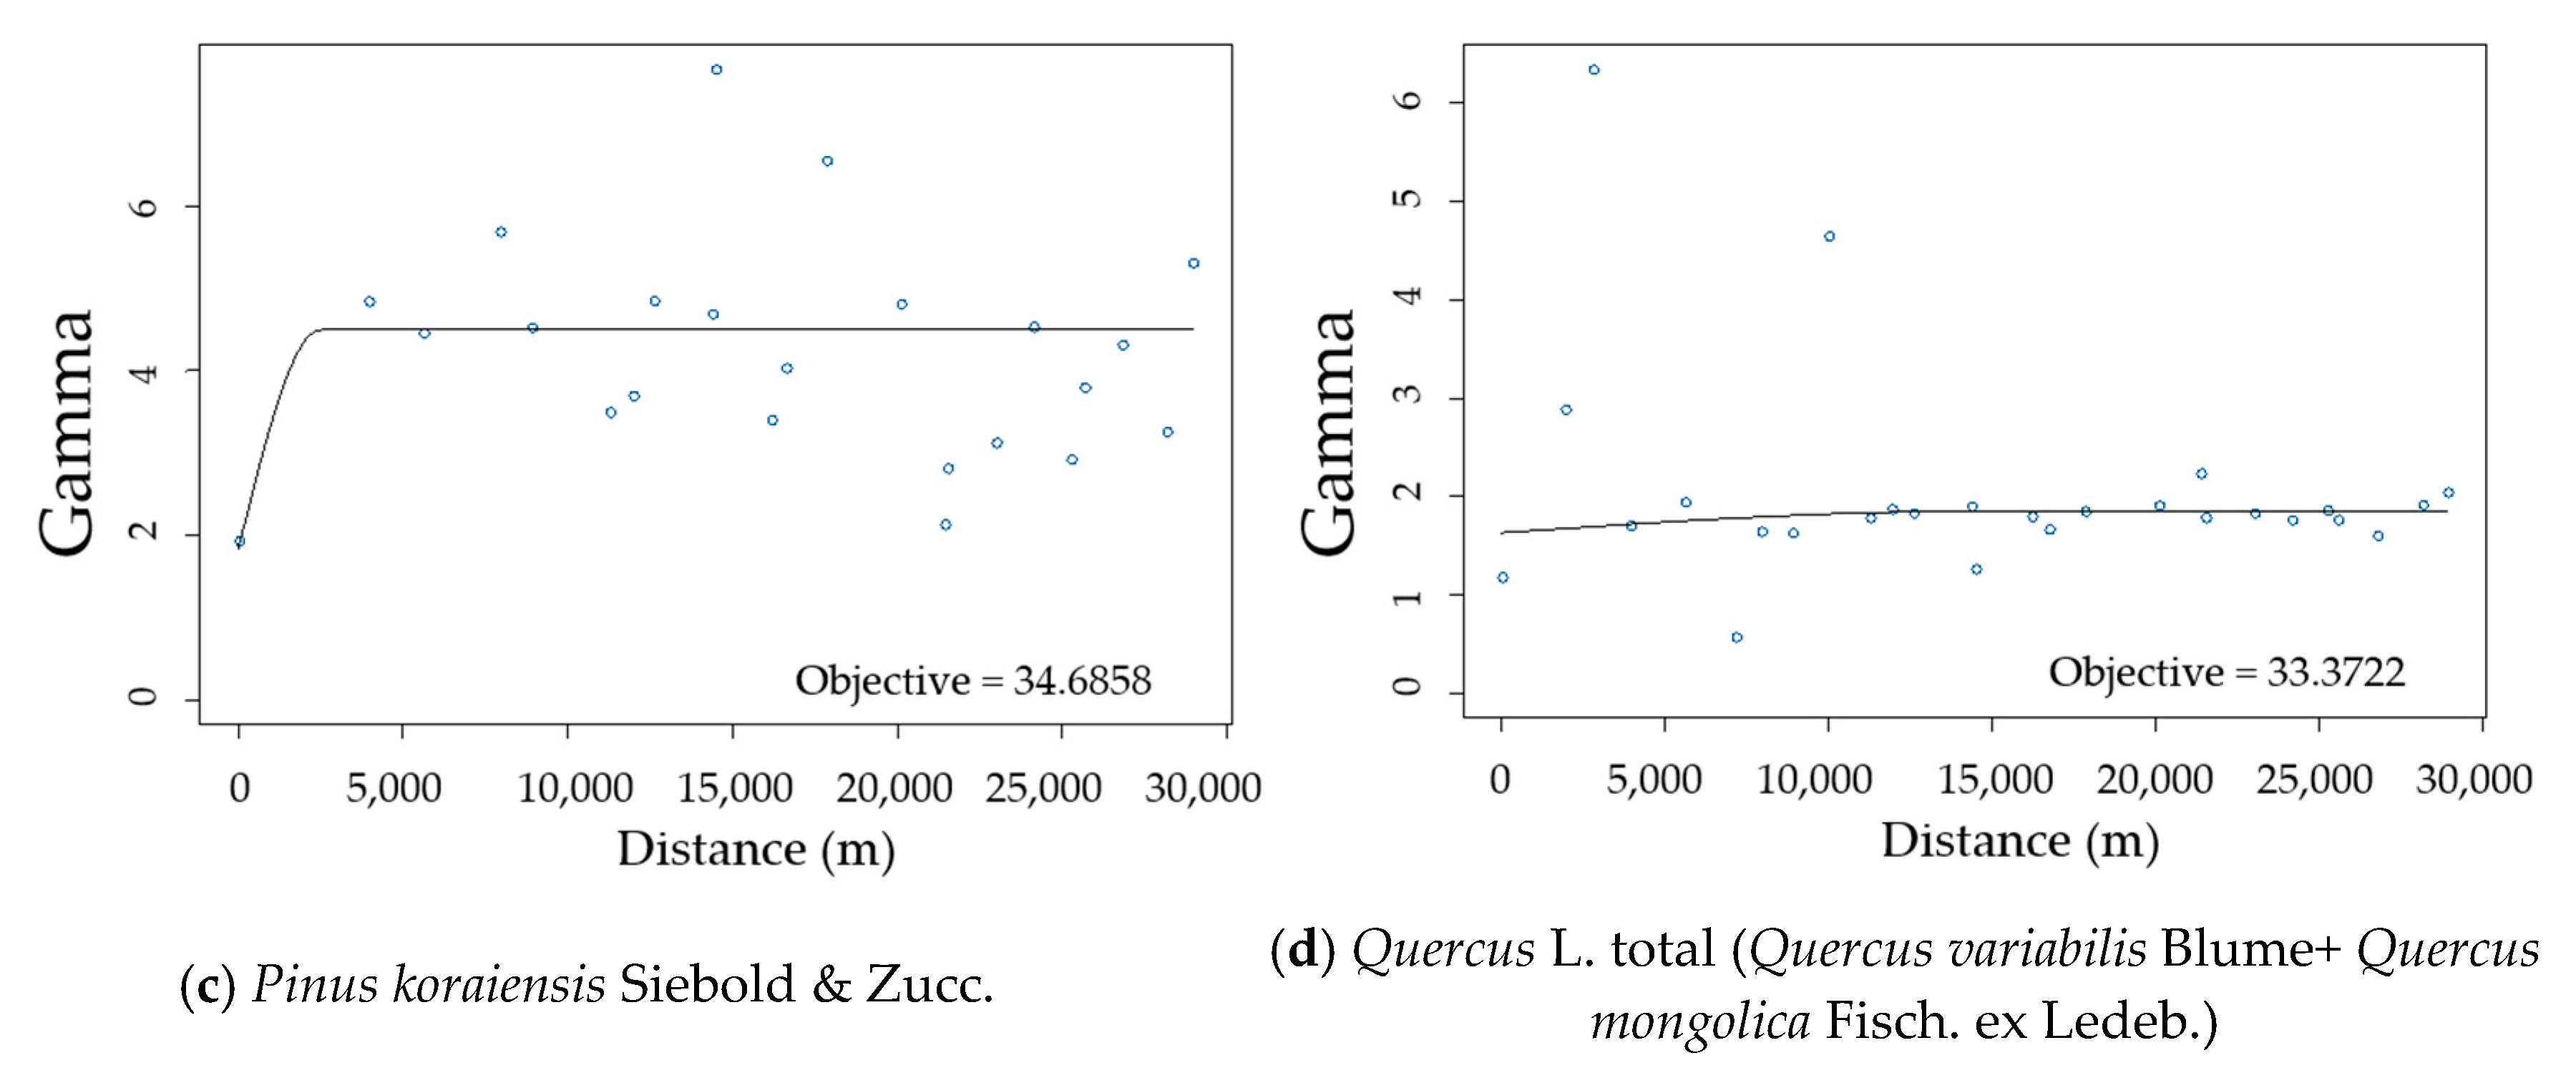
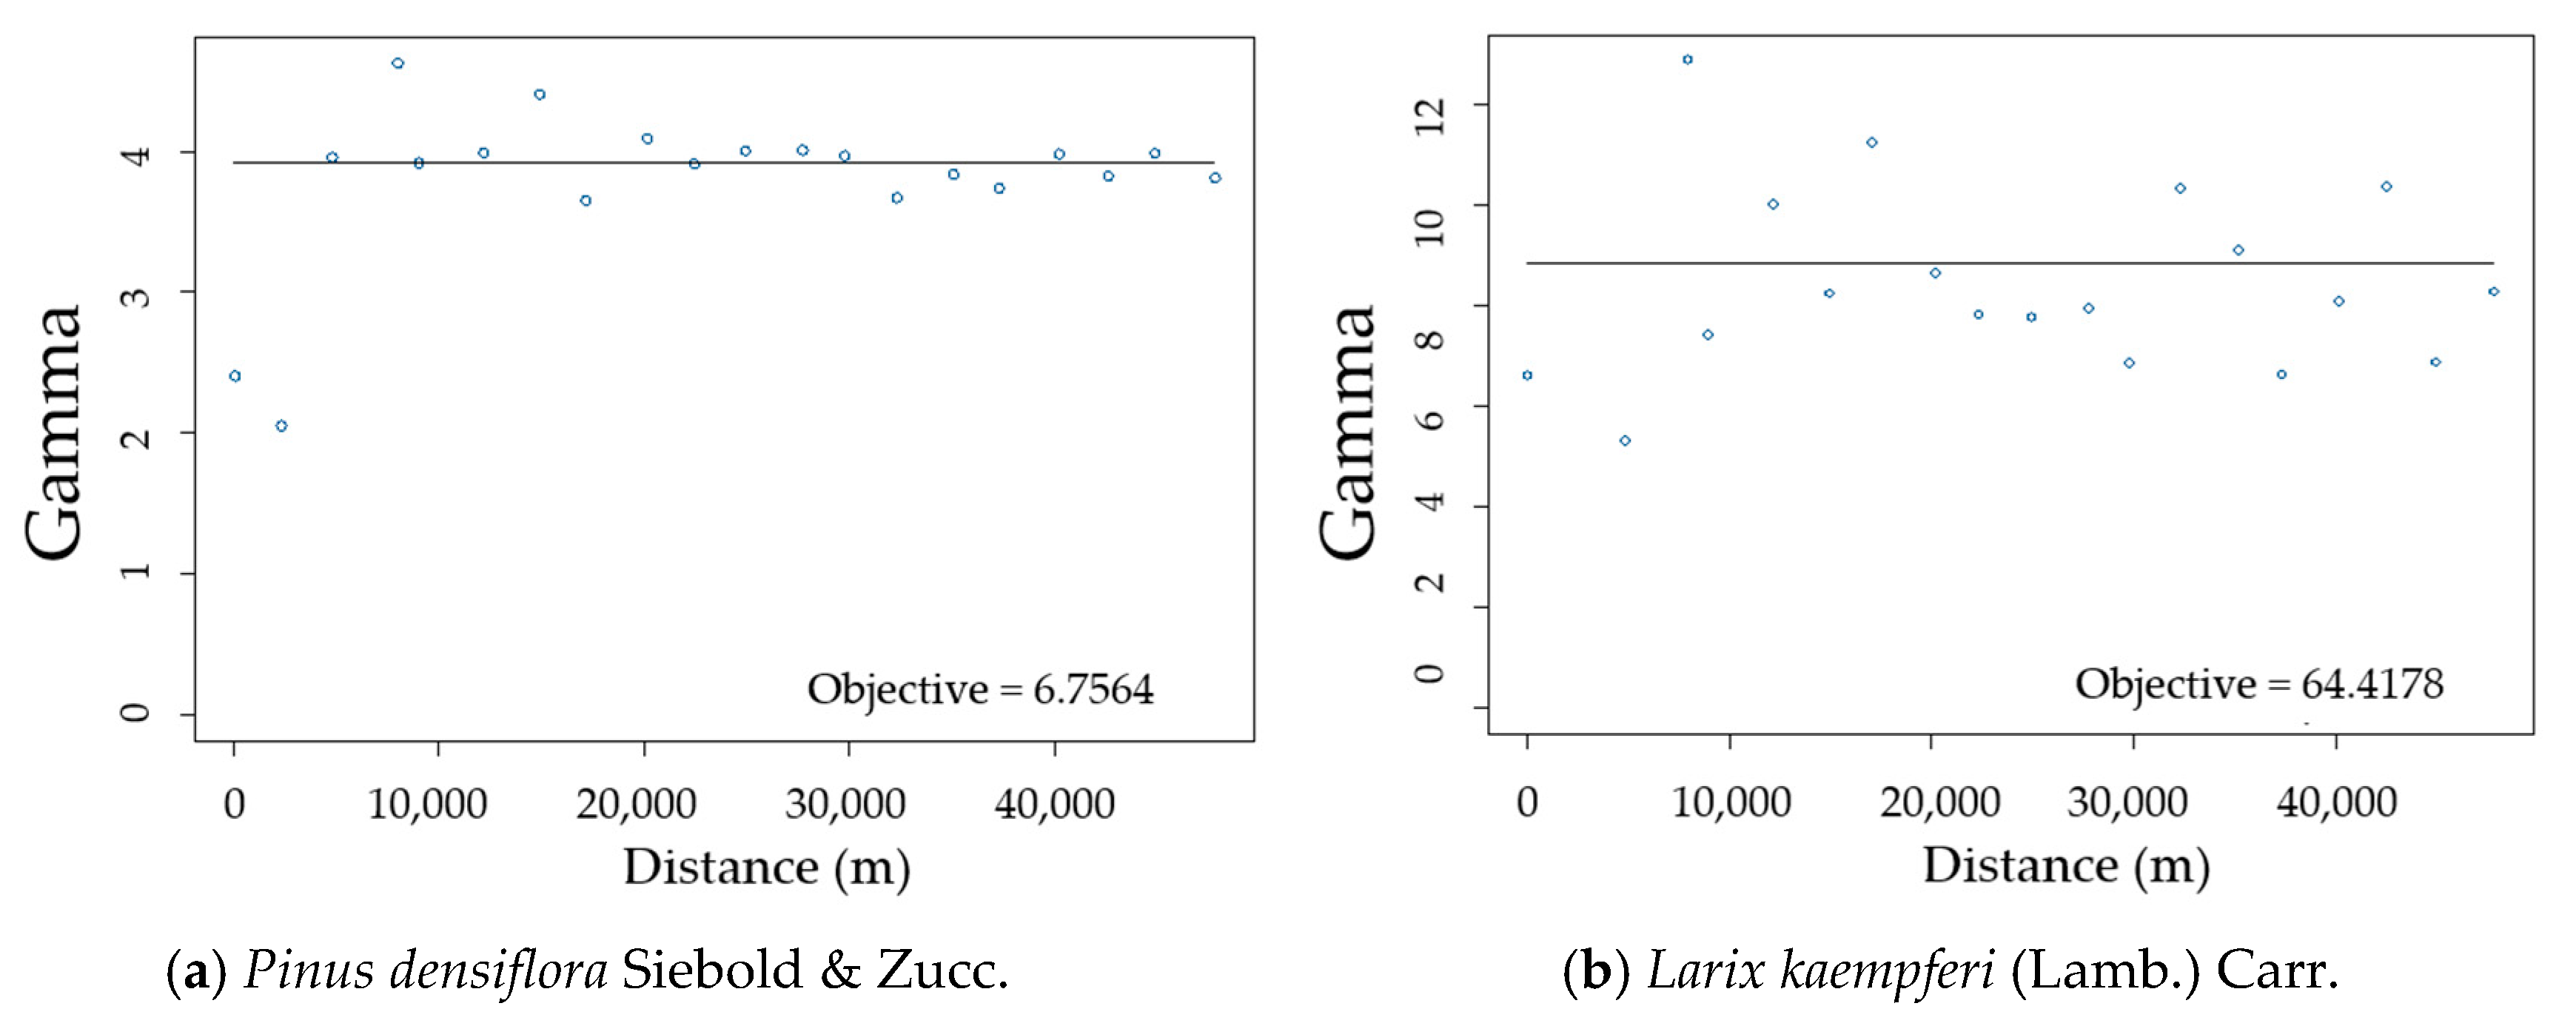
2.2.2. Semi-Variogram Analysis for Residuals of the DBH Estimation Model

“Spatial autocorrelation” is a correlation among values of a single variable strictly attributable to their relatively close locational positions on a two-dimensional (2D) surface. It introduces deviation from the independent-observation assumption of classical statistics. Spatial autocorrelation exists because real-world phenomena are typified by orderliness, (map) patterns and systematic concentration rather than randomness. If differences in residuals exist at the regional level because of other factors such as climate and topographic factors, residuals will show spatial autocorrelation. The semi-variogram has been used to analyze spatial variability [38]. Therefore, semi-variogram analysis was performed in this study to identify spatial autocorrelation. Additional spatial parameters in residuals were estimated using the SPATIAL STATS sub-module of the S-PLUS Program [39]. In general, spatial autocorrelation is analyzed by the ratio of the nugget to the sill. The sill refers to the maximum observed variability of the data, whereas the nugget refers to the variability of the field data that cannot be explained by the distances among the observations. If the ratio is high, the chance of spatial autocorrelation is low. If the ratio is low, there is spatial autocorrelation [40].

2.2.3. Residual Model with Climate Variables

Residuals were differences between actual measurements and estimates of DBH. Residuals of empirical tree-prediction models accounting for tree size and between-tree competition with actual growth can also serve as indicators of changing environmental conditions [34]. According to existing studies [20,24,41], tree growth is associated with precipitation and temperature. If residuals are spatially autocorrelated, the relationship between tree growth and climate factors can be analyzed quantitatively. Therefore, the relationship between climate factors and residuals of DBH was modeled using a simple linear function (Equations (4) and (5)) in the present study.
After regression analysis was performed on residuals and climate factors (temperature and precipitation) by using Equations (4) and (5), the final DBH model (Equation (6)) was derived by combining results of the regression analysis with one of the DBH estimation models (Equations (1)–(3)).
Byun et al. [12] used linear regression model to analyze the correlation between climate factors and tree growth and obtained relatively good results. Therefore, a linear regression model was used in this study to analyze residuals.
e i = a + b T M e a n + c P S e a s o n
e i = a + b T S e a s o n + c P S e a s o n
where i is permanent plot number; TMean is the mean temperature and TSeason is the temperature (sum) in the growing season during 2000–2013 at i; PSeason is the precipitation in the growing season during 2000–2013 at i; a, b and c are coefficients; and e is the residual of i.
Equation (4) is a model that considered both mean temperature and precipitation in the growing season as parameters in residual analysis, whereas Equation (5) considered temperature (sum) in the growing season and precipitation in the growing season. Finally, the equation with the better coefficient of determination (R2) was chosen for estimation as an integrated model.

2.2.4. Integrated DBH Estimation Model with Stand-Level and Climate Variables

In previous steps, the DBH estimation model and residual model for each tree species were selected by best performance, i.e., the highest R2 among models. The final model for each tree species was developed by integrating the optimal DBH estimation model and residual model. In the present study, a simple method was used for integration (Equation (6)).
I n t e g r a t e d   D B H   e s t i m a t i o n   m o d e l = S t a n d - l e v e l   D B H   e s t i m a t i o n   m o d e l + r e s i d u a l   m o d e l
In order to verify the accuracy of the integrated model, the R2 value of the model was calculated again. In addition, semi-variogram analysis was performed using residuals generated in the integrated model to confirm the self-spatiality of the residuals.

3. Results and Discussion

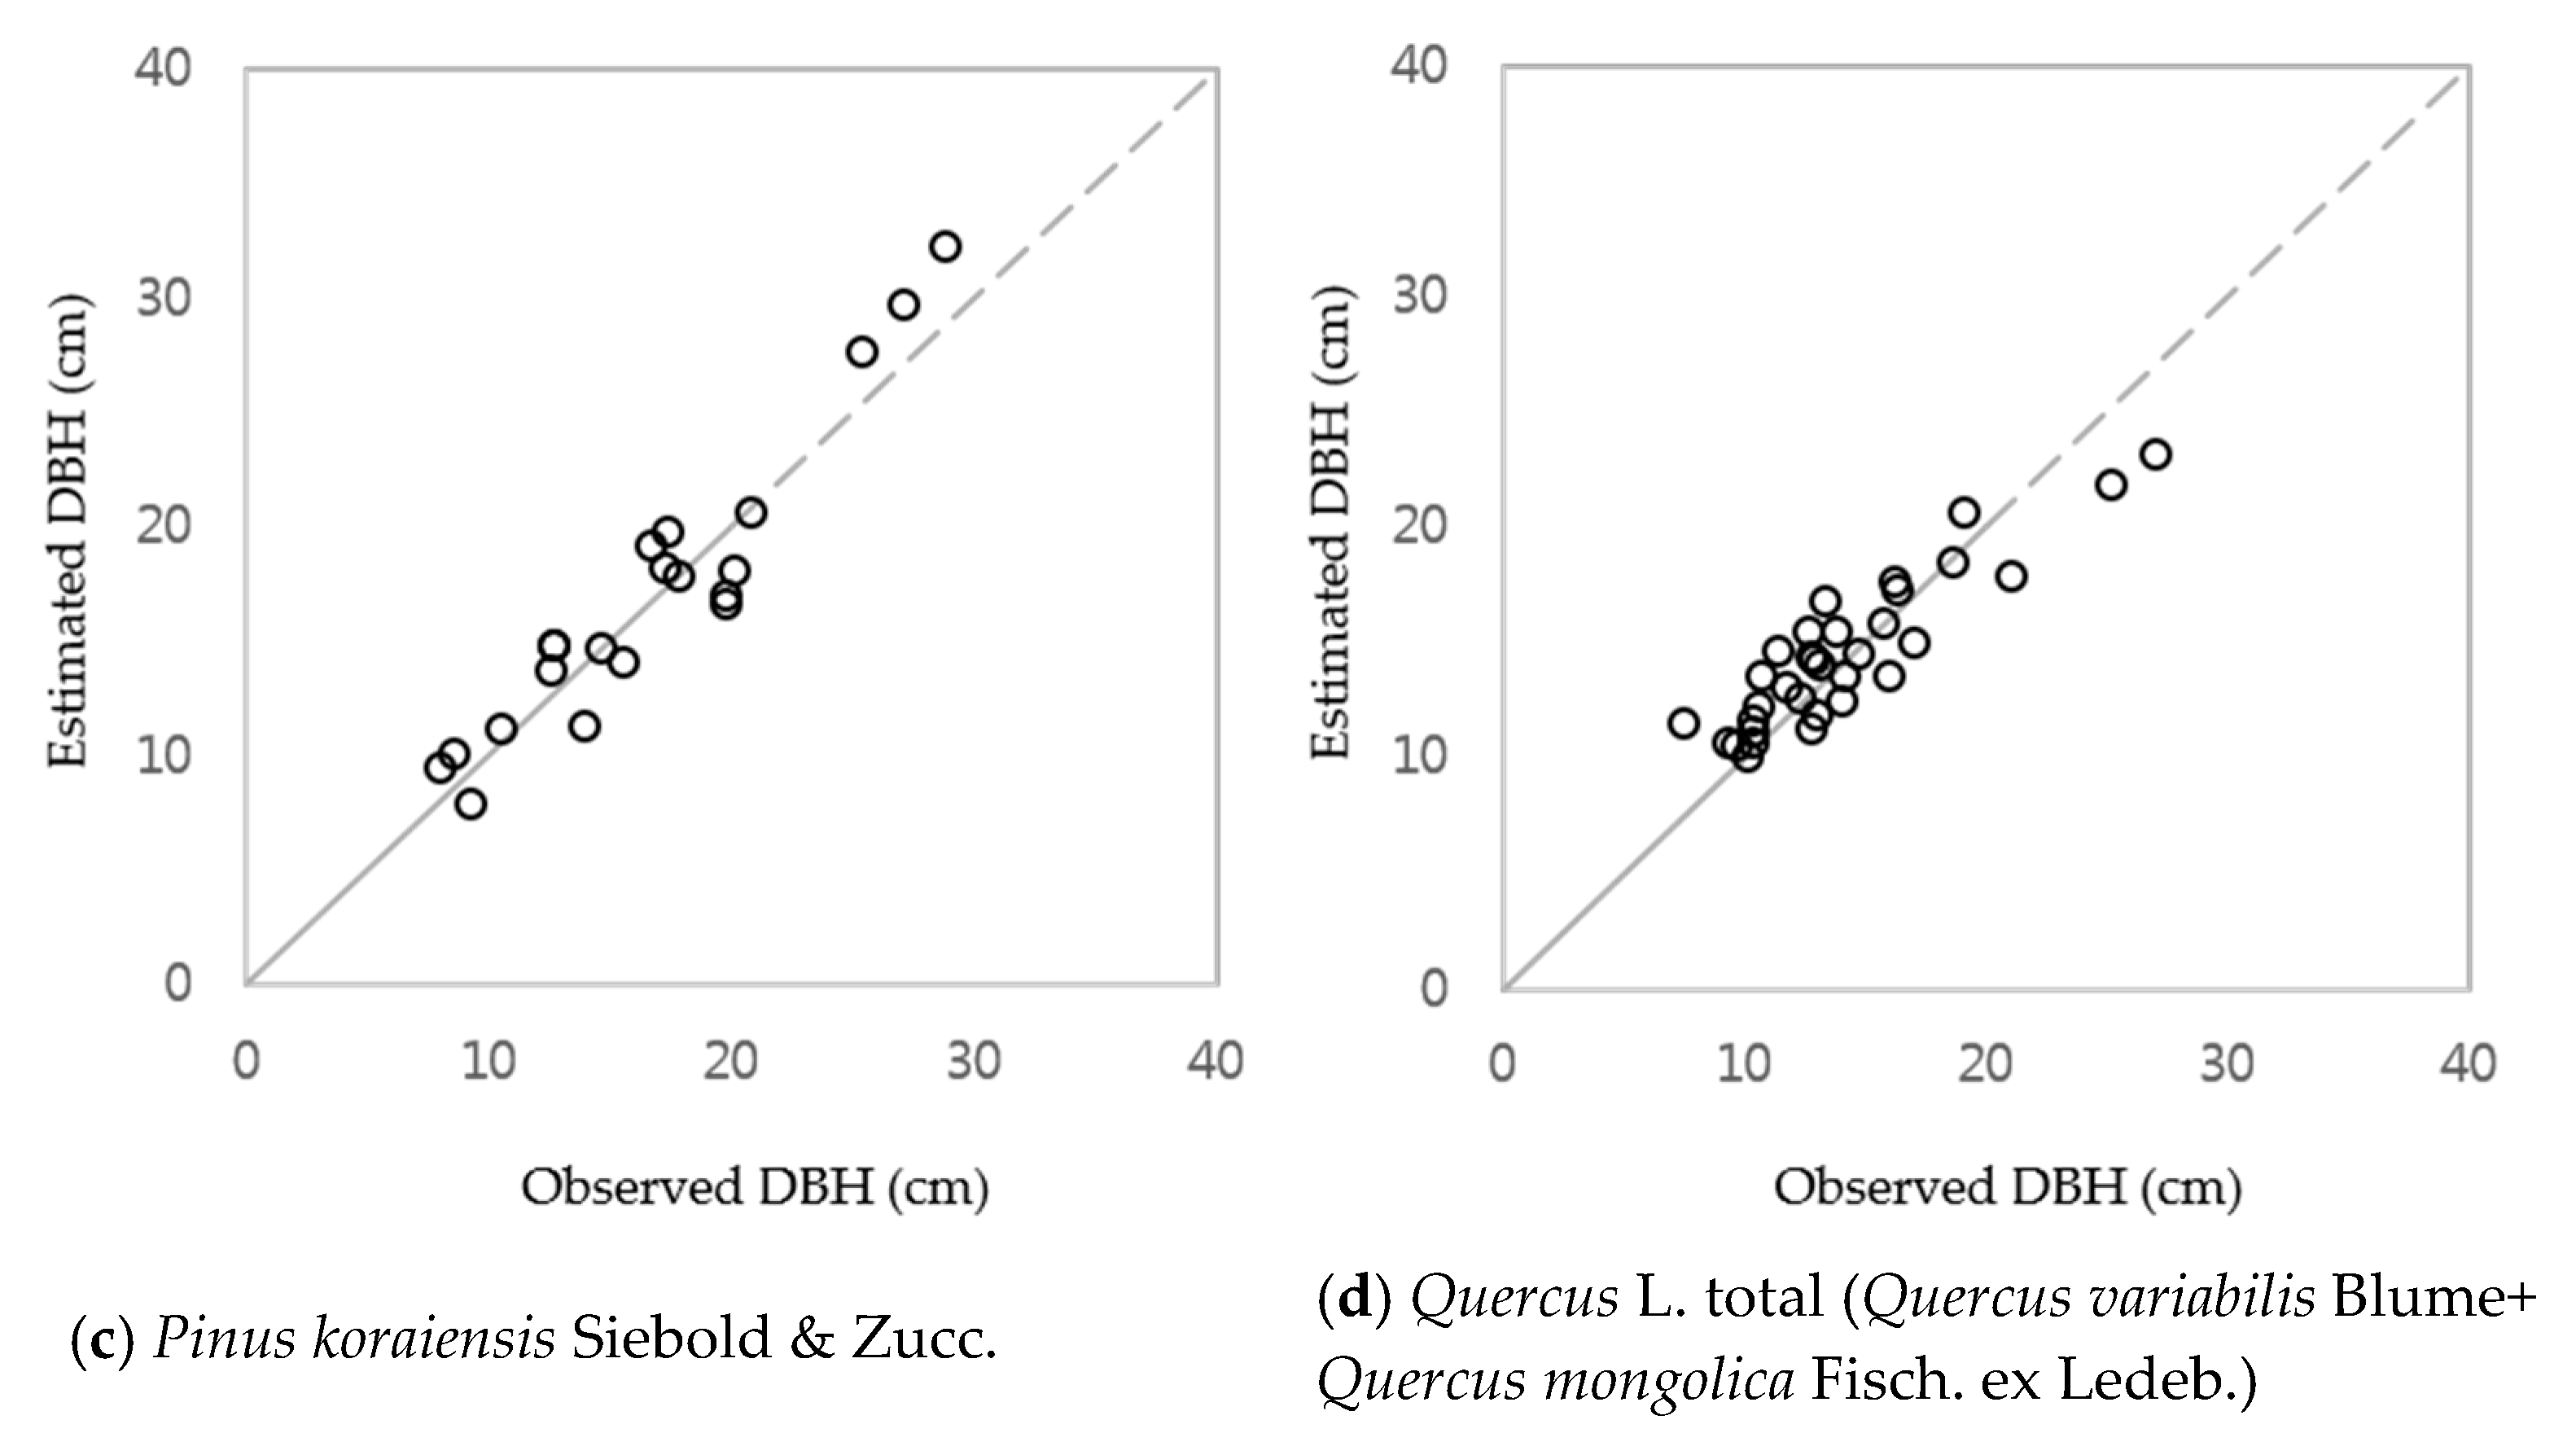
3.1. DBH Estimation with Stand Age, SI and Nha

DBH estimated from Equations (1) and (3) showed relatively good performance with relatively high correlation (ranging from 0.814–0.904) compared with that estimated from Equation (3) at the national scale (Table 2). Equation (3) was selected as the optimal model for DBH estimation of Pinus densiflora Siebold & Zucc., Larix kaempferi (Lamb.) Carr., Pinus koraiensis Siebold & Zucc., Quercus variabilis Blume and Quercus L. total (Quercus variabilis Blume and Quercus mongolica Fisch. ex Ledeb.) because it has better performance (higher R2 and lower AIC and RMSE) than Equations (1) and (2). The R2 values of the optimal model for Pinus densiflora Siebold & Zucc., Larix kaempferi (Lamb.) Carr., Pinus koraiensis Siebold & Zucc., Quercus variabilis Blume and Quercus L. total (Quercus variabilis Blume and Quercus mongolica Fisch. ex Ledeb.) were 0.835, 0.790, 0.904 and 0.814, respectively. However, Cameron et al. [42] suggested that the coefficient of determination (R2) is not advisable for assessing nonlinear regression models. Therefore, this study evaluated the performance of the models by consideration of the root mean square error (RMSE) and Akaike’s information criterion (AIC) [43]. As a result, among the three equations, Equation (3) shows the best performance in R2, RMSE and AIC (the lower AIC and RMSE are the higher significance of the model) (Table 2).
All parameter estimates for Equations (1) and (3) for each tree species were logical and significant at p = 0.001 level (Table 3 and Table 4). Comparing the significance of Equations (1) and (3), Equation (3) has better performance than Equation (1) for all tree species. According to Table 3, the coefficient b (indicate stand age) of Larix kaempferi (Lamb.) Carr. is estimated to be higher than the other tree species. These results showed that the diameter growth of Japanese larch is relatively high and slowed more sharply with age than for the other main tree species. This result was similar to that presented in previous studies [33].
These results indicated close correlation between stand-level factors and DBH. The correlation coefficients for age and SI were positive for all cases, suggesting that increasing DBH would promote the competition between trees and, then, cause slower diameter growth; which means, DBH decreased with tree density in the stand.
The DBH for each species was then calculated based on these results. Coefficients b, c and d reflected the effects of age, SI and Nha, respectively, on DBH. The effect of SI on DBH for Pinus densiflora Siebold & Zucc. was higher than that for the other species. Unlike the other species, Quercus L. total was more affected by Nha. These findings might contribute to forest management based on tree species.
The measured and estimated DBH for 10% of NFI data by tree species are shown in Figure 5. The models exhibited good performance in explaining variation in DBH by stand age.
Statistical fit is very important for determining whether a prediction model is adequate. It is even more important when evaluating the ecological performance of a model over a wide range of stand conditions.
According to the Korea Forest Service [27], a close correlation exists between stand-level factors and DBH estimation. In addition, among the watershed-lever factors, elevation has a slight effect on DBH estimation; however, aspect, slope and TWI had almost no influence on forest growth [44]. No autocorrelation with either aspect or slopes was noted (Figure 3). In fact, elevation is one of the factors influencing DBH estimation. Conversely, factors such as elevation and temperature that have a close connection should not be used for the development of a model. In addition, we analyzed climatic factors in residuals; therefore, considering them in addition to watershed-level variables is not necessary.

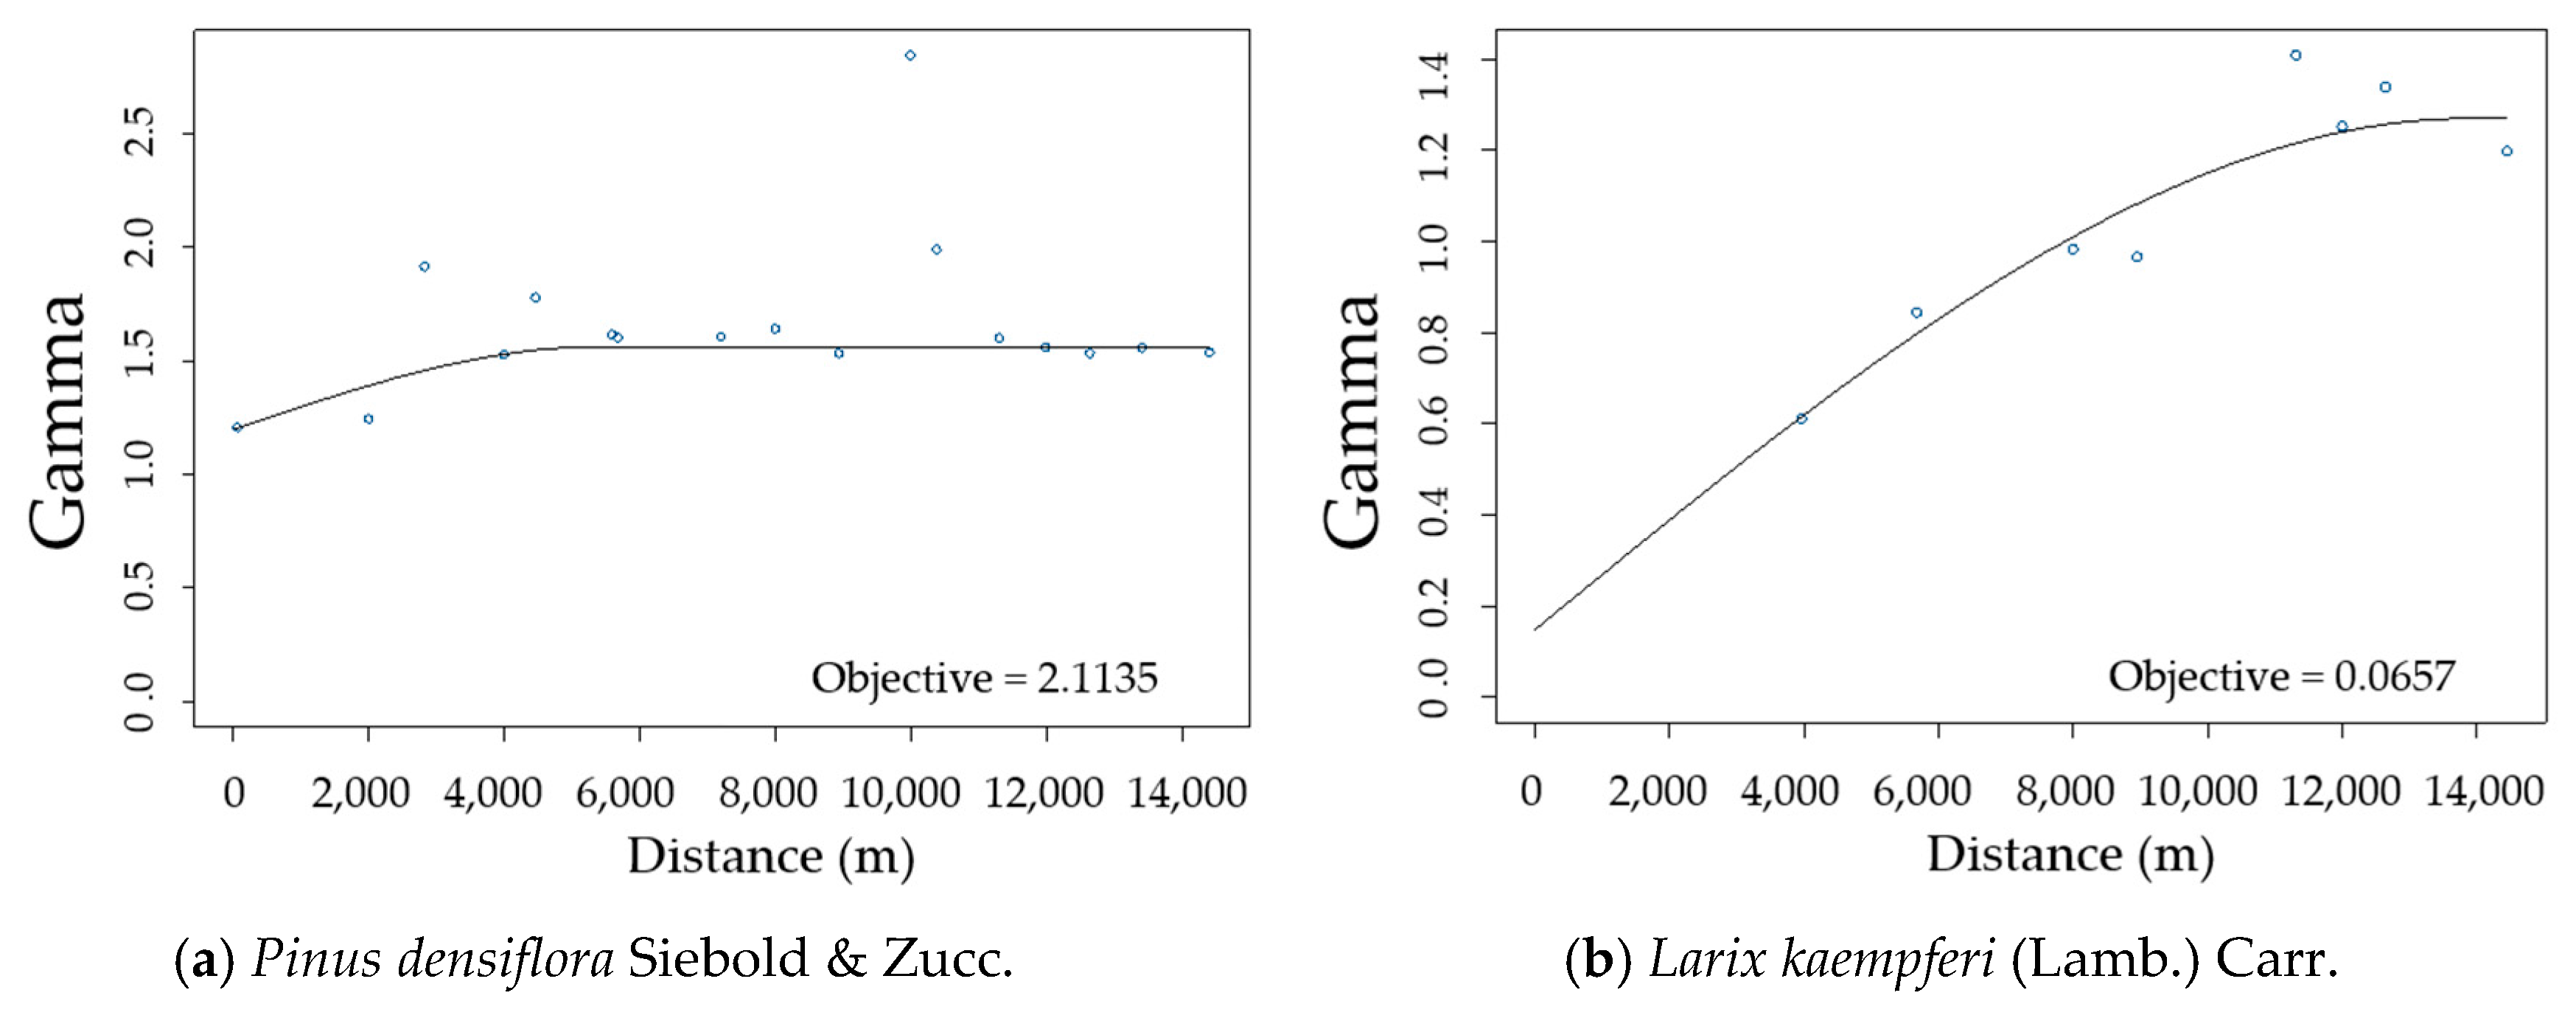
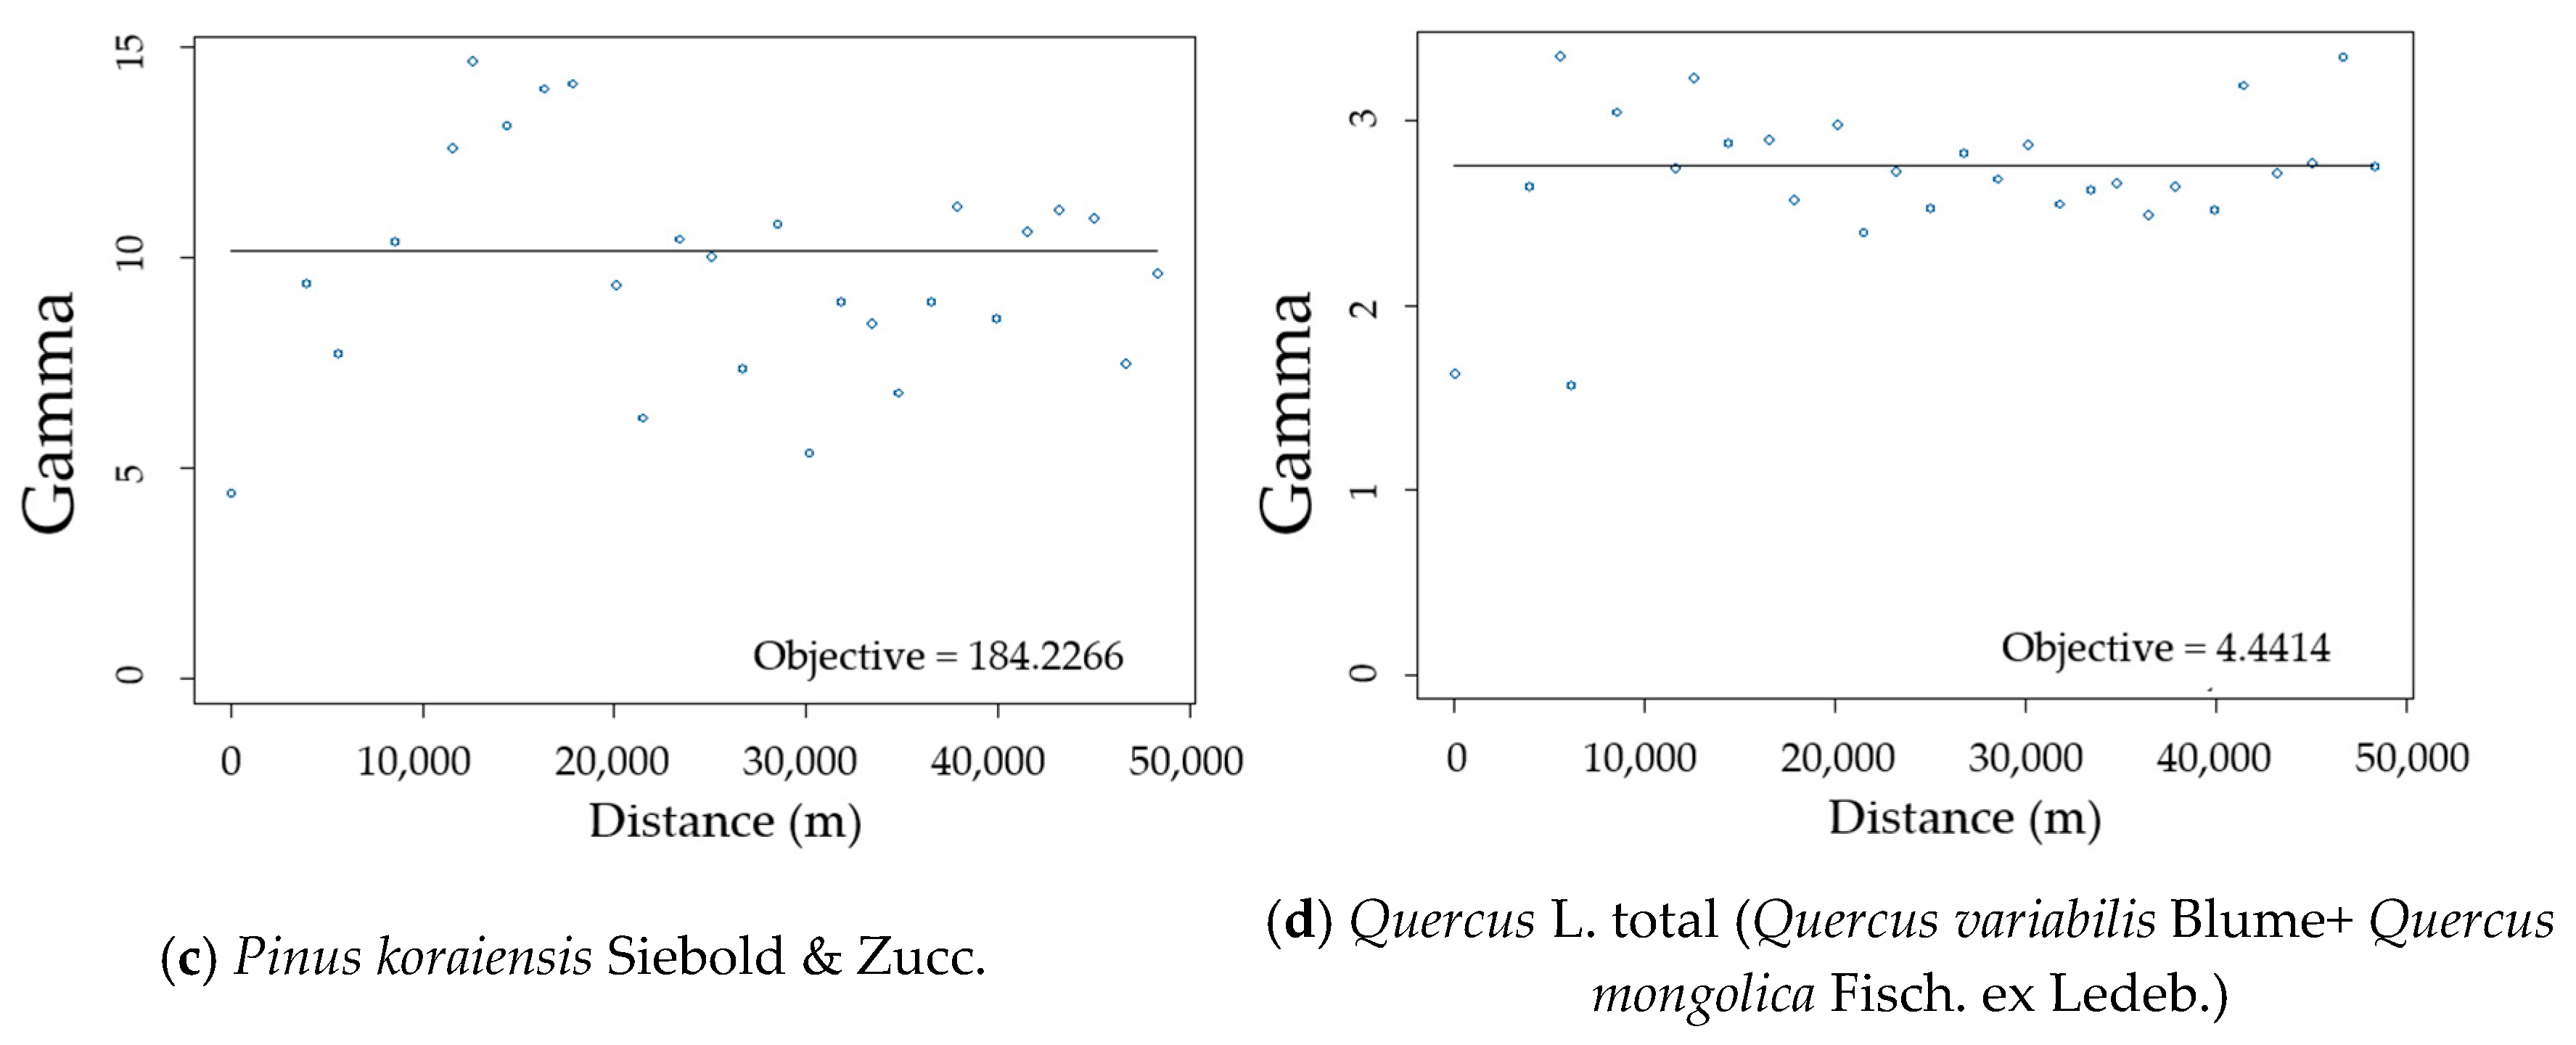
3.2. Spatial Autocorrelation of Residuals

Semi-variogram results of spatial autocorrelation of residuals by using the DBH estimation model with stand-level factors such as age, SI and Nha for each tree species are shown in Figure 6. The semi-variogram values for Pinus densiflora Siebold & Zucc., Larix kaempferi (Lamb.) Carr., Pinus koraiensis, Quercus variabilis Blume and Quercus L. total (Quercus variabilis Blume and Quercus mongolica Fisch. ex Ledeb.) from the DBH estimation model residuals were estimated to be 5.40, 11.73, 2.50 and 14.49 km, respectively, similar to the results shown in previous studies for South Korean forests [12,33].
Partial sill values of these species were estimated to be 0.365, 0.764, 2.68 and 0.22, respectively. These results suggest that coniferous species might vary in growth level because other factors have spatial autocorrelation in the range of 2.50–11.73 km. Conversely, the sill value was very low for Quercus L. total (Quercus variabilis Blume and Quercus mongolica Fisch. ex Ledeb.), indicating that a relatively low degree of spatial autocorrelation might be present in the DBH estimation model residuals of Quercus L. total (Quercus variabilis Blume and Quercus mongolica Fisch. ex Ledeb.).
Forests in South Korea cover a total area of 6.3 million ha with complicated topography, such as mountainous areas. The average size of stands was 13.2 ha based on the Fifth Korean NFI map. Thus, having the same topographic and forest characteristics in a forest with a spatial size of 6.25 km2 (i.e., a linear distance of 2.49 km for each side of a square plot) is practically impossible. Therefore, such spatial autocorrelation might be associated with climatic factors rather than topographic factors.

3.3. Residual Model with Climate Factors

Analysis of residuals was implemented based on the consideration of climatic factors for DBH development of each tree species. The effect of mean temperature on DBH development can be more clearly noted in Table 5 and Table 6. All coefficients were statistically significant. The coefficient of the mean temperature for coniferous species (Pinus densiflora Siebold & Zucc., Larix kaempferi (Lamb.) Carr., Pinus koraiensis, Quercus variabilis Blume) was negative, whereas that for Quercus L. total (Quercus variabilis Blume and Quercus mongolica Fisch. ex Ledeb.) was positive.
Coefficient b reflecting the effect of mean temperature on DBH for red pine, Japanese larch, Korean pine and oaks was estimated to be −0.03962, −0.26735, −0.25759 and 0.09703, respectively (Table 5). Coefficient b of coniferous species (red pine, Japanese larch and Korean pine) was estimated to be lower than that of oak species (Chinese cork oak and Mongolian oak). The mean temperature significantly affected DBH estimation of coniferous species, whereas accumulated temperature in the growing season was important for DBH estimation of oak species (Table 5 and Table 6).
Larix kaempferi (Lamb.) Carr. is one of the main tree species in South Korea. It occupies approximately 9% (509,000 ha) of the entire forest area [45]. Japanese larch is one of the most economically-important tree species in South Korea because of its rapid growth. Approximately two billion Japanese larches have been planted during the last 40 years. Therefore, the Korean government needs to develop short- and long-term plans to address the issue of declining tree growth or size, particularly in Japanese larches because of the rising temperatures caused by climate change.
The present findings are consistent with those from previous studies. According to Byun et al. [12], temperature increment has a negative effect on the growth of red pine (Pinus densiflora Siebold & Zucc.). Pinus densiflora Siebold & Zucc. was found to yield a negative correlation between temperature and radial growth in the region where the warmth index (WI) was higher than 85. In addition, the area for which WI became higher than 85 occupied 78% of the Pinus densiflora Siebold & Zucc. forest in South Korea [12]. Therefore, the diameter growth could be negatively affected by increases in temperature for most of the Pinus densiflora Siebold & Zucc. forests [12]. Furthermore, many other studies have shown that incremental temperatures had negative effects on forest growth and on the distribution of red pine and Japanese larch, in South Korean forests [22,46]. However, the cases of oak forest, temperature and radial growth showed positive (+) correlations, even in areas where the WI was higher than 120. Therefore, the results of this study were reasonable compared to those of previous studies.
The annual diameter development rates of red pine have been reported to be declining in approximately 78% of forests in South Korea. Kim et al. [28] also showed that the mortality of red pine tends to increase with rising seasonal temperature. Thus, the increase in temperature can enhance the vulnerability of forests by reducing the growth of coniferous forests [47]. The Korean Forest Service [48] has also reported that coniferous forest area is gradually shrinking due to climate change.
Conversely, the growth of oak forest species was positively affected by increases in temperature, although their estimated coefficient values were smaller than those of coniferous forest species. In other words, oak forest species are relatively less affected by temperature than coniferous forest species.
Therefore, Equations (4) and (5) were used to predict DBH in coniferous and oak forests, respectively, under the consideration of accuracy.

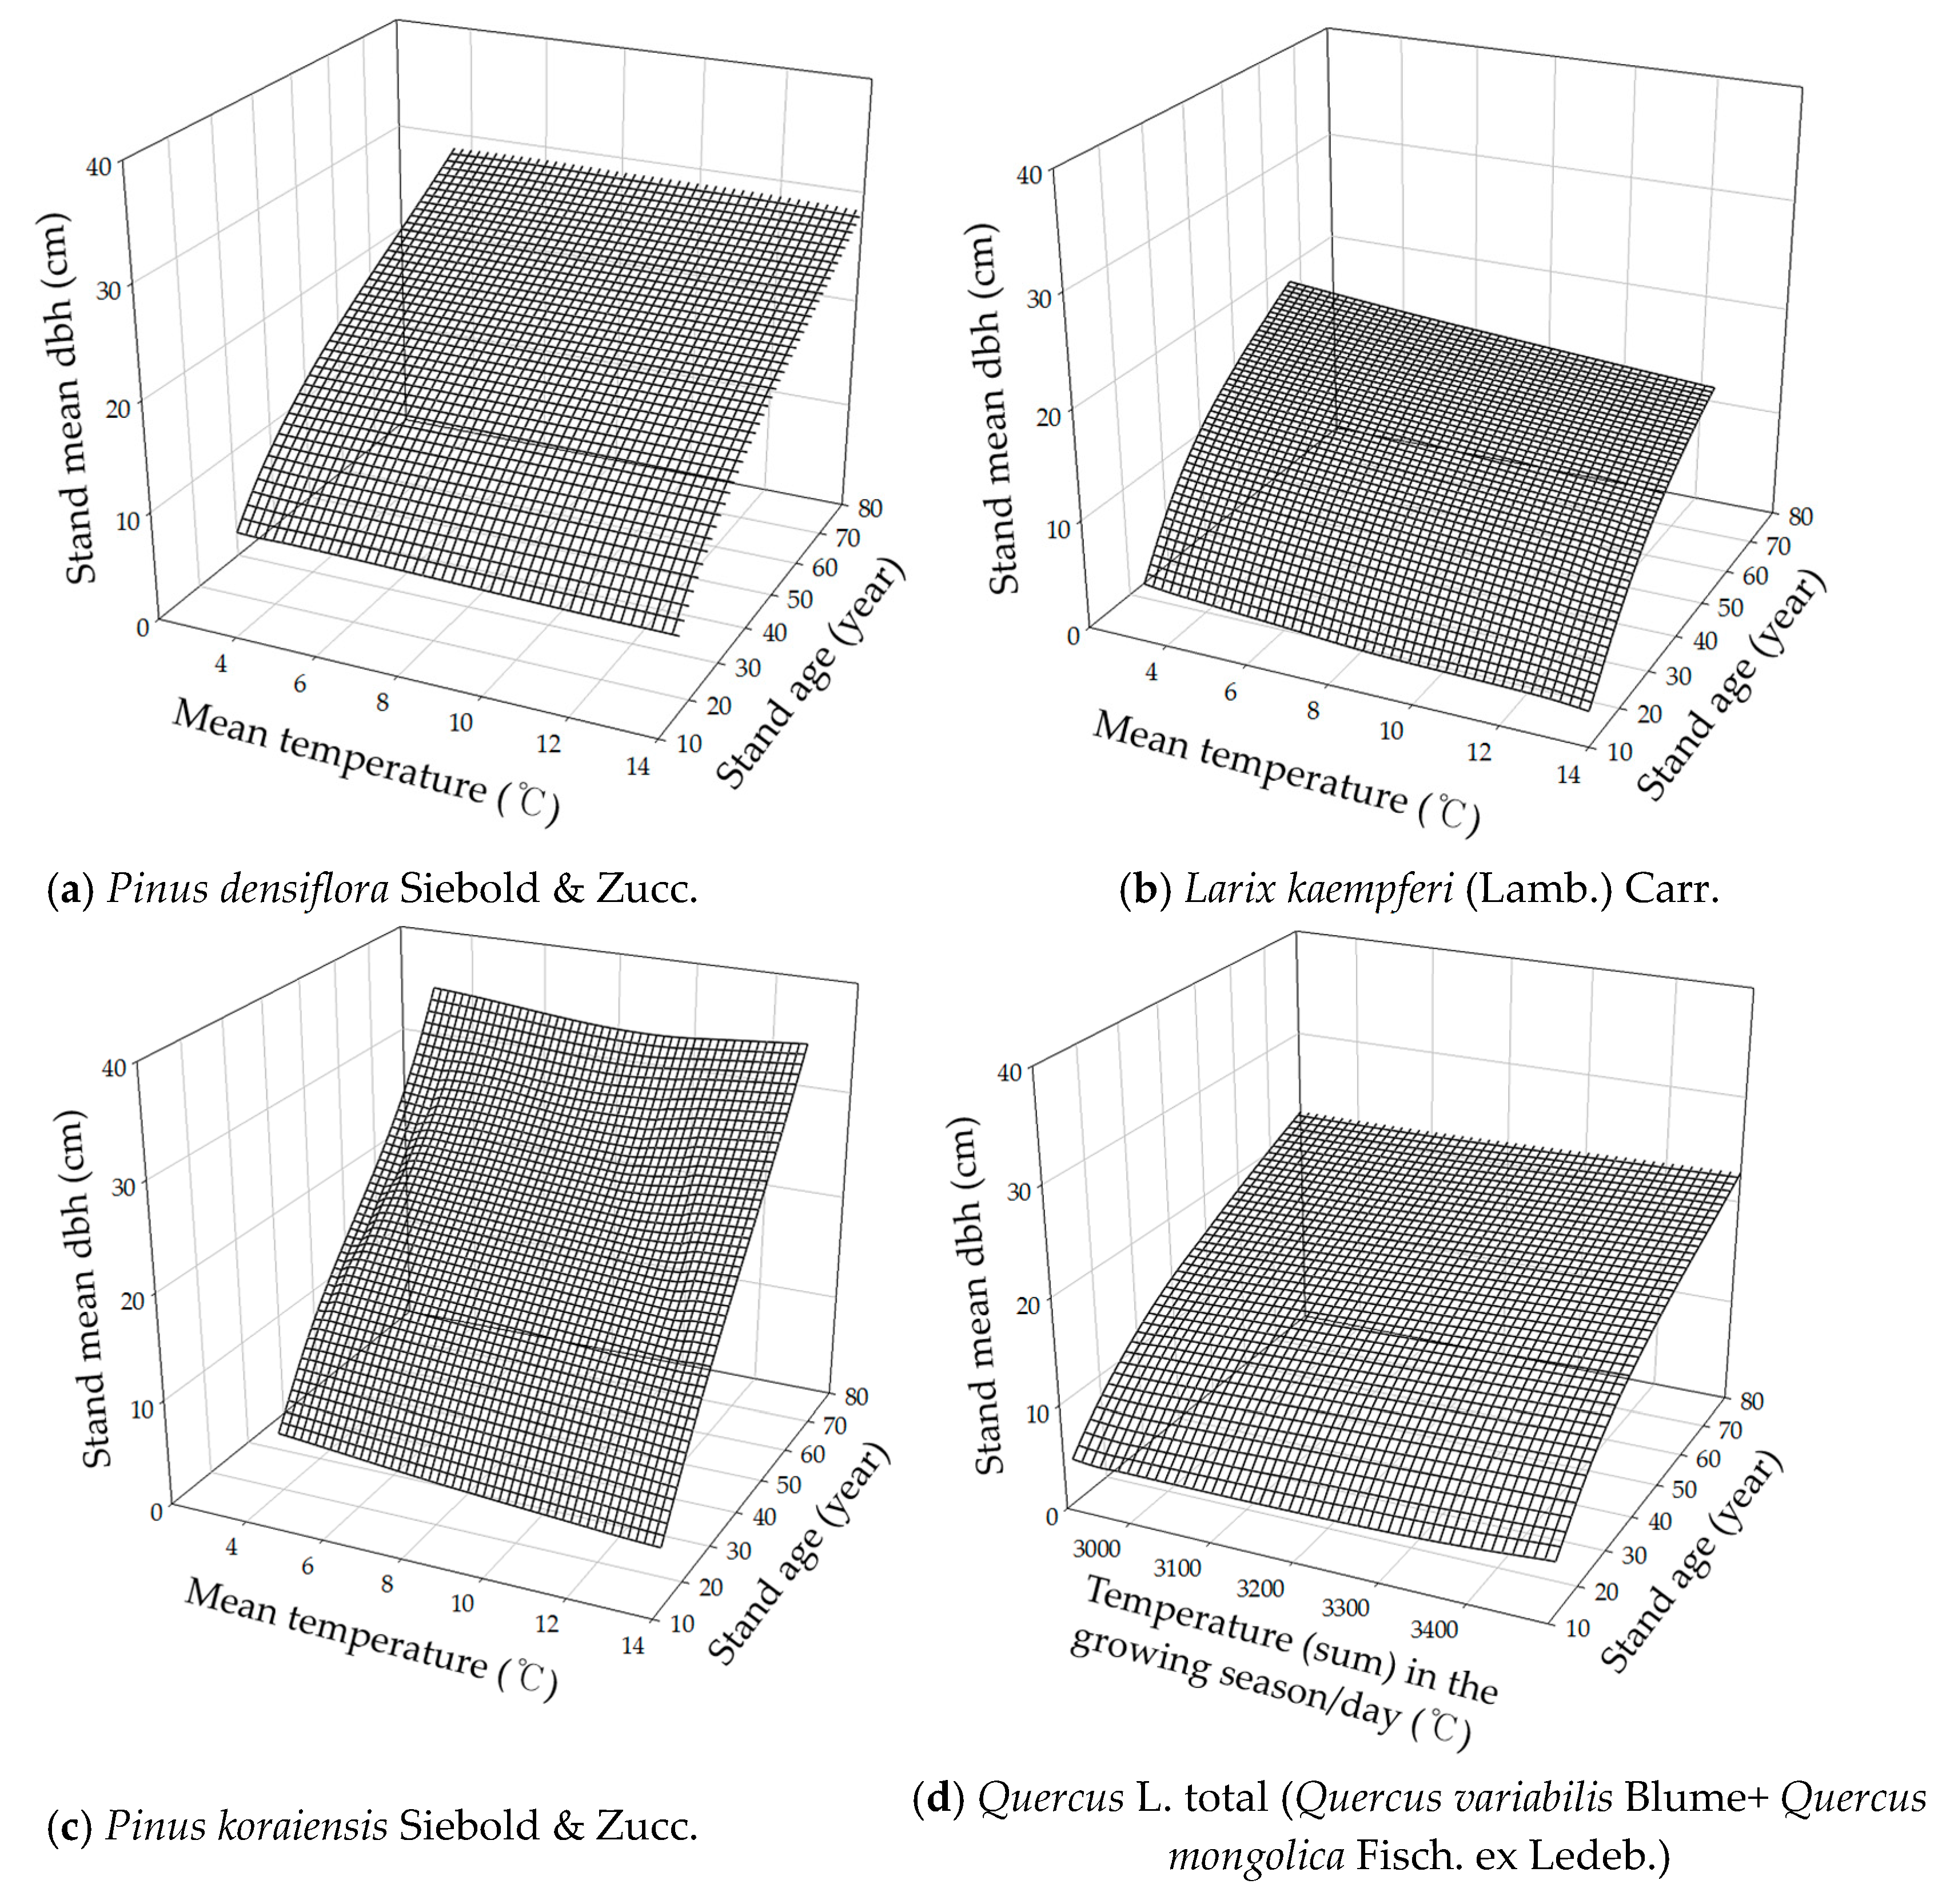
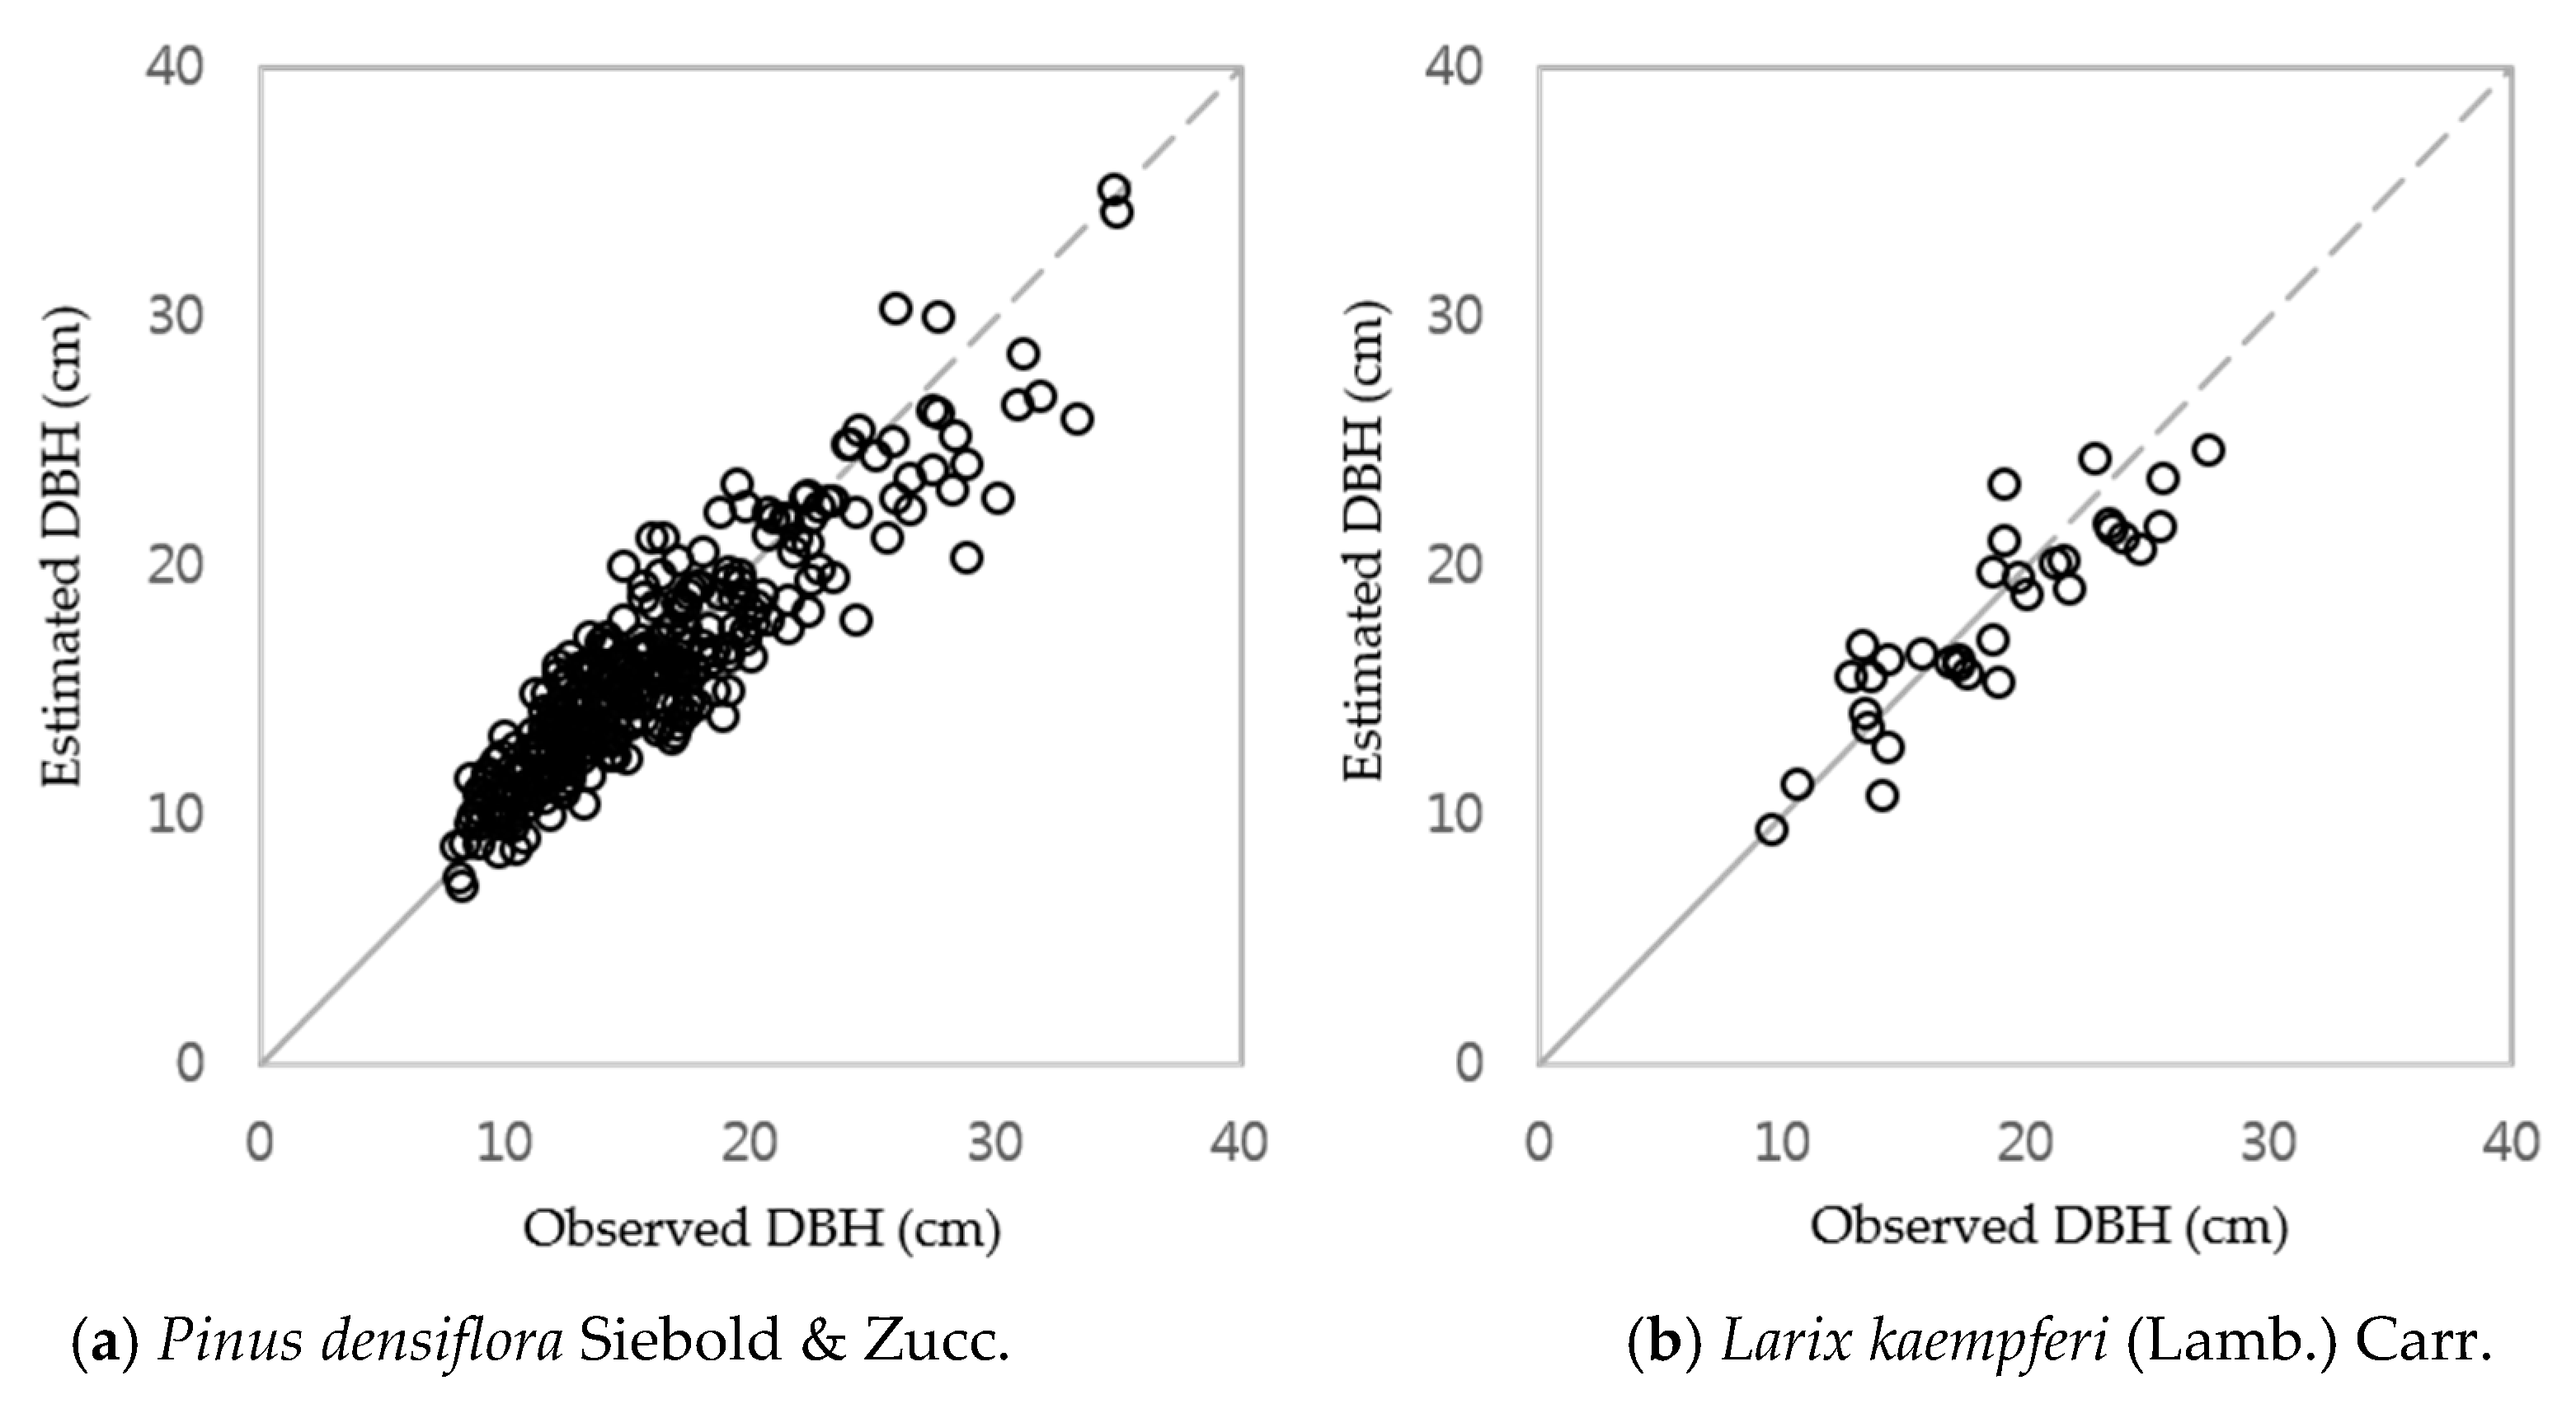
3.4. Integrated DBH Estimation Model with Stand and Climate Variables

An integrated DBH estimation model for each tree species was developed based on the results of the DBH estimation model and the residual model (Table 7). The effects of temperature on DBH for each plot of forest types were visualized using SigmaPlot (SPSS Inc., Chicago, IL, USA) (Figure 7). Three-dimensional graphs utilized fixed values of SI (such as the mean SI of each tree species) and Nha by age from the Korean yield table [49] (see Appendix Table A1).
The values of DBH for coniferous forest species decreased as temperature increased. The DBH of Pinus koraiensis Siebold & Zucc.was found to be the most sensitive to temperature, whereas Quercus was the least sensitive. Habitat temperature ranges of Pinus densiflora Siebold & Zucc. (range: 3.53–4.76 °C), Larix kaempferi (Lamb.) Carr. (3.3–13.85 °C), Pinus koraiensis Siebold & Zucc. (4.76–13.95 °C) and Quercus L. total (Quercus variabilis Blume and Quercus mongolica Fisch. ex Ledeb.) (1.85–14.55 °C) are shown in Figure 7. If the age of tree was fixed at 60 years, differences between estimated DBH at maximum and minimum temperatures for each tree species were −1.2 (−6.0%), −2.8 (−13.7%), −2.4 (−5.6%) and 1.0 (5.4%) cm, respectively.
These results are consistent with those of previous studies, indicating that coniferous forest trees are more sensitive to climate change (warming) than oak forest species. Their area is declining with increasing temperature caused by climate change [32,40,48].
The result of validation by using 10% NFI data is shown in Table 8. Semi-variogram analysis was performed again with residuals generated from the integrated model to confirm the self-spatiality of residuals. The results showed that none of the tree species showed any spatial correlation (Figure 8). Therefore, temperature and precipitation were found to influence DBH estimation.
The purpose of the DBH model was to estimate the current DBH for specific spatial conditions, that is stand (age, SI and Nha) and climatic conditions (temperature and precipitation). This model simply explains the fact that spatial differences in stand and climatic conditions can elicit differences in DBH size.
Vitality of trees is one of the most important indicators of forest condition [50]. Several findings on tree vitality have been reported in the literature [51,52]. One study stated that tree growth has various reactions to environmental stress. Tree growth has been suggested to serve as a vitality indicator if reference growth and growth trends are available [53]. These findings might contribute to the estimation of the vitality of forests.
There are major scientific uncertainties about climate-induced diameter development, such as DBH size, particularly on the mechanisms that drive diameter development, including physiological thresholds of tree growth and interactions with biotic agents [16,33]. Recent advances in the understanding of tree growth mechanisms suggest that forests could be particularly sensitive to increases in temperature in addition to drought, especially in the cases where carbon starvation rather than hydraulic failure is the primary mechanism of tree growth. However, at present, no model is available for the prediction of DBH of tree species and forest types based on specific combinations of climatic events and their interactions with biotic stressors at place-specific sites.
This study developed the DBH estimation model based on current SI, Nha and climate data; we did not consider the effects of the ongoing and short-term extreme climates on the estimate of diameters. However, this study has a remarkable advantage compared to previous studies, in that analyses were conducted based on detailed data at a national scale. In other words, although the survey was performed at one time-point, there was no significant problem in quantitatively analyzing the effect of climate on the development of each species. This is because the conditions of the stands, such as age, SI and Nha, are very diverse in each space. Santiago-García et al. [54] developed a stand-level model by using 66 plots of data from a permanent plot within the period of 2015 and 2016 and identified the forest productivity status in Juárez, Oaxaca, and in Mexico, based on the changes in DBH. Ji et al. [9] used surveyed data from 405 plots within the period of 2014 and 2015 to develop a stand forest growth model that did not consider climatic factors and the SI and identified forest carbon stocks in the city of Lishui in China. Therefore, in view of the above considerations, this study was meaningful as 5292 plots of data were used, and the possibility for further improvement of the model via continually supplementing and verifying the data by re-examining each plot every five years was provided.

4. Conclusions

In this study, an integrated model was developed to predict the DBH of the major tree species in South Korea considering climate factors and stand-level factors. For the development of this model, variables that could influence DBH estimation were classified into three categories (stand-, watershed- and regional-level factors) based on spatial autocorrelation. The stand-level DBH estimation model could successfully reflect the trend in the DBH of major forests according to stand-level factors. However, uncertainties remained for individual stand environments. The integrated DBH estimation model accurately described the DBH of each tree species with different stand- and regional-level factors.
Our results showed that the decreased DBH in the major coniferous forests of South Korea was associated with warmer conditions. However, the response of diameter development differed among species. In the case of oak species, rising temperature tended to have a positive effect on DBH, although this effect was relatively small. This, in part, implies that coniferous species might be more sensitive to climate change than oak species in South Korea. This result suggests that the major coniferous tree species in South Korea are more vulnerable to climate change than oak tree species. This might cause substantial changes in the structure and distribution of forests in South Korea in the long term. Therefore, decreasing vulnerability of forests to climate change and increasing their adaptability are necessary for forest management planning in South Korea.
Despite these findings, the complexity and scientific uncertainties of climate-induced DBH size challenge our understanding, particularly regarding the mechanisms that drive diameter development, including physiological thresholds of tree death and interactions with biotic agents. Furthermore, the watershed level was not considered in the model, although three spatial levels were considered for estimating the model. Although we did not consider climate change and stand density changes in this study, a current diameter prediction model was developed based on NFI data (DBH, age, site index, stand density) and the consideration of climatic factors (average temperature and cumulative precipitation of the growing season). This can serve as an important reference point to estimate current forest production for forest conservation and management. However, developing a dynamic growth model is necessary, by generating a density model based on the annual DBH data estimated from the model provided in this study and considering climate change, for more accurate forest management.

Acknowledgments

This work was supported by a grant (2014001310008) of the Climate Change Correspondence Program funded by the Ministry of Environment, Republic of Korea. Piao, D. and Kim, M contributed equally to this work.

Author Contributions

Woo-Kyun Lee and Dongfan Piao conceived to research design; Go-Mee Choi and Yeong-Mo Son provided NFI data; Dongfan Piao and Moonil Kim analyzed the NFI data; Hangnan Yu and Jooyeon Moon contributed to English correction; Woo-Kyun Lee, Sonam Wangyel Wang, Seong Woo Jeon, Yowhan Son and Guishan Cui gave constructive comments to this paper.

Conflicts of Interest

The authors declare no conflict of interest.

Appendix A

Table A1. The change of stand density by tree species and stand age (ref).
Stand Age (Year)Number of Trees per ha (Nha)
Pinus densiflora
(Site Index: 12)
Larix kaempferi
(Site Index: 18)
Pinus koraiensis
(Site Index: 14)
Quercus Total
(Site Index: 12)
201827131613622024
2516819939941657
3014187798681373
3511866587331153
401006584644981
45961538583936
50859508541828
55781490511741
60720478489669
65673471473609
70636468462560
75607467454518
80583467448481

References

  1. Clutter, J.L. Compatible growth and yield models for loblolly pine. For. Sci. 1963, 9, 354–371. [Google Scholar]
  2. Ritchie, M.W.; Hann, D.W. Development of a tree height growth model for Douglas-fir. For. Ecol. Manag. 1986, 15, 135–145. [Google Scholar] [CrossRef]
  3. McCullagh, A.; Black, K.; Nieuwenhuis, M. Evaluation of tree and stand-level growth models using national forest inventory data. Eur. J. For. Res. 2017, 136, 251–258. [Google Scholar] [CrossRef]
  4. Schweingruber, F.H. Tree Rings Basics and Applications of Dendrochronology; Kluwer Academic Publishing: Dordrecht, The Netherland, 1988; p. 276. [Google Scholar]
  5. Lee, W.K. A dynamic regional forest management model for the sustainability of forest practice-Considering forest growth and economical conditions. Korean J. For. Econ. 1995, 3, 71–98. [Google Scholar]
  6. Lindner, M.; Maroschek, M.; Netherer, S.; Kremer, A.; Barbati, A.; Garcia-Gonzalo, J.; Seidel, R.; Delzon, S.; Corona, P.; Kolström, M.; et al. Climate change impacts, adaptive capacity, and vulnerability of European forest ecosystems. For. Ecol. Manag. 2010, 259, 698–709. [Google Scholar] [CrossRef]
  7. Pothier, D. Twenty-year results of precommercial thinning in a balsam fir stand. For. Ecol. Manag. 2002, 168, 177–186. [Google Scholar] [CrossRef]
  8. Nishizono, T. Effects of thinning level and site productivity on age-related changes in stand volume growth can be explained by a single rescaled growth curve. For. Ecol. Manag. 2010, 259, 2276–2291. [Google Scholar] [CrossRef]
  9. Ji, B.; Tao, J.; Zhang, G.; Xu, D.; Wang, W.; Wu, W. Construction of Nonlinear mixed Model of Stand Growth Rate. J. Southwest For. Univ. 2017, 37, 149–158. [Google Scholar]
  10. Takahashi, K.; Azuma, H.; Yasue, K. Effects of climate on the radial growth of tree species in the upper and lower distribution limits of an altitudinal ecotone on Mount Norikura, central Japan. Ecol. Res. 2003, 18, 549–558. [Google Scholar] [CrossRef]
  11. Sørensen, R.; Zinko, U.; Seibert, J. On the calculation of the topographic wetness index: Evaluation of different methods based on field observations. Hydrol. Earth Syst. Sci. Discuss. 2006, 10, 101–112. [Google Scholar] [CrossRef] [Green Version]
  12. Byun, J.G.; Lee, W.K.; Kim, M.; Kwak, D.A.; Kwak, H.; Park, T.; Byun, W.H.; Son, Y.; Choi, J.K.; Lee, Y.J.; et al. Radial growth response of Pinus densiflora and Quercus spp. to topographic and climatic factors in South Korea. J. Plant Ecol. 2013, 6, 380–392. [Google Scholar] [CrossRef]
  13. Tian, H.; Melillo, J.M.; Kicklighter, D.W.; McGuire, A.D.; Helfrich, I.J.; Moore Iii, B.; Vörösmarty, C.J. Climatic and biotic controls on annual carbon storage in Amazonian ecosystems. Glob. Ecol. Biogeogr. 2001, 9, 315–335. [Google Scholar] [CrossRef]
  14. Enquist, B.J.; West, G.B.; Charnov, E.L.; Brown, J.H. Allometric scaling of production and life-history variation in vascular plants. Nature 1999, 401, 907–911. [Google Scholar] [CrossRef]
  15. Enquist, B.J. Universal scaling in tree and vascular plant allometry: Toward a general quantitative theory linking plant form and function from cells to ecosystem. Tree Physiol. 2002, 22, 1045–1064. [Google Scholar] [CrossRef] [PubMed]
  16. Kim, M.; Lee, W.K.; Park, T.; Kwak, H.; Byun, J.; Nam, K.; Lee, K.H.; Son, Y.M.; Won, H.K.; Lee, S.M. Developing dynamic DBH growth prediction model by thinning intensity and cycle-based on yield table data. J. Korean For. Soc. 2012, 101, 266–278. [Google Scholar]
  17. Moore, I.D.; Gessler, P.E.; Nielsen, G.A.; Peterson, G.A. Soil attribute prediction using terrain analysis. Soil Sci. Soc. Am. J. 1993, 57, 443–452. [Google Scholar] [CrossRef]
  18. Zirlewagen, D.; Raben, G.; Weise, M. Zoning of forest health conditions based on a set of soil, topographic and vegetation parameters. For. Ecol. Manag. 2007, 248, 43–55. [Google Scholar] [CrossRef]
  19. Nirmal, S.; Mahadev, S. Climate-diameter growth relationships of black spruce and jack pine trees in boreal Ontario, Canada. Glob. Chang. Biol. 2013, 19, 505–516. [Google Scholar]
  20. Gao, L.; Wang, X.; Zhao, X. Growth response of two coexisting species to climate change in broadleaved Korean pine forests in Changbai Mountain, Northeastern China. J. Beijing For. Univ. 2013, 35, 24–31. [Google Scholar]
  21. Ryan, M.G.; Binkley, D.; Fownes, J.H. Age-related decline in forest productivity: Pattern and process. Adv. Ecol. Res. 2008, 27, 213–262. [Google Scholar]
  22. Choi, K.; Kim, M.; Lee, W.K.; Gang, H.U.; Chung, D.J.; Ko, E.J.; Yun, B.H.; Kim, C.H. Estimating radial growth response of major tree species using climatic and topographic condition in South Korea. Korea J. Clim. Chang. Res. 2014, 5, 127–137. [Google Scholar] [CrossRef]
  23. Anselin, L.; Griffith, D.A. Do spatial effects really matter in regression analysis? Pap. Reg. Sci. 1988, 65, 11–34. [Google Scholar] [CrossRef]
  24. Overmars, K.D.; de Koning, G.H.; Veldkamp, A. Spatial autocorrelation in multi-scale land use models. Ecol. Model. 2003, 164, 257–270. [Google Scholar] [CrossRef]
  25. Korea Forest Service. Research and Application Based on National Forest Resources Survey; Korea Forest Service: Daejeon, Korea, 2015; p. 130. (In Korean)
  26. Korea Forest Service. The 5th National Forest Inventory; Korea Forest Service: Daejeon, Korea, 2013; p. 142. (In Korean)
  27. Korea Forest Research Institute. The 5th National Forest Inventory Report; Korea Forest Research Institute: Seoul, Korea, 2011; p. 166. (In Korean)
  28. Lee, S.C.; Choi, S.H.; Lee, W.K.; Yoo, S.J.; Byun, J.G. The effect of climate data applying temperature lapse rate on prediction of potential forest distribution. Korean Soc. Geospat. Inf. Sci. 2011, 19, 19–27. [Google Scholar]
  29. Jeong, H.M.; Kim, H.R.; You, Y.H. Growth difference among saplings of Quercus acutissima, Q. variabilis and Q. mongolica under the environmental gradients treatment. Korean J. Environ. Biol. 2009, 27, 82–87. [Google Scholar]
  30. Reineke, L.H. Perfecting a Stand-Density Index for Even-Aged Forests. J. Agric. Res. 1933, 46, 627–638. [Google Scholar]
  31. Sterba, H. Estimating potential density from thinning experiments and inventory data. For. Sci. 1987, 33, 1022–1034. [Google Scholar]
  32. Lee, W.K.; Seo, J.H.; Bae, S.W. Maximum stem number and mortality model for even-aged Pinus densiflora stand in Kangwon-Province, Korea. J. Korean For. Soc. 2000, 89, 634–644. [Google Scholar]
  33. Kim, M.; Lee, W.K.; Choi, G.M.; Song, C.; Lim, C.H.; Moon, J.; Piao, D.; Kraxner, F.; Shividenko, A.; Forsell, N. Modeling stand-level mortality based on maximum stem number and seasonal temperature. For. Ecol. Manag. 2017, 386, 37–50. [Google Scholar] [CrossRef]
  34. Dobbertin, M. Tree growth as indicator of tree vitality and of tree reaction to environmental stress: A review. Eur. J. For. Res. 2005, 124, 319–333. [Google Scholar] [CrossRef]
  35. Moore, J.A.; Zhang, L.; Stuck, D. Height-diameter equations for ten tree species in the Inland Northwest. West. J. Appl. For. 1996, 11, 132–137. [Google Scholar]
  36. Martínez Pastur, G.J.; Cellini, J.M.; Lencinas, M.V.; Peri, P.L. Stand growth model using volume increment/basal. J. For. Sci. 2008, 54, 102–108. [Google Scholar] [CrossRef]
  37. Li, C.M. Simulating basal area growth of fir plantations using a nonlinear mixed modeling approach. J. Beijing For. Univ. 2009, 31, 44–49. [Google Scholar]
  38. Lim, C.H.; Moon, J.Y.; Lim, Y.J.; Kim, S.J.; Lee, W.K. Estimating spatio-temporal distribution of climate factors in Andong Dam basin. J. Korean Soc. Geospat. Inf. Syst. 2015, 23, 57–65. [Google Scholar] [CrossRef]
  39. Kirilenko, A.P.; Solomon, A.M. Modeling dynamic vegetation response to rapid climate change using bioclimatic classification. Clim. Chang. 1998, 38, 15–49. [Google Scholar] [CrossRef]
  40. Liu, Q.; Xia, J.; Xie, W. Application of semi-variogram and Moran’s I to spatial distribution of trace elements in soil: A case study in Shouguang County. Geomat. Inf. Sci. Wuhan Univ. 2011, 36, 1129–1133. [Google Scholar]
  41. Byun, J.G.; Lee, W.K.; Nor, D.K.; Kim, S.H.; Choi, J.K.; Lee, Y.J. The relationship between tree radial growth and topographic and climatic factors in red pine and oak in central regions of Korea. J. Korean For. Soc. 2010, 99, 908–913. [Google Scholar]
  42. Cameron, A.C.; Windmeijer, F.A.G. An R-squared measure of goodness of fit for some common nonlinear regression models. J. Econ. 1997, 77, 329–342. [Google Scholar] [CrossRef]
  43. Burnham, K.P.; Anderson, D.R. Model Selection and Multimodal Inference: A Practical Information-Theoretic Approach; Springer Science & Business Media: Berlin/Heidelberg, Germany, 2003. [Google Scholar]
  44. Kim, T.M.; Lee, W.K.; Jung, S.E.; Kwak, H.B. Analysis of relationship between spatial distribution of Pinus densiflora and topographical factors. J. Korea Spat. Inf. Soc. 2008, 16, 359–372. [Google Scholar]
  45. Nam, K.; Lee, W.K.; Kim, M.; Kwak, D.A.; Byun, W.H.; Yu, H.; Kwak, H.; Kwon, T.; Sung, J.; Chung, D.J.; et al. Spatio-temporal change in forest cover and carbon storage considering actual and potential forest cover in South Korea. Sci. China Life Sci. 2015, 58, 713–723. [Google Scholar] [CrossRef] [PubMed]
  46. Choi, S.; Lee, W.K.; Kwak, D.A.; Lee, S.; Son, Y.; Lim, J.H.; Saborowski, J. Predicting forest cover changes in future climate using hydrological and thermal indices in South Korea. Clim. Res. 2011, 49, 229–245. [Google Scholar] [CrossRef]
  47. Korea Forest Service. Table of Tree Volume/Mass and Yield Table; Korea Forest Service: Daejeon, Korea, 2009; p. 261. (In Korean)
  48. Jang, D.H.; Lee, S. Analysis of forest type changes for vulnerability assessment of climate changes in the mountainous regions of Gangwon-do, Korea. Korea J. Clim. Res. 2013, 8, 169–183. [Google Scholar] [CrossRef]
  49. Korea Forest Service: Table of Tree Volume/Mass and Yield Table; Korea Forest Service: Daejeon, Korea, 2009. (In Korean)
  50. Innes, J.L. Forest Health: Its Assessment and Status; CAB International: Wallingford, UK, 1993. [Google Scholar]
  51. Shigo, A.L. Die neue Baumbiologie; Bernhard Thalacker Verlag: Braunschweig, Germany, 1990. [Google Scholar]
  52. Gehrig, M. Methoden zur Vitalitätsbeurteilung von Bäumen; Swiss Federal Institute of Technology: Zürich, Germany, 2004; p. 254. [Google Scholar]
  53. Kozlowski, T.T.; Pallardy, S.G. Acclimation and adaptive responses of woody plants to environmental stresses. Bot. Rev. 2002, 68, 270–334. [Google Scholar] [CrossRef]
  54. Santiago-García, W.; Pérez-López, E.; Quiñonez-Barraza, G.; Rodríguez-Ortiz, G.; Santiago-García, E.; Ruiz-Aquino, F.; Tamarit-Urias, J.C. A dynamic system of growth and yield equations for Pinus patula. Forests 2017, 8, 465. [Google Scholar] [CrossRef]
Figure 1. Study area with permanent plots of the Korean National Forest Inventory (NFI) (a) and automated weather station (AWS) points (b).
Forests 09 00155 g001
Figure 2. Extensive diversity of each factor (DBH, age, site index and stand density) by plot (Pinus densiflora Siebold & Zucc.), based on the 5th National Forest Inventory data.
Forests 09 00155 g002
Figure 3. Hypothesis for developing the diameter at breast height (DBH) model in this study. “x” and “o” represent the absence and presence of spatial autocorrelation, respectively.
Forests 09 00155 g003
Figure 4. Analysis of spatial autocorrelation by using factors that affect DBH estimation at the stand level ((a), (b), (c), (d), (e), (f), (g), (h) and (i) represent spatial autocorrelation of age, site index, number of trees per ha, aspect, slope, elevation, TWI, temperature and precipitation, respectively).
Forests 09 00155 g004
Figure 5. Observed vs. predicted diameter at breast height (DBH) for the major tree species in South Korea.
Forests 09 00155 g005aForests 09 00155 g005b
Figure 6. Semi-variogram analysis for each species (non-spatial model).
Forests 09 00155 g006aForests 09 00155 g006b
Figure 7. Three-dimensional analyses of stand age, temperature (mean temperature estimated over a 13-year period for coniferous forests and in growing seasons for oak forests) and diameter at breast height (DBH).
Forests 09 00155 g007
Figure 8. Semi-variogram analysis for each species by using an integrated model (non-spatial model + spatial model).
Forests 09 00155 g008aForests 09 00155 g008b
Table 1. General description of variables used in this study from the 5th National Forest Inventory (NFI; 2006–2010) and automated weather station (AWS).
VariablesUsePinus densiflora Siebold & Zucc.Larix kaempferi (Lamb.) Carr.Pinus koraiensis Siebold & Zucc.Quercus Total (Quercus variabilis Blume+ Quercus mongolica Fisch. ex Ledeb.)
MeanS.D.MeanS.D.MeanS.D.MeanS.D.
No. of plotsModel27963011851481
Verify3113320165
Stand age (year)*Model33.68.433.97.928.88.537.15.7
Verify33.88.431.57.135.69.738.17.0
Stand mean DBH (cm)Model15.54.517.94.317.86.415.14.1
Verify15.84.518.54.624.37.515.04.0
Site index*Model12.12.917.23.214.12.812.61.2
Verify12.13.116.83.015.12.512.31.7
Tree height (m)Model10.452.7515.383.8511.803.8111.1911.47
Verify10.202.7215.013.829.713.2010.502.15
Stand density (n/ha)Model1467.0729.1875.9383.4952.5562.21410.4284.4
Verify1463.9724.1890.2126.9403.6537.81359.7223.6
Mean temperature (°C)Model11.02.18.82.09.51.98.91.1
Verify10.90.78.80.51.61.88.41.0
Temperature (sum) in the growing season* (°C)Model3323.384.33282.776.53243.980.13281.143.0
Verify3324.480.03299.877.53296.979.93265.442.5
Precipitation in growing season* (mm)Model980.5184.1921.259.5918.750.3941.084.7
Verify981.9154.3926.847.147.143.1951.892.1
Stand age (year)*: the stand age of a plot was defined by the mean age of 6 trees. Site index*: Among the methods used to judge site quality, site index (SI) is one of the most used indicators and has high reliability. The SI refers to the height of a given tree species at the base ages of 25, 50 and 100, on the site of interest. In fact, the SI is defined by the Korea Forest Service as the height of the dominant tree at 30 years of age. For example, the SI is 16, if the height of tree is 16 m at a stand age of 30. The SI of each NFI plot is recorded by field survey and the Chapman-Richard model and Schumacher model [27]. Growing season*: from March–October [29].
Table 2. Comparison of coefficient of determination (R2), Akaike’s information criterion (AIC) and root mean square error (RMSE) for the models corresponding to each tree species.
Tree SpeciesEquation (1)Equation (2)Equation (3)Optimal Equation
R2AICRMSER2AICRMSER2AICRMSE
Pinus densiflora
Siebold & Zucc.
0.8261826.42.2410.7482096.02.7980.8351766.52.134Equation (3)
Larix kaempferi
(Lamb.) Carr.
0.787238.52.4460.741244.02.4970.790236.22.424Equation (3)
Pinus koraiensis
Siebold & Zucc.
0.886179.72.9710.867192.73.2230.904178.82.956Equation (3)
Quercus L. total
(Quercus variabilis Blume+
Quercus mongolica
Fisch. ex Ledeb.)
0.5741119.62.3790.5631188.42.5100.8141104.12.351Equation (3)
Table 3. Coefficient and significance level for the major tree species estimated from Equation (1).
Tree SpeciesParameterEstimateStd. Errort-Valuep-Value
Pinus densiflora
Siebold & Zucc.
a2.4370.16215.171<0.001
b0.6130.01060.118<0.001
c0.4910.01145.491<0.001
d−0.2130.005−47.333<0.001
Larix kaempferi
(Lamb.) Carr.
a1.9820.3875.116<0.001
b0.6700.03618.862<0.001
c0.3700.0399.386<0.001
d−0.1720.014−12.134<0.001
Pinus koraiensis
Siebold & Zucc.
a1.5630.4253.681<0.001
b0.7810.04617.169<0.001
c0.3580.0665.454<0.001
d−0.1720.019−9.182<0.001
Quercus L. total
(Quercus variabilis Blume+
Quercus mongolica
Fisch. ex Ledeb.)
a16.5641.56010.61578<0.001
b0.4880.01435.36957<0.001
c0.0600.0193.210811<0.001
d−0.2810.008−36.4036<0.001
Table 4. Coefficient and significance level for the major tree species estimated from Equation (3).
Tree SpeciesParameterEstimateStd. Errort-Valuep-Value
Pinus densiflora
Siebold & Zucc.
a43.8961.90623.033<0.001
b−22.9590.381−60.259<0.001
c0.4850.01145.745<0.001
d−0.2160.004−49.269<0.001
Larix kaempferi
Carr.
a37.7535.4236.962<0.001
b−18.4561.059−17.434<0.001
c0.3690.0409.295<0.001
d−0.1770.014−12.385<0.001
Pinus koraiensis
a56.48611.4504.933<0.001
b−24.4061.513−16.130<0.001
c0.3140.0664.793<0.001
d−0.1670.019−8.941<0.001
Quercus L. total
(Quercus variabilis Blume+
Quercus mongolica
Fisch. ex Ledeb.)
a177.20012.55214.117<0.001
b−18.8960.545−34.672<0.001
c0.0530.0143.804<0.001
d−0.2900.008−38.145<0.001
Table 5. Estimated parameters and associated standard errors for Equation (4) by using residuals and climate factors for each tree species.
Tree SpeciesParameterEstimateStd. Errort-Valuep-Value
Pinus densiflora
Siebold & Zucc.
a0.697690.251362.780.0055
b−0.039620.01804−2.20.0282
c−0.000380.000204−1.880.0608
Larix kaempferi
(Lamb.) Carr.
a−1.367131.90875−0.720.4746
b−0.267350.06112−4.37<0.0001
c0.005160.001962.640.0089
Pinus koraiensis
Siebold & Zucc.
a13.390433.473053.860.002
b−0.257590.09842−2.620.01
c−0.00720.0035−2.080.0386
Quercus L. total
(Quercus variabilis Blume+
Quercus mongolica
Fisch. ex Ledeb.)
a−0.488540.38888−1.260.2092
b0.097030.024793.91<0.0001
c−0.000650.00035−1.850.0652
Table 6. Estimated parameters and associated standard errors for Equation (5) by using residuals and temperature for each tree species.
Tree SpeciesParameterEstimateStd. Errort-Valuep-Value
Pinus densiflora
Siebold & Zucc.
a−0.679881.46426−0.460.6425
b0.0003230.0004510.720.4738
c−0.000520.000205−2.520.0119
Larix kaempferi
(Lamb.) Carr.
a0.630046.041690.10.917
b−0.001460.00168−0.870.3878
c0.005680.002052.780.006
Pinus koraiensis
Siebold & Zucc.
a21.270818.313032.560.0117
b−0.002960.00241−1.230.2204
c−0.012680.00383−3.310.0012
Quercus L. total
(Quercus variabilis Blume+
Quercus mongolica
Fisch. ex Ledeb.)
a−7.161662.62723−2.730.0065
b0.002320.0008142.850.0044
c−0.000760.000358−2.130.0334
Table 7. Integrated model to estimate diameter at breast height (DBH), including climate factors, for each tree species.
Tree SpeciesIntegrated DBH Estimation Model
Non-Spatial VariableSpatial Variable
Pinus densiflora
Siebold & Zucc.
D B H = 43.896 · e 22.959 ( 1 a g e ) · S I 0.485 · N h a 0.216 + 0.698 0.040 · T M e a n 0.0004 · P S e a s o n
Larix kaempferi
(Lamb.) Carr.
D B H = 37.753 · e 18.456 ( 1 a g e ) · S I 0.369 · N h a 0.177 1.367 0.267 · T M e a n + 0.005 · P S e a s o n
Pinus koraiensis
Siebold & Zucc.
D B H = 56.486 · e 24.406 ( 1 a g e ) · S I 0.314 · N h a 0.167 + 9.390 0.258 · T M e a n 0.007 · P S e a s o n
Quercus L. total
(Quercus variabilis Blume+
Quercus mongolica
Fisch. ex Ledeb.)
D B H = 177.200 · e 18.896 ( 1 a g e ) · S I 0.053 · N h a 0.290 7.162 + 0.002 · T S e a s o n 0.001 · P S e a s o n
Table 8. Correlation between observed and estimated DBH for each model (DBH estimation model R2, integrated DBH estimation model R2).
Tree SpeciesDBH Estimation Model R2Integrated DBH Estimation Model R2
Pinus densiflora
Siebold & Zucc.
0.8350.836
Larix kaempferi
(Lamb.) Carr.
0.7900.821
Pinus koraiensis
Siebold & Zucc.
0.9040.906
Quercus L. total
(Quercus variabilis Blume+
Quercus mongolica
Fisch. ex Ledeb.)
0.63950.6927

