Downed Coarse Woody Debris Dynamics in Ash (Fraxinus spp.) Stands Invaded by Emerald Ash Borer (Agrilus planipennis Fairmaire)

 , ,
, ,
Abstract
:1. Introduction
2. Materials and Methods
2.1. Study Sites
2.2. Sampling of Downed Coarse Woody Debris
2.3. Statistical Analyses
3. Results
4. Discussion
Supplementary Materials
Acknowledgments
Author Contributions
Conflicts of Interest
References
- Harmon, M.E.; Franklin, J.F.; Swanson, F.J.; Sollins, P.; Gregory, S.V.; Lattin, J.D.; Anderson, N.H.; Cline, S.P.; Aumen, N.G.; Sedell, J.R.; et al. Ecology of coarse woody debris in temperate ecosystems. In Advances in Ecological Research; MacFadyen, A., Ford, E.D., Eds.; Academic Press: Cambridge, MA, USA, 1986; Volume 15, pp. 133–302. [Google Scholar]
- Stevens, V. The Ecological Role of Coarse Woody Debris: An Overview of the Ecological Importance of CWD in BC Forests; Working Paper 30; Forest Science Program, BC Ministry of Forests: Victoria, BC, Canada, 1997. Available online: https://www.for.gov.bc.ca/hfd/pubs/docs/wp/wp30.pdf (accessed on 9 January 2018).
- Everett, R.A.; Ruiz, G.M. Coarse woody debris as a refuge from predation in aquatic communities. Oecologia 1993, 93, 475–486. [Google Scholar] [CrossRef] [PubMed]
- Gurnell, A.M.; Gregory, K.J.; Petts, G.E. The role of coarse woody debris in forest aquatic habitats: Implications for management. Aquat. Conserv. Mar. Freshw. Ecosyst. 1995, 5, 143–166. [Google Scholar] [CrossRef]
- Goodburn, J.M.; Lorimer, C.G. Cavity trees and coarse woody debris in old-growth and managed northern hardwood forests in Wisconsin and Michigan. Can. J. For. Res. 1998, 28, 427–438. [Google Scholar] [CrossRef]
- Siitonen, J. Forest management, coarse woody debris and saproxylic organisms: Fennoscandian boreal forests as an example. Ecol. Bull. 2001, 49, 11–41. [Google Scholar]
- Bowman, J.C.; Sleep, D.; Forbes, G.J.; Edwards, M. The association of small mammals with coarse woody debris at log and stand scales. For. Ecol. Manag. 2000, 129, 119–124. [Google Scholar] [CrossRef]
- Brown, J.K.; Reinhardt, E.D.; Kramer, K.A. Coarse Woody Debris: Managing Benefits and Fire Hazards in the Recovering Forest; General Technical Report RMRS-GTR-105; Department of Agricultura, Forest Service, Rocky Mountain Research Station: Ogden, UT, USA, 2003; p. 16. Available online: http://openknowledge.nau.edu/2565/1/Brown_J_etal_2003_CoarseWoodyDebrisManagingBenefits.pdf (accessed on 9 January 2018).
- Nordén, B.; Ryberg, M.; Götmark, F.; Olausson, B. Relative importance of coarse and fine woody debris for the diversity of wood-inhabiting fungi in temperate broadleaf forests. Biol. Conserv. 2004, 117, 1–10. [Google Scholar] [CrossRef]
- Agee, J.K.; Huff, M.H. Fuel succession in a western hemlock/Douglas-fir forest. Can. J. For. Res. 1987, 17, 697–704. [Google Scholar] [CrossRef]
- Muller, R.N.; Liu, Y. Coarse woody debris in an old-growth deciduous forest on the Cumberland Plateau, southeastern Kentucky. Can. J. For. Res. 1991, 21, 1567–1572. [Google Scholar] [CrossRef]
- Tinker, D.B.; Knight, D.H. Coarse woody debris following fire and logging in Wyoming lodgepole pine forests. Ecosystems 2000, 3, 472–483. [Google Scholar] [CrossRef]
- Pedlar, J.H.; Pearce, J.L.; Venier, L.A.; McKenney, D.W. Coarse woody debris in relation to disturbance and forest type in boreal Canada. For. Ecol. Manag. 2002, 158, 189–194. [Google Scholar] [CrossRef]
- Spies, T.A.; Franklin, J.F.; Thomas, T.B. Coarse woody debris in Douglas-fir forests of western Oregon and Washington. Ecology 1988, 69, 1689–1702. [Google Scholar] [CrossRef]
- Sturtevant, B.R.; Bissonette, J.A.; Long, J.N.; Roberts, D.W. Coarse woody debris as a function of age, stand structure, and disturbance in boreal Newfoundland. Ecol. Appl. 1997, 7, 702–712. [Google Scholar] [CrossRef]
- Baker, T.R.; Honorio Coronado, E.N.; Phillips, O.L.; Martin, J.; van der Heijden, G.M.F.; Garcia, M.; Silva Espejo, J. Low stocks of coarse woody debris in a southwest Amazonian forest. Oecologia 2007, 152, 495–504. [Google Scholar] [CrossRef] [PubMed]
- Spies, T.A.; Franklin, J.F.; Klopsch, M. Canopy gaps in Douglas-fir forests of the Cascade Mountains. Can. J. For. Res. 1990, 20, 649–658. [Google Scholar] [CrossRef]
- Whigham, D.F.; Olmsted, I.; Cano, E.C.; Harmon, M.E. The impact of hurricane Gilbert on trees, litterfall, and woody debris in a dry tropical forest in the northeastern Yucatan Peninsula. Biotropica 1991, 23, 434–441. [Google Scholar] [CrossRef]
- Hooper, M.C.; Arii, K.; Lechowicz, M.J. Impact of a major ice storm on an old-growth hardwood forest. Can. J. Bot. 2001, 79, 70–75. [Google Scholar]
- Van Lear, D.H. Dynamics of coarse woody debris in southern forest ecosystems. In Proceedings of the Workshop on Coarse Woody Debris in Southern Forests: Effects on Biodiversity, Athens, GA, USA, 18–20 October 1993; McMinn, J.W., Crossley, D.A., Jr., Eds.; General Technical Report SE-94. United States Department of Agriculture, Southern Research Station: Athens, GA, USA, 1993. [Google Scholar]
- Brassard, B.W.; Chen, H.Y.H. Effects of forest type and disturbance on diversity of coarse woody debris in boreal forest. Ecosystems 2008, 11, 1078–1090. [Google Scholar] [CrossRef]
- Kruys, N.; Jonsson, B.G. Fine woody debris is important for species richness on logs in managed boreal spruce forests of northern Sweden. Can. J. For. Res. 1999, 29, 1295–1299. [Google Scholar] [CrossRef]
- Perry, K.I.; Herms, D.A. Responses of ground-dwelling invertebrates to gap formation and accumulation of woody debris from invasive species, wind, and salvage logging. Forests 2017, 8, 1–13. [Google Scholar]
- Ellison, A.M.; Bank, M.S.; Clinton, B.D.; Colburn, E.A.; Elliott, K.; Ford, C.R.; Foster, D.R.; Kloeppel, B.D.; Knoepp, J.D.; Lovett, G.M.; et al. Loss of foundation species: Consequences for the structure and dynamics of forested ecosystems. Front. Ecol. Environ. 2005, 3, 479–486. [Google Scholar] [CrossRef]
- Klutsch, J.G.; Negrón, J.F.; Costello, S.L.; Rhoades, C.C.; West, D.R.; Popp, J.; Caissie, R. Stand characteristics and downed woody debris accumulations associated with a mountain pine beetle (Dendroctonus ponderosae Hopkins) outbreak in Colorado. For. Ecol. Manag. 2009, 258, 641–649. [Google Scholar] [CrossRef]
- Gandhi, K.J.K.; Herms, D.A. Direct and indirect effects of alien insect herbivores on ecological processes and interactions in forests of eastern North America. Biol. Invasions 2010, 12, 389–405. [Google Scholar] [CrossRef]
- Liebhold, A.M.; MacDonald, W.L.; Bergdahl, D.; Mastro, V.C. Invasion by exotic forest pests: A threat to forest ecosystems. For. Sci. 1995, 41, 1–49. [Google Scholar]
- Lovett, G.M.; Canham, C.D.; Arthur, M.A.; Weathers, K.C.; Fitzhugh, R.D. Forest ecosystem responses to exotic pests and pathogens in eastern North America. BioScience 2006, 56, 395–405. [Google Scholar] [CrossRef]
- Flower, C.E.; Gonzalez-Meler, M.A. Responses of temperate forest productivity to insect and pathogen disturbances. Annu. Rev. Plant Biol. 2015, 66, 547–569. [Google Scholar] [CrossRef] [PubMed]
- Krasny, M.E.; DiGregorio, L.M. Gap dynamics in Allegheny northern hardwood forests in the presence of beech bark disease and gypsy moth disturbances. For. Ecol. Manag. 2001, 144, 265–274. [Google Scholar] [CrossRef]
- Higham, M.; Hoven, B.M.; Gorchov, D.L.; Knight, K.S. Patterns of coarse woody debris in hardwood forests across a chronosequence of ash mortality due to the emerald ash borer (Agrilus planipennis). Nat. Areas J. 2017, 37, 406–411. [Google Scholar] [CrossRef]
- Herms, D.A.; McCullough, D.G. Emerald ash borer invasion of North America: History, biology, ecology, impacts, and management. Annu. Rev. Entomol. 2014, 59, 13–30. [Google Scholar] [CrossRef] [PubMed]
- Cipollini, D. White fringetree as a novel larval host for emerald ash borer. J. Econ. Entomol. 2015, 108, 370–375. [Google Scholar] [CrossRef] [PubMed]
- Knight, K.S.; Brown, J.P.; Long, R.P. Factors affecting the survival of ash (Fraxinus spp.) trees infested by emerald ash borer (Agrilus planipennis). Biol. Invasions 2013, 15, 371–383. [Google Scholar] [CrossRef]
- Klooster, W.S.; Herms, D.A.; Knight, K.S.; Herms, C.P.; McCullough, D.G.; Smith, A.; Gandhi, K.J.K.; Cardina, J. Ash (Fraxinus spp.) mortality, regeneration, and seed bank dynamics in mixed hardwood forests following invasion by emerald ash borer (Agrilus planipennis). Biol. Invasions 2014, 16, 859–873. [Google Scholar] [CrossRef]
- Burr, S.J.; McCullough, D.G. Condition of green ash (Fraxinus pennsylvanica) overstory and regeneration at three stages of the emerald ash borer invasion wave. Can. J. For. Res. 2014, 44, 768–776. [Google Scholar] [CrossRef]
- Kashian, D.M.; Witter, J.A. Assessing the potential for ash canopy tree replacement via current regeneration following emerald ash borer-caused mortality on southeastern Michigan landscapes. For. Ecol. Manag. 2011, 261, 480–488. [Google Scholar] [CrossRef]
- Smith, A. Effects of Community Structure on Forest Susceptibility and Response to the Emerald Ash Borer Invasion of the Huron River Watershed in Southeastern Michigan. Master’s Thesis, The Ohio State University, Columbus, OH, USA, 2006. [Google Scholar]
- Smith, A.; Herms, D.A.; Long, R.P.; Gandhi, K.J.K. Community composition and structure had no effect on forest susceptibility to invasion by the emerald ash borer (Coleoptera: Buprestidae). Can. Entomol. 2015, 147, 318–328. [Google Scholar] [CrossRef]
- Siegert, N.W.; McCullough, D.G.; Liebhold, A.M.; Telewski, F.W. Dendrochronological reconstruction of the epicentre and early spread of emerald ash borer in North America. Divers. Distrib. 2014, 20, 847–858. [Google Scholar] [CrossRef]
- Gandhi, K.J.K.; Smith, A.; Hartzler, D.M.; Herms, D.A. Indirect effects of emerald ash borer-induced ash mortality and canopy gap formation on epigaeic beetles. Environ. Entomol. 2014, 43, 546–555. [Google Scholar] [CrossRef] [PubMed]
- Albert, D.A. Regional Landscape Ecosystems of Michigan, Minnesota and Wisconsin: A Working Map and Classification; General Technical Report NC-178; U.S. Department of Agriculture, Forest Service, North Central Forest Experiment Station: St. Paul, MN, USA, 1995; p. 255.
- National Oceanic and Atmospheric Administration (NOAA). National Weather Service Forecast Office, NOAA Online Weather Data, (20 February); NOAA: Silver Spring, MD, USA, 2018.
- Woodall, C.; Williams, M.S. Sampling Protocol, Estimation, and Analysis Procedures for the Down Woody Materials Indicator of the FIA Program; General Technical Report NC-256; United States Department of Agriculture, Forest Service, North Central Research Station: St. Paul, MN, USA, 2005.
- Harmon, M.E.; Sexton, J. Guidelines for Measurements of Woody Detritus in Forest Ecosystems; Publication No. 20; U.S. LTER Network Office, University of Washington: Seattle, WA, USA, 1996; pp. 1–34. [Google Scholar]
- McGee, G.G. The contribution of beech bark disease-induced mortality to coarse woody debris loads in northern hardwood stands of Adirondack Park, New York, USA. Can. J. For. Res. 2000, 30, 1453–1462. [Google Scholar] [CrossRef]
- Fox, J.; Weisberg, S. An {R} Companion to Applied Regression, 2nd ed.; Sage: Thousand Oaks, CA, USA, 2011; Available online: http://socserv.socsci.mcmaster.ca/jfox/Books/Companion.
- R Development Core Team. R: A Language and Environment for Statistical Computing; R Foundation for Statistical Computing: Vienna, Austria, 2017; Available online: www.r-project.org.
- Quinn, G.P.; Keough, M.J. Experimental Design and Data Analysis for Biologists; Cambridge University Press: Cambridge, UK, 2002. [Google Scholar]
- Zar, J.H. Biostatistical Analysis, 3rd ed.; Prentice-Hall, Inc.: Princeton, NJ, USA, 1996. [Google Scholar]
- Mardia, K.V.; Jupp, P.E. Directional Statistics; John Wiley & Sons: London, UK, 2000. [Google Scholar]
- Young Technology Inc. GeoRose Version 0.5.1.1; Young Technology Inc.: Edmonton, AB, Canada, 2014; Available online: Http://yongtechnology.Com/download/georose (accessed on 27 December 2017).
- Rubino, D.L.; McCarthy, B.C. Evaluation of coarse woody debris and forest vegetation across topographic gradients in a southern Ohio forest. For. Ecol. Manag. 2003, 183, 221–238. [Google Scholar] [CrossRef]
- Dyer, J.M. Revisiting the deciduous forests of eastern North America. BioScience 2006, 56, 341–352. [Google Scholar] [CrossRef]
- Houston, D.R. Major new tree disease epidemics: Beech bark disease. Annu. Rev. Phytopathol. 1994, 32, 75–87. [Google Scholar] [CrossRef]
- Kizlinski, M.L.; Orwig, D.A.; Cobb, R.C.; Foster, D.R. Direct and indirect ecosystem consequences of an invasive pest on forests dominated by eastern hemlock. J. Biogeogr. 2002, 29, 1489–1503. [Google Scholar] [CrossRef]
- Eschtruth, A.K.; Cleavitt, N.L.; Battles, J.J.; Evans, R.A.; Fahey, T.J. Vegetation dynamics in declining eastern hemlock stands: 9 years of forest response to hemlock woolly adelgid infestation. Can. J. For. Res. 2006, 36, 1435–1450. [Google Scholar] [CrossRef]
- Cleavitt, N.L.; Eschtruth, A.K.; Battles, J.J.; Fahey, T.J. Bryophyte response to eastern hemlock decline caused by hemlock woolly adelgid infestation. J. Torrey Bot. Soc. 2008, 135, 12–25. [Google Scholar] [CrossRef]
- Ellison, A.M.; Barker-Plotkin, A.A.; Foster, D.R.; Orwig, D.A. Experimentally testing the role of foundation species in forests: The Harvard forest hemlock removal experiment. Methods Ecol. Evol. 2010, 1, 168–179. [Google Scholar] [CrossRef]
- Orwig, D.A.; Barker Plotkin, A.A.; Davidson, E.A.; Lux, H.; Savage, K.E.; Ellison, A.M. Foundation species loss affects vegetation structure more than ecosystem function in a northeastern USA forest. PeerJ 2013, 1, e41. [Google Scholar] [CrossRef] [PubMed] [Green Version]
- Raymer, P.C.L.; Orwig, D.A.; Finzi, A.C. Hemlock loss due to the hemlock woolly adelgid does not affect ecosystem C storage but alters its distribution. Ecosphere 2013, 4, 1–16. [Google Scholar] [CrossRef]
- Stokland, J.N.; Siitonen, J. Mortality factors and decay succession. In Biodiversity in Dead Wood; Stokland, J.N., Siitonen, J., Jonsson, B.G., Eds.; Cambridge University Press: Cambridge, UK, 2012; pp. 110–149. [Google Scholar]
- Russell, M.B.; Woodall, C.W.; Fraver, S.; D’Amato, A.W. Estimates of downed woody debris decay class transitions for forests across the eastern United States. Ecol. Model. 2013, 251, 22–31. [Google Scholar] [CrossRef]
- Swift, M.J.; Heal, O.W.; Anderson, J.M. Decomposition in Terrestrial Ecosystems; University of California Press: Berkeley, CA, USA, 1979. [Google Scholar]
- Freschet, G.T.; Weedon, J.T.; Aerts, R.; van Hal, J.R.; Cornelissen, J.H.C. Interspecific differences in wood decay rates: Insights from a new short-term method to study long-term wood decomposition. J. Ecol. 2012, 100, 161–170. [Google Scholar] [CrossRef]
- Stokland, J.N. Wood decomposition. In Biodiversity in Dead Wood; Stokland, J.N., Siitonen, J., Jonsson, B.G., Eds.; Cambridge University Press: Cambridge, UK, 2012; pp. 10–28. [Google Scholar]
- Raphael, M.G.; White, M. Use of snags by cavity-nesting birds in the Sierra Nevada. Wildl. Monogr. 1984, 86, 3–66. [Google Scholar]
- Drapeau, P.; Nappi, A.; Imbeau, L.; Saint-Germain, M. Standing deadwood for keystone bird species in the eastern boreal forest: Managing for snag dynamics. For. Chron. 2009, 85, 227–234. [Google Scholar] [CrossRef]
- McComb, W.; Lindenmayer, D.B. Dying, dead, and downed trees. In Maintaining Biodiversity in Forest Ecosystems; Hunter, M.L., Jr., Ed.; Cambridge University Press: Cambridge, UK, 1999; pp. 335–372. [Google Scholar]
- Siitonen, J. Microhabitats. In Biodiversity in Dead Wood; Stokland, J.N., Siitonen, J., Jonsson, B.G., Eds.; Cambridge University Press: Cambridge, UK, 2012; pp. 150–182. [Google Scholar]
- Siitonen, J.; Jonsson, B.G. Other associations with dead woody material. In Biodiversity in Dead Wood; Stokland, J.N., Siitonen, J., Jonsson, B.G., Eds.; Cambridge University Press: Cambridge, UK, 2012; pp. 58–81. [Google Scholar]
- Schaetzl, R.J.; Burns, S.F.; Johnson, D.L.; Small, T.W. Tree uprooting: Review of impacts on forest ecology. Vegetatio 1988, 79, 165–176. [Google Scholar] [CrossRef]
- Liechty, H.O.; Jurgensen, M.F.; Mroz, G.D.; Gale, M.R. Pit and mound topography and its influence on storage of carbon, nitrogen, and organic matter within an old-growth forest. Can. J. For. Res. 1997, 27, 1992–1997. [Google Scholar] [CrossRef]
- Clinton, B.D.; Baker, C.R. Catastrophic windthrow in the southern Appalachians: Characteristics of pits and mounds and initial vegetation responses. For. Ecol. Manag. 2000, 126, 51–60. [Google Scholar] [CrossRef]
- McElhinny, C.; Gibbons, P.; Brack, C.; Bauhus, J. Forest and woodland stand structural complexity: Its definition and measurement. For. Ecol. Manag. 2005, 218, 1–24. [Google Scholar] [CrossRef]
- Tews, J.; Brose, U.; Grimm, V.; Tielborger, K.; Wichmann, M.C.; Schwager, M.; Jeltsch, F. Animal species diversity driven by habitat heterogeneity/diversity: The importance of keystone structures. J. Biogeogr. 2004, 31, 79–92. [Google Scholar] [CrossRef]
- Evans, A.M.; Clinton, P.W.; Allen, R.B.; Frampton, C.M. The influence of logs on the spatial distribution of litter-dwelling invertebrates and forest floor processes in New Zealand forests. For. Ecol. Manag. 2003, 184, 251–262. [Google Scholar] [CrossRef]
- Ulyshen, M.D.; Hanula, J.L. Litter-dwelling arthropod abundance peaks near coarse woody debris in loblolly pine forests of the southeastern United States. Fla. Entomol. 2009, 92, 163–164. [Google Scholar] [CrossRef]
- Whiles, M.R.; Grubaugh, J.W. Importance of Coarse Woody Debris to Southern Forest Herpetofauna. In Proceedings of the Biodiversity and Coarse Woody Debris in Southern Forests: Effects on Biodiversity, Athens, GA, USA, 18–20 October 1993; McMinn, J.W., Crossley, D.A., Jr., Eds.; USDA Forest Service: Athens, GA, USA, 1993. [Google Scholar]
- Fauteux, D.; Imbeau, L.; Drapeau, P.; Mazerolle, M.J. Small mammal responses to coarse woody debris distribution at different spatial scales in managed and unmanaged boreal forests. For. Ecol. Manag. 2012, 266, 194–205. [Google Scholar] [CrossRef]
- Ulyshen, M.D.; Klooster, W.S.; Barrington, W.T.; Herms, D.A. Impacts of emerald ash borer-induced tree mortality on leaf litter arthropods and exotic earthworms. Pedobiologia 2011, 54, 261–265. [Google Scholar] [CrossRef]
- Perry, K.I.; Herms, D.A. Short-term responses of ground beetles to forest changes caused by early stages of emerald ash borer (Coleoptera: Buprestidae)-induced ash mortality. Environ. Entomol. 2016, 45, 616–626. [Google Scholar] [CrossRef] [PubMed]
- Perry, K.I.; Herms, D.A. Response of the forest floor invertebrate community to canopy gap formation caused by early stages of emerald ash borer-induced ash mortality. For. Ecol. Manag. 2016, 375, 259–267. [Google Scholar] [CrossRef]
- Perry, K.I.; Herms, D.A. Effects of late stages of emerald ash borer (Coleoptera: Buprestidae)-induced ash mortality on forest floor invertebrate communities. J. Insect Sci. 2017, 17, 1–10. [Google Scholar] [CrossRef]
- MacFarlane, D.W.; Meyer, S.P. Characteristics and distribution of potential ash tree hosts for emerald ash borer. For. Ecol. Manag. 2005, 213, 15–24. [Google Scholar] [CrossRef]


| Tree Species | 2008 | 2012 | ||
|---|---|---|---|---|
| Volume (m3 ha−1) | Percentage of Total DCWD | Volume (m3 ha−1) | Percentage of Total DCWD | |
| Acer spp. | 16.8 ± 16.1 | 16.5 | 4.5 ± 1.6 | 7.1 |
| Fraxinus pennsylvanica Marsh. | 9.3 ± 2.9 | 9.1 | 7.9 ± 2.1 | 11.4 |
| Fraxinus nigra Marsh. | 4.6 ± 1.7 | 4.5 | 7.1 ± 3.1 | 10.3 |
| Fraxinus americana L. | 3.5 ± 1.7 | 3.4 | 2.8 ± 1.7 | 5.5 |
| Populus deltoides Bartr. ex Marsh. | 5.8 ± 5.8 | 5.6 | 0.2 ± 0.1 | 0.3 |
| Quercus spp. | 2.5 ± 1.9 | 2.8 | 1.1 ± 0.6 | 1.7 |
| Prunus serotina Ehrh. | 0.5 ± 0.3 | 0.5 | 0.4 ± 0.3 | 0.5 |
| Larix spp. | 0.8 ± 0.8 | 0.8 | 0.0 | 0.0 |
| Tilia americana L. | 0.3 ± 0.1 | 0.3 | 0.3 ± 0.1 | 0.4 |
| Ulmus spp. | 0.2 ± 0.1 | 0.2 | 0.1 ± 0.1 | 0.1 |
| Carya spp. | 0.0 | 0.0 | 0.2 ± 0.1 | 0.3 |
| Sassafras albidum (Nutt.) Nees | 0.1 ± 0.1 | 0.05 | 0.1 ± 0.1 | 0.2 |
| Fagus grandifolia Ehrh. | 0.1 ± 0.1 | 0.1 | 0.0 | 0.0 |
| Betula spp. | 0.1 ± 0.1 | 0.05 | 0.0 | 0.0 |
| Carpinus caroliniana Walt. | 0.1 ± 0.1 | 0.3 | 0.0 | 0.0 |
| Unknown | 56.9 ± 10.3 | 55.8 | 39.8 ± 9.4 | 62.2 |
| Year | ||
|---|---|---|
| 2008 | 2012 | |
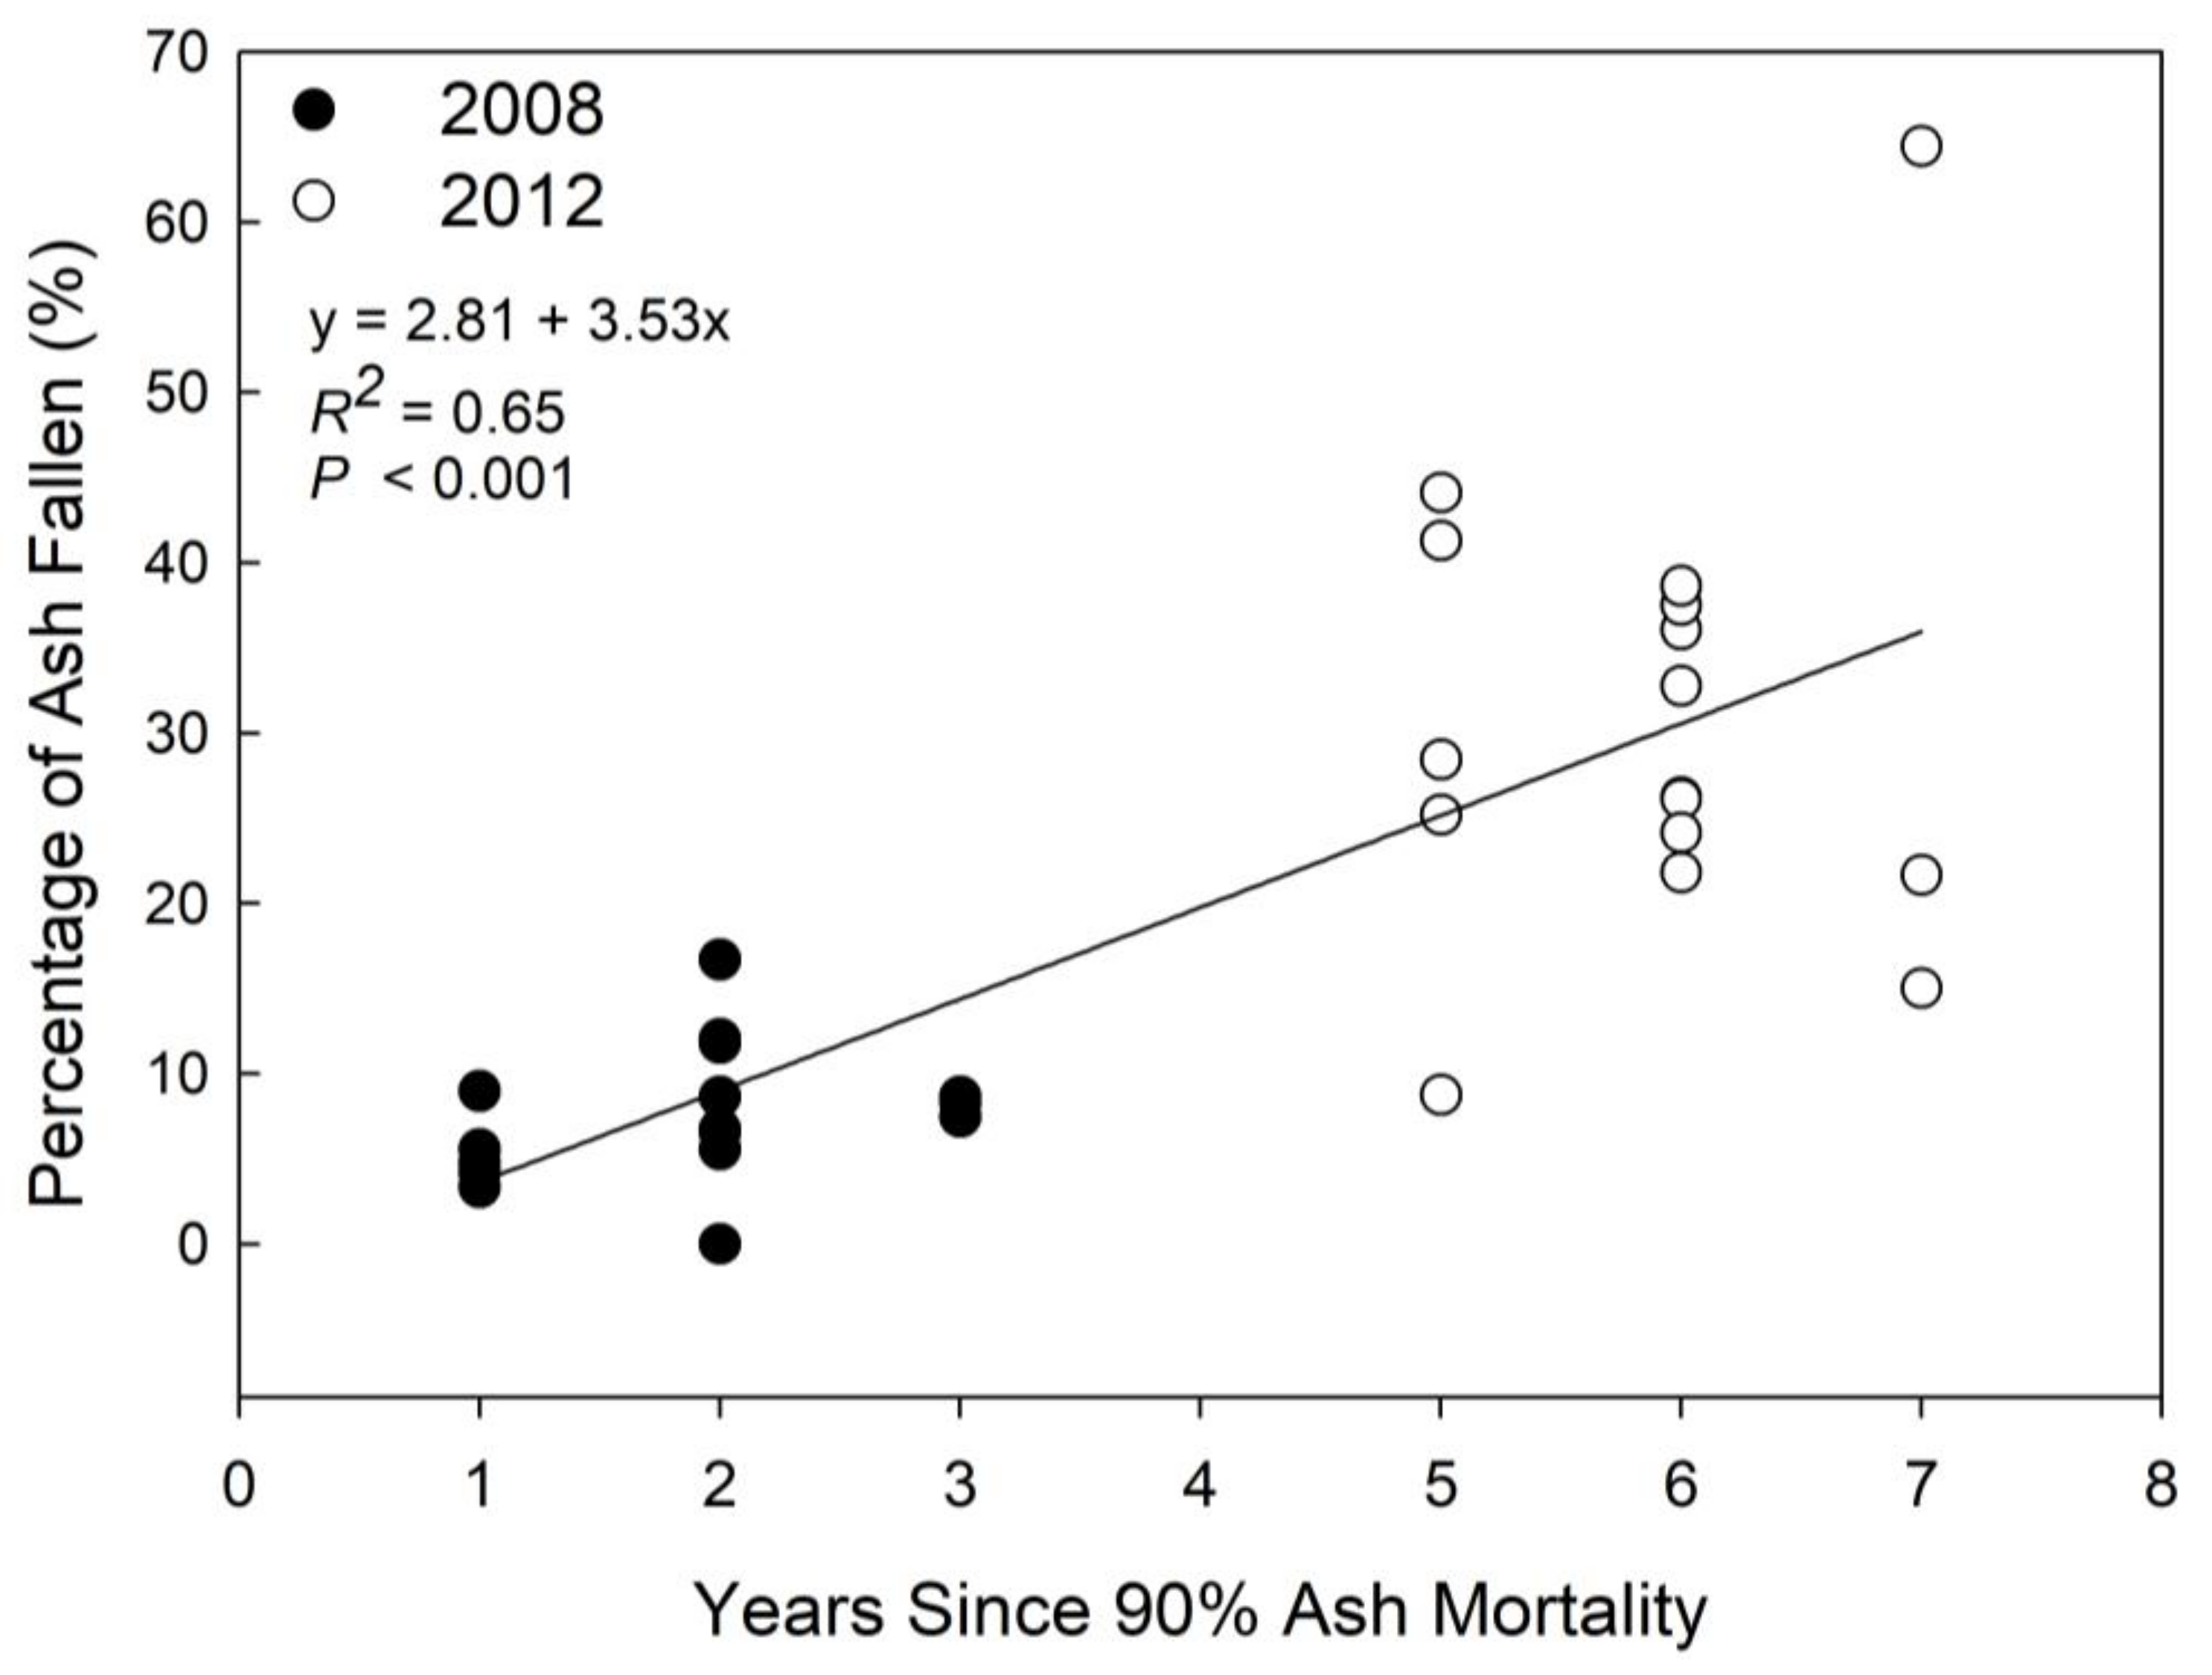
| Percentage of ash trees that had fallen | 7.6 ± 1.0 a | 30.7 ± 3.3 b |
| Volume of ash DCWD (m3 ha−1) | 17.2 ± 3.3 a (17.0%) | 36.6 ± 4.1 b (27.2%) |
| Volume of non-ash DCWD (m3 ha −1) | 90.3 ± 24.2 a (83.0%) | 68.3 ± 10.1 a (72.8%) |
| Volume of total DCWD (m3 ha −1) | 106.7 ± 26.0 a (100%) | 93.5 ± 12.3 a (100%) |
© 2018 by the authors. Licensee MDPI, Basel, Switzerland. This article is an open access article distributed under the terms and conditions of the Creative Commons Attribution (CC BY) license (http://creativecommons.org/licenses/by/4.0/).
Share and Cite
Perry, K.I.; Herms, D.A.; Klooster, W.S.; Smith, A.; Hartzler, D.M.; Coyle, D.R.; Gandhi, K.J.K. Downed Coarse Woody Debris Dynamics in Ash (Fraxinus spp.) Stands Invaded by Emerald Ash Borer (Agrilus planipennis Fairmaire). Forests 2018, 9, 191. https://doi.org/10.3390/f9040191
Perry KI, Herms DA, Klooster WS, Smith A, Hartzler DM, Coyle DR, Gandhi KJK. Downed Coarse Woody Debris Dynamics in Ash (Fraxinus spp.) Stands Invaded by Emerald Ash Borer (Agrilus planipennis Fairmaire). Forests. 2018; 9(4):191. https://doi.org/10.3390/f9040191
Chicago/Turabian StylePerry, Kayla I., Daniel A. Herms, Wendy S. Klooster, Annemarie Smith, Diane M. Hartzler, David R. Coyle, and Kamal J. K. Gandhi. 2018. "Downed Coarse Woody Debris Dynamics in Ash (Fraxinus spp.) Stands Invaded by Emerald Ash Borer (Agrilus planipennis Fairmaire)" Forests 9, no. 4: 191. https://doi.org/10.3390/f9040191