Toward an Elasticity of Chip-N-Saw: Demand and Supply Models of Chip-N-Saw Stumpage in Louisiana


1
Department of Agricultural Economics and Agribusiness, Louisiana State University Agricultural Center, Baton Rouge, LA 70803, USA
2
Department of Forestry and Environmental Resources, North Carolina State University, Raleigh, NC 27695, USA
*
Author to whom correspondence should be addressed.
Forests 2018, 9(4), 211; https://doi.org/10.3390/f9040211
Submission received: 19 February 2018
/
Revised: 10 April 2018
/
Accepted: 12 April 2018
/
Published: 17 April 2018
(This article belongs to the Section Forest Economics, Policy, and Social Science)
Abstract
:Softwood chip-n-saw (CNS) is a relatively new stumpage product in the sawtimber- and pulpwood-dominated stumpage markets in the U.S. South. Based on a quarterly data series from 2003 to 2016, this study estimates the demand and supply models of the softwood CNS stumpage market in Louisiana. The two-stage least squares (2SLS) results reveal that own price elasticity of demand (PED) is price elastic, and the cross-price elasticity (XED)with sawtimber approaches unit elasticity. On the supply side, CNS is price inelastic in supply (PES), but more responsive to own price changesthan sawtimber quantity supplied. Further, severance tax increases are found to decrease the supply of CNS, indicating that suppliers are responsive to severance tax incidence. As the first empirical estimation of CNS, the findings should be of interest to those involved in the analysis of Southeastern stumpage markets.
1. Introduction
Historically, softwood stumpage products derived from timber properties fell into two groups: sawtimber, which is used to produce lumber, plywood, and other structural-grade dimension products, and pulpwood, which is used for pulp and paper products and, more recently, pellets and other engineered products (i.e., oriented strand board). From the standpoint of forest management, landowner income generated by the harvesting of these two stumpage products had very clear temporal separation in terms of rotation age and the availability of these two products at the time of a harvest, pulpwood being available on small tracts at the age of 15–20 years and sawtimber being available around 30–40 years. Of course, this rotation is generally much shorter on corporate and industry lands. Nonetheless, the temporal distinction between product classes holds.
However, beginning in the late 1960s and reaching historical peaks in the mid to late 1990s, an intersection of technological improvements in manufacturing processes and demand for framing lumber products led to the rise of a new stumpage product class in softwood markets, called “chip-n-saw“ (CNS). Definitions of this product are evasive but a general definition can be found in the name itself. Harvested at a diameter at breast height (DBH) of 10 to 13 inches, the tops are used for wood chips in the production of pulp products, but the real value is in the ability to produce multiple lumber pieces (e.g., 2 × 4 s, a common 2-in × 4-in dimensional lumber size in North America).
Louisiana CNS prices and quantity severed were not tracked by the Louisiana Department of Agriculture and Forestry (LDAF) until mid-1995 and only then owing to a lawsuit on how CNS should be classified regarding severance taxes on harvested timber [1]. Those anecdotal, but legally-binding, findings are as expected to forest economists. Plainly stated, there is statistical support that CNS stumpage products are used as a substitute for sawtimber products. Parajuli et al. [2] support this to some degree, finding that the price of CNS Granger causes the price of sawtimber in four south-central U.S. states. In other words, sawtimber prices can be better predicted using histories of both of CNS and sawtimber prices than by using the sawtimber price only. Consequently, since the great recession of a few years ago, the price series of CNS and sawtimber have converged in south-central markets, from a price ratio of two tons of CNS to one ton of sawtimber in 2007 to a ratio of 1.35 tons to one ton in 2016. This has implications for forest landowners, as many forest managers have contemplated clear cuts far sooner than the traditional 35 to 40 years of age at final harvest, in certain local wood markets.
There is a mix of explanations for this phenomenon, which Stewart [3] states, summarily, “...since the late 1990s and early 2000s, southern plywood plant closures have removed one of the largest end uses for sawtimber class trees. Further, manufacturing technology in the lumber and building products sector has moved toward using smaller d.b.h trees. Recent reports from Forest2Market’s Mill2Market Lumber Pricing Service showed that 2 × 4 s sold for more than 2 × 12 s. So, sawmills are getting paid a higher $/mbf to cut 2 × 4 s than they are for 2 × 12 s. In addition, since 2 × 4 s can be cut from the smaller CNS logs, sawmills have less incentive to buy or pay a premium for large logs”. This is made more salient by the spread or difference in the prices of lumber products (specifically 2 × 4 s) and the delivered price of sawtimber stumpage. Therefore, since the prices for 2 × 4 s are higher and rising faster than the larger-diameter lumber products (and CNS is cheaper than sawtimber), there is end-use price pressure to switch to the cheaper input in the sawmilling process. While delivered prices have remained flat (and stumpage prices have declined), lumber prices have risen greatly. This increase in profitability is exacerbated by using CNS stumpage as a substitute for sawtimber. Consequently, understanding the determinants of supply and demand of CNS stumpage products is more relevant to stumpage markets than in the past, and if the trends continue toward smaller stumpage products, this will only become more relevant in the future. The first author has conducted extension presentations where clientele groups requested comparisons of harvesting rotations with chip-n-saw as the terminal stumpage product class and comparing land expectation values with traditional rotations of 30–35 years (with sawtimber as the terminal stumpage product). While the returns are greater for sawtimber (if a nearby sawmill takes larger diameter logs), the Internal Rate of Return was still over 10%, before taxes for the CNS scenario.
The main purpose of this study is to examine the dynamics of the softwood CNS stumpage market in Louisiana. By using quarterly data, we specifically estimate demand and supply models of CNS stumpage, and investigate the relationship between CNS and sawtimber stumpage markets. To our knowledge, this is the first empirical estimation of CNS own-price elasticity (PED). Furthermore, we utilize, for the first time, in a peer reviewed publication, a quarterly data series for U.S. softwood stumpage quantities, allowing us to examine more closely the dynamic nature of markets and short-run phenomena. There are a number of papers examining quarterly stumpage prices [4,5], but not quantities, at least in the U.S. markets. For quantities, only annual data is examined in the U.S. stumpage markets, and we found one monthly dataset [6] on the British Columbia stumpage market. In European markets, there are studies that examine stumpage data series, but we only find annual studies [7,8,9]. Many stumpage market papers forego estimating quantities and focus on prices only. For more on quarterly price series papers both in the U.S. and other markets, see [10].
The next section presents a brief overview of the theoretical framework, followed by the econometric method and data. A subsequent section presents empirical results. We conclude with a discussion of the results and the market and possible management implications for CNS stumpage markets in the U.S. South.
2. Theoretical Framework
Due to improvements in data availability and econometric techniques, there has been advancement of price and quantity modeling for forest stumpage products [6,8,11]. As a perfectly competitive commodity, theoretical frameworks for U.S. stumpage markets are usually derived from the profit maximization approach, assuming a perfectly competitive commodity [12,13,14,15]. The auction-based pricing system is widely prevalent in stumpage markets, particularly in the U.S. South. Moreover, forest ownership trends in Louisiana indicate that about 50% of forestland is under corporate ownership [16], and their primary objective is to maximize financial returns. Like the modeling framework of other stumpage products developed by previous studies [11,14,15], we derive state-wide aggregate demand and supply models of the CNS stumpage market in Louisiana based on the foundation of profit maximization.
In a mathematical form, the aggregate demand and supply models of CNS stumpage are formulated in Equations (1) and (2), respectively, as:
where, and denote the quantity of stumpage demanded and supplied in quarter t, and represents the price of CNS stumpage. The demand model is specified as a function of price of stumpage (), softwood lumber price () as a proxy of the final product from CNS, CNS stumpage price in Texas (), and the interest rate () as a proxy of cost of capital. Similarly, in the supply equation, is the CNS harvest margin; is the per-unit severance tax collected by the Louisiana Department of Revenue [17]; and is the price of pine sawtimber in the prior quarter. The dummy variable, represents the period after the 2008 great financial crisis which examines the recovery of the CNS market after the financial crisis. Similarly, we include three quarterly dummy variables to correct the seasonality effects in both demand and supply models. If we ignore the inter-state trade, the market clearing condition suggests that the quantity of CNS demanded should be equal to the quantity supplied. Louisiana retained 84% of its saw-log production for manufacturing in state, with saw-log exports exceeding imports by 670,000 cubic feet in 2013. This equates to roughly 20,000 tons [17]. While not all timber products harvested in Louisiana go to Louisiana mills, the same is true for nearby states; the net effect is a close approximation of the simplified assumption of zero trade in terms of volumes; however, if trade volumes are high, then we should still find strong correlations in the two price series (each state’s price series). We proxy for this effect by using prices from CNS in Texas, the largest trading partner for Louisiana according to the most recent Timber Product Output reports for Louisiana [18]. Polyokav et al. [15] also used the adjoining state with the most interstate trade. In their analysis on Alabama pulpwood markets, they include Mississippi prices, the major exporter of pulpwood products to Alabama at the time of their study. Equilibration in these types of forces may be expressed in the simple terms of Equation (3):
In terms of expected effects of the variables, Equation (4) presents the expected signs of the first-order partial conditions, which represent the individual effects on the demand and supply variables of CNS stumpage. In the demand model, the sawtimber price from one quarter before is expected to have a positive effect on the CNS demand. , as a price of final output of CNS, is expected to have a positive effect, but the sign of is uncertain [14]. We initially included all four traditional inputs of production in the sawmilling process (labor, capital, stumpage, and energy), but the data series are found to be highly correlated with each other. Hence, we drop the wage rate and energy cost from the demand model to avoid multicollinearity in the empirical estimation but keep the opportunity cost of capital . This finding is consistent with prior literature on Louisiana stumpage markets [11].
In the supply side, the sign associated with harvest margin should be positive, as a higher harvest margin should allow for increased profitability for harvest operators. Loggers are, by and large, contracted for cutting and hauling in the U.S. South. As Newman [14] states, the standing timber inventory, as a proxy for harvesting costs, should have a positive impact on the timber supply. Here we use the harvest margin to proxy the effect from the perspective of the contractor’s opportunity cost to harvest. The severance tax should have a negative influence on the CNS supply, since it increases the costs to landowners. The dummy variable representing the post-recession period should have a negative sign for both suppliers and demanders. It is unclear if seasonality positively or negatively influences quantity of harvest (for both suppliers and demanders), nonetheless it may be important given the frequency of our data and estimation.
3. Econometric Method
Most studies employ a simultaneous equation approach of estimating the system of demand and supply equations of forest products using two-stage least square (2SLS) and three-stage least square (3SLS) techniques to correct the simultaneous bias emerging from price and quantity being endogenous [13,14,15,19]. On the other hand, given that data in stumpage markets are time-series data, some of the relatively recent studies use time-series econometrics to estimate a single equation or a system of equations of forest product markets. Parajuli and Chang [11] use the normalized vector error correction (VEC) method to estimate demand and supply equations of the sawtimber market in Louisiana simultaneously. By using the same datasets and theoretical foundation, Parajuli et al. [20] reveal that the coefficient estimates of the demand and supply factors of sawtimber stumpage in Louisiana obtained from 2SLS and VEC methods are similar, if the variables are co-integrated. Given that Hsiao [21,22] and Al-Ballaa [23] validate the 2SLS method to estimate simultaneous equations using time-series data, we also employ the 2SLS econometric approach to correct the endogeneity issue between price and quantity in simultaneous demand and supply equations. Song et al. [24] use the Hsiao approach of estimating demand and supply equations of the U.S. softwood lumber market using the 2SLS method. The 2SLS is a simple, more flexible, and single equation estimation method in which the reduced-form equation is estimated by the ordinary least square procedure [25]. In the 2SLS method, the CNS price variable () is regressed against all exogenous variables. Then, in the second stage, the predicted value of () is used in both the demand and supply equations. Two stages of the estimation method in equation form are:
First stage (Equation (5)):
Second stage (Equations (6) and (7)):
4. Data
Table 1 reports variables, their descriptions, and data sources. We use quarterly time-series data starting from the first quarter of 2003 to the fourth quarter of 2016. The year 2003 is the furthest date, historically, that we could trace back for quarterly CNS harvest data from the Louisiana Department of Revenue. The stumpage price series for CNS in both Louisiana (LA) and Texas (TX), and pine sawtimber are obtained from Timber-Mart South [26]. The harvest margin is calculated by subtracting the stumpage price from the delivered price, which also includes cut and haul costs. The data on the delivered price of CNS is also obtained from Timber-Mart South. Lumber price of #2, 2 × 4 kiln-dried southern yellow pine (westside) is considered as a representative lumber price and its quarterly data are obtained from Random Lengths [27]. The 30-year conventional mortgage rate is used as a proxy of cost of capital, which is obtained from the U.S. Federal Reserve [28]. Furthermore, data on a $/ton severance tax on CNS harvested quantity are retrieved from the Louisiana Department of Revenue [17]. All prices are deflated to the base year of 1982 using the U.S. Producer Price Index (PPI) for all commodities, which is obtained from the U.S. Bureau of Labor Statistics [29].
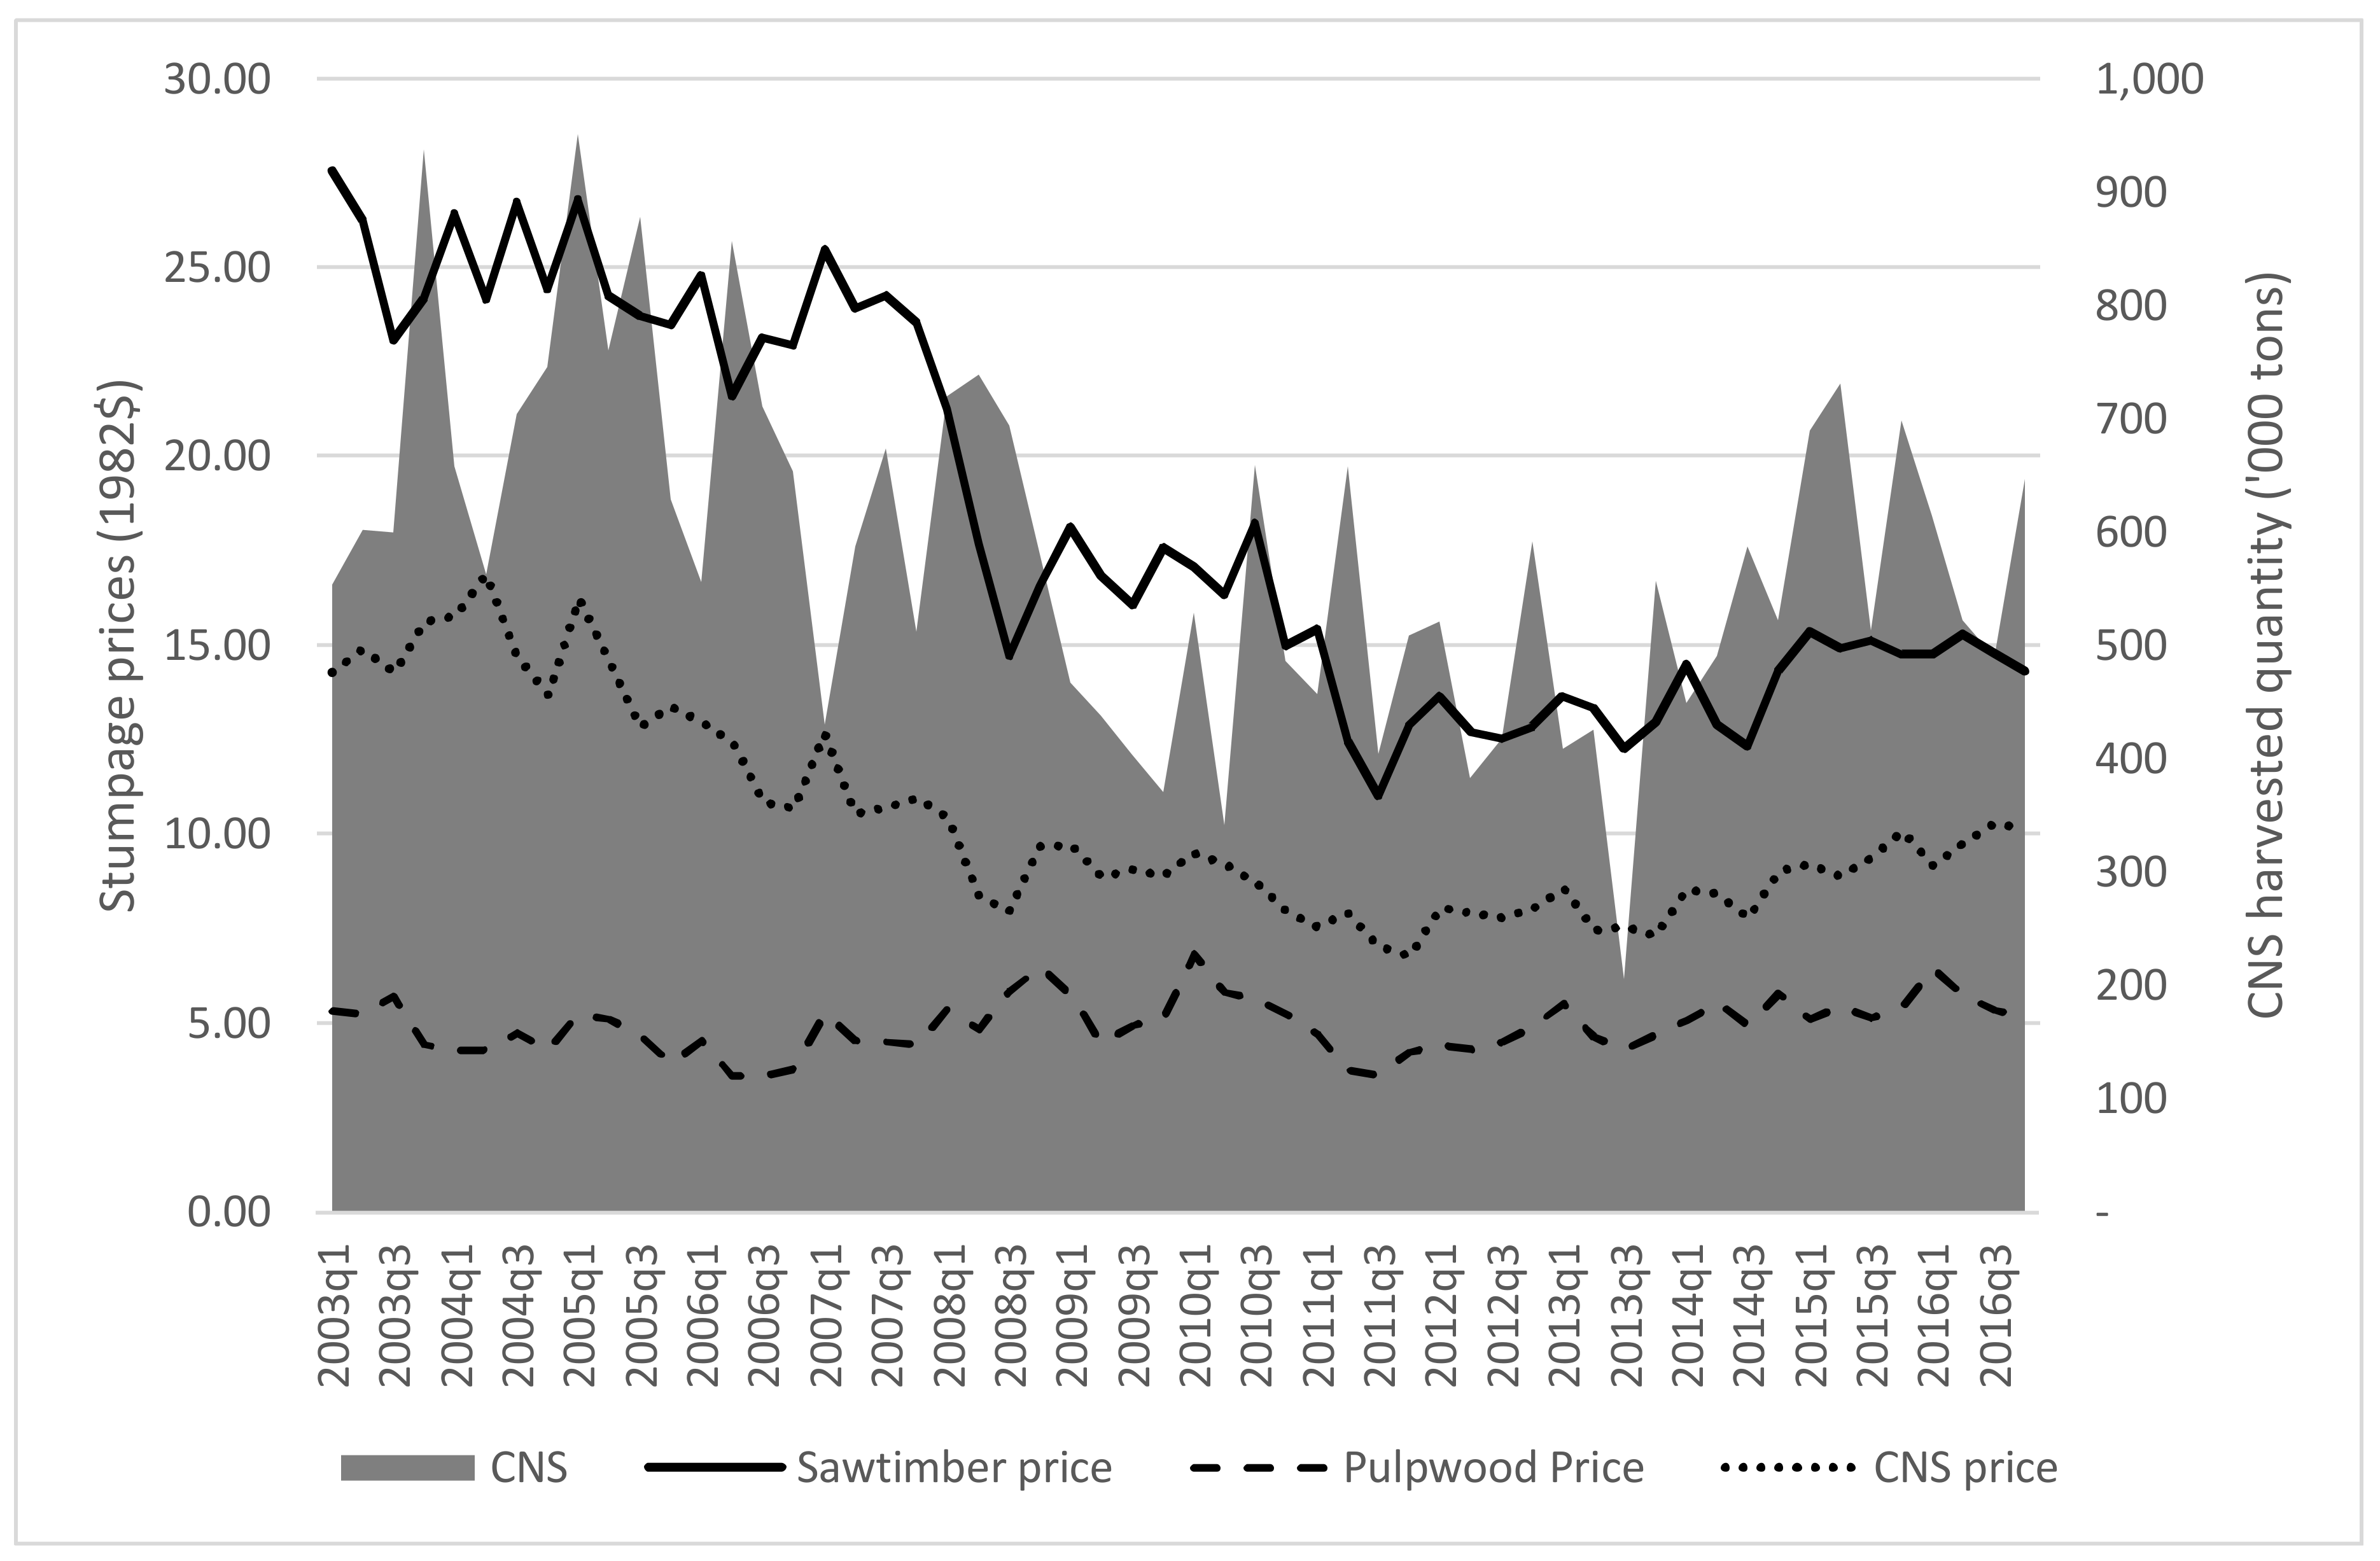
Overall summary statistics of the data in this study are presented in Table 2 below. Fifty-six quarterly observations of all variables are included in the analysis. The quantity of quarterly harvest ranges from 205,000 tons (2013 Q3) to 950,000 tons (2005 Q1) with an average value of about 580,000 tons (Figure 1). Interestingly, when comparing percentage changes from one quarter to the next, directions and rates of change for the level of harvest are strikingly similar over the period examined. However, in periods of rapid change in harvest levels, CNS appears to be more stable in terms of changes (period over period), relative to sawtimber. The real price of CNS stumpage varies widely, from $6.78/ton to $16.91/ton with a mean quarterly price of $10.37/ton from 2003 to 2016. Figure 1 also plots the real price series of the sawtimber stumpage products in Louisiana. It is apparent that two phenomena are occurring. First, prices have fallen significantly since the beginning of the series. These responses are due, in part, to the recession events in late 2008 and early 2009. In real terms, CNS prices in 2016 are roughly two-thirds that of their prices in 2003. Sawtimber prices have fared even worse, at 60% of their levels in 2016 to that of 2003. For the end-use product, lumber prices of westside 2 × 4 kiln-dried Southern yellow pine (SYP) price series has tracked in real terms from approximately $210/mbf to $230/mbf. Further, the harvest margin has remained around $10/ton in real terms over the entire range; however, there are interesting subtleties that should be noted here. Since the recession, the CNS harvest margin experienced less variance than pre-recession. This is likely due to the consolidation of wood using mills across the Southeast since the recession period.
Lastly, severance tax incidence on CNS tonnage has decreased by 50% over the period, from $0.80/ton in 2003 to under $0.40/ton by the end of 2016, representing the largest percentage drop of severance tax among the softwood timber products in Louisiana over the observed range.
5. Results
Table 3 presents the 2SLS coefficient estimates of demand and supply factors of CNS stumpage in Louisiana. Most of the variables are statistically significant at 10% and 5% levels. Since all data series, apart from binary dummy variables (), are log-transformed, estimated coefficients represent the elasticity values. In terms of model specification tests, the test of over-identifying restrictions cannot reject the hypothesis that surplus instruments are valid in both demand and supply equations. Moreover, the Portmanteau (Q) test for white noise on residuals suggests that no problem of autocorrelation exists in either model. The residual-based augmented Dickey-Fuller test [24] reveals that errors are stationary, suggesting that variables are co-integrated in each equation and the 2SLS method is appropriate in time-series data.
In the CNS supply equation, all variables are statistically significant (Table 3). The own-price elasticity of supply (PES) value is 0.59, which indicates that a 1% increase in CNS price leads to increase in CNS stumpage supply by 0.59%. The elasticity value of less than unity means inelastic supply. As expected, severance tax on CNS was negatively and significantly related to stumpage supplied by landowners. The mean severance tax on CNS for the study was 35¢/ton, a 10% increase in the inflation adjusted tax rate, reducing stumpage harvest by 3%. This result adds an interesting wrinkle to the stumpage price literature, as it indicates that stumpage suppliers will forego harvesting as the tax incidence increases.
The harvest margin is positively and significantly related to CNS harvest, across several model specifications. The higher the margin, the more profitable (over and above landowner reservation price and hauling and logging costs to the mill) to harvest for loggers, thus making logging operatorsmore available to landowners (as it lowers their opportunity cost of logging activity for other products), ceteris paribus. At the time of higher harvest margin, loggers and other timber buyers are more likely to mitigate landowners’ search costs, as their (the wood buyer) incentive to harvest is increased. Depending on the market dynamics at the time, it, in fact, could mean higher (relative to previous quarters) prices for stumpage, thus not being a “cost” to landowners.
On the demand side, own-price elasticity of demand (PED) is, as expected, negative and significant with a value of −1.18, which infers that quantity demanded for CNS stumpage drops by 1.18% in response of an increase in the CNS price by 1%.
Likewise, examination of a possible cross-price elasticity of demand (XED) for sawtimber (t − 1) on the quantity demanded for CNS stumpage revealed a coefficient of 0.97, indicating an almost one-to-one substitutability. As we are not aware of any other published literature on CNS elasticity and the relationship to sawtimber prices, we attempted several lag structures to determine the best model fit, while adhering to theoretical expectations. Sawtimber prices are significant (at the 5% level) with up to four lags included (XEDt−2 = 1.23; XEDt−3 = 1.39; XEDt−4 = 1.20). The cross price elasticity increases (CNS stumpage becomes more elastic) up to a lag of three periods, and then decreases at the fourth lag. We did not find a significant affect with no lag structure. Further, there is also an interaction with respect to own-price elasticityfor CNS. As we introduce lags in the sawtimber price, the own-price elasticity coefficient fluctuates, but remains over 1.0 for all lag structures: PED = 1.20, 1.07, and 1.43, and it returns to 1.21 if we introduce a fifth sawtimber price lag and is still significant (5% to 10%).
We also control for interactions of CNS markets in other nearby states, by including Texas CNS price in the demand equation. Arkansas and Mississippi CNS were tested as well, with similar results. While the Texas CNS price has the predicted sign, the influence on CNS stumpage demand in Louisiana is insignificant, seemingly suggesting that CNS stumpage from Texas is not a substitute to CNS stumpage in Louisiana. While there is interstate trade of these products, this result suggests that the amount is not sufficient to effect price, when LA sawtimber prices are included in the model. However, if we remove the LA sawtimber, Texas CNS is significant and positive. However, Arkansas and Mississippi CNS price remains insignificant. We believe the reasoning is simple: the largest nearby housing markets to Louisiana are Dallas, TX and Houston, TX, both on Louisiana’s western border. As pressure builds for CNS products in Texas, the TX CNS price rises, putting pressure to harvest more CNS product in nearby Louisiana markets.
Similarly, SYP lumber price is positively and significantly related to CNS stumpage demand, indicating that a 1% increase in the price of lumber in the market corresponds to a CNS stumpage demand movement upward by 0.60%. The coefficient estimate associated with mortgage rate did not display a statistically significant relationship to CNS demand.
Concerning our post-recession variable, which is included to evaluate the recovery and performance of the CNS stumpage market after the great financial crisis of 2007–2009, CNS demand in Louisiana is down substantially since the crisis. The results reveal that the CNS stumpage demand (and supply) in Louisiana has decreased by about 25% (both statistically significant) after the financial crisis of 2007–2009.
6. Discussion and Conclusions
Our findings indicate that the long-run own-price elasticity values in the demand and supply models of the softwood CNS stumpage market are statistically significant with magnitudes of −1.18 and 0.59, respectively. To our knowledge, this is the first study to provide estimates of own-price elasticity for CNS stumpage or a cross-price elasticity with respect to sawtimber prices, and the only study to examine quarterly stumpage harvesting phenomena in the Southeastern softwood stumpage market (specifically studies including quantities, not merely price studies). Further, it is only the second study to include CNS prices in the stumpage modeling literature [2]. Interestingly, we find that own-price elasticity of demand is elastic (unlike pulpwood and sawtimber). This result is reasonable as CNS, in theory and in practice, can substitute for sawtimber stumpage, at least in the case of 2 × 4 s. Therefore, as prices for CNS drop, relative to sawtimber price, mills are eager to bid for the product. We speculate that in markets where sawmills are located that produce more 2 × 4 s, or have technology that can utilize smaller logs, we expect a more elastic response. However, in markets where sawtimber is predominantly utilized for larger lumber products (2 × 10 s, 2 × 12 s, etc.) or plywood products, there are fewer substitution possibilities available to mill managers and procurement personnel, and we would expect this coefficient to be less elastic.
On the supply side, the own-price elasticity of CNS is larger (more elastic) in magnitude to that of sawtimber in Louisiana, indicating that the decisions to harvest or postpone harvest are more responsive to real price changes (relative to sawtimber stumpage), and this is perhaps due to CNS being an intermediate product and sawtimber being a final product. The choice to engage in a second thinning (or liquidate entirely) for landowners may be a function of the current CNS price, and not made at the time of stand establishment. This phenomenon could be magnified in depressed sawtimber markets as it increases the opportunity cost of growing the stand to sawtimber size logs.
The rationale for using the lagged price of sawtimber is that for the time horizon of price discovery and transaction costs for mills to coordinate with harvesting operators, the response may be quicker than three months (quarterly data), but we do not, currently, have access to more frequent prices. Interestingly, cross-price elasticity of sawtimber continues to become more elastic (to a point) over subsequent quarters, indicating stronger cross-product substitution as time passes, ceteris paribus.
Our lumber finding indicates that changes in CNS demand were slightly more responsive to lumber prices than sawtimber demandin Louisiana [11]. However, the data periods are so dissimilar, that this may merely be coincidental (their time period was 1955–2013).
Results suggest that the CNS price in Texas has no impact on CNS stumpage demand in Louisiana. However, this is only true when LA sawtimber prices were included.While prior research indicates that timber markets display interrelatedness in softwood sawtimber marketsin the south-central states, this finding would indicate the same may not be true of CNS markets, at least for Louisiana [2]. Polyakov et al. [15] also report a similar finding in the case of pulpwood markets in Alabama and Mississippi. We did not include other nearby states’ CNS prices (such as Arkansas); while we expected similar results [30], they were insignificant across all specifications. Still, we recommend at least testing some model specifications that include the price series of the state nearby, which has the greatest import/export of CNS raw wood products to the state under examination. In the present analysis, Texas CNS prices are most appropriate in terms of trade volumes. However, the net effect was small, in terms of wood flows from (to) Texas (Louisiana).
Suppliers respond to severance tax incidence on CNS stumpage products. This is expected and profound for stumpage market analysis. Given the ability to wait for lower taxes due to the nature of stumpage products, landowners appear to engage in tax avoidance with respect to harvesting behavior, even after controlling for stumpage prices. While most states do not have a severance tax, this result should be considered by those conducting price and quantity analyses in those states with a severance tax on CNS and other stumpage products and, perhaps, states that have significant interstate trade with a state that has a severance tax. It is not clear if this holds for other stumpage products. Anecdotal comments from forest consultants in Louisiana are that it is true for harvesting pulpwood, but not sawtimber. Additionally, the form that the severance tax takes may influence how much or how little tax avoidance behavior is engaged in by suppliers.
From a policy standpoint, if states are interested in generating more severance tax from harvesting, a more careful calculation is required to determine the optimal tax revenue generated by harvesting stumpage products. From a forest management perspective, reducing severance taxes when markets are depressed would increase harvesting levels for CNS, and this has positive implications for forest health and stand dynamics and a reduction in associated forest risks (i.e., fire, insects, and disease).
Lastly, there are timber stand management implications. With rising relative prices (of CNS to sawtimber), the landowner is faced with an intertemporal opportunity cost and the decision of whether to clear cut at age 20–25 and begin reforestation, or add a second thin and increase the age of the final harvest. We believe this choice will depend on the market faced by the individual supplier. A formal theoretical model mapping this decision-making process could be useful for future study and the implications for timber stand management decisions. It is obvious that both suppliers and demanders are more responsive to changes in CNS prices, relative to other stumpage products. When prices of CNS are high, second thins (or total liquidations) are likely, and when they are not, the inverse is likely, with a shorter rotation length of sawtimber size stumpage as the final product, ceteris paribus.
A couple of limitations of this study are worth mentioning. Our results are of a limited quarterly dataset, so the outcomes may be specific to phenomena occurring over the data range. The period examined is one of profound economic turmoil, therefore, caution is advised in applying the elasticity measures to other periods, without conducting a separate empirical estimation for that observed period. In any event, our findings need to either be confirmed, augmented, or refuted with subsequent analysis in this area with further study. We recommend more analysis be conducted on CNS markets where possible, in other states. Moreover, this study analyzes the quarterly softwood chip-n-saw market scenario in Louisiana. Obviously, similar analysis of other Louisiana stumpage products would be of value. Additionally, now that there is sufficient data for estimating an integrated multi-product model including all three products typical softwood stumpage products (sawtimber, pulpwood and CNS in a set of structural equations could be useful to explain market dynamics more precisely, this would help in better understanding the interrelationships among the three stumpage products and their interactions with each other.
Acknowledgments
The authors wish to thank Daowei Zhang, Sun J. Chang, Cameron Roig, and Pat Aronstein, as well as several anonymous reviewers. Any remaining errors of judgment, logic, or fact rest strictly with the author(s).
Author Contributions
S.M.T. and R.P. conceived and designed the research problem; R.P. and S.M.T. collected and analyzed the data; S.M.T. and R.P. wrote the paper. Both authors revised the paper and approved the final version.
Conflicts of Interest
The authors declare no conflict of interest.
References
- Supreme Court of Louisiana. Severance Tax on Natural Resources. 1997. Available online: http://law.justia.com/cases/louisiana/supreme-court/1997/97c0244-opn.html (accessed on 30 June 2017).
- Parajuli, R.; Tanger, S.; Joshi, O.; Henderson, J. Modeling prices for timber stumpage in the South-Central Region. Forests 2016, 7, 148. [Google Scholar] [CrossRef]
- Stewart, P. How Big Will Trees Grow? Landowner Questions. Forest2Market Blog. 2011. Available online: https://blog.forest2market.com/landowners-and-tree-owners-get-answers-sawtimber-vs-chip-n-saw (accessed on 30 June 2017).
- Ning, Z.; Sun, C. Vertical price transmission in timber and lumber markets. J. For. Econ. 2014, 20, 17–32. [Google Scholar] [CrossRef]
- Prestemon, J.P.; Pye, J.M.; Holmes, T.P. Temporal aggregation and testing for timber price behavior. Nat. Resour. Model. 2004, 17, 123–162. [Google Scholar] [CrossRef]
- Sun, L.; Clapper, J.; Niquidet, K. A panel data analysis of coastal log supply in British Columbia. For. Sci. 2015, 61, 731–736. [Google Scholar] [CrossRef]
- Hänninen, R.; Toppinen, A.; Toivonen, R. Transmission of price changes in sawnwood and sawlog markets of the new and old EU member countries. Eur. J. For. Res. 2007, 126, 111–120. [Google Scholar] [CrossRef]
- Bolkesjo, T.; Buongiorno, J.; Solberg, B. Joint production and substitution in timber supply: A panel data analysis. Appl. Econ. 2010, 42, 671–680. [Google Scholar] [CrossRef]
- Jaunky, V.C.; Lundmark, R. Dynamics of timber market integration in Sweden. Forests 2015, 6, 4617–4633. [Google Scholar] [CrossRef]
- Klepacka, A.M.; Siry, J.P.; Bettinger, P. Stumpage prices: A review of influential factors. Int. For. Rev. 2017, 19, 158–169. [Google Scholar]
- Parajuli, R.; Chang, S.J. The softwood sawtimber stumpage market in Louisiana: Market dynamics, structural break and Vector Error-Correction Model. For. Sci. 2015, 61, 904–913. [Google Scholar] [CrossRef]
- Adams, D.; Blackwell, J. An econometric model of the United States forest products industry. For. Sci. 1973, 19, 82–96. [Google Scholar]
- Adams, D.M.; Haynes, R.W. The 1980 timber assessment market model: Structure, projections, and policy simulations. For. Sci. 1980, 26, a0001–z0001. [Google Scholar]
- Newman, D.H. An econometric analysis of the southern softwood stumpage market; 1950–1980. For. Sci. 1987, 33, 932–945. [Google Scholar]
- Polyakov, M.; Teeter, L.D.; Jackson, J.D. Econometric analysis of Alabama’s pulpwood market. For. Prod. J. 2005, 55, 41–44. [Google Scholar]
- Butler, B.J.; Butler, S.M. Family Forest Ownerships with 10+ Acres in Louisiana, 2011–2013; Res. Note NRS-218; U.S. Department of Agriculture, Forest Service, Northern Research Station: Newtown Square, PA, USA, 2016. [Google Scholar]
- LA DOR. Louisiana Department of Revenue. News and Publications. 2017. Available online: https://revenue.louisiana.gov/NewsAndPublications/Publications (accessed on 16 April 2018).
- Wall, D.J.; Bentley, J.W.; Cooper, J.A.; Gray, J.A.; Blazier, M.; Tanger, S.M. Louisiana’s Timber Industry—Timber Product Output and Use, 2015; e-Science Update–SRS—136; U.S. Department of Agriculture Forest Service, Southern Research Station: Asheville, NC, USA, 2017. [Google Scholar]
- Liao, X.; Zhang, Y. An econometric analysis of softwood production in the US South: A comparison of industrial and nonindustrial forest ownerships. For. Prod. J. 2008, 58, 69–73. [Google Scholar]
- Parajuli, R.; Zhang, D.; Chang, S.J. Modeling stumpage markets using vector error correction versus simultaneous equation estimation approach: A case of the Louisiana Sawtimber Market. For. Policy Econ. 2016, 70, 16–19. [Google Scholar] [CrossRef]
- Hsaio, C. Statistical properties of the two-stage least squares estimator under cointegration. Rev. Econ. Stud. 1997, 64, 385–398. [Google Scholar] [CrossRef]
- Hsaio, C. Cointegration and dynamic simultaneous equations model. Econometrica 1997, 65, 647–670. [Google Scholar] [CrossRef]
- Al-Ballaa, N.R. Test for cointegration based on two-stage least squares. J. Appl. Stat. 2005, 32, 707–713. [Google Scholar] [CrossRef]
- Song, N.; Chang, S.J.; Aguilar, F.X. US softwood lumber demand and supply estimation using cointegration in dynamic equations. J. For. Econ. 2011, 17, 19–33. [Google Scholar]
- Hill, R.C.; Griffiths, W.E.; Lim, G.C. Principles of Econometrics, 4th ed.; John Wiley & Sons: Hoboken, NJ, USA, 2011; 784p. [Google Scholar]
- Timber Mart-South (TMS). Louisiana Stumpage Prices Quarterly (Various Issues); Timber Mart-South: Athens, GA, USA, 2016. [Google Scholar]
- Random Lengths. Yearbook: Forest Product Market Prices and Statistics (Various Issues); Random Lengths Publications, Inc.: Eugene, OR, USA, 2016. [Google Scholar]
- U.S. Federal Reserve. Selected Interest Rates (Daily). 2017. Available online: https://www.federalreserve.gov/releases/h15/ (accessed on 16 April 2018).
- U.S. Department of Labor, Bureau of Labor Statistics. Producer Price Indexes. 2017. Available online: http://www.bls.gov/ppi/ (accessed on 16 April 2018).
- Yin, R.; Newman, D.H.; Siry, J. Testing for market integration among southern pine regions. J. For. Econ. 2002, 8, 151–166. [Google Scholar] [CrossRef]
Figure 1.
Quarterly chip-n-saw (CNS) harvested quantity and price series of sawtimber and chip-n-saw stumpage products in Louisiana, USA (Data sources: Louisiana Department of Revenue and Timber Mart-South).
Figure 1.
Quarterly chip-n-saw (CNS) harvested quantity and price series of sawtimber and chip-n-saw stumpage products in Louisiana, USA (Data sources: Louisiana Department of Revenue and Timber Mart-South).


Table 1.
Econometric variables in the study, their descriptions, and sources.
| Variable | Description | Unit | Source |
|---|---|---|---|
| qt | Quantity of CNS harvested | tons | LA Department of Revenue |
| pcnst | CNS stumpage price in Louisiana (LA) | $1982/ton | Timber-Mart South |
| plumbert | Price of #2 2 × 4 random, kiln-dried southern yellow pine (westside) | $1982/mbf | Random Lengths |
| pcnstxt | CNS stumpage price in Texas (TX) | $1982/ton | Timber-Mart South |
| rt | 30-year conventional mortgage rate | % | US Federal Reserve |
| hmargint | CNS harvest margin—difference between stumpage and delivered prices | $1982/ton | Timber-Mart South |
| staxt | Per unit severance tax on CNS harvested quantity | $1982/ton | LA Department of Revenue |
| psawtimt | Pine sawtimber stumpage price in LA | $1982/ton | Timber-Mart South |
| post_recs | Post-2008 financial crisis period | 0 or 1 | 1 for 2009 Q2 afterwards |
Table 2.
Summary of data used in empirical estimation: 2003 Q1–2016 Q4 (price series are in $1982).
| Variable | Obs | Mean | Std. Dev. | Min | Max |
|---|---|---|---|---|---|
| qt | 56 | 580,112.80 | 149,777.60 | 205,202.50 | 951,028.5 |
| pcnst | 56 | 10.37 | 2.71 | 6.78 | 16.91 |
| plumbert | 56 | 195.34 | 44.90 | 128.70 | 289.2 |
| pcnstxt | 56 | 9.60 | 2.71 | 5.42 | 15.60 |
| rt | 56 | 4.99 | 1.03 | 3.36 | 6.60 |
| hmargint | 56 | 9.77 | 1.09 | 6.50 | 12.34 |
| staxt | 56 | 0.35 | 0.15 | 0.19 | 0.60 |
| psawtim | 56 | 18.31 | 5.06 | 11.00 | 27.55 |
| post_recs | 56 | 0.54 | 0.50 | 0 | 1 |
Table 3.
The results of two-stage least squares regression of the chip and saw (CNS) stumpage market in Louisiana: 2003 Q1–2016 Q4.
Table 3.
The results of two-stage least squares regression of the chip and saw (CNS) stumpage market in Louisiana: 2003 Q1–2016 Q4.
| Variable | CNS Supply | CNS Demand | ||
|---|---|---|---|---|
| Coefficient | Robust SE | Coefficient | Robust SE | |
| Intercept | 10.67 *** | 0.83 | 10.46 *** | 1.42 |
| CNS stumpage price (pcnst) | 0.59 *** | 0.23 | –1.18 * | 0.68 |
| CNS harvest margin (hmargint) | 0.45 ** | 0.21 | ---- | --- |
| CNS severance tax (staxt) | −0.31 ** | 0.13 | ---- | --- |
| Lagged sawtimber price (psawtimt−1) | 0.97 ** | 0.46 | ||
| SYP lumber price (plumbert) | ---- | --- | 0.60 * | 0.32 |
| CNS price in Texas (pcnstxt) | 0.34 | 0.31 | ||
| Mortgage rate (rt) | ----- | ----- | −0.62 | 0.43 |
| Post_recession 2009 Q2 (post_recs) | −0.25 *** | 0.09 | −0.25 * | 0.15 |
| Quarter 1 | −0.08 | 0.07 | −0.05 | 0.08 |
| Quarter 2 | −0.06 | 0.07 | −0.12 | −0.08 |
| Quarter 3 | −0.10 | 0.08 | −0.08 | 0.09 |
| External instruments | 2 | 2 | ||
| First-stage Cragg-Donald F-statistic a | 55.66 | 12.63 | ||
| Test of overidentifying restrictions b | 0.58 (0.44) | 2.61 (0.11) | ||
| Portmanteau (Q) test for white noise at 4 lags | 0.63 (0.96) | 2.05 (0.72) | ||
| Residual-based ADF test c | −3.48 *** | −4.31 *** | ||
* p < 0.1, ** p < 0.05, *** p < 0.001. Values in brackets are p-values; a A null hypothesis that instruments are weak; b Score χ2 test; c Augmented Dickey-Fuller test statistics for the stationarity of residuals.
© 2018 by the authors. Licensee MDPI, Basel, Switzerland. This article is an open access article distributed under the terms and conditions of the Creative Commons Attribution (CC BY) license (http://creativecommons.org/licenses/by/4.0/).
Share and Cite
MDPI and ACS Style
Tanger, S.M.; Parajuli, R. Toward an Elasticity of Chip-N-Saw: Demand and Supply Models of Chip-N-Saw Stumpage in Louisiana. Forests 2018, 9, 211. https://doi.org/10.3390/f9040211
AMA Style
Tanger SM, Parajuli R. Toward an Elasticity of Chip-N-Saw: Demand and Supply Models of Chip-N-Saw Stumpage in Louisiana. Forests. 2018; 9(4):211. https://doi.org/10.3390/f9040211
Chicago/Turabian StyleTanger, Shaun M., and Rajan Parajuli. 2018. "Toward an Elasticity of Chip-N-Saw: Demand and Supply Models of Chip-N-Saw Stumpage in Louisiana" Forests 9, no. 4: 211. https://doi.org/10.3390/f9040211
Note that from the first issue of 2016, this journal uses article numbers instead of page numbers. See further details here.