Contrast Effects of Vegetation Cover Change on Evapotranspiration during a Revegetation Period in the Poyang Lake Basin, China


1
Key Laboratory of Watershed Geographic Sciences, Nanjing Institute of Geography and Limnology, Chinese Academy of Sciences, Nanjing 210008, China
2
School of Earth Sciences and Engineering, Hohai University, Nanjing 211100, China
*
Author to whom correspondence should be addressed.
Forests 2018, 9(4), 217; https://doi.org/10.3390/f9040217
Submission received: 5 March 2018
/
Revised: 16 April 2018
/
Accepted: 17 April 2018
/
Published: 19 April 2018
(This article belongs to the Special Issue Afforestation and Reforestation: Drivers, Dynamics, and Impacts)
Abstract
:It is known that evapotranspiration (ET) differs before and after vegetation change in watersheds. However, impacts of vegetation change on ET remain incompletely understood. In this paper, we investigated the process-specific, nonclimatic contribution (mainly vegetation coverage changes) to ET at grid, sub-basin, and basin scales using observation and remote sensing data. The Poyang Lake Basin was selected as the study area, which experienced a fast vegetation restoration from 1983 to 2014. Our results showed that vegetation cover change produced contrasting effects on annual ET in magnitude and direction during shifts from a less covered to a more covered stage. At the early stage (1983–1990), with vegetation cover of 30%, vegetation cover change produced negative effects on ET over the basin. At the middle stage (1990–2000), the vegetation coverage increased at a fast pace and the negative effects gradually shifted to positive. At the late stage (2000–2014), the vegetation coverage remained high (over 60%) and maintained a positive relationship with ET. In summary, the vegetation effects are collaboratively influenced by both vegetation coverage and its change rate. Our findings should be helpful for a comprehensive understanding of complicated hydrological responses to anthropogenic revegetation.
1. Introduction
Evapotranspiration (ET), including transpiration and evaporation, represents terrestrial water consumption [1]. It is the crucial component which couples water cycle and energy balance, and hence is a subject of focus in the field of global change. ET is dominated by climatic controls, including not only demand (e.g., air temperature, air vapor pressure and wind speed) but also supply factors (precipitation and solar radiation) [2]. More importantly, it is quite sensitive to human activities, such as vegetation cover change due to anthropogenic vegetation restoration [3]. It is well known that a vegetation cover change could alter the leaf area in a canopy, consequently altering the canopy transpiration and interception area, potentially affecting canopy transpiration and evaporation [4]. Meanwhile, a variation in vegetation cover can impact land surface albedo, affecting absorbed radiation energy for evapotranspiration [5]. Nevertheless, vegetation cover change can alter the radiation allocations in soil, and therefore influence soil evaporation [6]. All these additive and/or offsetting effects will determine the total amount of evapotranspiration in response to vegetation cover change at the basin or regional scale.
Previous studies have widely investigated the influences of vegetation restoration on ET in vegetated watersheds [7,8,9,10]. However, there remains a debate on the magnitudes and directions of the influences. Using a distributed Soil and Water Assessment Tool (SWAT) model, Fang et al. [11] observed that changes in vegetation cover classes and areas significantly affected hydrological elements in northeastern China. In addition, the increases of vegetation cover areas all led to increases in actual ET [11]. Some other studies have also supported this view and demonstrated that an increased vegetation cover could reduce runoff because of an enhanced canopy interception and ET [12,13,14,15,16,17,18,19]. In contrast, several studies have pointed to a negative relationship between vegetation cover and annual ET at multiple spatial scales [15,20]. Although the ET difference before and after revegetation has been extensively studied with field observations, remote sensing, and hydrological model simulation, how vegetation cover variation impacts ET at different stages of revegetation remains incompletely understood.
In this paper, we attempted to shed light on the differences in the effects of vegetation cover change on ET in continuous periods of a vegetation changing process, and to detect the contribution of vegetation cover and climates to ET based on field observation and remote sensing data. Here, the Poyang Lake Basin was selected as the study area, which is a typical subtropical humid basin in the middle reaches of the Yangtze River [21]. Over the last decades, the basin has experienced a fast vegetation restoration process dominated by afforestation, where forest coverage increased from 33.1% to 63.1% [22,23,24]. Given the important role of water resources and ecological services in southeastern China, the hydrological responses, especially the ET response, to this fast vegetation restoration over the basin have aroused extensive attention. This study is helpful to understand feedbacks of anthropogenic revegetation to hydrological processes, and supports effective water resource management in subtropical humid basins.
2. Materials and Methods
2.1. Study Area
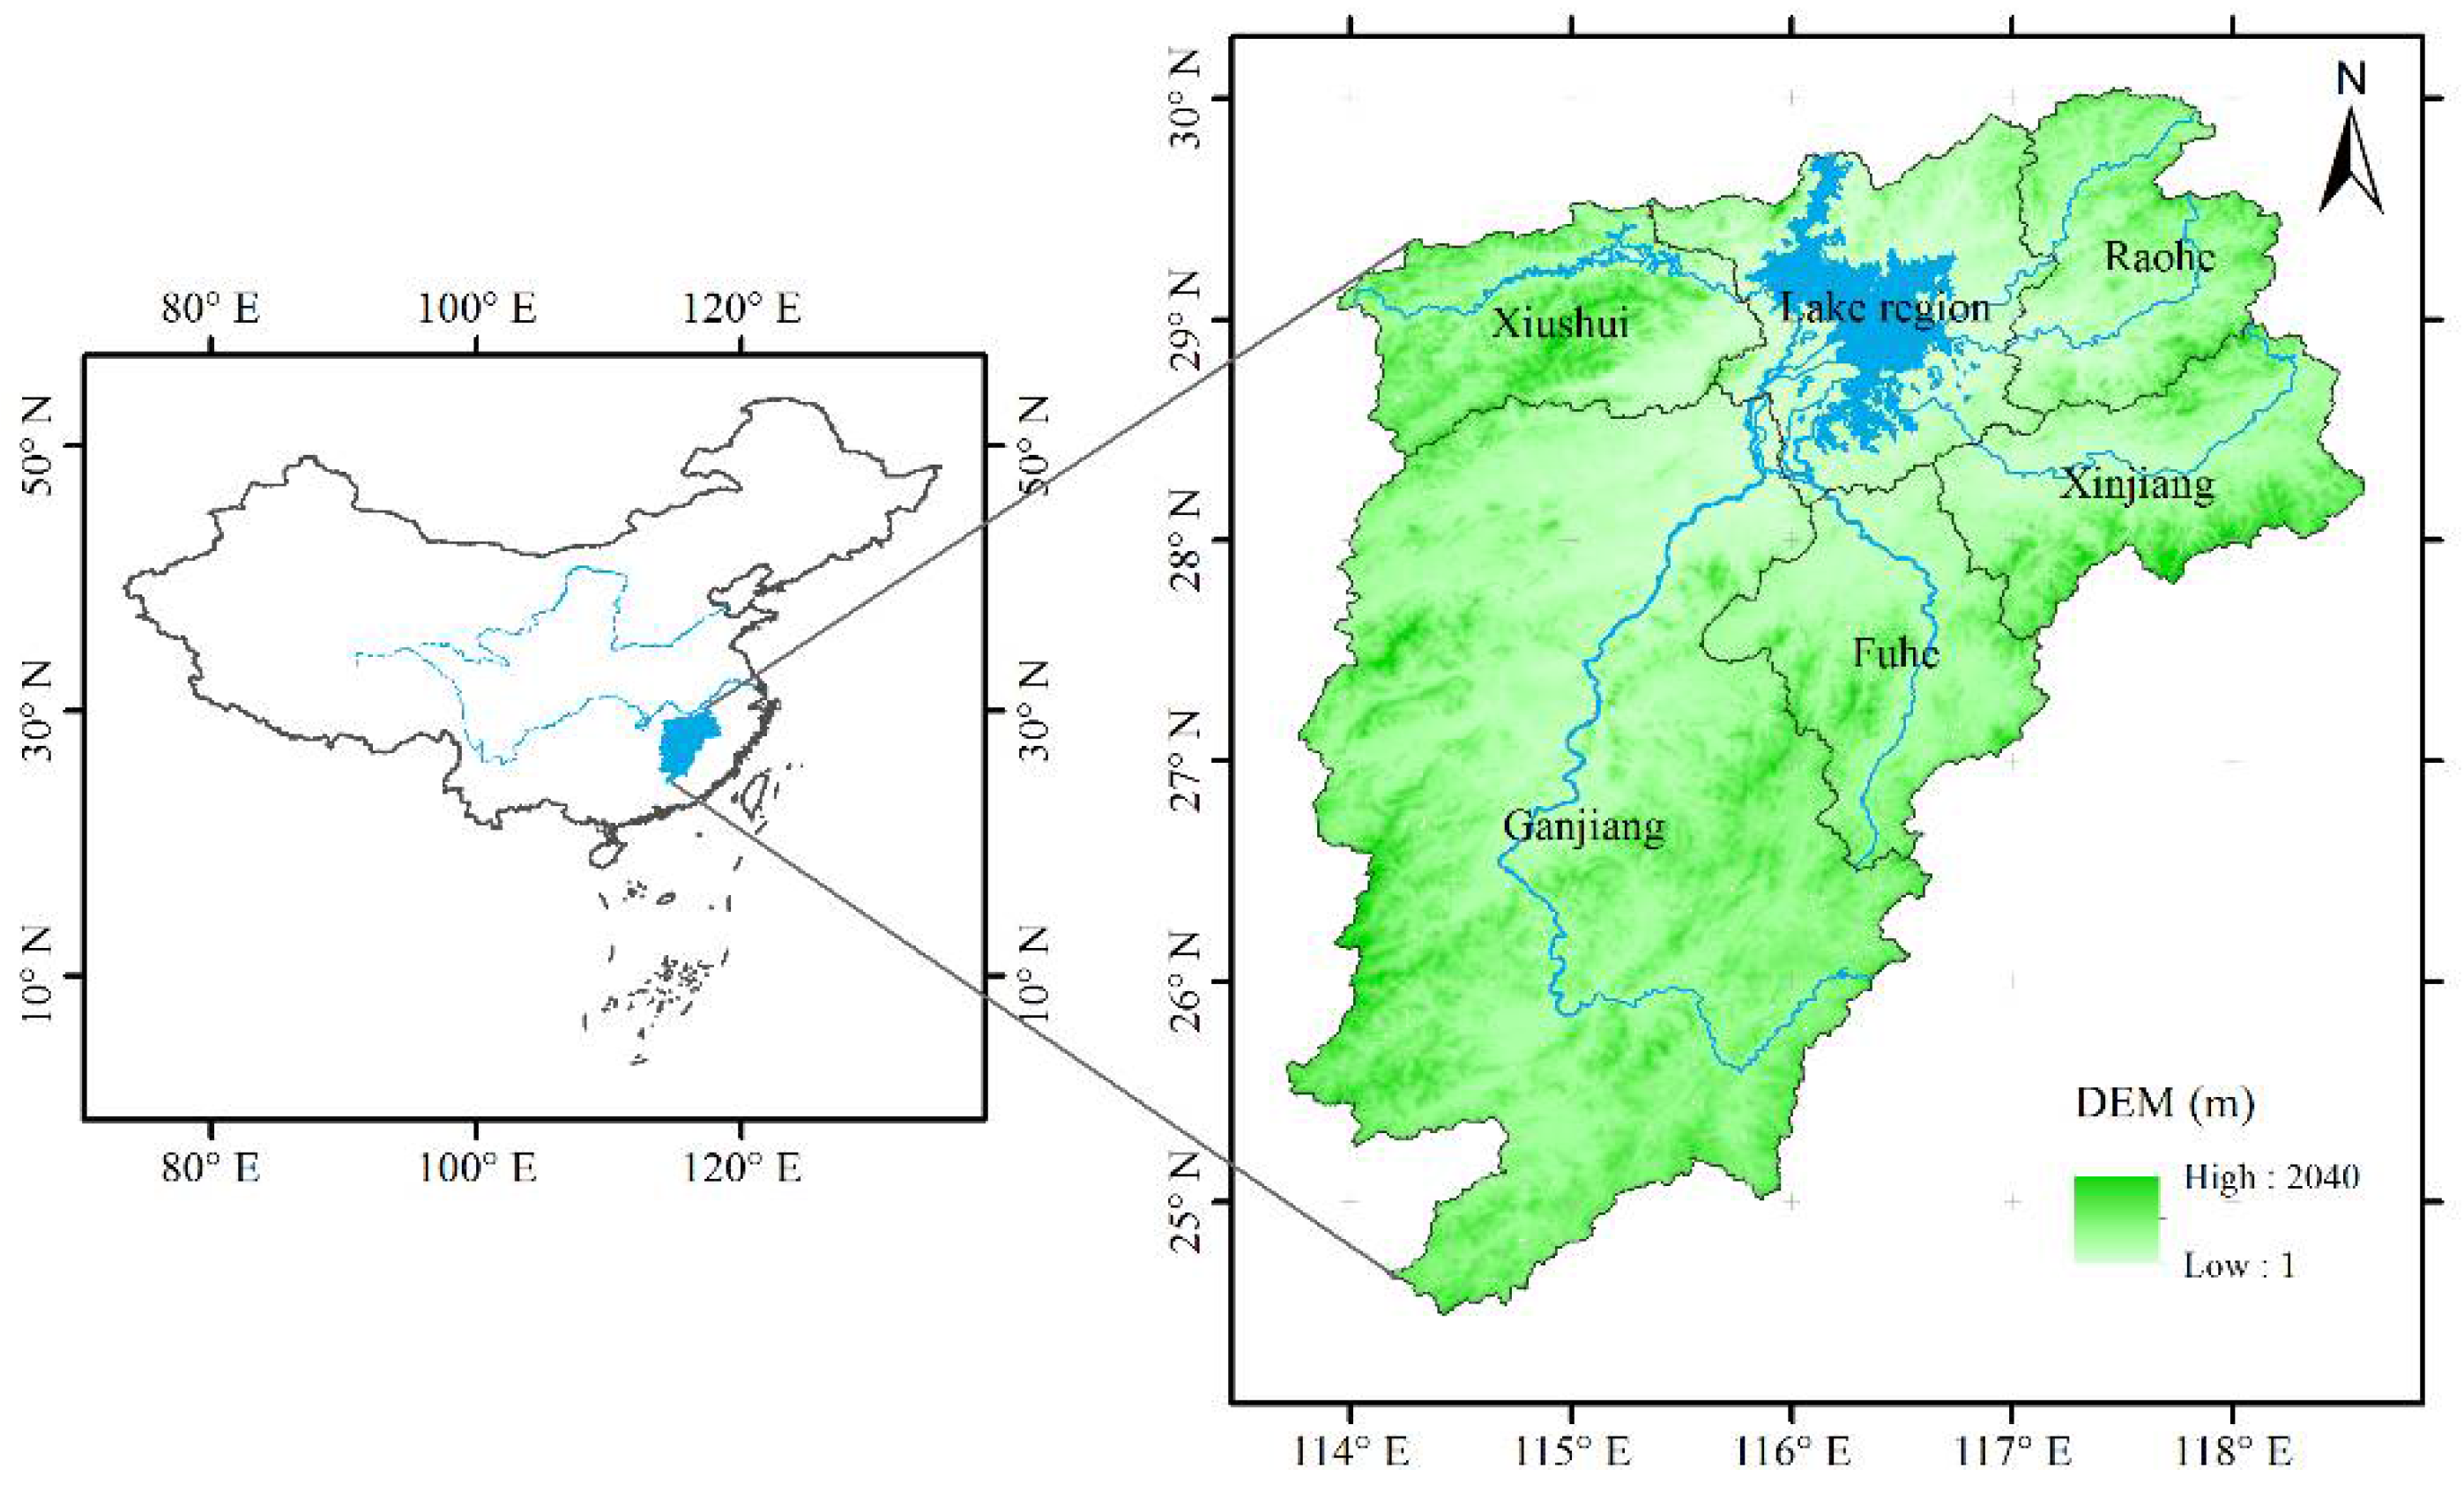
Poyang Lake is the biggest freshwater lake in China, and is located on the south bank of the middle reaches of the Yangtze River (24.5° N–30.1° N, 113.6° E–118.5° E) (Figure 1) [21]. Its watershed size is about 1.6225 × 10⁵ km2, accounting for 9% of the total Yangtze River Basin. The river systems of the Poyang Lake Basin are quite developed, containing Ganjiang River, Fuhe River, Xinjiang River, Raohe River, Xiushui River, and their multiscale branch rivers. The Poyang Lake Basin is an important component of the river systems of the Yangtze River.
The Poyang Lake Basin is a typical humid basin with a subtropical monsoon climate, of which annual temperature and precipitation range from 16.3 to 17.5 °C and from 1341 to 1943 mm, respectively. The vegetation cover in the basin experienced an outstanding dynamic process during the last decades [22,23,24]. The basin suffered from three severe deforestations from the 1950s to the 1970s, and the forest coverage dropped to 33.1% in 1978. Due to the reforestation in the 1990s, the forest cover gradually increased and in 2011 rose to 63.1% across the basin, implying that vegetation cover has exhibited a continuously fast increase over the past three decades, mainly resulting from anthropogenic vegetation restoration. In order to eliminate effects of the water exchange between the Poyang Lake and the Yangtze River and between runoff to evaporation, the open water body of the Poyang Lake was excluded from our present analysis.
2.2. Data Preprocessing
To calculate vegetation cover, we used the Global Inventor Modeling and Mapping Studies (GIMMS) Normalized Difference Vegetation Index (NDVI) version 3g.v1 dataset with a resolution of 0.083° covering the period of 1983–2014 at half-month intervals [25,26]. This NDVI dataset has been corrected for orbital drift effects, calibration, viewing geometry, stratospheric volcanic aerosols, and other errors unrelated to vegetation change [26,27]. The method to calculate vegetation cover is described in the following section. To eliminate white noise points from various sources, the maximum value compositing method (vegetation cover) was used to accumulate NDVI 3g dataset [28].
Two widely used satellite-based evapotranspiration datasets adopted in this study were the Advanced Very High Resolution Radiometer (AVHRR) monthly ET product [29,30] with a spatial resolution of 8 km covering the period 1983–2006, and the Moderate Resolution Imaging Spectroradiometer (MODIS) ET monthly product [31] with a resolution of 1 km covering the period 2001–2014. Both datasets were aggregated to 0.083° according to the spatial resolution of the NDVI data. Then, these two datasets were combined based on the overlapping period to obtain a long-time series of ET from 1983 to 2014.
Climatic variables potentially impacting evapotranspiration change considered in our present work were surface air temperature (temp), precipitation (prec), solar radiation (srad) and wind speed (wind) [32]. The meteorological datasets were available from China Meteorological Forcing Dataset, with a resolution of 0.1° covering the period of 1983–2014 at month intervals [31]. These meteorological data were also resampled to 0.083° based on the digital elevation model (DEM) of the Poyang Lake Basin, to match the resolution of the NDVI data.
In addition, field survey data of vegetation cover was available from the Statistics Yearbook. Monthly hydrological observation data (e.g., runoff, precipitation, etc.) were collected to validate our satellite-based vegetation cover and evapotranspiration data [33].
To reduce interannual impacts of climatic variables, we used the GIMMS NDVI data to obtain a long-time series of vegetation coverage based on a new optimized dimidiate pixel model that adopts dynamic background values and MODIS Vegetation Cover product [34].
The NDVI value of a pixel represents the combined vegetation and soil signal. According to the dimidiate pixel model, vegetation coverage (VC) is calculated as follows:
where NDVIsoil denotes the NDVI value of a bare-soil pixel (i.e., soil background value), NDVIveg denotes the NDVI value of a pure-vegetation pixel (i.e., vegetation background value). To improve the precision of estimated VC, the NDVI background value can be optimized with observation data of VC as follows:
where VCmax and VCmin represent the maximum and minimum value of vegetation coverage in satellite image, respectively, NDVImax and NDVImin represent the corresponding maximum and minimum value of NDVI, respectively. Here the MODIS Vegetation Cover data were used to auxiliary determine NDVIsoil and NDVIveg.
2.3. Change Detection Approach
In this study, simple linear regression—the first-difference de-trending method—and multivariate linear regression were used at both grid and basin scales over the Poyang Lake Basin. The trends of vegetation cover, ET and climatic factors (temp, prec, srad and wind) were determined by the slope of the simple linear regression model. The first-difference de-trending method (i.e., the difference of values in one year to its previous year) was used to remove non-climatic influences (mainly vegetation cover change) on ET [32,35,36,37,38], thereby segregating the impacts of vegetation cover and climatic factors on ET.
In order to quantify the contribution of climatic factors, multivariate linear regression [2] was conducted with the first differences of climatic factors as the predictor variables, and the first difference in ET as the response variable,
where ∆ET is the de-trended ET; atemp, aprec, asrad, and awind are the regression coefficient of the predictors; ∆Temp, ∆Prec, ∆Srad, and ∆Wind are the de-trended climatic factors.
Assuming that the responses of dependent variables to climate trends and year-to-year climate variations are similar [35,36], climatic contribution to ET trends can be quantified by the above regression coefficients and the trends of climatic factors [35],
where QTemp, QPrec, QSrad, and QWind are the trends of climatic factors; Qc is the climatic contribution to the trend of ET.
The surplus of the whole ET trend and the trend caused by climatic factors is identified as the trend caused by nonclimatic factor (e.g., anthropogenic vegetation cover change), and thus the nonclimatic contribution can be quantified [39],
where Qnc is the non-climatic contribution to the trend of ET, Q is the trend of ET.
In addition, the relative climatic and nonclimatic contributions are calculated as follows,
where RCc and RCnc are the relative contributions of climatic and nonclimatic change, respectively.
To investigate the differences in the effects of vegetation cover change on ET in the continuous periods of the fast vegetation changing process, all the above analysis methods were applied over a 15-year moving window from 1983 to 2014. Within each 15-year window, both the relative nonclimatic contribution to ET variabilities and the corresponding mean and trend of vegetation cover were calculated to explore their relationships at different scales. All the spatial data preparation and statistical analysis of data were conducted with ArcGIS 10.3 (Esri, Redlands, CA, USA) and MATLAB R2017a (MathWorks, Natick, MA, USA).
3. Results
3.1. Temporal-Spatial Patterns of Vegetation Cover and ET over the Poyang Lake Basin
Figure 2 exhibits the vegetation coverage between satellite-based and field survey data over the Poyang Lake Basin during 1983–2014. Overall, the correlation coefficient (r) between the satellite-based and survey-based vegetation cover is 0.94, which indicates that the satellite-based vegetation cover could appropriately capture the vegetation changing process in the study area. Figure 2 also displays the interannual variation of ET and vegetation cover over the entire Poyang Lake Basin from 1983 to 2014. The vegetation grew nearly twice in area during the period. Vegetation cover was low in the 1980s (about 30%). After a quick revegetation from 1990 to 2000, it increased to 60% and has maintained a slow increase since 2000. The annual ET first decreased and then increased over the entire basin during the whole study period. Specifically, it decreased from 740 mm/year to 655 mm/year since 1983 and then increased since 2002. As of 2014, the annual ET rose to 708 mm/year.
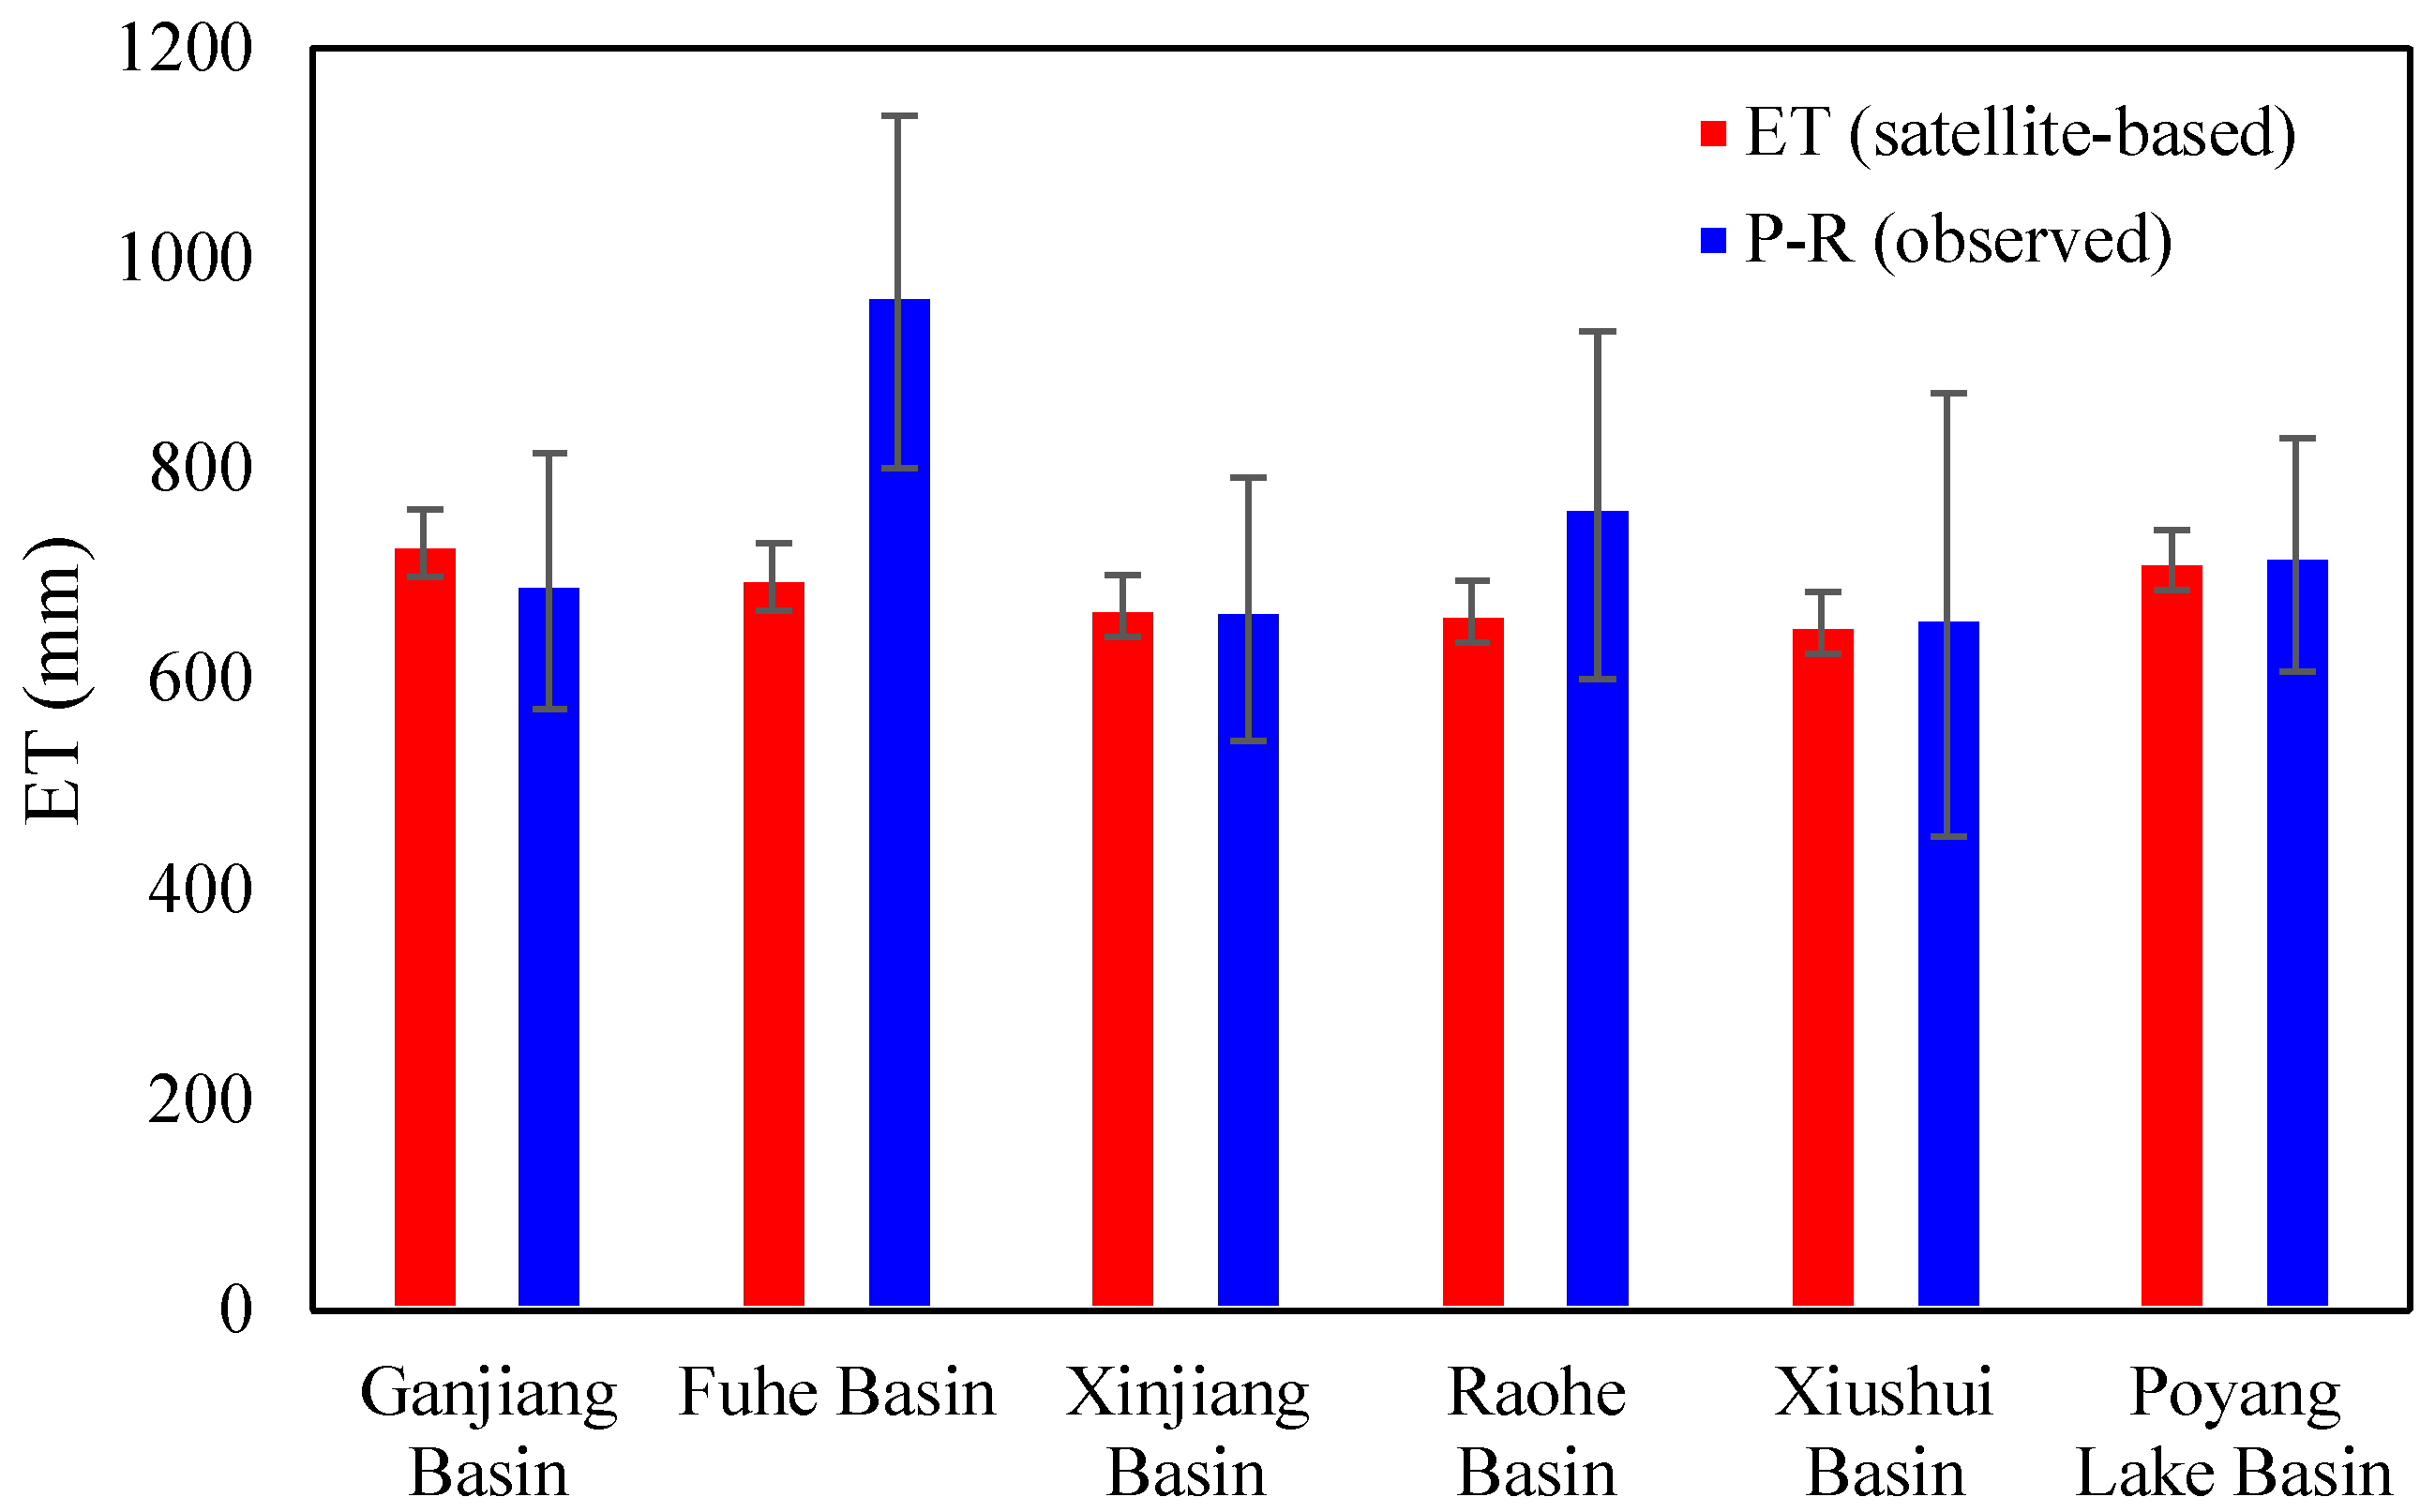
Figure 3 compares the satellite-based ET with that calculated from a water balance equation using observed hydrological data over five sub-basins and the entire basin. The calculated/observed ET is the difference between precipitation (P) and runoff (R) in a long period. It indicates that the multi-year average of satellite-based ET was consistent with that of the calculated ET (=P − R) with a quite low error (6 mm/year) over the entire basin. At the sub-basin scale, the Fuhe Basin exhibited the largest error in which the observation-based ET was larger than the satellite-based one. This is due to the fact that about four billion cubic meters of water was transferred from the Fuhe Basin to the Ganjiang Basin to meet irrigation needs, leading to an overestimate in the Fuhe Basin and an underestimate in the Ganjiang Basin, compared to satellite-based ET.
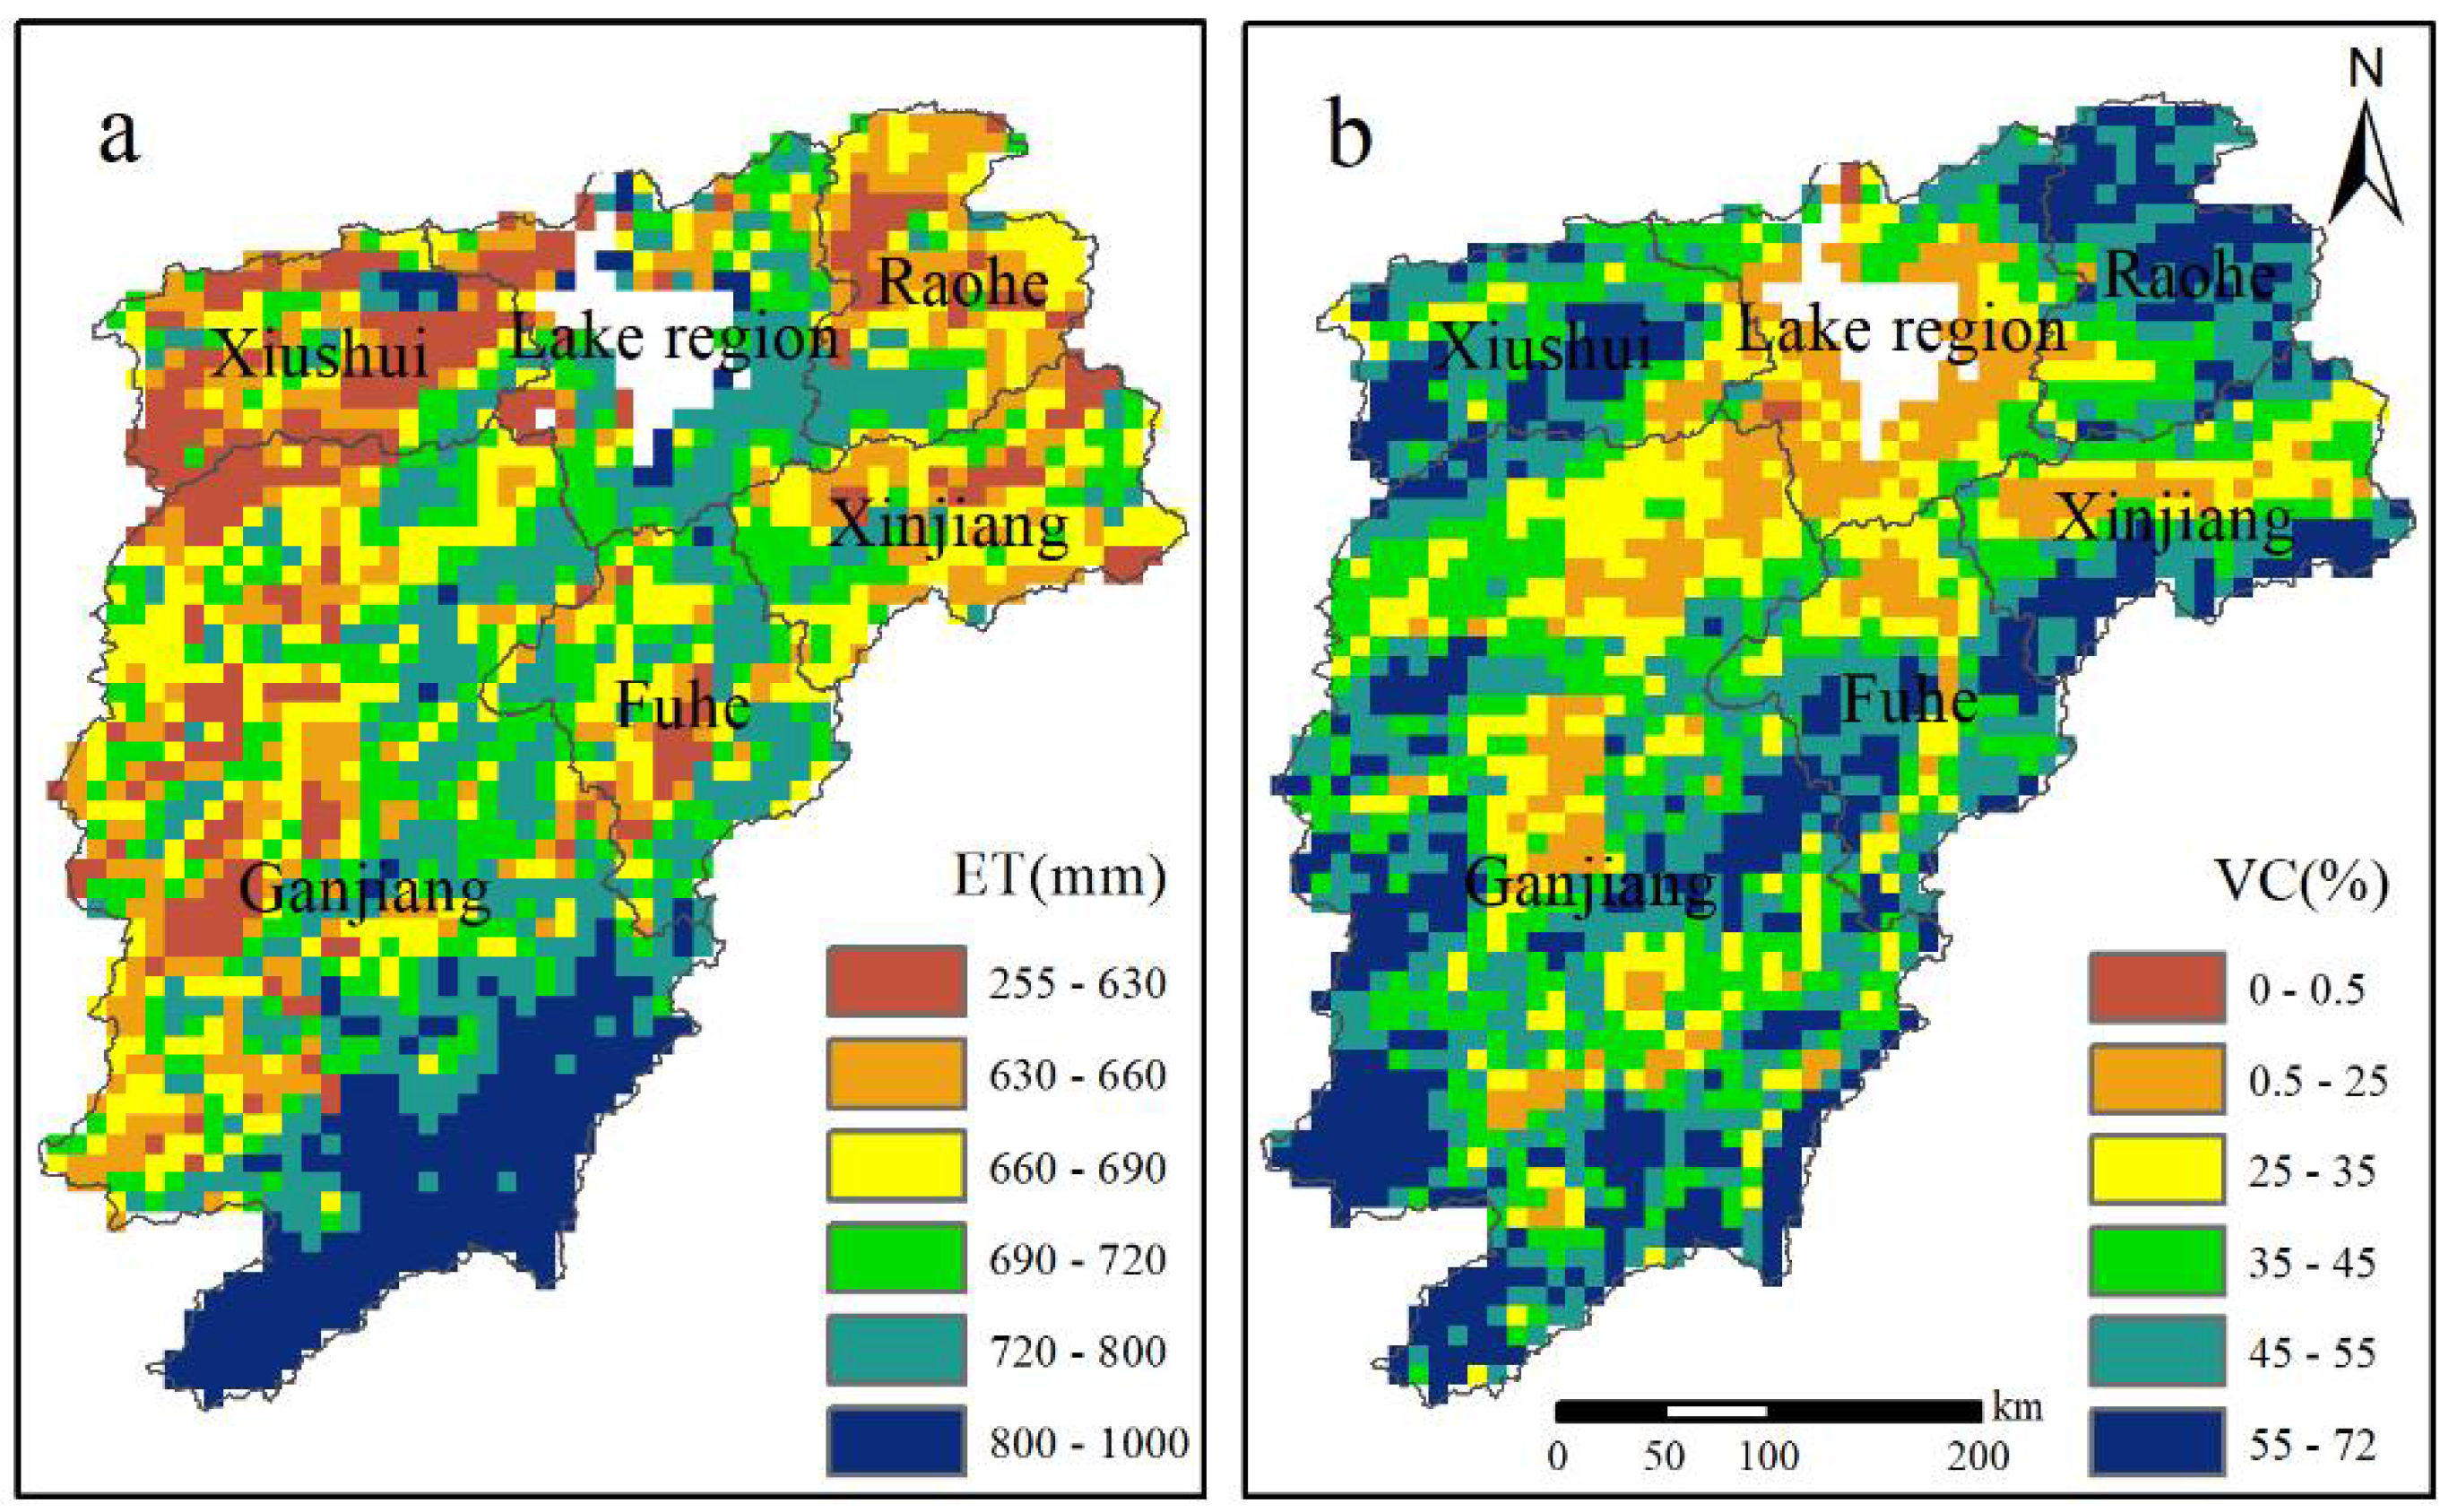
Figure 4 shows the spatial distribution of the multiyear mean values of annual ET and vegetation cover during 1983–2014 over the basin. The multiyear average of annual ET was 718 mm and the annual vegetation cover was 41.9% in the Poyang Lake Basin. In general, vegetation cover in the upper reaches of each sub-basin was relatively high (over 50%). Vegetation cover gradually reduced from the inlands towards the river channels. Notably, the lake region exhibited the lowest vegetation cover in the whole study area. Annual ET exhibited a negative relationship with vegetation cover in space over the Poyang Lake Basin. That is, the ET was relatively lower in forestlands with a high vegetation cover than that in croplands and wetlands with a low vegetation cover. The ET was the highest near Poyang Lake over the study area, followed by the plain fields in the lower reaches. The ET was low in upland forest areas. Notably, ET was quite high (over 800 mm/year) in the southern Ganjiang Basin where the Masson pine forest dominated.
3.2. Relative Climatic and Nonclimatic Contributions to Variabilities of ET
According to the interannual variability of vegetation cover, we divided the study period into three stages over the whole of the study area. The first stage is from 1983 to 1990, which is the early stage of vegetation restoration. The second stage is from 1990 to 2000, which is the stage of fast revegetation. The third stage is from 2000 to 2014, which is the stage of slow revegetation.
Figure 5 illustrates the relative climatic and nonclimatic contributions to ET variabilities in each grid across the whole basin. The relative non-climatic contribution (anthropogenic vegetation cover change) were negative in 1983–1990, 1990–2000, and positive in 2000–2014. Specifically, the nonclimatic contribution was −85.1% in 1983–1990, −88.6% in 1990–2000, and 56.6% in 2000–2014. By contrast, the relative climatic contribution was 14.9%, −11.4% and 43.4%, respectively. It indicates that the nonclimatic factors contributed more than the climatic factors did.
During the early stage of vegetation restoration (1983–1990), the relative nonclimatic contribution to ET change was mainly negative in the Raohe Basin, Xinjiang Basin, and Fuhe Basin, which accounts for 70% of the study area. In the second stage (1990–2000), the relative contribution was 60% for over 90% of the study area. During the third stage (2000–2014), the nonclimatic contribution became positive for nearly half the area, mostly in the Xinjiang Basin, Fuhe Basin, and Xiushui Basin. The contribution remained as a weak negative effect in the Raohe Basin and south of Ganjiang Basin.
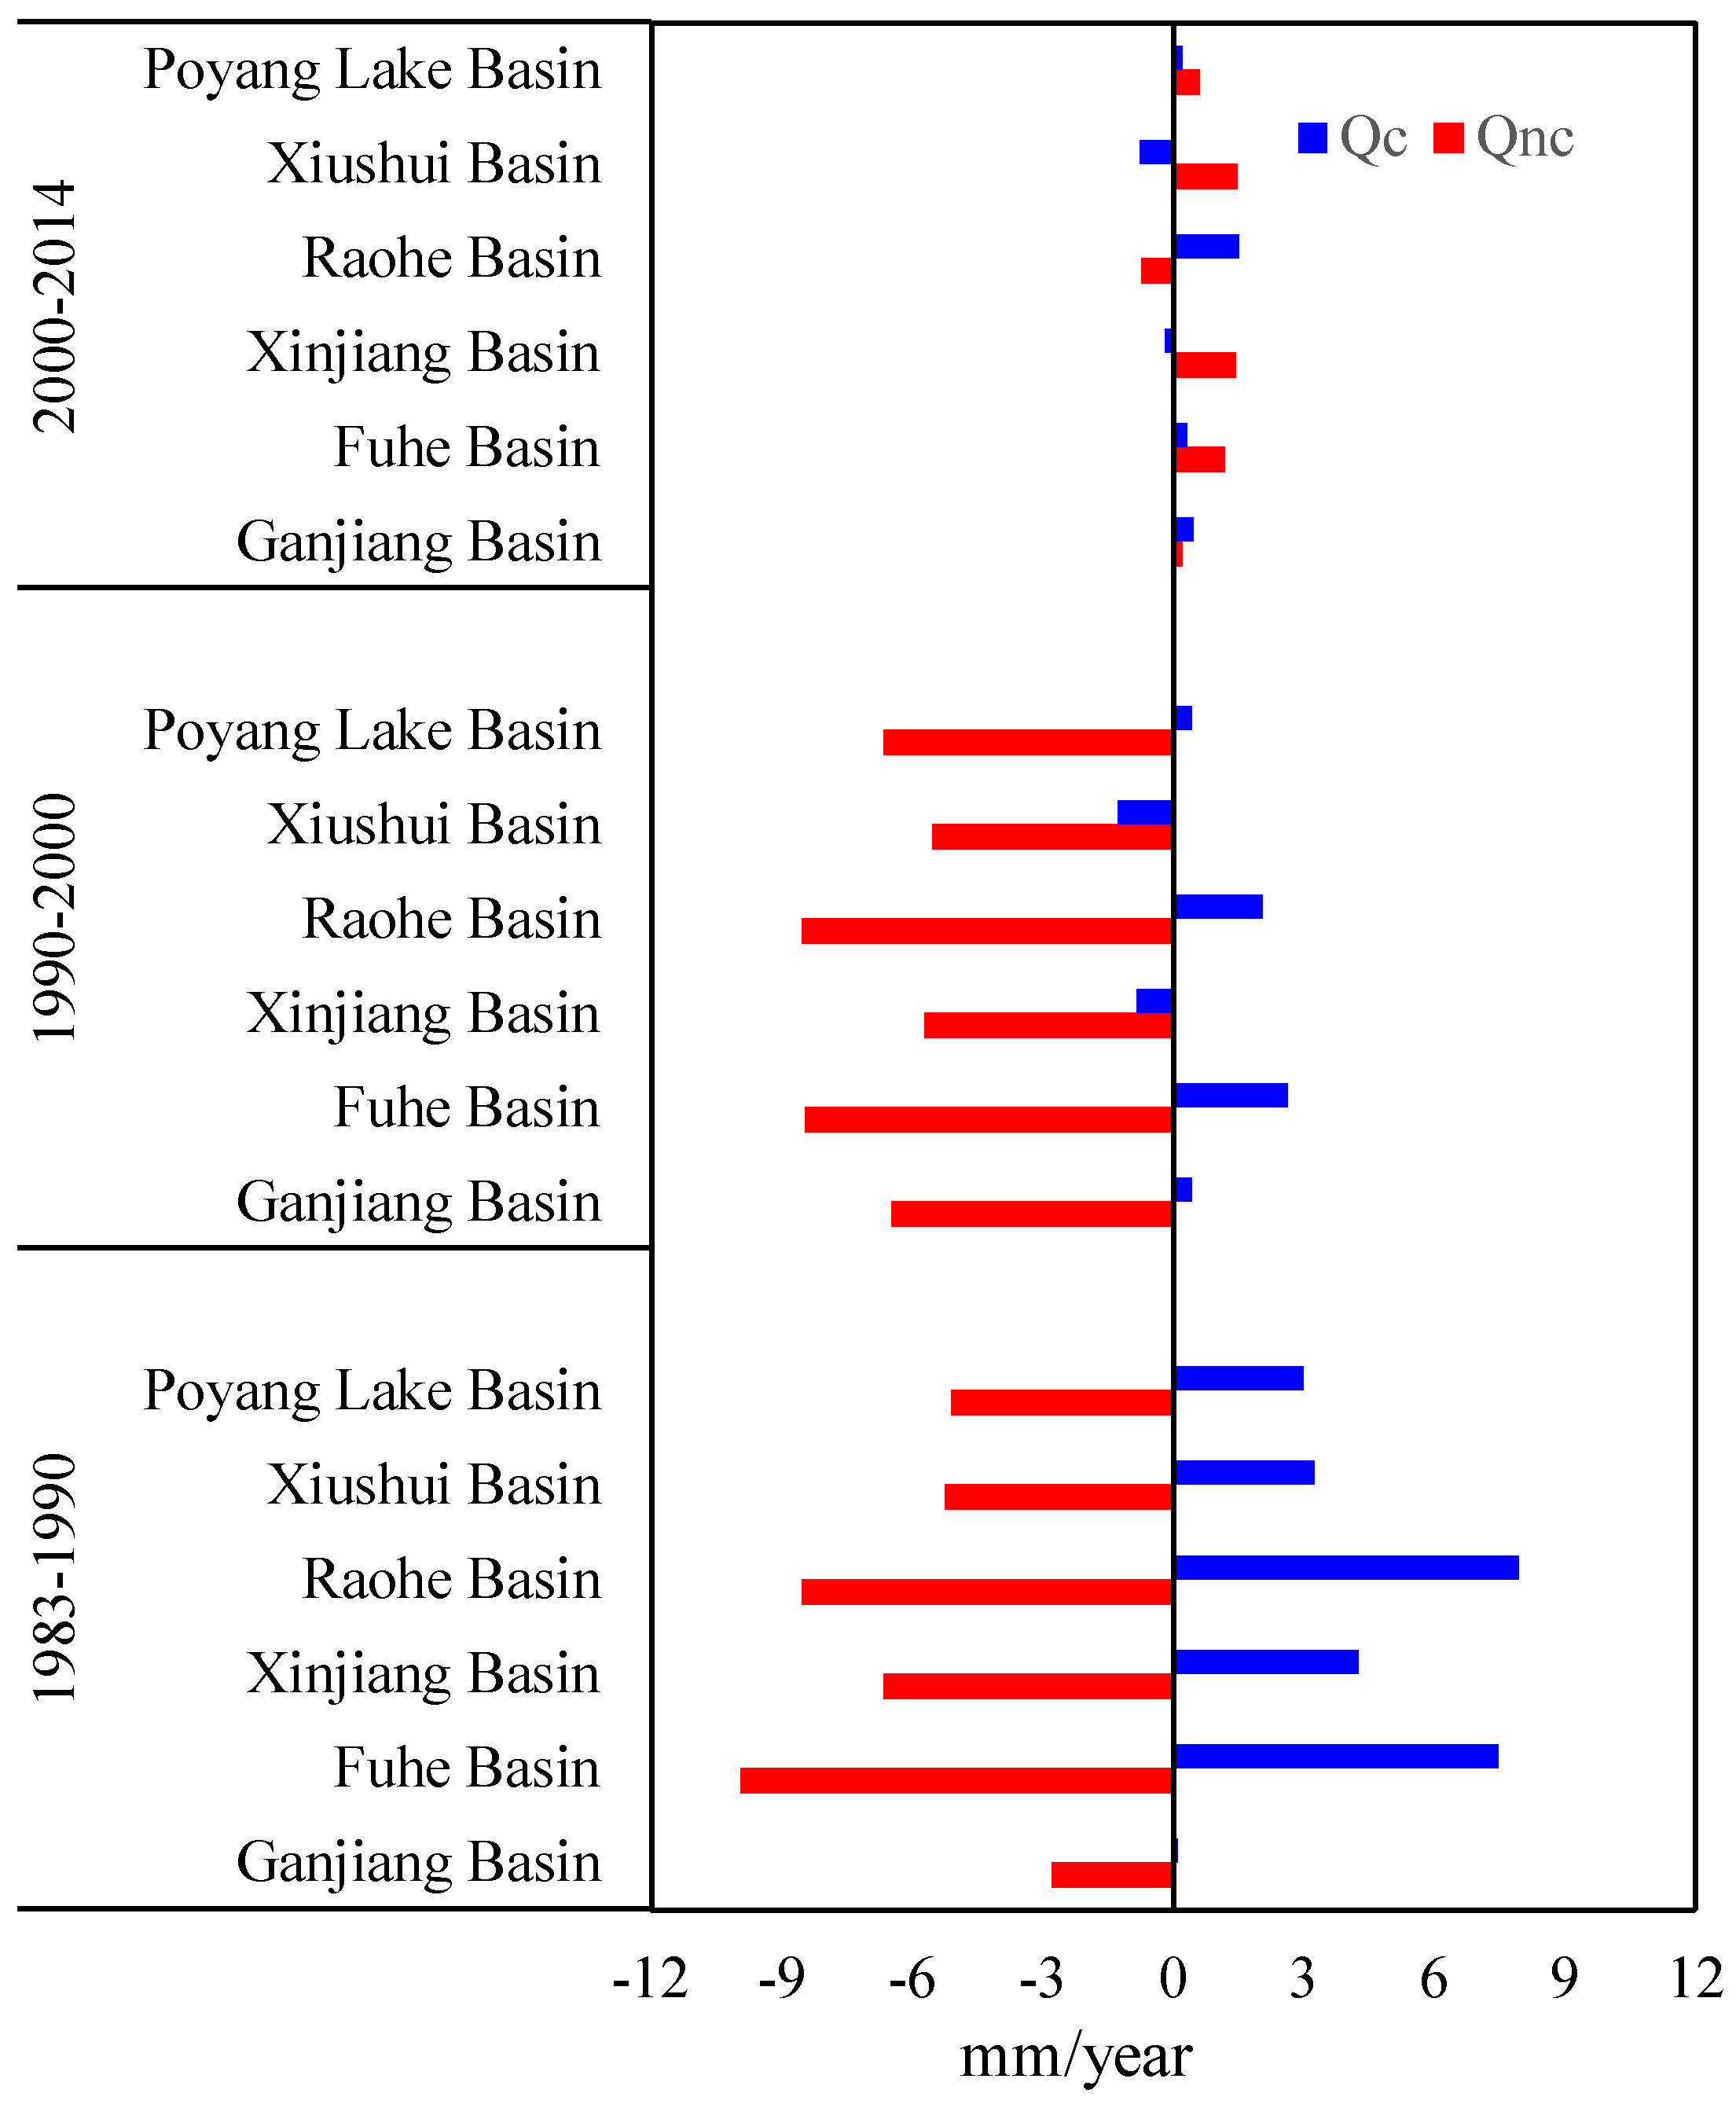
Figure 6 shows climatic and nonclimatic contributions to annual ET trends in absolute value in the Poyang Lake Basin and its sub-basins. At the early stage of vegetation restoration (1983–1990), the nonclimatic factors contributed to annual ET trends (Qnc) by −5.1 mm/year, and the climatic factors contributed by 3.0 mm/year. Moreover, the Qnc values were negative while the Qc values were positive in all sub-basins. At the second stage of fast restoration (1990–2000), Qc decreased to 0.4 mm/year but Qnc increased to −6.6 mm/year over the entire Poyang Lake Basin. All the Qnc values were negative in five sub-basins with the values higher than 5 mm/year. Qc was lower than Qnc. It was positive in the Raohe, Fuhe and Ganjiang Basins, but negative in the Xiushui and Xinjiang Basins. In the late stage (2000–2014), Qnc became the lowest and was positive except for the Raohe Basin. Qc remained positive in the sub-basins except the Xinjiang and Xiushui Basins.
3.3. Relationships between Non-Climatic Contribution and Vegetation Cover
The above analysis demonstrates that the nonclimatic contribution to ET varied dramatically in the study period, implying that the nonclimatic factors may have played important roles in regulating basin-scale ET. Given that the dominant nonclimatic variable was anthropogenic vegetation cover change in the present study, here we examined the relationships between the nonclimatic contribution and the corresponding vegetation cover, based on the moving window method, for further interpretation of potential effects of vegetation cover change on ET.
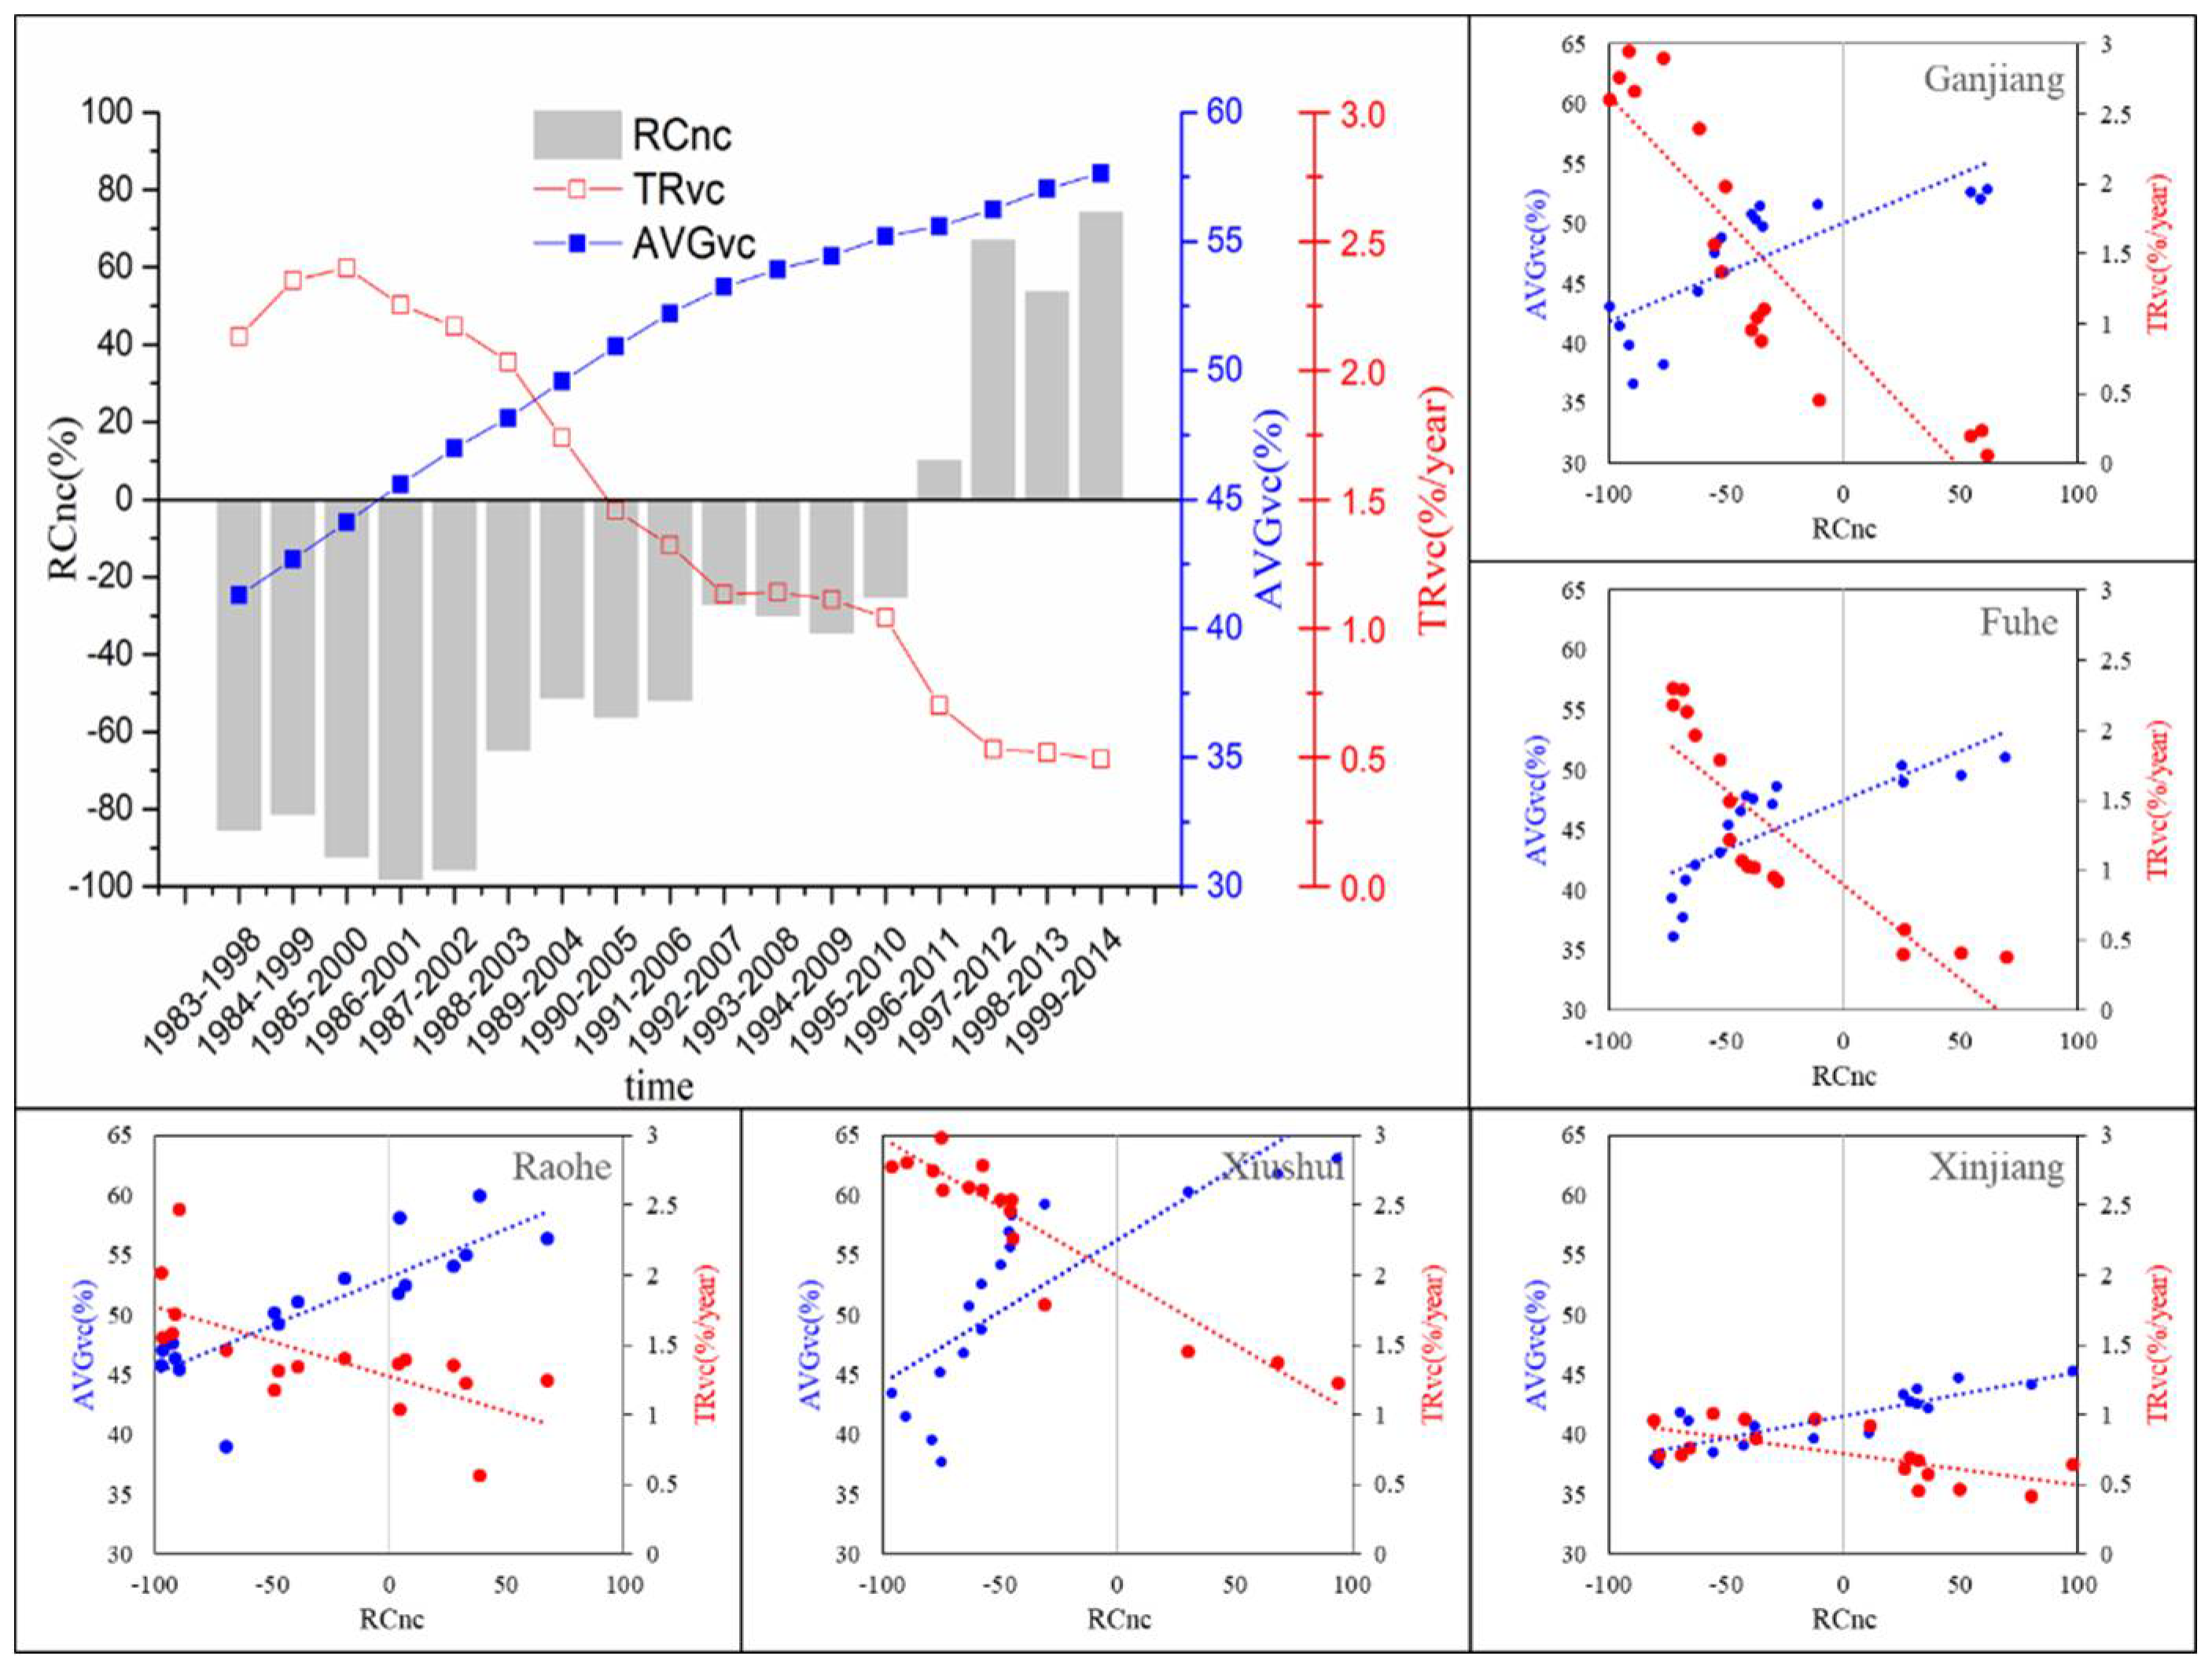
Figure 7 illustrates that the relative nonclimatic contribution to ET shifted from a negative phase (−85%) to a positive phase (74%) over time for the entire basin. Specifically, at the early stage of vegetation restoration, the contribution was negative. In the moving window of 1983–1998, the relative nonclimatic contribution was about −85%, while vegetation cover was the lowest (about 41%) in the period. In the subsequent moving windows, the relative nonclimatic contribution approached to the negative maximum in 1986–2001, during the region which experienced fast vegetation restoration. The change rate of vegetation cover was as fast as 0.23%/year in this period. With the development of revegetation, vegetation cover kept the increasing trend but slowed down gradually, and the change rate of vegetation cover reduced gradually in the consecutive windows. Meanwhile, the absolute nonclimatic contribution to ET dropped. Remarkably, the relative nonclimatic contribution reversed from negative to positive in the period of 1996–2011, during which vegetation coverage recovered to 55%. The positive contribution continued in the following periods, during which vegetation coverage slightly increased.
During the study period, vegetation cover increased from 41% to 57%, corresponding to its change rate from 2.1%/year to 0.5%/year. The vegetation cover change was closely related to the nonclimatic contribution with a correlation coefficient of 0.90 (p < 0.05) for their mean values and −0.93 (p < 0.05) for trend. This close correlation was also observed in each sub-basin (Figure 7). The correlation coefficient was 0.82 (−0.81) for mean (trend) across the sub-basins, which was close to the correlation coefficient calculated from all valid pixels. The correlation coefficient was the highest for mean in Xinjiang Basin (r = 0.85) and the lowest in Xiushui Basin (r = 0.79). The vegetation cover is the highest in Xiushui Basin and the lowest in Xinjiang Basin. The lower vegetation cover was, the more significant the vegetation cover influence to ET was, and vice versa. For trend, the correlation coefficient was the strongest in Xiushui Basin (r = −0.93) and the weakest in Xinjiang Basin (r = −0.67). For the sub-basin with the most increase in vegetation coverage, the trend showed a closer relationship with the effect of vegetation coverage to ET, and vice versa.
4. Discussion
4.1. Evapotranspiration in Response to Revegetation
Hydrological responses to vegetation degeneration or restoration have been widely examined. For effective basin-scale water management, not only the overall responses but also respective responses during different stages of vegetation restoration need to be investigated. This study clearly demonstrates that vegetation cover and its change rate are the main nonclimatic factors collectively affecting ET at different scales. At the early stage of vegetation restoration, when vegetation cover was relatively low, ET was from both vegetation transpiration and soil evaporation. Under this circumstance, change of vegetation cover strongly affected the composition and magnitude of transpiration, evaporation, and consequently the total ecosystem ET [40]. At the stage of fast revegetation, energy and water allocations were obviously altered in landscapes composed of vegetated and bare surfaces. Previous studies have suggested that ET was constrained by energy in the Poyang Lake Basin [24]. Two potential causes account for the ET decline with increasing vegetation cover. Firstly, solar radiation may decrease on the soil surface due to the expansion of vegetation leaf area, leading to a decrease in soil evaporation [6]. Secondly, increased interception with afforestation likely results in an increase in baseflow and runoff rather than ET, because the transpiration of new plants is lower than that of mature plants despite having the same leaf area index (LAI) [41]. A contrasting result was observed in North China where ET was constrained by water supply [40]. At the late stage of vegetation restoration, when vegetation cover was high, both vegetation and climatic factors produced relatively low effects on ET, suggesting that the forest ecosystem established a relatively stable state for ET. With a closed vegetation canopy, a slow increase of vegetation cover may have enhanced canopy transpiration but reduced contribution to surface evaporation. This is consistent with the study [41] that transpiration accounted for a high ratio of ET that marginally increased with LAI. Given the factors mentioned above, vegetation cover change on the basin-scale ET was attributed not only to coverage but also to altered local composition of vegetation and soil. Hence, the vegetation cover change exhibited a contrary effect to ET, which turned from negative to positive during the period 1996–2011 when the vegetation coverage increased to about 55%.
It should be noted that annual ET was generally lower after vegetation restoration than before, when vegetation coverage was quite low over the Poyang Lake Basin. It implies that anthropogenic revegetation may have produced a systematic shift between water cycle components [7,9,15,40]. The ET decrease accompanied with an increase of runoff, confirmed from observation data that annual runoff coefficient between runoff and precipitation increased from 0.38 in 2004 to 0.52 in 2014. The main reason may be that more precipitation was converted to runoff due to higher soil moisture, stemming from relatively constant transportation and relatively low soil evaporation for high vegetation cover. A high vegetation cover could also enhance the runoff yield due to precipitation interception of a large leaf area of canopy. A recent study has reported that increased vegetation greenness resulted in reduced water yield, which may elevate or aggravate water conflicts in droughts [19]. Our results demonstrate that vegetation restoration overall favors annual runoff yield, and its water retention plays a positive role in supplying water resources for the Poyang Lake Basin and downstream areas of the Yangtze River as well.
4.2. Uncertainties and Further Studies
There are limitations in the present report. First of all, in spite of evaluation with observation data, the remotely sensed ET contains uncertainties from satellite data quality, the retrieval algorithm, and parameter optimization [42]. The static land cover data were adopted in AVHRR and MODIS ET products used in this study [31,43]. In the algorithm logic of the products, land cover data were used to aid in identifying biome-specific physiological parameters, especially the optimized canopy conductance (g0). Hence, the static land cover classifications may lead to some uncertainties in calculating pixel-based ET.
Based on the MODIS illustrates that land cover data in 2001, four plant types mainly occurred in the Poyang Lake basin, including evergreen broadleaf forest (EBF), mixed forest (MF), woody savanna (WSV), and cropland (CRP) which accounted for 1.64%, 40.61%, 34.43%, and 21.31% of the total study area, respectively. In light of the study of Zhang et al. [30], the g0 varied with not only the plant type but also with the plant physiology, which could be represented by NDVI. In view of this point, the ranges of the variability in NDVI and corresponding g0 were investigated for each plant type in our study, as shown in Figures S1 and S2. The results showed that the average g0 was 0.0091 ± 0.0025 m S−1, 0.0069 ± 0.0034 m S−1, 0.0033 ± 0.0031 m S−1, and 0.0033 ± 0.0021 m S−1 for EBF, MF, WSV and CRP, respectively. The variance analysis (ANOVA) showed that there was no significant (p < 0.05) difference in the g0 amplitudes between EBF and MF, WSV and CRP, as well as MF and WSV, and MF and CRP, respectively. It indicates that the conversions between these pairs of plant types would not significantly alert the g0 and consequently the calculation of ET. However, the g0 for EBF exhibited a significant difference from that of WSV and CRP. To reduce this uncertainty, the distribution and conversion of the land cover types were further investigated based on the MODIS land cover data and another land cover data provided by Liu et al. [44]. The MODIS land cover data suggested that EBF was mainly located in the mountain area in the southern portion of the Poyang Lake basin (below 25° N). In spite of the difference in the classification systems between MODIS and Liu’s land cover products, the latter showed that the forest land with high canopy density (>30%) in the southern mountain area rarely was converted to other land cover types (especially cropland) between 1980 and 2015. The conversion area only accounted for 0.37% of the total basin. It implies that the EBF conversion marginally impacted the variation in ET over the sub-basin or the entire basin. Hence, although the static land cover data were used, both the AVHRR and MODIS ET data had reason to be used in our present work. So far, there is a lack of continuous long-term historical land cover data which could be reliably used to derive ET. This limitation should be taken seriously in future studies.
In addition to vegetation cover change, local water resources management such as anthropogenic water storage, and diversion could also play an important role in regulating basin-scale ET [45]. It may also lead to uncertainties in interpreting our present results. Moreover, to facilitate the distinction of climatic and nonclimatic contributions to basin-scale ET, only four climatic variables were selected in first-difference model. Although the variables are commonly recognized as dominant regulators of ecosystem-scale ET, neglecting other variables may lead to a poor performance of the model, and consequently an underestimate/overestimate of climatic and nonclimatic contributions. Besides climatic variables, it has been reported that enhanced CO2 concentration and atmospheric nitrogen deposition could also affect ET through altering plant activities and water-use efficiency [29,46]. Although there is still a debate on trade-off fertilization effects of enhanced CO2 and nitrogen deposition on water cycles [47], it would be helpful to more accurately capture interannual variation of climatic and nonclimatic contributions to ET.
5. Conclusions
ET is a key component of both terrestrial water cycle and surface energy balance. It is impacted by both climatic and nonclimatic factors such as anthropogenic vegetation cover change. This study presented how the vegetation cover change could affect annual ET during different stages of revegetation across the Poyang Lake Basin, a typical sub-tropical humid basin that experienced a fast anthropogenic revegetation during the last decades. Our findings demonstrate that the nonclimatic contribution, in terms of magnitudes and directions, differed at the early, the middle, and the late stages of the restoration. At the early stage of low vegetation, vegetation cover change produced negative effects on ET overall. With the development of vegetation restoration, the fast increase of vegetation cover shifted the effects from negative to positive. At the late stage, when vegetation cover was high, it remained in the positive relationship with ET. This contrary response of ET to vegetation dynamic in the humid basin was quite different from that in the semi-arid/arid basin. Overall, we argue that both amount and change rate of vegetation coverage should be taken into account for a comprehensive understanding and evaluation of hydrological responses to anthropogenic vegetation change. This study provides a new insight into hydrological response to vegetation cover change during a long-term vegetation restoration process.
Supplementary Materials
The following are available online at https://www.mdpi.com/1999-4907/9/4/217/s1, Figure S1: Average potential surface conductance values (g0) derived from tower measurements versus corresponding NDVI values from the AVHRR GIMMS dataset for evergreen broadleaf forest (EBF), mixed forest (MF), Woody savanna (WSV), and cropland (CRP) vegetation types, Figure S2: Range of potential surface conductance values (g0) for evergreen broadleaf forest (EBF), mixed forest (MF), Woody savanna (WSV), and cropland (CRP) vegetation types in Poyang Lake Basin.
Acknowledgments
This work was supported by the State Key Program of National Natural Science Foundation of China (41430855) and Jiangsu Planned Projects for Postdoctoral Research Funds (1188000003).
Author Contributions
Yuanbo Liu and Ying Wang conceived and designed the experiments; Ying Wang and Jiaxin Jin performed the experiments and analyzed the data; Ying Wang wrote the paper.
Conflicts of Interest
The authors declare no conflict of interest.
References
- Wang, K.; Dickinson, R.E. A review of global terrestrial evapotranspiration: Observation, modeling, climatology, and climatic variability. Rev. Geophys. 2012, 50. [Google Scholar] [CrossRef]
- Zhang, K.; Kimball, J.S.; Nemani, R.R.; Running, S.W.; Yang, H.; Gourley, J.J.; Yu, Z. Vegetation greening and climate change promote multidecadal rises of global land evapotranspiration. Sci. Rep. 2015, 5, 75–77. [Google Scholar] [CrossRef] [PubMed]
- Wei, X.; Li, Q.; Zhang, M.; Giles-Hansen, K.; Liu, W.; Fan, H.; Wang, Y.; Zhou, G.; Piao, S.; Liu, S. Vegetation cover—Another dominant factor in determining global water resources in forested regions. Glob. Chang. Biol. 2017, 24, 786–795. [Google Scholar] [CrossRef] [PubMed]
- Zha, T.; Alang, B.; Garth, V.D.K.; Tandy, B.; Jharry, M.C.; Lawrenceb, F. Interannual variation of evapotranspiration from forest and grassland ecosystems in western canada in relation to drought. Agric. Forest Meteorol. 2010, 150, 1476–1484. [Google Scholar] [CrossRef]
- Forzieri, G.; Alkama, R.; Miralles, D.G.; Cescatti, A. Satellites reveal contrasting responses of regional climate to the widespread greening of earth. Science 2017, 356, 1180–1184. [Google Scholar] [CrossRef] [PubMed]
- Beer, C.; Ciais, P.; Reichstein, M.; Baldocchi, D.; Law, B.E.; Papale, D.; Soussana, J.F.; Ammann, C.; Buchmann, N.; Frank, D. Temporal and among-site variability of inherent water use efficiency at the ecosystem level. Glob. Biogeochem. Cycles 2009, 23, GB2018. [Google Scholar] [CrossRef]
- Sun, G.; Zhou, G.; Zhang, Z.; Wei, X.; Mcnulty, S.G.; Vose, J.M. Potential water yield reduction due to forestation across China. J. Hydrol. 2006, 328, 548–558. [Google Scholar] [CrossRef]
- Cao, S. Why large-scale afforestation efforts in China have failed to solve the desertification problem. Environ. Sci. Technol. 2008, 42, 1826–1831. [Google Scholar] [CrossRef] [PubMed]
- Ellison, D.; Futter, M.N.; Bishop, K. On the forest cover–Water yield debate: From demand- to supply-side thinking. 2012, 18, 806–820. [Google Scholar] [CrossRef]
- Ma, H.; Lv, Y.; Li, H. Complexity of ecological restoration in China. Ecol. Eng. 2013, 52, 75–78. [Google Scholar] [CrossRef]
- Fang, X.; Ren, L.; Li, Q.; Zhu, Q.; Shi, P.; Zhu, Y. Hydrologic response to land use and land cover changes within the context of catchment-scale spatial information. J. Hydrol. Eng. 2013, 18, 1539–1548. [Google Scholar] [CrossRef]
- Zhang, L.; Dawes, W.R.; Walker, G.R. Response of mean annual evapotranspiration to vegetation changes at catchment scale. Water Resour. Res. 2001, 37, 701–708. [Google Scholar] [CrossRef]
- Huang, M.; Zhang, L.; Gallichand, J. Runoff responses to afforestation in a watershed of the Loess Plateau, China. Hydrol. Proc. 2003, 17, 2599–2609. [Google Scholar] [CrossRef]
- Andréassian, V. Waters and forests: From historical controversy to scientific debate. J. Hydrol. 2004, 291, 1–27. [Google Scholar] [CrossRef]
- Brown, A.E.; Zhang, L.; Mcmahon, T.A.; Western, A.W.; Vertessy, R.A. A review of paired catchment studies for determining changes in water yield resulting from alterations in vegetation. J. Hydrol. 2005, 310, 28–61. [Google Scholar] [CrossRef]
- Jackson, R.B.; Murray, B.C. Trading water for carbon with biological carbon sequestration. Science 2005, 310, 1944–1947. [Google Scholar] [CrossRef] [PubMed]
- Bao, Z.; Zhang, J.; Wang, G.; Fu, G.; He, R.; Yan, X.; Jin, J.; Liu, Y.; Zhang, A. Attribution for decreasing streamflow of the haihe river basin, northern China: Climate variability or human activities? J. Hydrol. 2012, 460–461, 117–129. [Google Scholar] [CrossRef]
- Liu, W.; Wei, X.; Liu, S.; Liu, Y.; Fan, H.; Zhang, M.; Yin, J.; Zhan, M. How do climate and forest changes affect long-term streamflow dynamics? A case study in the upper reach of poyang river basin. Ecohydrology 2015, 8, 46–57. [Google Scholar] [CrossRef]
- Tang, L.-L.; Cai, X.-B.; Gong, W.-S.; Lu, J.-Z.; Chen, X.-L.; Lei, Q.; Yu, G.-L. Increased vegetation greenness aggravates water conflicts during lasting and intensifying drought in the poyang lake watershed, China. Forests 2018, 9, 24. [Google Scholar] [CrossRef]
- Mcvicar, T.R.; Li, L.T.; Niel, T.G.V.; Zhang, L.; Li, R.; Yang, Q.K.; Zhang, X.P.; Mu, X.M.; Wen, Z.M.; Liu, W.Z. Developing a decision support tool for China’s re-vegetation program: Simulating regional impacts of afforestation on average annual streamflow in the loess plateau. Forest Ecol. Manag. 2007, 251, 65–81. [Google Scholar] [CrossRef]
- Liu, Y.; Wu, G.; Zhao, X. Recent declines in China’s largest freshwater lake: Trend or regime shift? Environ. Res. Lett. 2013, 8, 14010–14019. [Google Scholar] [CrossRef]
- Lin, Y.; Liao, Z. Historical changes of jiangxi forest. J. Nanchang Univ. (Sciences Edition) 1982, 68–74. [Google Scholar]
- Hu, X. On the evolution of the environment of poyang lake basin in recent a century. J. Jiangxi Normal Univ. (Nat. Sci.) 2001, 25, 175–179. [Google Scholar]
- Liu, Y. Climatic and Hydrological Processes and Effects of Water Environment of Poyang Lake Basin; Science Press: Beijing, China, 2012. [Google Scholar]
- Buermann, W.; Parida, B.; Jung, M.; Macdonald, G.M.; Tucker, C.J.; Reichstein, M. Recent shift in eurasian boreal forest greening response may be associated with warmer and drier summers. Geophys. Res. Lett. 2014, 41, 1995–2002. [Google Scholar] [CrossRef]
- Pinzon, J.E.; Tucker, C.J. A non-stationary 1981–2012 AVHRR NDVI3g time series. Remote Sens. 2014, 6, 6929–6960. [Google Scholar] [CrossRef]
- Garonna, I.; De, J.R.; de Wit, A.J.; Mücher, C.A.; Schmid, B.; Schaepman, M.E. Strong contribution of autumn phenology to changes in satellite-derived growing season length estimates across europe (1982–2011). Glob. Chang. Biol. 2014, 20, 3457–3470. [Google Scholar] [CrossRef] [PubMed]
- Holben, B.; Dan, K.; Fraser, R.S. Directional reflectance response in avhrr red and near-ir bands for three cover types and varying atmospheric conditions. Remote Sens. Environ. 1986, 19, 213–236. [Google Scholar] [CrossRef]
- Norby, R.J.; Warren, J.M.; Iversen, C.M.; Medlyn, B.E.; Mcmurtrie, R.E. Co2 enhancement of forest productivity constrained by limited nitrogen availability. Proc. Natl. Acad. Sci. USA 2010, 107, 19368–19373. [Google Scholar] [CrossRef] [PubMed]
- Zhang, K.; Kimball, J.S.; Mu, Q.; Jones, L.A.; Goetz, S.J.; Running, S.W. Satellite based analysis of northern ET trends and associated changes in the regional water balance from 1983 to 2005. J. Hydrol. 2009, 379, 92–110. [Google Scholar] [CrossRef]
- Mu, Q.; Zhao, M.; Running, S.W. Improvements to a modis global terrestrial evapotranspiration algorithm. Remote Sens. Environ. 2011, 115, 1781–1800. [Google Scholar] [CrossRef]
- Chen, X.; Xingguo, M.O.; Liu, S. Contributions of climate change and human activities to et and gpp trends over north China plain from 2000 to 2014. Acta Geogr. Sin. 2017, 27, 661–680. [Google Scholar] [CrossRef]
- Liu, Y.; Wu, G. Hydroclimatological influences on recently increased droughts in China’s largest freshwater lake. Hydrol. Earth Syst. Sci. 2016, 20, 93–107. [Google Scholar] [CrossRef]
- DiMiceli, C.M.; Carroll, M.L.; Sohlberg, R.A.; Huang, C.; Hansen, M.C.; Townshend, J.R.G. Annual Global Automated Modis Vegetation Continuous Fields (MOD44B). University of Maryland: College Park, MA, USA, 2011. Available online: http://www.landcover.org/data/vcf/ (accessed on 1 September 2016).
- Nicholls, N. Increased australian wheat yield due to recent climate trends. Nature 1997, 387, 484–485. [Google Scholar] [CrossRef]
- Lobell, D.B.; Field, C.B. Global scale climate–crop yield relationships and the impacts of recent warming. Environ. Res. Lett. 2007, 2, 014002. [Google Scholar] [CrossRef]
- Tao, F.; Yokozawa, M.; Liu, J.Y.; Zhang, Z. Climate-crop yield relationships at provincial scales in China and the impacts of recent climate trends. Clim. Res. 2008, 38, 83–94. [Google Scholar] [CrossRef]
- Verón, S.R.; Abelleyra, D.D.; Lobell, D.B. Impacts of precipitation and temperature on crop yields in the pampas. Clim. Chang. 2015, 130, 235–245. [Google Scholar] [CrossRef]
- Lobell, D.B.; Asner, G.P. Climate and Management Contributions to Recent Trends in U.S. Agricultural Yields. Science 2003, 299, 1032. [Google Scholar] [CrossRef] [PubMed]
- Liu, Y.; Xiao, J.; Ju, W.; Xu, K.; Zhou, Y.; Zhao, Y. Recent trends in vegetation greenness in China significantly altered annual evapotranspiration and water yield. Environ. Res. Lett. 2016, 11, 094010. [Google Scholar] [CrossRef]
- Wang, L.; Good, S.P.; Caylor, K.K. Global synthesis of vegetation control on evapotranspiration partitioning. Geophys. Res. Lett. 2015, 41, 6753–6757. [Google Scholar] [CrossRef]
- Chen, Y.; Xia, J.; Liang, S.; Feng, J.; Fisher, J.B.; Li, X.; Li, X.; Liu, S.; Ma, Z.; Miyata, A. Comparison of satellite-based evapotranspiration models over terrestrial ecosystems in China. Remote Sens. Environ. 2014, 140, 279–293. [Google Scholar] [CrossRef]
- Zhang, K.; Kimball, J.S.; Nemani, R.R.; Running, S.W. A continuous satellite-derived global record of land surface evapotranspiration from 1983 to 2006. Water Resour. Res. 2010, 46, 109–118. [Google Scholar] [CrossRef]
- Liu, J.; Liu, M.; Zhuang, D.; Zhang, Z.; Deng, X. Study on spatial pattern of land-use change in China during 1995–2000. Sci. China Ser. D Earth Sci. 2003, 46, 373–384. [Google Scholar]
- Zhou, Y.; Li, X.; Yang, K.; Zhou, J. Assessing the impacts of an ecological water diversion project on water consumption through high-resolution estimations of evapotranspiration in the downstream regions of the Heihe River Basin, China. Agric. Forest Meteorol. 2018, 249, 210–217. [Google Scholar] [CrossRef]
- Keenan, T.F.; Hollinger, D.Y.; Bohrer, G.; Dragoni, D.; Munger, J.W.; Schmid, H.P.; Richardson, A.D. Increase in forest water-use efficiency as atmospheric carbon dioxide concentrations rise. Nature 2013, 499, 324–327. [Google Scholar] [CrossRef] [PubMed]
- Huang, M.; Piao, S.; Zeng, Z.; Peng, S.; Ciais, P.; Cheng, L.; Mao, J.; Poulter, B.; Shi, X.; Yao, Y. Seasonal responses of terrestrial ecosystem water-use efficiency to climate change. Glob. Chang. Biol. 2016, 22, 2165–2177. [Google Scholar] [CrossRef] [PubMed]
Figure 1.
The geophysical location of Poyang Lake Basin, China.

Figure 2.
Interannual variation of satellite-retrieved annual evapotranspiration (ET) and vegetation cover (VC) with survey-based vegetation cover for the entire Poyang Lake Basin for the period 1983–2014.
Figure 2.
Interannual variation of satellite-retrieved annual evapotranspiration (ET) and vegetation cover (VC) with survey-based vegetation cover for the entire Poyang Lake Basin for the period 1983–2014.
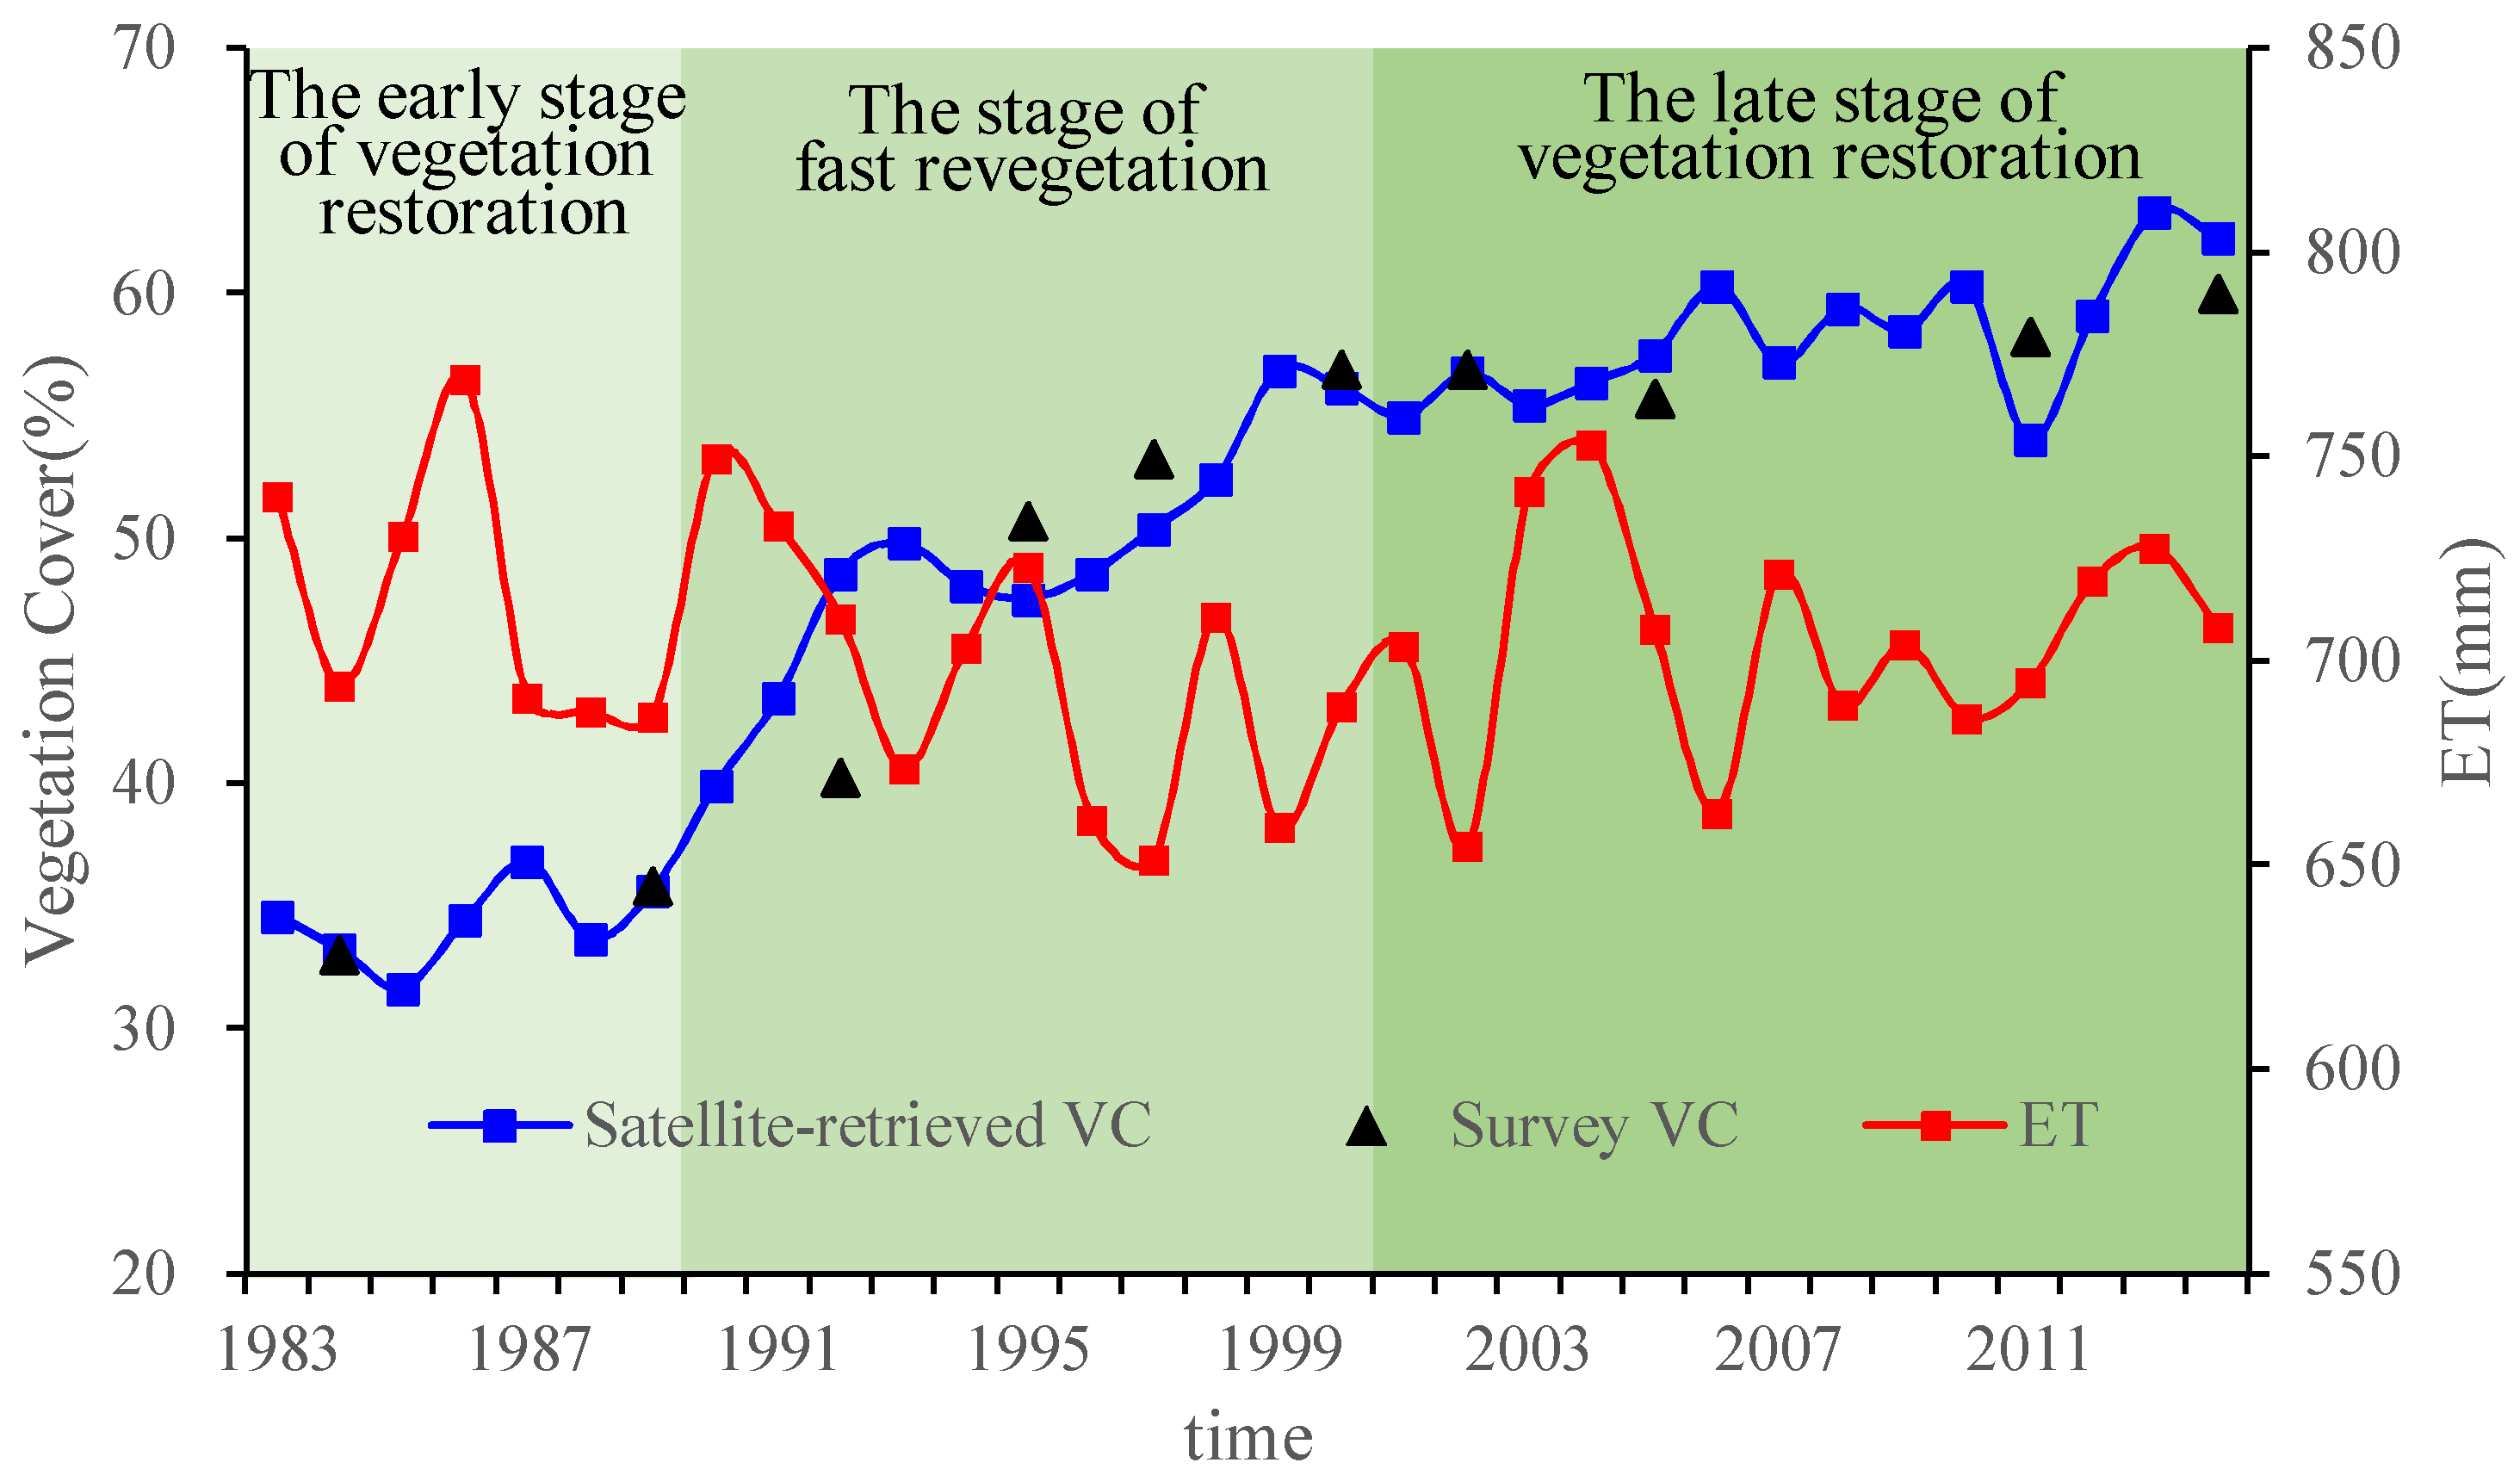
Figure 3.
Comparison of satellite-retrieved multi-year mean annual ET with that calculated from a water balance equation using observed pricitpation (P) and runoff (R) over five sub-basins and the entire basin.
Figure 3.
Comparison of satellite-retrieved multi-year mean annual ET with that calculated from a water balance equation using observed pricitpation (P) and runoff (R) over five sub-basins and the entire basin.

Figure 4.
The spatial distribution of the mean annual ET (a) and vegetation coverage (VC) (b) during 1983–2014 in the Poyang Lake Basin.
Figure 4.
The spatial distribution of the mean annual ET (a) and vegetation coverage (VC) (b) during 1983–2014 in the Poyang Lake Basin.

Figure 5.
Relative climatic and nonclimatic contributions (RCc and RCnc) to grid-wise ET change for three stages of vegetation restoration: 1983–1990 (a,b), 1990–2000 (c,d), and 2000–2014 (e,f).
Figure 5.
Relative climatic and nonclimatic contributions (RCc and RCnc) to grid-wise ET change for three stages of vegetation restoration: 1983–1990 (a,b), 1990–2000 (c,d), and 2000–2014 (e,f).
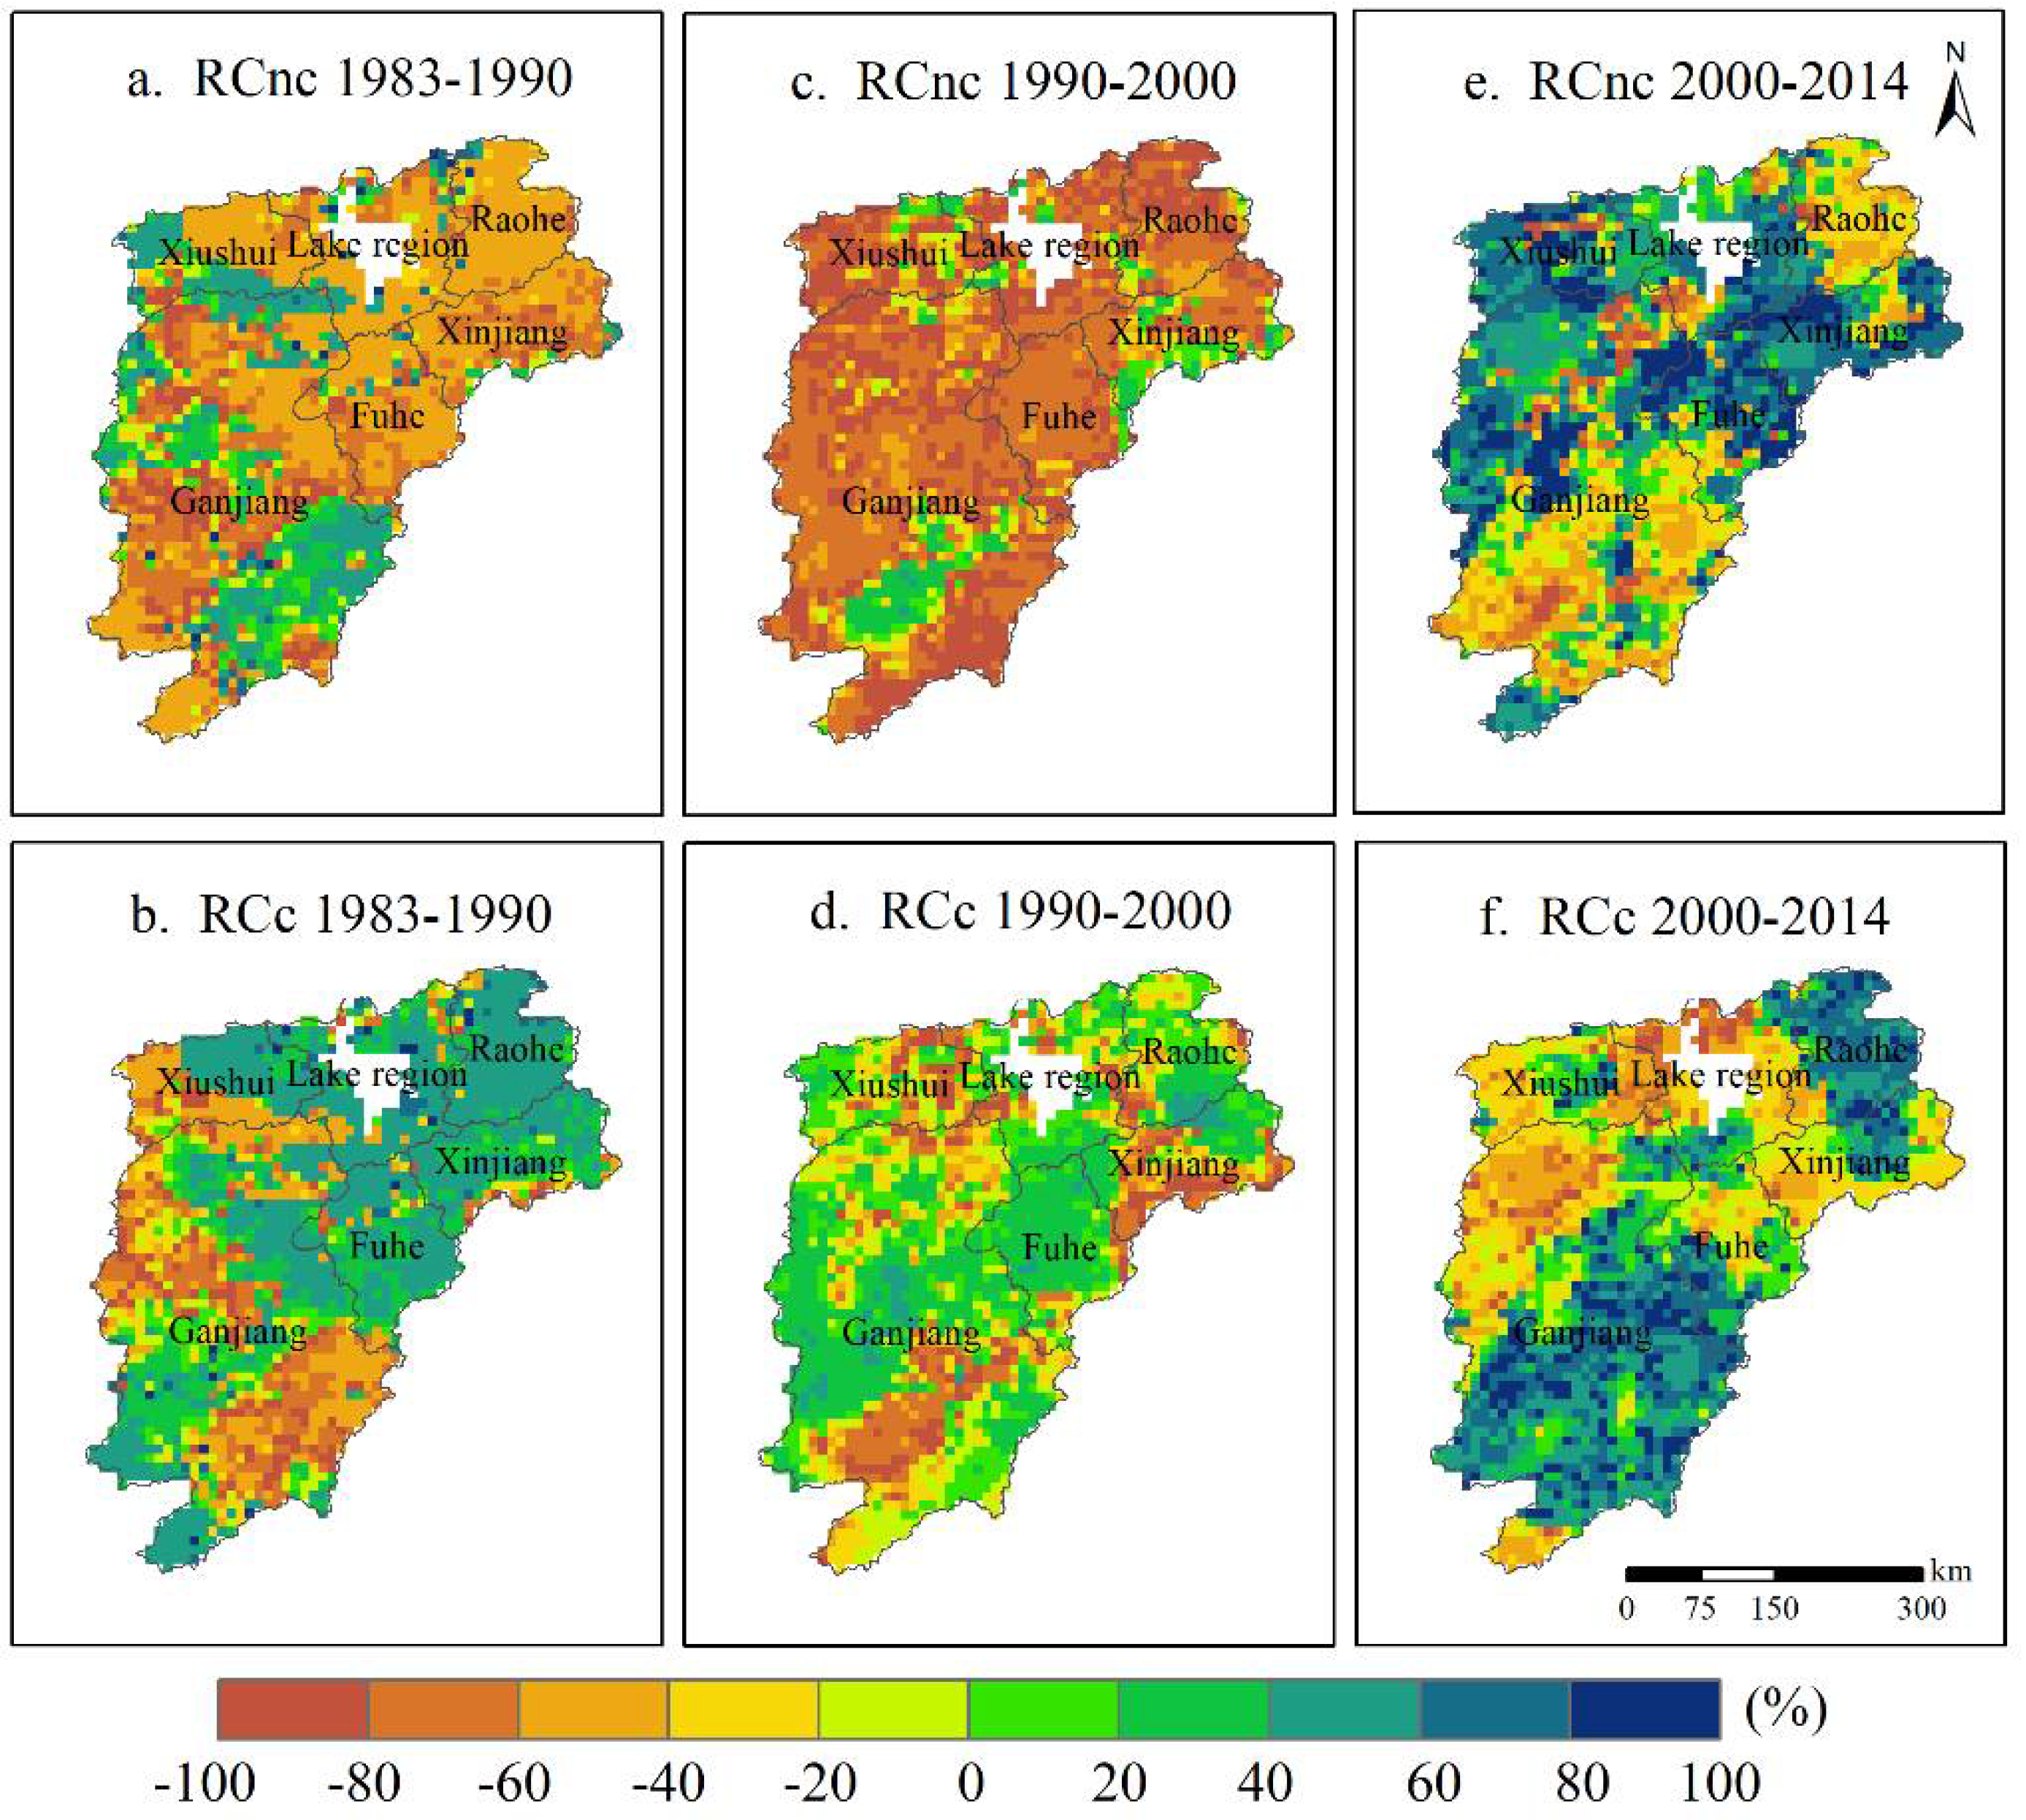
Figure 6.
Climatic and nonclimatic contributions to annual ET trends (Qc and Qnc) over the entire Poyang Lake Basin and its five sub-basins.
Figure 6.
Climatic and nonclimatic contributions to annual ET trends (Qc and Qnc) over the entire Poyang Lake Basin and its five sub-basins.

Figure 7.
Relationships between vegetation cover change (VC) and nonclimatic contribution to annual ET (RCnc) for mean (AVGvc) and trend (TRvc) values within moving windows over the Poyang Lake Basin and its five sub-basins.
Figure 7.
Relationships between vegetation cover change (VC) and nonclimatic contribution to annual ET (RCnc) for mean (AVGvc) and trend (TRvc) values within moving windows over the Poyang Lake Basin and its five sub-basins.

© 2018 by the authors. Licensee MDPI, Basel, Switzerland. This article is an open access article distributed under the terms and conditions of the Creative Commons Attribution (CC BY) license (http://creativecommons.org/licenses/by/4.0/).
Share and Cite
MDPI and ACS Style
Wang, Y.; Liu, Y.; Jin, J. Contrast Effects of Vegetation Cover Change on Evapotranspiration during a Revegetation Period in the Poyang Lake Basin, China. Forests 2018, 9, 217. https://doi.org/10.3390/f9040217
AMA Style
Wang Y, Liu Y, Jin J. Contrast Effects of Vegetation Cover Change on Evapotranspiration during a Revegetation Period in the Poyang Lake Basin, China. Forests. 2018; 9(4):217. https://doi.org/10.3390/f9040217
Chicago/Turabian StyleWang, Ying, Yuanbo Liu, and Jiaxin Jin. 2018. "Contrast Effects of Vegetation Cover Change on Evapotranspiration during a Revegetation Period in the Poyang Lake Basin, China" Forests 9, no. 4: 217. https://doi.org/10.3390/f9040217
Note that from the first issue of 2016, this journal uses article numbers instead of page numbers. See further details here.