Assessing Climate Change Impact on Forest Habitat Suitability and Diversity in the Korean Peninsula
by
 , ,
, ,
Chul-Hee Lim
1,2 ,
,
Somin Yoo
2, 
Yuyoung Choi
2,
Seong Woo Jeon
2 ,
,
Yowhan Son
2 and
Woo-Kyun Lee
2,* 1
Institute of Life Science and Natural Resources, Korea University, Seoul 02481, Korea
2
Department of Environmental Science and Ecological Engineering, Korea University, Seoul 02481, Korea
*
Author to whom correspondence should be addressed.
Forests 2018, 9(5), 259; https://doi.org/10.3390/f9050259
Submission received: 4 April 2018
/
Revised: 7 May 2018
/
Accepted: 8 May 2018
/
Published: 10 May 2018
(This article belongs to the Special Issue Climate Smart Forestry)
Abstract
:Habitat changes in temperate forests are more vulnerable to climate change than tropical or boreal forests. This study assessed forest habitat suitability and diversity to determine the impact of climate change on the Korean Peninsula. We used the MaxEnt (Maximum Entropy) species distribution model, three key climate indices, and two representative climate change scenarios, using short and long-term data. Two of the three key climate indices related to temperature were more capricious than the precipitation-related index in the future. In the baseline prediction, both statistical and qualitative validation using the actual vegetation map showed excellent results. Regarding forest habitat suitability, northward migration and substantial increase were definitely distinctive in warm temperate evergreen forest. On the other hand, subalpine forest areas decreased significantly due to climate change; the suitable area for Representative Concentration Pathways (RCP) 8.5 2070s decreased by more than half. With regard to forest habitat diversity, regions with high diversity declined due to climate change. In the RCP 8.5 scenario, areas where all three forest types are suitable no longer appeared; however, in the case of RCP 4.5 2050s, suitable areas for two forest types increased, which implies climate change is not only negative in terms of diversity. As this negative prediction of future change is discouraging, active mitigation and adaptation are required to prevent these changes. The sustainability of future ecosystems is still dependent on our efforts.
1. Introduction
In the Intergovernmental Panel on Climate Change (IPCC) Fifth Assessment Report (AR5), climate change impacts are expressed as unequivocal facts, and forests and ecosystems in temperate regions have been suggested to respond more sensitively [1]. The boundary between the tropics and the temperate zone is expected to migrate northward, and climate variability will increase in the temperate regions where seasonality is high [2,3,4]. In accordance with recent knowledge, ecosystem changes in temperate regions, particularly mid-latitude regions, are noteworthy. The habitat suitability of forest ecosystems is defined according to various environmental factors, such as climate, topography, distance from water-flow, and type of rocky outcrop [5,6]. Although some species are heavily dependent on specific factors such as groundwater or drought stress, the overall species distribution is most dependent on climate, especially on the macro scale [6,7]. In other words, the climate is a basic factor for forest ecosystems, above other environmental factors such as soil characteristics and land use [7,8]. Many recent studies have indicated that forest habitats are changing globally or locally in response to changing climate [6,7,9].
The habitat suitability of a forest can be understood as a concept similar to the potential species distribution of a forest, in that it analyzes the area favorable for plant growth [10,11,12]. Many studies using future climate data that predict changes in forest habitat suitability or species distribution due to climate change have been performed at national and regional levels [13,14,15]. The species distribution model (SDM) is the most commonly used tool to predict these changes. SDM finds suitable growth areas for the changing environment through the past occurrence data of species. The representative tools for the SDM are maximum entropy (MaxEnt), generalized linear model (GLM), generalized additive model (GAM), and random forest (RF) [11,16,17,18].
With the increased awareness of the importance of biodiversity, the diversity of forest ecosystems is also being continually discussed [19,20]. Specifically, many studies have shown that forest variety can be reduced in response to climate change, and the results of recent monitoring in past decades have supported this [21,22]. For instance, species turnover occurs when subtropical species shift to current temperate regions or temperate species shift to current boreal regions by climate change. In this process, species that fail to adapt or fail to migrate become extinct and biodiversity decreases [19,20,21]. However, quantitative studies on diversity changes in forest species or habitats are lacking, and very few studies have used spatial prediction. There has been a lack of consideration of the changes in diversity resulting from habitat changes.
The Korean Peninsula has a densely forested area with various species, ranging from subtropical evergreen forests to alpine forests [14,23], and is evidently experiencing the impacts of climate change on forest habitats. To be specific, recent studies have shown that pine trees, the major species, are expected to decline, and subalpine forests in the mountains have already declined [13,24]. However, existing studies have not much dealt with forest habitat suitability and diversity simultaneously. The purpose of this study is to assess the forest habitat suitability and diversity under climate change in the Korean Peninsula. To this end, we use the MaxEnt model, which is the most widely used SDM model, and predict future changes using two representative climate change scenarios, and short and long-term data. Ultimately, this study tries to suggest the necessity of active adaptation to climate change and importance of greenhouse gas reductions for forest habitats conservation.
2. Data and Methods
2.1. Study Area
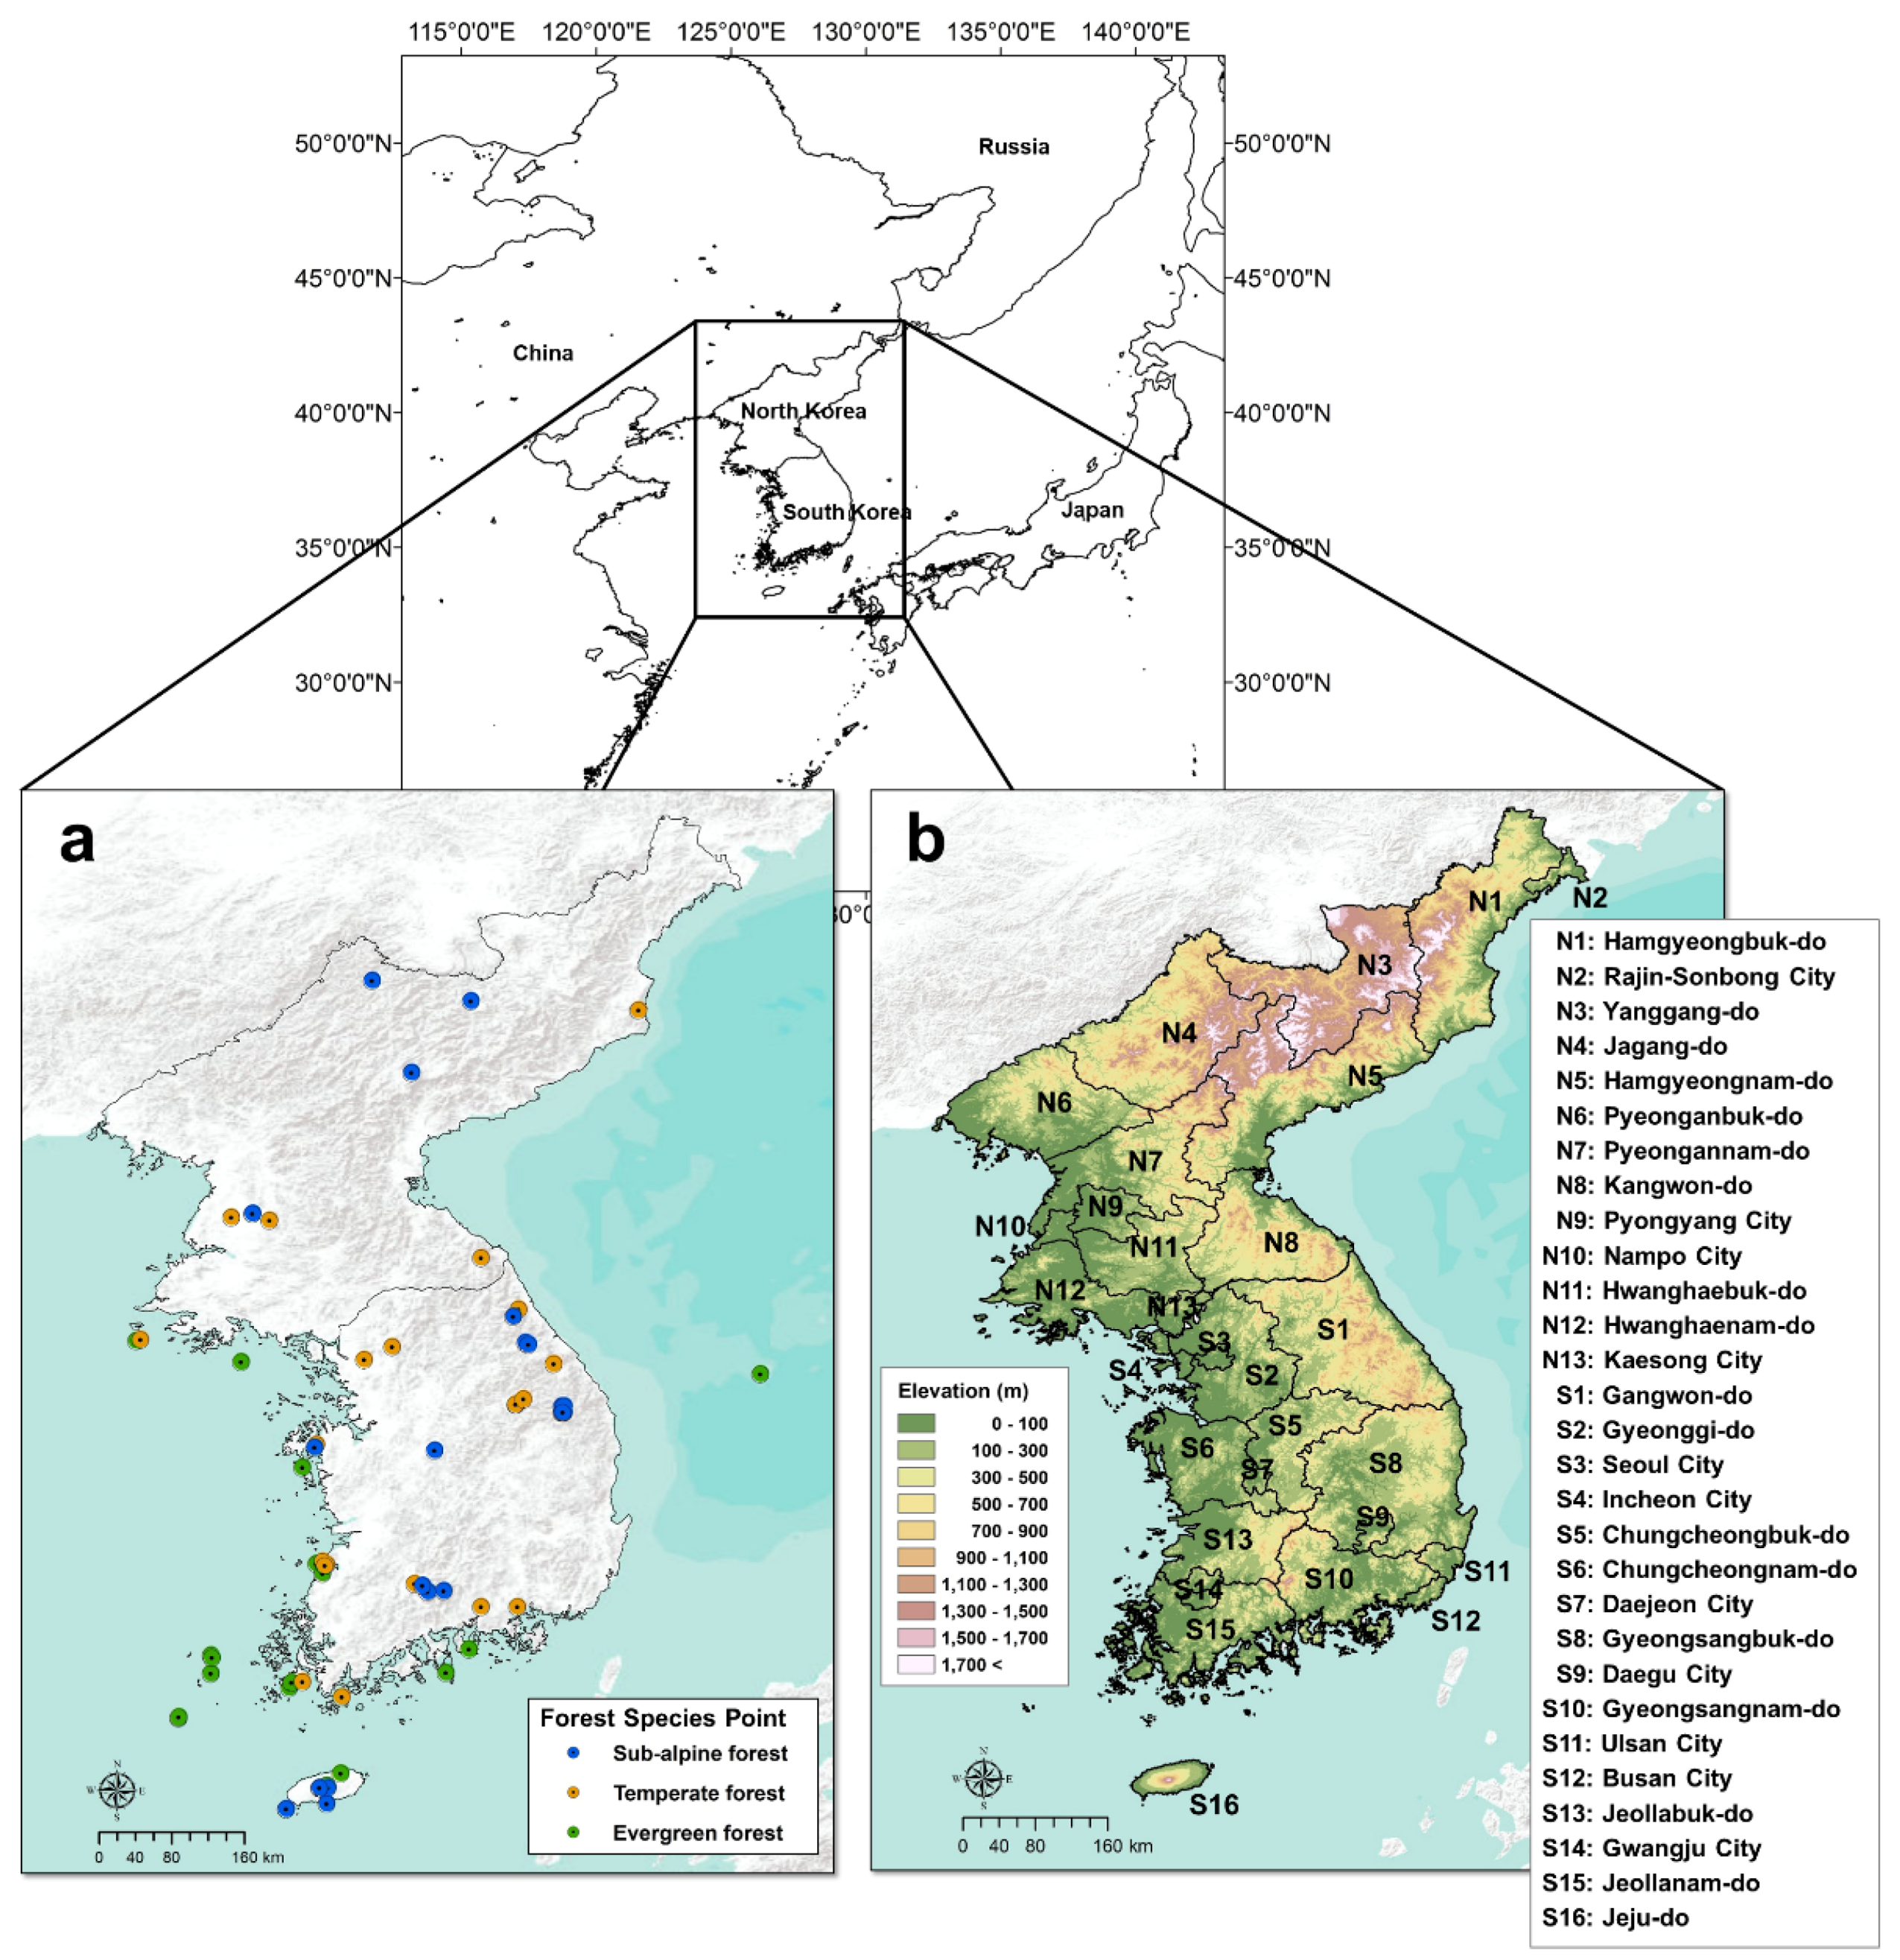
This study covers the entire Korean Peninsula, including South Korea and North Korea (Figure 1). The Korean Peninsula is approximately 1100 km in length from south to north and approximately 300 km in width from east to west; the total area is approximately 220,000 km2 [25]. The Korean Peninsula corresponds to the mid-latitude region (33–43° N) and is located in the east of the Asian continent; it belongs to the temperate monsoon climate, which is affected by seasonal winds [26]. It is characterized by climatic characteristics of hot, humid summers and cold, dry winters. Geographically, the high-altitude highland of the Gaema Plateau is located in the northeast, and the plains are situated around the west coast [27]. An altitude of the Gaema Plateua region is more than 1500 m with the mountains over 2000 m, and the mountain ranges located along the east coast to the southern part of South Korea (Figure 1). Halla Mountain, 1950 m high, is located in Jeju Island, the southernmost part of the Korean Peninsula.
The Korean Peninsula is generally temperate, and temperate forests are present, but subtropical evergreen forests are found on the southern coast, and subalpine forests are distributed in mountainous areas [24,28]. Although the urbanization rate is very high in South Korea, and many forest areas have been deforested and converted into cropland in North Korea, forests still have the highest land coverage in the Korean Peninsula [29]); in South Korea, more than 60% of land cover is forest, and approximately 58% of North Korea is forest [30]. In this forest habitat study, research was conducted across the whole area, without distinguishing land cover types.
2.2. Forest Habitat Suitability, Diversity, and Forest Species Data
Habitat suitability of each forest type is influenced by climate, soil condition, topography, land use, and socioeconomic conditions; of these, climatic condition is the most basic factor underlying suitability [11,23]. The concept of forest habitat suitability assessed in the present study is evaluated for each forest type as suitability in terms of climatic conditions in a spatial unit, and only considers climatic factors. Many previous studies have also found a forest habitat suitable area, or forest potential distribution, using only major climate variables [13,14,17,18,24].
Forest habitat diversity is assessed by overlapping areas of forest habitat suitability. The more overlapped areas of forest habitat suitability, the higher the habitat diversity. Many previous studies have shown that the diversity of forest ecosystems is higher in two or more types of overlapped vegetation [22,31]. According to the forest type, the lowest habitat diversity is where there are no suitable regions, and the higher habitat diversity is commonly found where there are two or more suitable regions.
For assessing the forest habitat suitability and diversity, we grouped the forest species on the Korean peninsula into three forest types. In this study, we trained the model to predict the distribution of these three forest types rather than individual species. As shown in Section 2.1, temperate forests are the most widely distributed forests in the Korean Peninsula, with warm temperate evergreen forests and subalpine forests being distributed locally. In the Korean peninsula, the terms alpine forest and subalpine forest are used interchangeably, but it is known that subalpine forest is more generally distributed. Thus, we grouped them into terms and categories of subalpine forests. In this study, forest suitability and diversity were assessed for three forest types, and representative species were selected for each forest type:
- Warm temperate evergreen forest: Camellia japonica L., Castanopsis sieboldii (Makino) Hatus, Quercus acuta Thunb., Machilus thunbergii Sieb. & Zucc., and Pinus thunbergii Parl.
- Temperate forest: Pinus densiflora Siebold & Zucc., Quercus dentate Thunb., Quercus variabilis Blume, Castanea crenata Siebold & Zucc., Robinia pseudoacacia L., Quercus mongolica Fisch. ex Ledeb., Zelkova serrate (Thunb.) Makino, Acer mono Maxim., Quercus acutissima Carruth., Carpinus laxiflora (Siebold & Zucc.) Blume, Quercus serrate Murray, and Carpinus tschonoskii Maxim.(Betulaceae)
- Subalpine forest: Abies koreana E.H.Wilson, Abies nephrolepis (Trautv. ex Maxim.) Maxim., and Taxus cuspidate Siebold & Zucc.
For the species distribution modeling, we required species occurrence data for each forest species. In the case of South Korea, much information can be obtained about forest species, but only very limited information is available for North Korea. In order to simulate a balanced distribution for the entire Korean peninsula, we excluded South Korea’s precise data, and all the data for each species were taken from the Global Biodiversity Information Facility (GBIF) database. GBIF collects biodiversity data from all over the world, and provides them as spatial information, including information on species distribution in North Korea. The distribution of each forest type was estimated using information on the distribution of about 20 species belonging to that forest type over 79 locations (Figure 1). As Figure 1 and Figure 5 show, the GBIF data we used are mostly consistent with the actual vegetation of South Korea.
2.3. Climate Data
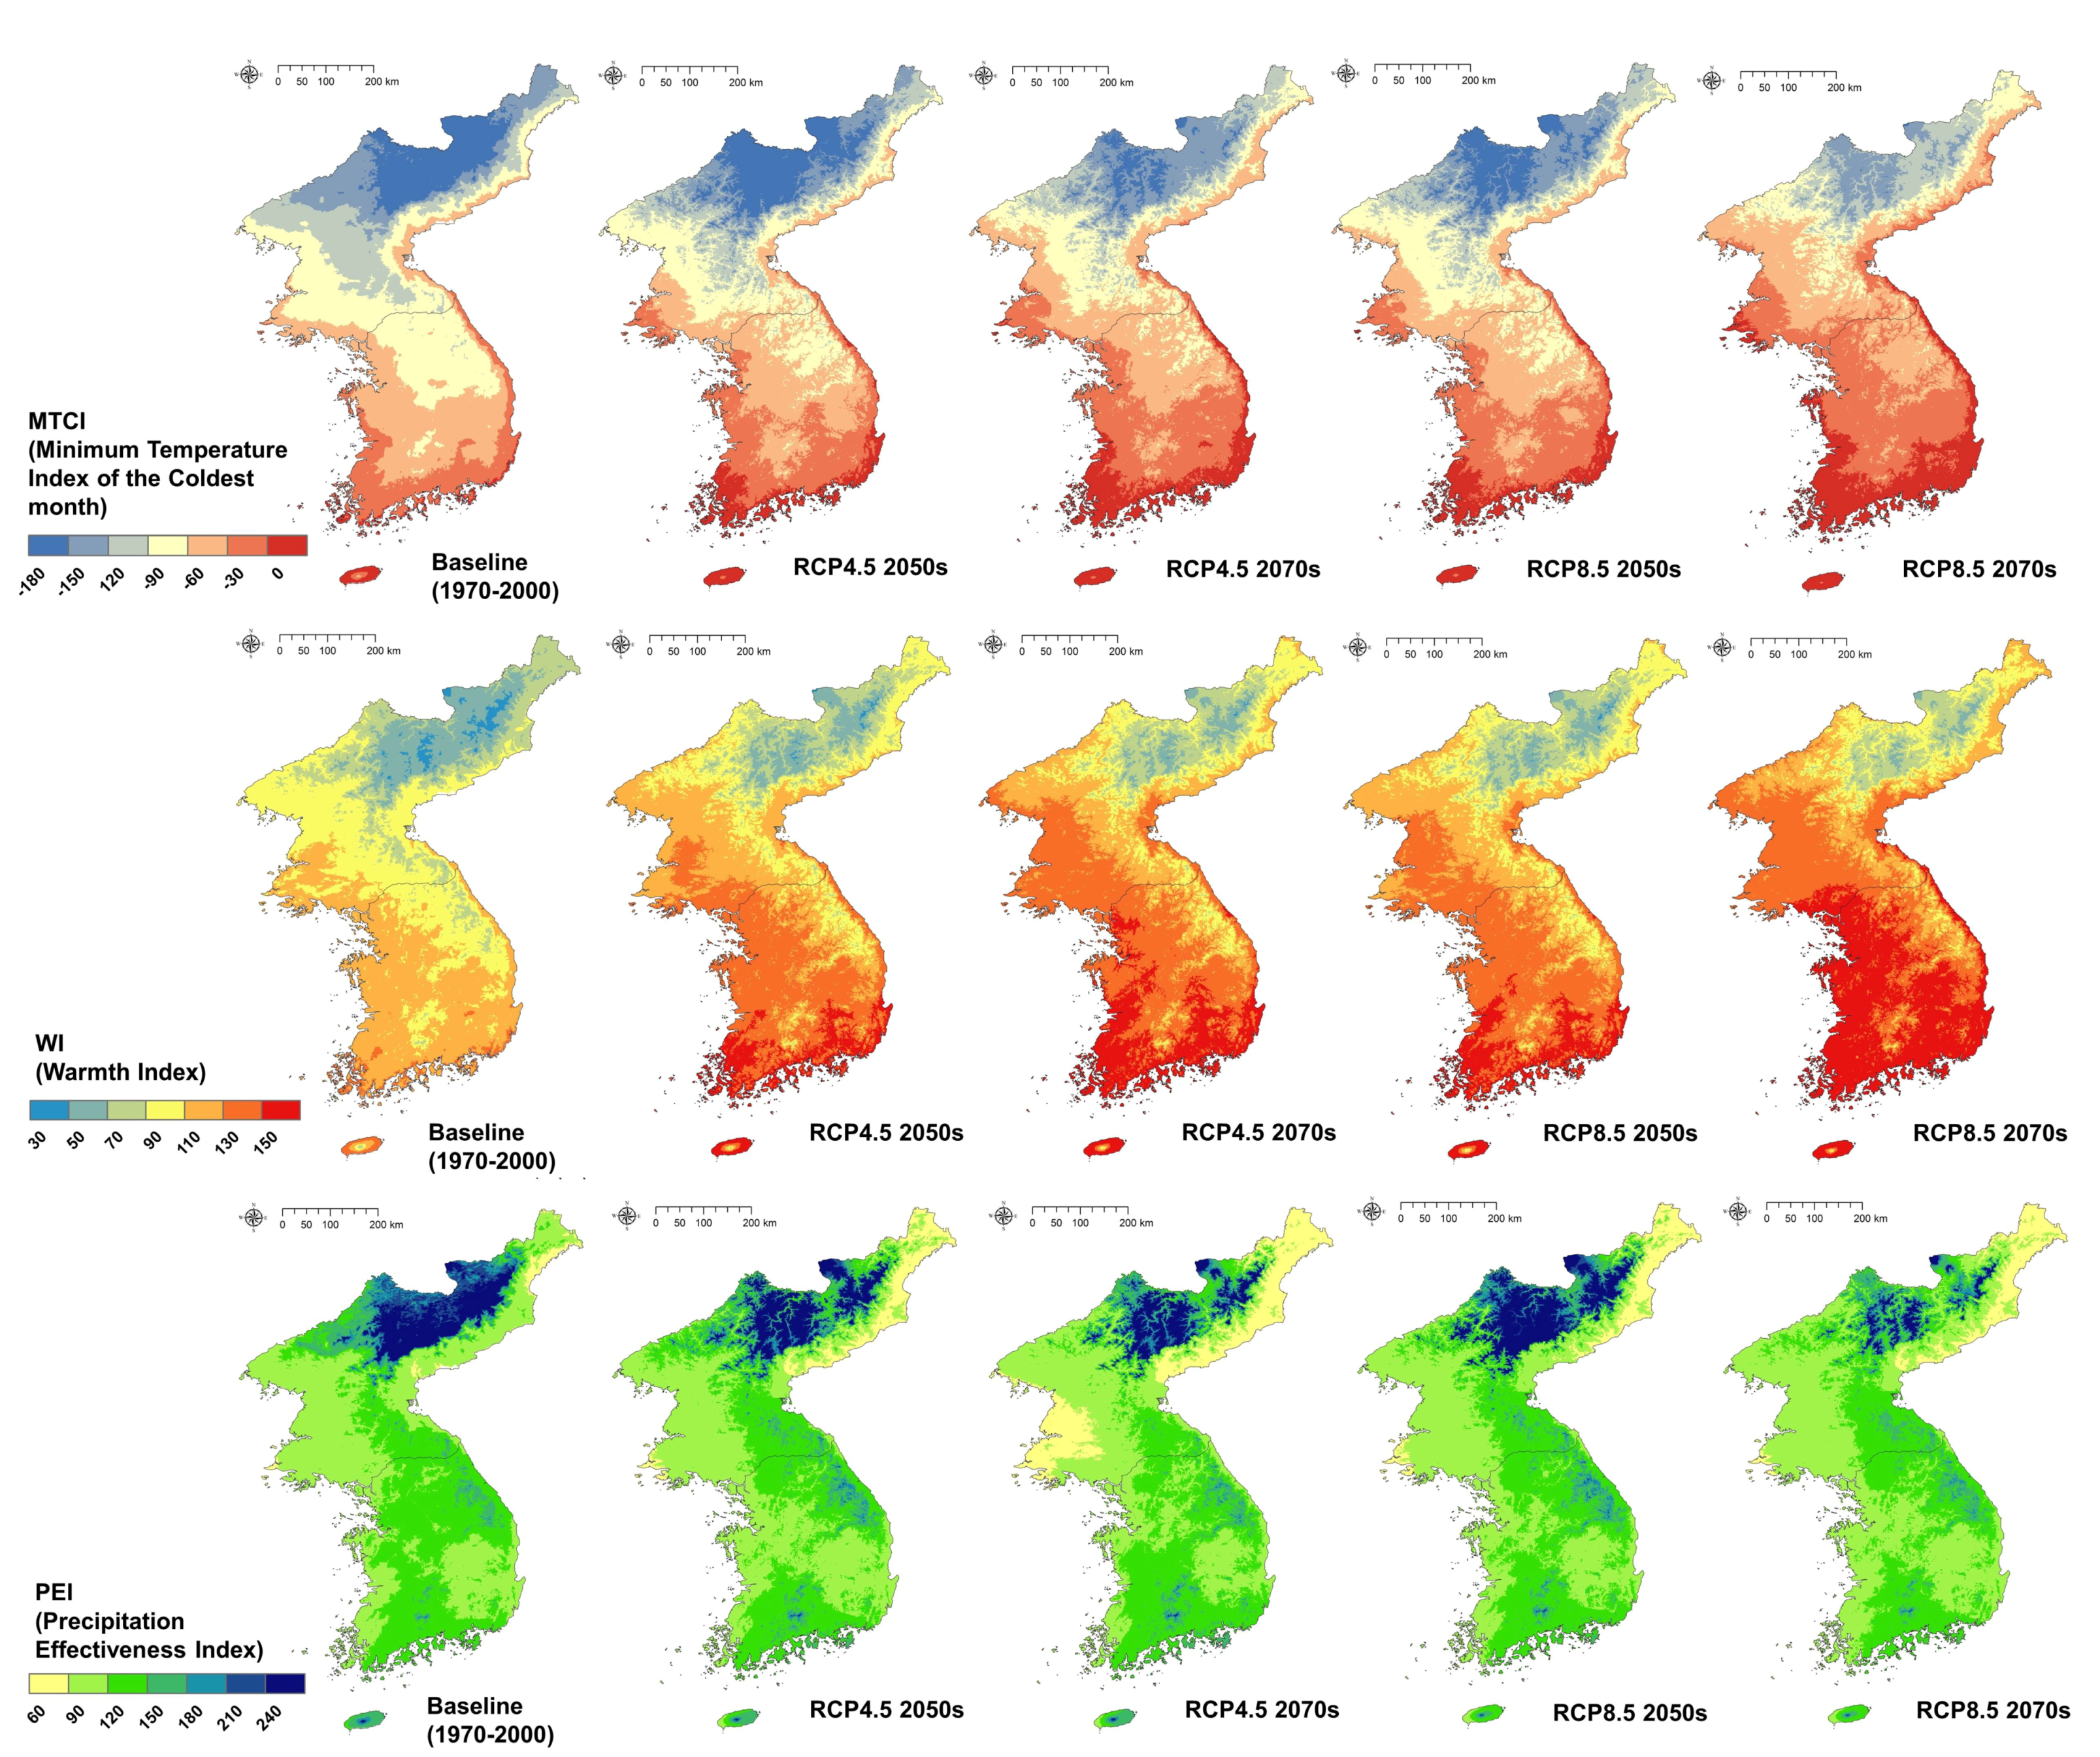
Climate data used in this study were obtained from the WorldClim database (http://www.worldclim.org/ Accessed on 5 April 2017). The WorldClim database collects global climate data for basic climatic factors, and provides downscaled data of up to a 30-arcsec resolution [32]. Future downscaled climate data for each Representative Concentration Pathways (RCP) scenario, and up to a 30-arcsec resolution per typical Global Climate Model (GCM) are also available. In the present study, we used the basic (maximum, minimum, and average temperature, and precipitation) climatic data of 1970–2000 (WorldClim version 2) for past weather data. For future climate data, we used the short-term future (2040–2060) and long-term future (2060–2080) basic climate data for the RCP 4.5 and 8.5 scenarios of HadGEM2-AO GCM. Based on climate data, 1970–2000 was defined as the baseline period, the short-term future as the 2050s, and the long-term future as the 2070s. All the data were processed and converted to a 1 km2 spatial resolution.
The climate variables used to determine habitat suitability and diversity for the three forest types were taken from the climate index suggested by Choi et al. [13]. They used the Minimum Temperature of the Coldest Month Index (MTCI), the Warmth Index (WI), and the Precipitation Effectiveness Index (PEI) to predict the potential species distribution for forested areas. Prediction of potential forest distribution in the Korean Peninsula using these three climate indices has already been verified through being applied to various studies since Choi et al. [13,14,23,24]. In this study, the MTCI was employed [33] following the logic of Neilson [34], converting the MTC (Minimum Temperature of the Coldest month) using Equation (1):
MTCI = ((MTC − tmid)/(thi − tmid)) × 100.
The MTCI is an important temperature-related index which is a significant factor used to explain the vegetative limit of tree species [34,35].
The WI is an important thermal index also associated with the effective heat of vegetation [35]; therefore, WI has been used to predict potential vegetation distribution and spatial movement [36]. The WI was calculated using Equation (2), which determines the annual sum of the positive differences between monthly mean temperature and 5 °C:
where t is the monthly mean temperature >5 °C.
WI = Σ(t − 5)
The PEI is an index devised by [37], which is based on the principle that both precipitation and evaporation are important for the growth of natural vegetation. As an index representing the long-term efficiency of precipitation, it is calculated as the sum of 12 monthly PE ratios (monthly precipitation/monthly evaporation):
where i is the number of the month (from 1 = January to 12 = December), Pi is the normal monthly precipitation in mm, and Ti is the normal monthly temperature in °C. All temperatures <−2 °C are given the value −2 °C, and PE ratios >40 are counted as 40 [38]. In this study, PEI was applied because it affects vegetation distribution indirectly by influencing the productivity of vegetation [13].
PE ratio (i) = 0.165 × (Pi/(Ti + 12.2))10/9,
2.4. MaxEnt Modeling and Classification
The MaxEnt model is a non-linear model used to make predictions or inferences from incomplete information based on statistical mechanics. It has been used to estimate the probability distribution of maximum entropy by evaluating the contrasts between observations and background variables [41]. The model is known to be highly accurate with a statistically significant value [42,43]. MaxEnt has a number of significant advantages, including the capacity to analyze complex response functions by combining various function types (e.g., linear, quadratic, product, threshold, and hinge; [44]).
The MaxEnt model has been used for various species distribution modeling studies including forest habitats, and in many cases, these have focused on the Korean peninsula [15,28,45]. In this study, MaxEnt model 3.3.3 version (Developed by Steven J. Phillips: Florham Park; NJ, USA) was used and data was processed with ArcGIS 10.3 version (ESRI Inc.: Redlands, CA, USA). We replicated the runs 15 times using the subsample method, and the random test percentage was set to 25. The averaged value of 15 outputs was used for the main result. For the maximum iterations, 5000 circuits were set, and the results were calculated and analyzed using a logistic output format. We trained the model of each forest type through MaxEnt with evenly distributed tree species occurrence data in the entire Korea Peninsula. Thus, the geographical extent of this study can be regarded as the whole area of the Korean Peninsula.
The Natural Break (Jenks) Classification method was used to classify the probability distribution of the forest type calculated using the MaxEnt model; it identifies break points by picking the class breaks that best group similar values and maximize the differences between classes [46]. The values are divided into classes whose boundaries are set, which are relatively large jumps in the data values [46,47]. The results of each species distribution model estimated with a probability value between 0 and 1 are classified into two classes by the Natural Break method: a high value region is designated as suitable and a low value region as non-suitable. In order to explain the change in forest habitat suitability of each forest type according to climate change, priority is given to areas where suitability overlaps, in the order of subalpine forest, warm temperate evergreen forest, and temperate forest. It gives priority to the forest type, which is distributed in a more restrictive region in the Korean peninsula, and overlapping areas are shown according to this priority. For analyzing the area where multiple forest habitat suitabilities overlap, we presented the forest habitat diversity result separately.
2.5. Evaluation of Model Performance
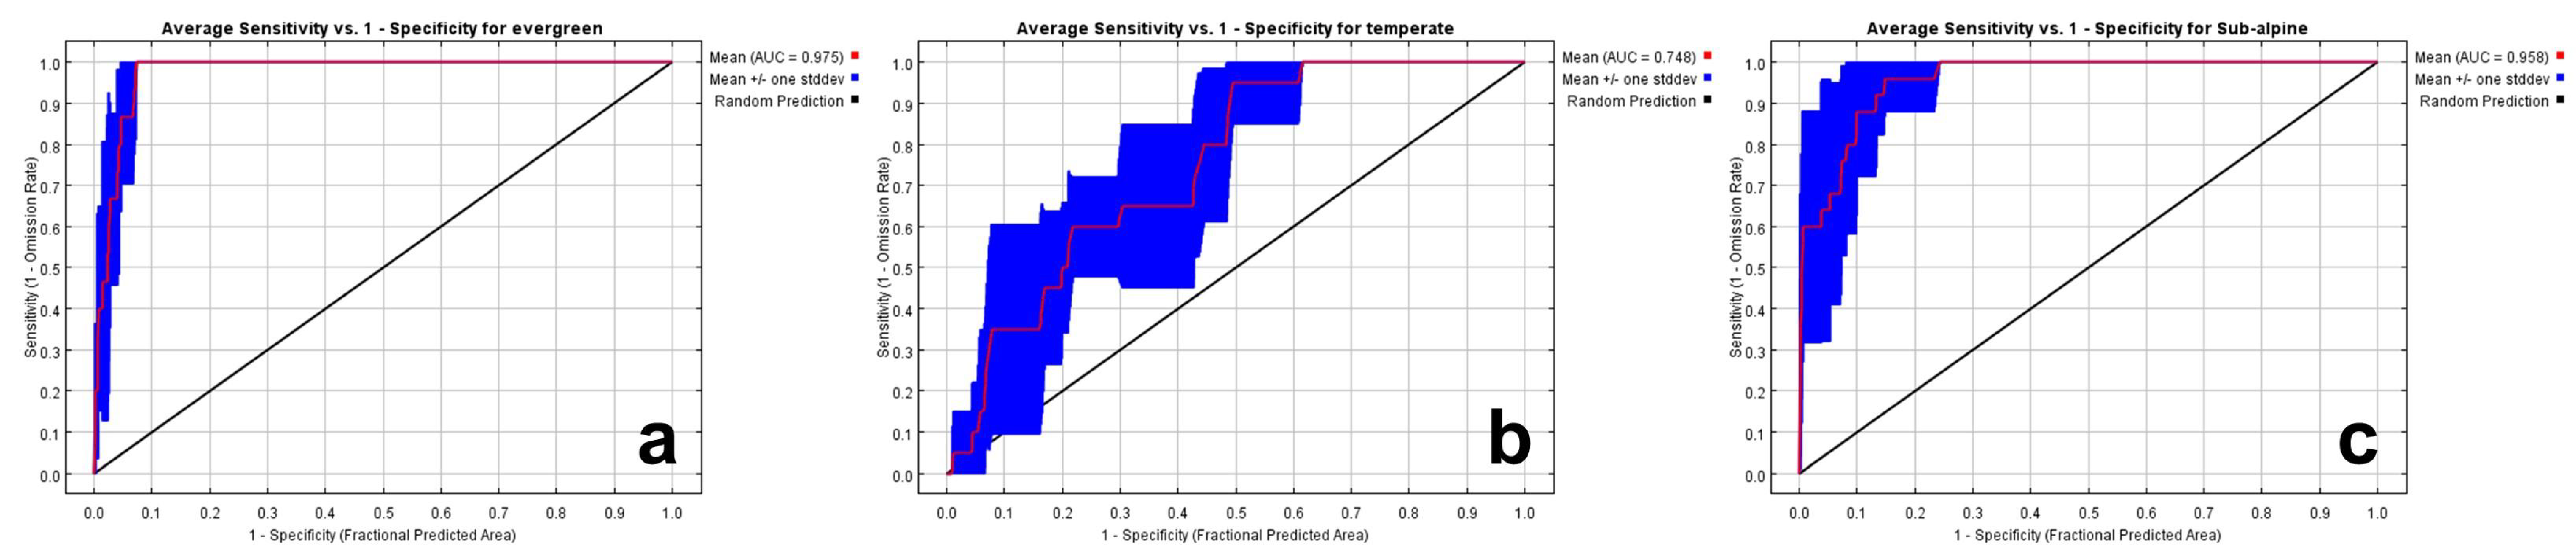
Statistical methods and qualitative methods were used to verify the suitability of each forest type estimated by the model. First, Area Under the Curve (AUC) of Receiver Operating Characteristic (ROC) curves was used as a statistical method. The AUC represents the probability that a randomly chosen forest species occurrence exceeds that of randomly choosing an absence. The AUC value is within the range (0.5–1.0), where the minimum value represents the performance of a random prediction and the maximum value correspond to a perfect prediction. The AUC value ranged between: 0.5–0.69, poor; 0.7–0.79, reasonable; 0.8–0.89, excellent; and >0.9, exceptional [48].
For qualitative evaluation, an actual vegetation map produced by the Ministry of Environment, Korea was used. The actual vegetation map is a representative map of the forest species distribution of South Korea, in the form of a map created using high resolution satellite imagery and aerial photographs, and corrected by field surveys and remote sensing techniques. The natural forest on the actual vegetation map is divided into the three forest types classified in this study, and their performance is evaluated by overlapping with the habitat suitability map simulated in this study.
3. Results and Discussion
3.1. Calculating Three Climate Indices
Calculation of the three key climate variable, revealed that the future change and variation in temperature-related variables was large. In the MTCI results using the minimum temperature of the coldest month, the range area from 0 to −30, which was only distributed in the southern region, is predicted to increase northward as the future approaches. This means that climate conditions will be changed to widely distribute warm temperate plants. In the baseline period, the value was found to be greater than zero in the southern part of the Korean Peninsula; in the future, the MTCI value, which showed a low value from −60 to −90 in the mountainous region of South Korea, changed to −30 to −60 in most cases. Spatial changes in MTCI, which have a large impact on the growth limitation of vegetation, can change the vegetation in both subalpine and coastal forests (Figure 2).
The WI calculated from the cumulative value of mean temperatures gradually increased as with MTCI, but the distribution was slightly different. Because WI considers the possible growth temperature of vegetation, high altitude mountain areas and plains regions were clearly distinguished, and the difference according to altitude was larger than the difference between north and south (latitude). In the baseline period, there were very few areas with high WI values above 150, but in RCP 4.5 2070s, Seoul in the middle of the Korean Peninsula was above WI 150, and in RCP 8.5 2070s, it extended to some parts of North Korea (Figure 2).
The PEI calculation that accounted for the ratio of meteorological water content on land, showed no significant difference compared to the temperature indices. The highest change in PEI was observed in the Gaema Plateau, in the northern part of the Korean Peninsula, where the evapotranspiration amount was lowest compared with the precipitation level. There is also a tendency for the effective precipitation rate to decrease due to the increase in evapotranspiration in the South Korean interior, northwest coast, and northeast coast (Figure 2).
As in previous studies that used climate change scenario data, the distribution of temperature indices was prominent, and was even higher in RCP 8.5 than in the RCP 4.5 scenario [25,49]. RCP 4.5 2070s and RCP 8.5 2050s exhibited a similar level of variation, and the largest change was seen in RCP 8.5 2070s.
3.2. Estimating Baseline Forest Habitat Suitability
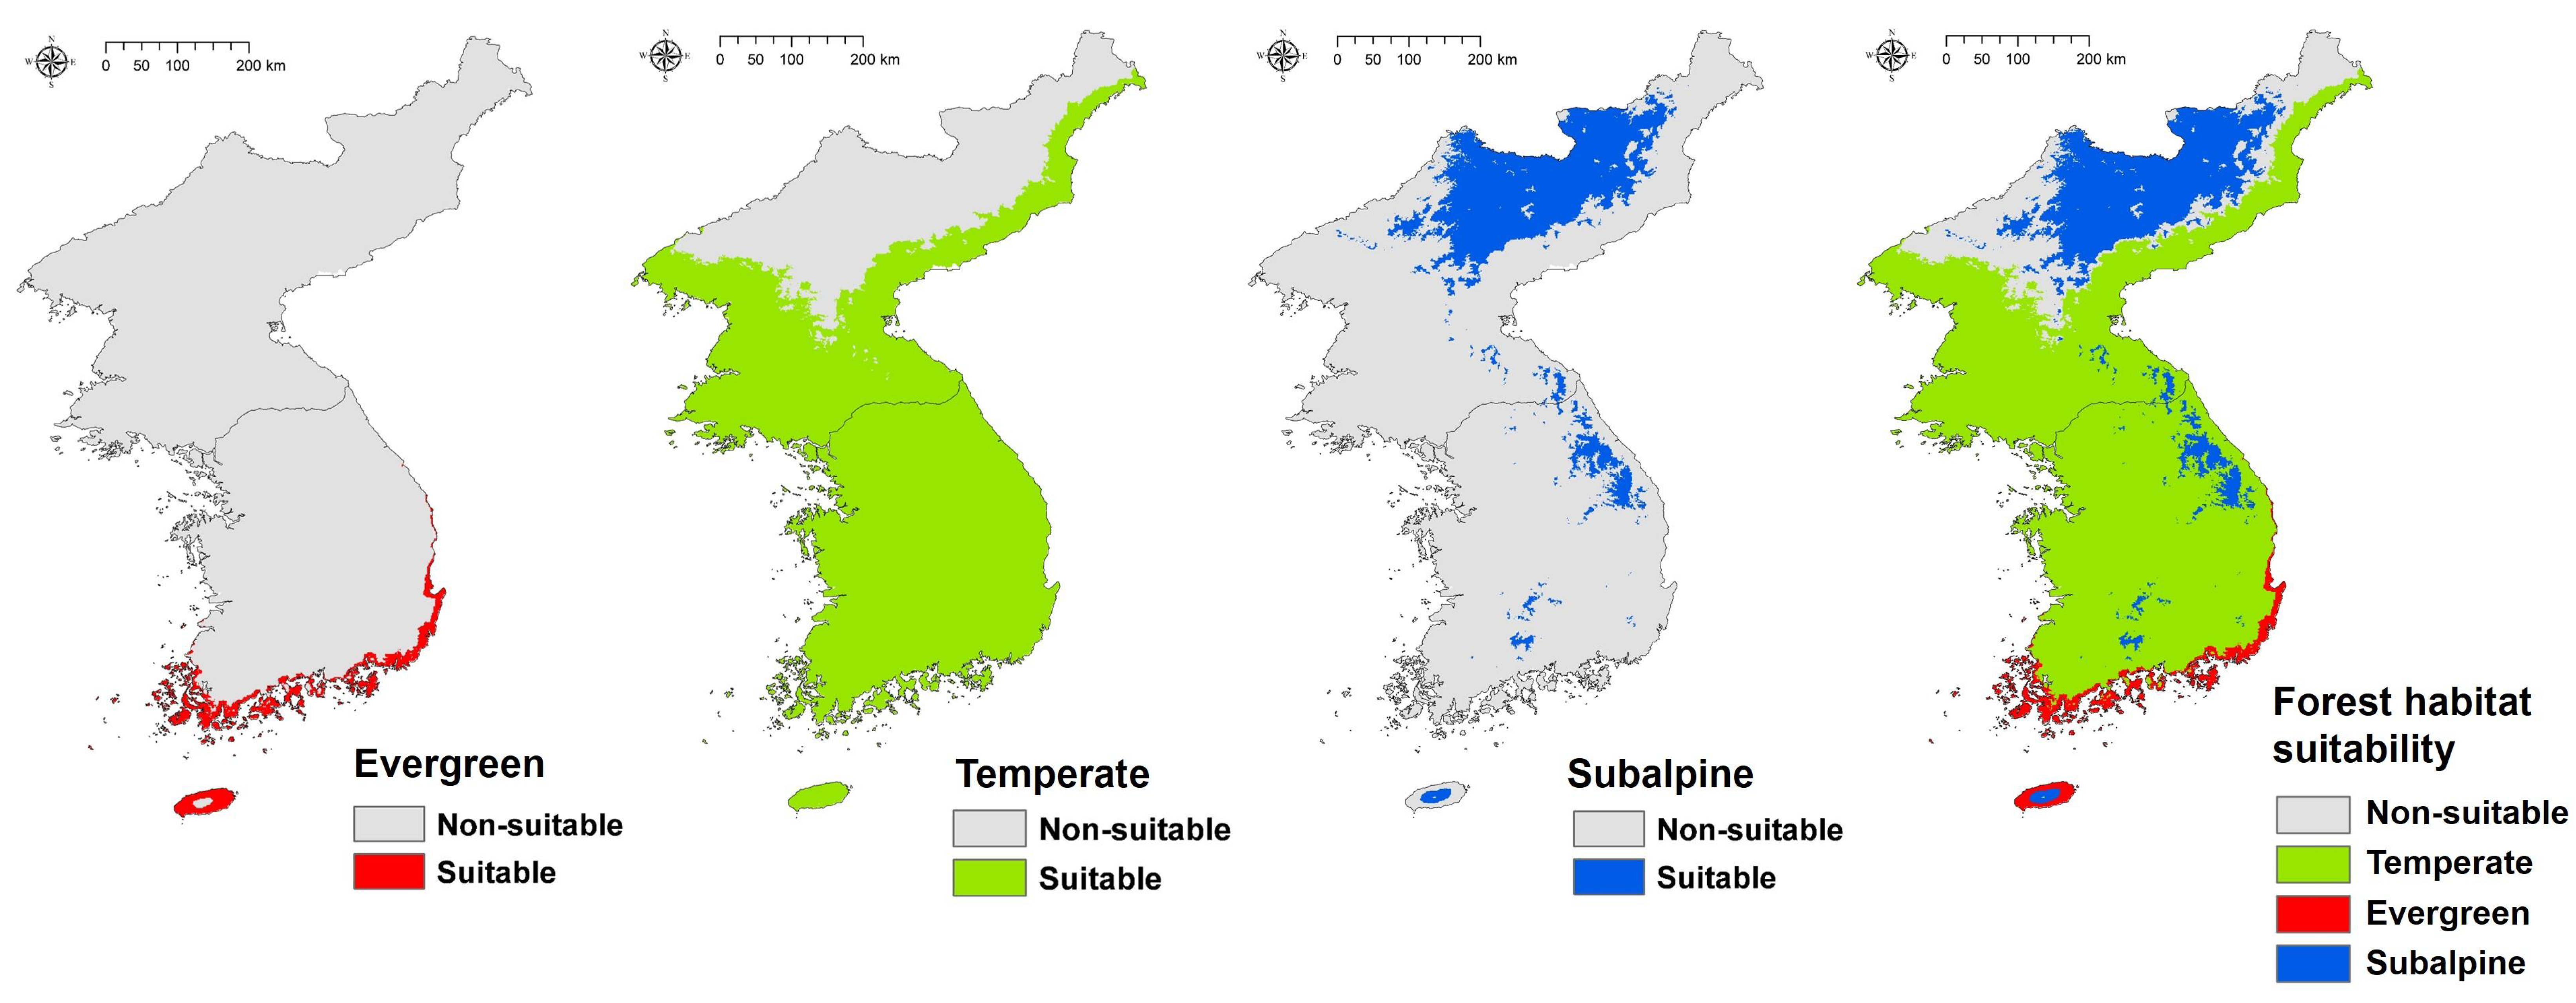
The estimation of habitat suitability of the three forest types for the baseline period was similar to that of many previous research studies and surveys [16,17,50,51]. In the case of warm temperate evergreen forest, suitable areas were found in Jeju Island and the southern coast of the Korean Peninsula (Figure 3). Temperate forests were most suitable for the entire peninsula, but non-suitable for northern mountains (Figure 3). In the real environment, temperate forests are indigenous to most parts of the peninsula. In the case of subalpine forests, most of the main highlands of South Korea and most of the North Gaema Plateau were suitable areas (Figure 3). As a result of overlaying all suitable forest type areas, the only non-suitable area was found in the northern part of North Korea. This area is also the boundary between the temperate forest and the subalpine forest [52], and it is likely that the lack of forest occurrence points in North Korea affected our result.
3.3. Evaluation of Model Performance
3.3.1. Evaluation Using AUC and ROC
AUC and ROC curves were examined to evaluate the statistical accuracy of the forest habitat modelling. AUC values obtained with a high overall statistical confidence were 0.975 for the warm temperate evergreen forest, 0.748 for the temperate forest, and 0.958 for the subalpine forest (Figure 4).
Compared to the warm temperate evergreen and subalpine forests, temperate forest exhibited a relatively low accuracy, which was interpreted as a result of the low spatial correlation with location information due to the nature of temperate forests being distributed over a wide area.
In the context of an AUC value of MaxEnt output, a reasonable level is >0.7, and an exceptional level is >0.9; the overall statistical accuracy was more than reasonable and mostly exceptional.
3.3.2. Evaluation Using the Actual Vegetation Map of South Korea
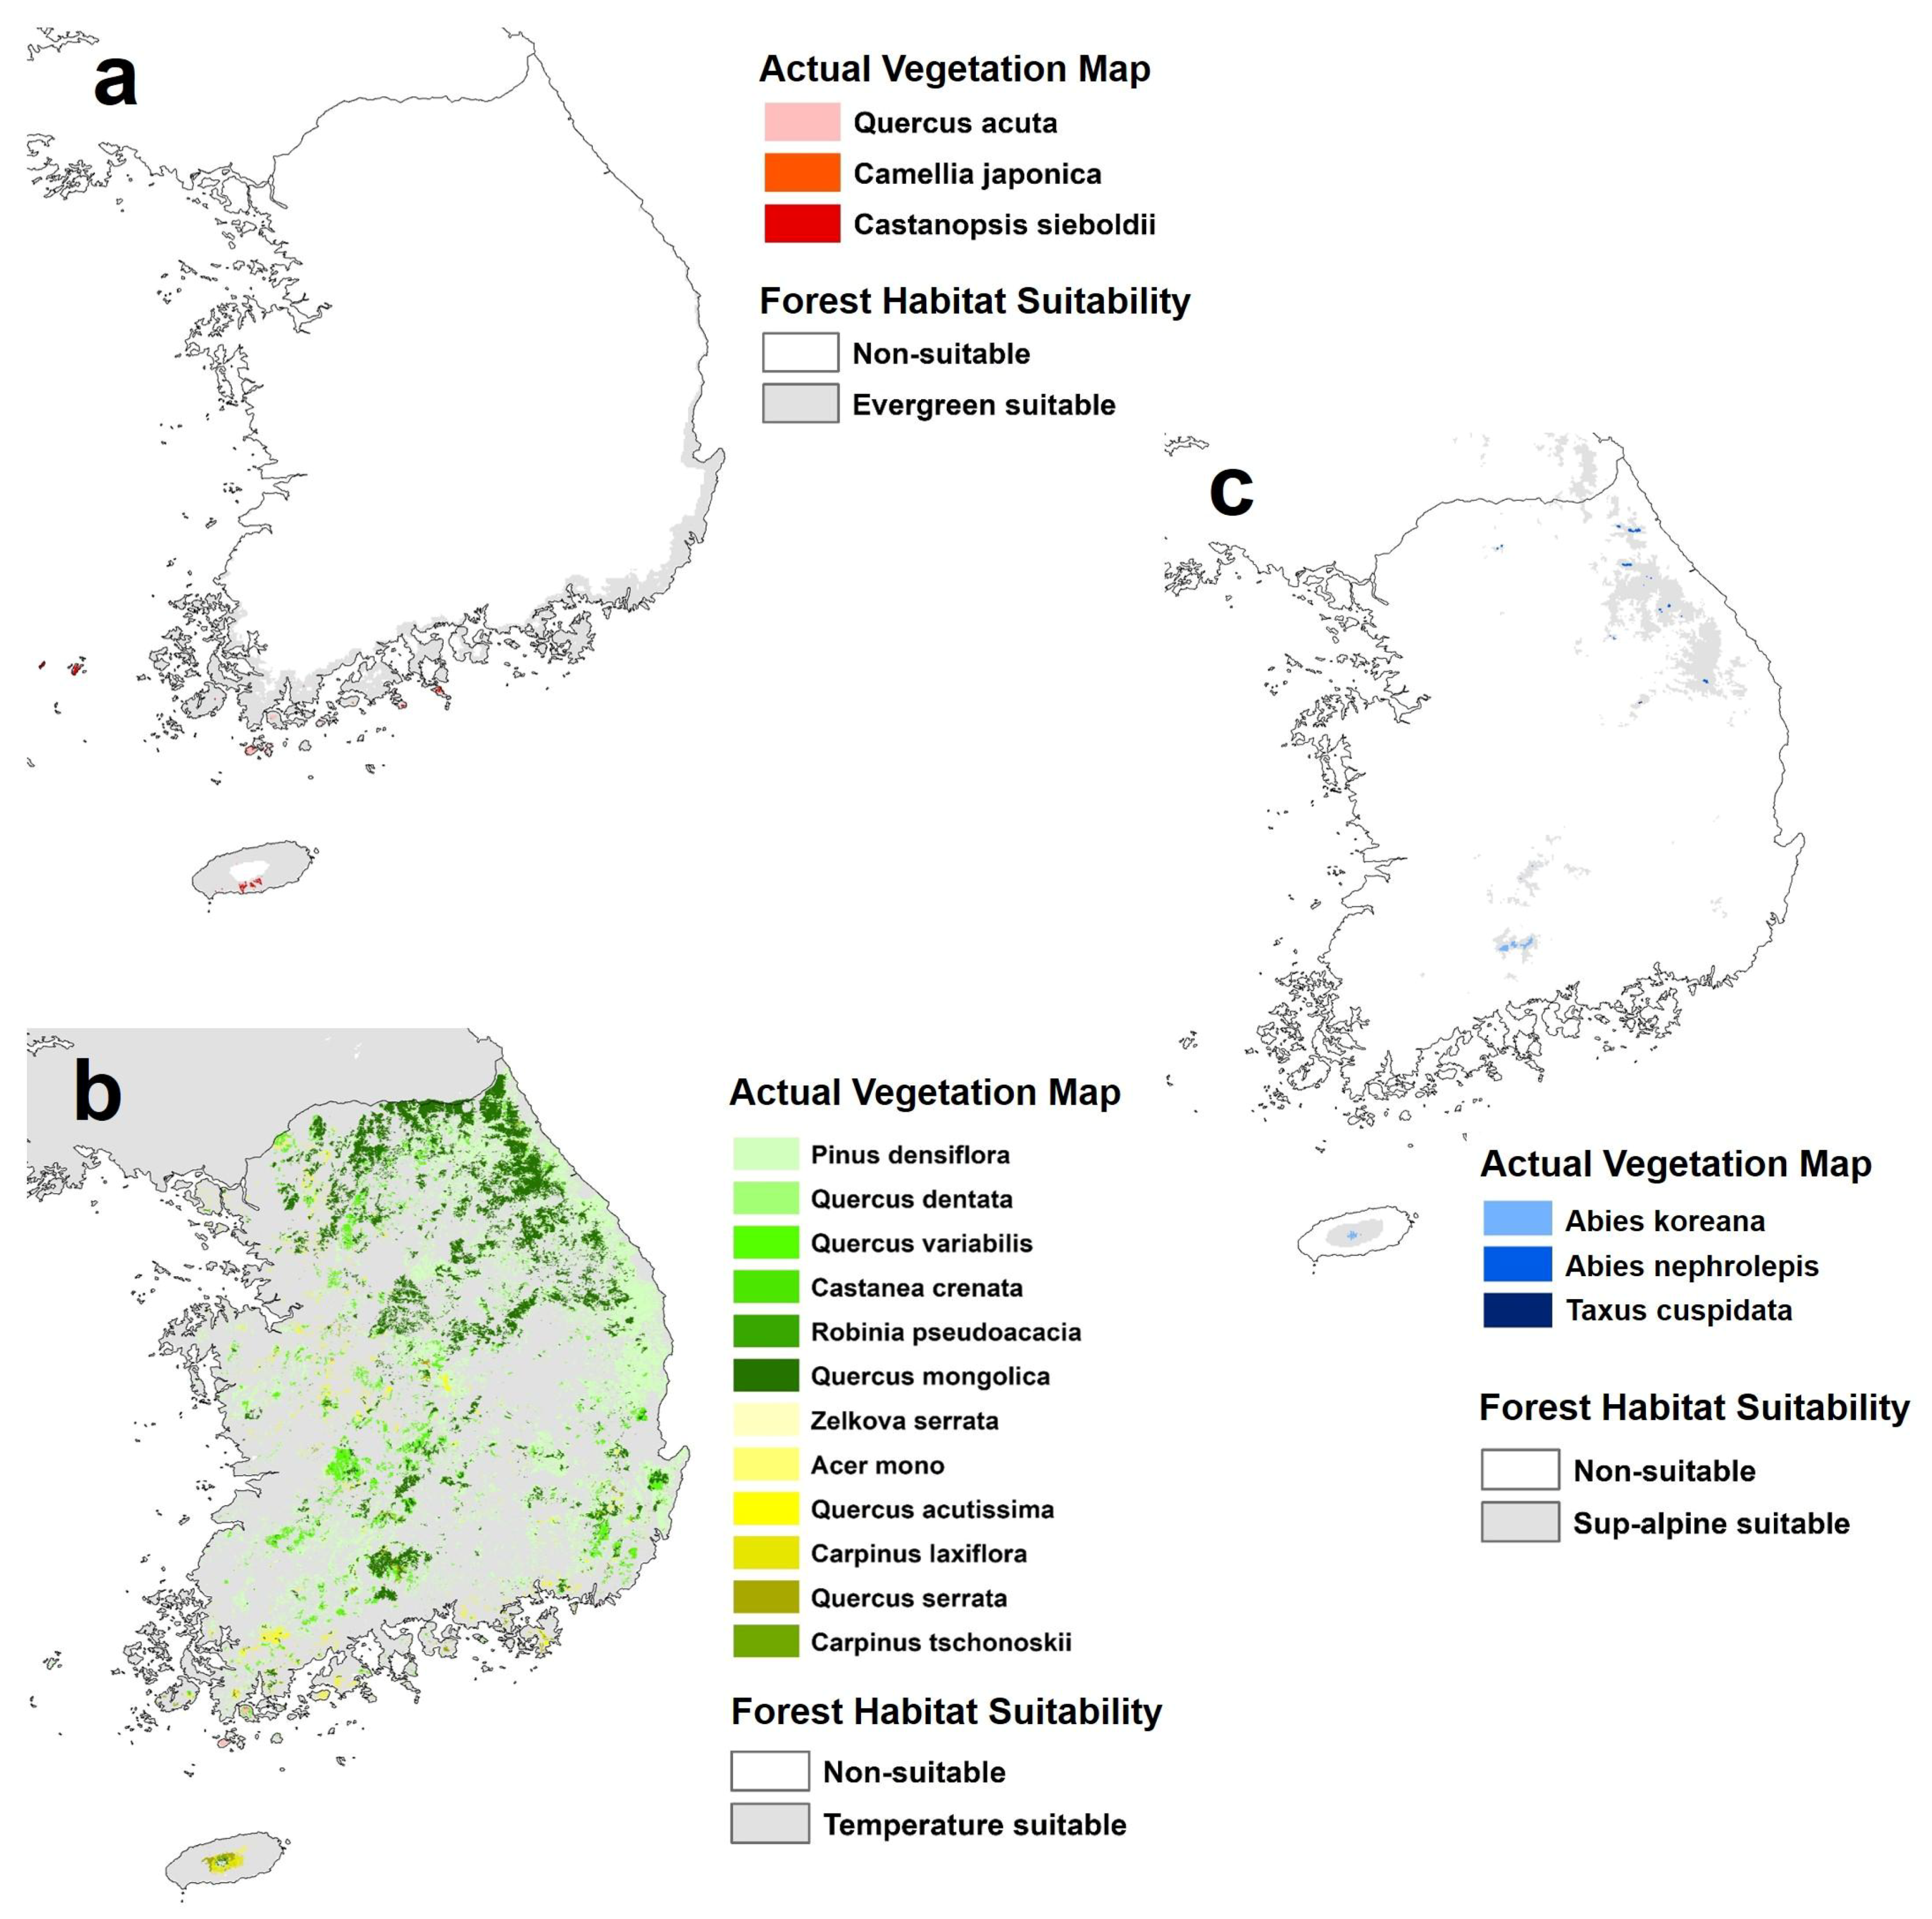
Comparison with the actual vegetation map of South Korea showed that the present distributions of the target forest types were included within the predicted suitable area (Figure 5). In the case of warm temperate evergreen forests, actual forests were located at Jeju Island and the south coast area of the Korean Peninsula, and some islands of the southwestern coast area. All these were included within the predicted range of suitable areas by this study. In the case of temperate forests, 12 species were compared, and our predicted range of suitable areas for temperate forest was the whole of South Korea. However, the actual distribution of temperate forests throughout the entire Korean Peninsula, and the whole of South Korea, confirmed that we can be confident in our results. The three sub-alpine forest species were present in Mt. Halla in Jeju Island, Mt. Jiri in the southern region, and the eastern mountainous regions (Mt. Seolak, Mt. Odae, Mt. Taebaek, etc.). The actual subalpine forest areas also showed a tendency to match our results precisely. In all three forest types, the actual forest ranges and the predicted suitable areas overlapped, and all the actual forest locations were included in the predicted ranges. The results of this study were expected to be broader than the actual ranges because of the potential habitat suitability. Even though only climate indices were used, our baseline habitat suitability results for the three forest types simulated the distribution of actual vegetation well, so this approach proves to be sufficient for future prediction.
3.4. Climate Change Impact on Forest Habitat Suitability
The climate change scenarios impacted on the habitat suitability of all three forest types. In the RCP 4.5 scenario 2050s, the warm temperate evergreen forest extended smoothly to the northern area. The temperate forest was almost similar to the baseline period. In the case of subalpine forest, South Korea and North Korea appeared different; in South Korea, the Jeju Island reduced a suitable area for subalpine forest only, while other regions were almost the same as in the baseline period; however, the Gaema Plateau in North Korea, decreased the area suitable for subalpine forest significantly. In the RCP 4.5 2070s scenario, the warm temperate evergreen forest was more northward, extending widely to the northern Hwanghae-do Province of North Korea, and beginning to spread inland in South Korea. The temperate forest was fairly similar to the baseline period, as in the 2050s, but the subalpine forest began to decrease gradually in South Korea. In particular, in South Korea, non-suitable areas began to appear because the temperate forest suitable area had extended northward (Figure 6).
In the RCP 8.5 scenario 2050s, suitable areas for the warm temperate evergreen forest are increasingly found to the north, and the distribution of the subalpine forests gradually decreases; this is broadly similar to the distributions seen in RCP 4.5 2070s. The largest change compared to the baseline period was observed in RCP 8.5 2070s, and a suitable area for warm temperate evergreen forests began to appear on the east coast of North Korea. The suitable area for warm temperate evergreen forest became widespread in the interior of South Korea, and the subalpine forest greatly decreased in South Korea. Notably, only a small fraction remained in RCP 8.5 2070s in Jeju Island, where the subalpine forest rate was greatest at the baseline period (Figure 6).
A large difference can also be seen when comparing the size of the area. The suitable area for subalpine forest, which accounted for 17.18% of the total area of the Korean Peninsula at the baseline period, was only 7.37% at RCP 8.5 2070. In contrast, the warm temperate evergreen forest habitat suitable area, which was only 3.68% at the baseline period, increased more than five times to 19.21% in RCP 8.5 2070s (Table 1). The habitat suitable area for temperate forest also decreased by approximately 5.5% compared to the baseline, suggesting that major vegetation changes can be predicted for the Korean Peninsula. This result indicates that South Korea is in danger of eventually losing its subalpine forest, and that warm temperate evergreen forests are likely to encroach into North Korea due to climate change.
In terms of altitude and latitude, it can be seen that the habitat suitability area shifts to higher places as the climate changes. In the case of warm temperate evergreen forests, it gradually goes northward up to a high latitude around the low-altitude area. Temperate and subalpine forests, on the other hand, are shifting to increasingly higher altitudes in order to find suitable areas for growth as the climate changes dramatically. As this phenomenon expands, especially in the RCP 8.5 scenario 2070s, the suitability area of the subalpine forest in South Korea becomes highly fragmented and the habitat is expected to be destroyed in most areas.
3.5. Converting to Forest Habitat Diversity Analysis under Climate Change
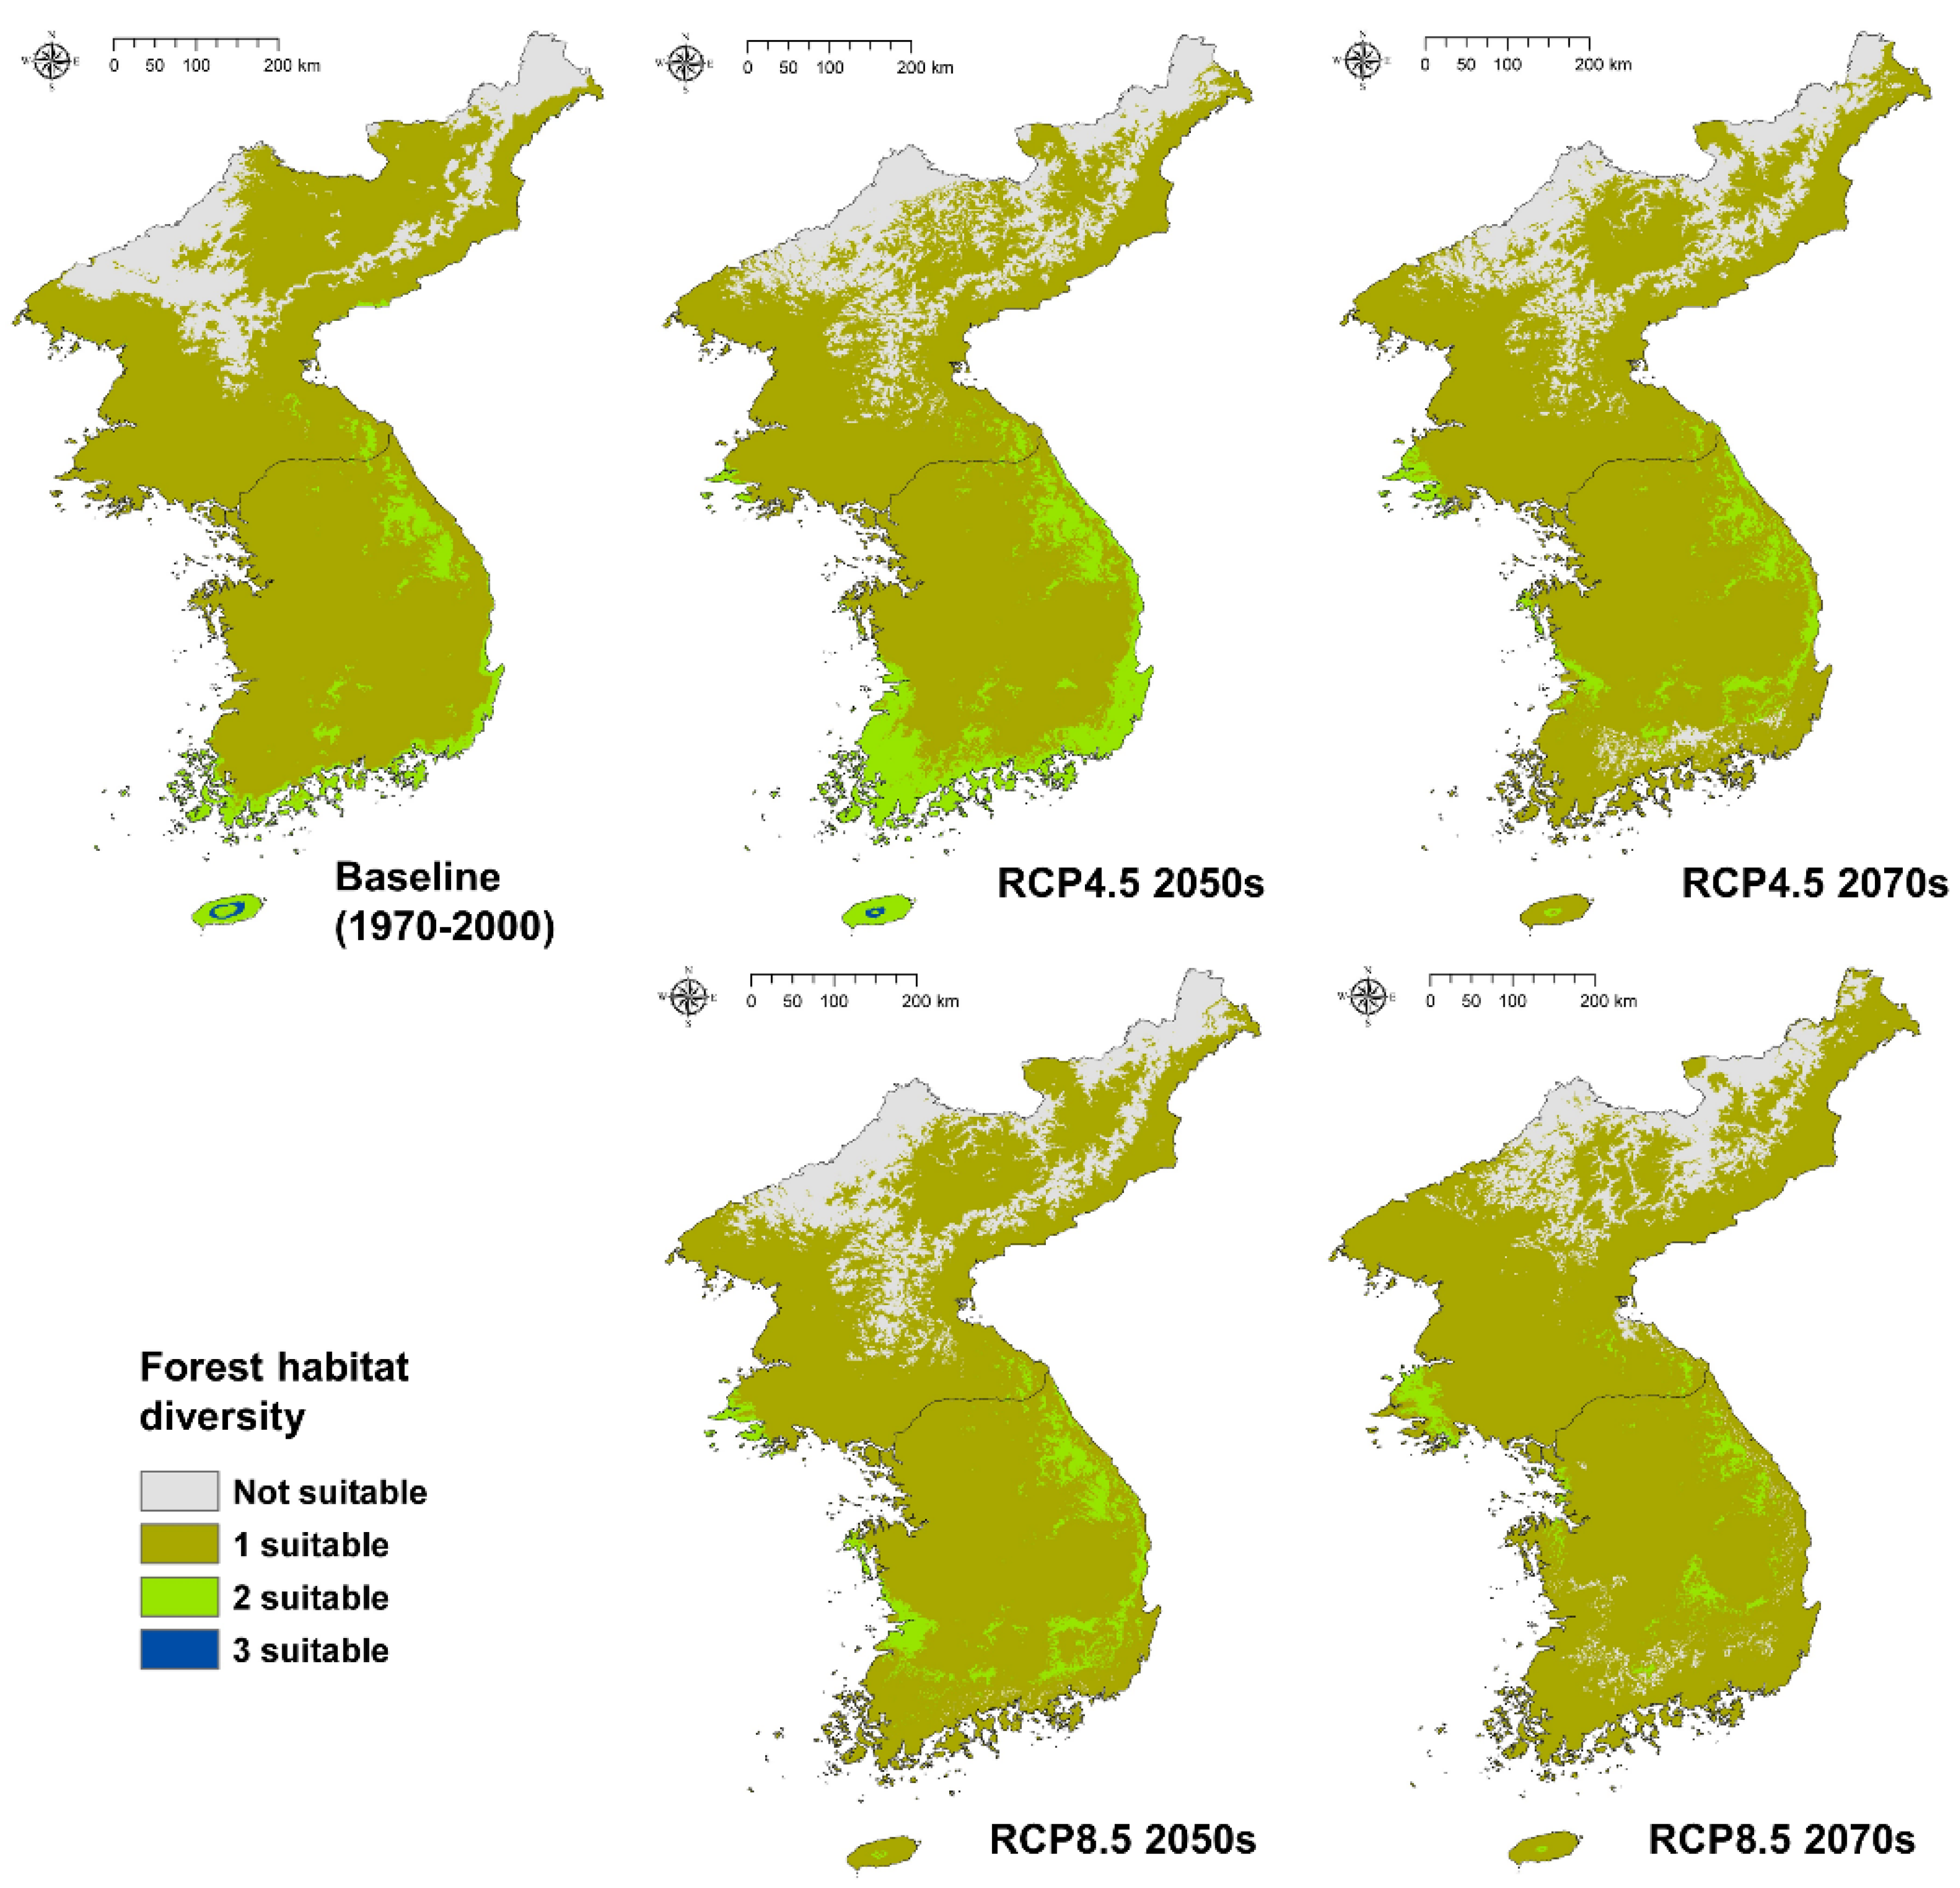
In terms of habitat diversity, there are currently areas where the three forest types overlap on Jeju Island in the southern part of the Korean Peninsula (Figure 7). Though it is only a small area, it can be classified as having a high diversity. There are also areas on the southern coast, and in the central mountainous region of the Korean Peninsula, where conditions suitable for temperate forest-subalpine forest and temperate forest-warm temperate evergreen forest overlapped.
When climate change effects were analyzed, the RCP 4.5 scenario in the 2050s produced an area where the three forest types could co-exist on Jeju Island, but this had disappeared by the 2070s and was not present at all in the RCP 8.5 scenario. The size of the suitable area that could support two different forest types in the RCP 4.5 scenario had increased by the 2050s, but it decreased after that period. In the RCP 8.5 scenario in the 2070s, the size of the suitable area for two forest types fell significantly, and for the first time, areas that were unsuitable for all three forest types appeared in South Korea. This habitat modeling did not simulate individual species, but these results indicate that future climate change could alter the Korean environment and reduce ecosystem biodiversity.
Overall, suitable areas with a highest forest habitat diversity, which could support three different forest types, are expected to disappear in the future and suitable areas supporting two forest types are also expected to decline significantly from 6.12% (baseline period) to 2.76% (RCP 8.5 2070s) (Table 2).
3.6. Implications of Forest Suitability and Diversity Assessment Attributable to Climate Change
Most previous studies on future forest distributions in the Korean Peninsula show detailed changes based on individual species changes, whereas this study predicted overall changes through representative forest types [13,16,17,24,53]. Nevertheless, our results on habitat suitability of subalpine forest showed a decrease as in Koo et al. [52]’s study, habitat suitability of warm temperate forests increased as in studies of Park et al. [16] and Koo et al. [28], and spatial distributions also showed the same patterns. This suggests that the same results can be achieved by simulating group level forest types, without taking into account the growth characteristics of individual species, and this may be effective in studying regions where data is lacking, such as North Korea.
In this study, we proposed a method to evaluate habitat diversity through the overlap of habitat suitability. Although this method is simple, Jeju Island, which is known to have the highest ecosystem diversity, gave the highest level of confidence in the results. Indeed, biogeographically, biodiversity is highly likely to be greatest at the boundary between subtropical and temperate zones, or between the temperate zone and the alpine zone [20,21]. Jeju Island is the only latitude where subtropical and temperate vegetation overlap in the Korean Peninsula, and subalpine forest is distributed in the high mountains. The concept of this study is based on these theories.
Changes in habitat diversity, as well as habitat suitability of forest types, due to climate change can have a significant impact on the conservation of biodiversity on a regional scale. While these forest habitats do not have a direct impact on human food or industry, they can reduce the provisioning, regulating, supporting, and culture functions provided by ecosystems and can lead to the destruction of ecosystems through infestation by pests or alien species [19,54,55,56,57]. This negative prediction of future change is disappointing, and means that active mitigation and adaptation to prevent these changes are required. If changes are maintained at the RCP 4.5 level, in the 2050s, Jeju Island should still be a suitable area for three forest types, and the suitable area for two forest types in South Korea will be greater than at present. Even if the habitat suitable areas change, subalpine forests such as Abies koreana and Abies nephrolepis should be found in major mountain areas through the management of conservation species under the RCP 4.5 scenarios [23,24,58]. In other words, the sustainability of future ecosystems is still dependent on our efforts.
Despite these implications, our study has some limitations. First, since only one GCM and SDM were used, the uncertainties of the data and models remained. However, since our results are highly similar with the results of other ensemble studies, it is considered that it is enough to explain future conditions [16,17,28]. Also, SDM studies at the macro or regional level have structural limitations that do not reflect microclimate variability or specific small-scale habitat attributes. Therefore, our results might be useful to interpret the regional scale rather than small habitat scale.
4. Conclusions
Close assessment of the impacts of climate change has significant implications for the specific impacts of greenhouse gas (GHG) mitigation, and the level needed for adaptation to climate change. Changes in habitat suitability by forest type, and subsequent changes in habitat diversity, were confirmed by two climate change scenarios. Three climate indices and MaxEnt models were used for this purpose, and quantitative and qualitative evaluations were conducted. First, the results of the three climate indices showed significant variation in the those related to temperature. Both the statistical and the qualitative validation using the current actual vegetation map showed excellent results. In terms of forest habitat suitability, a substantial increase and northward migration of warm temperate evergreen forest areas was prominent, and the subalpine forest decreased significantly due to the effects of climate change. The subalpine forest habitat suitable area for RCP 8.5 2070s decreased to less than half that of the baseline period, while warm temperate evergreen forest habitats increased by more than five times. In terms of forest habitat diversity, regions with a high diversity declined due to the impact of climate change. In the RCP 8.5 scenarios, suitable areas for all three forest types did not appear at all; however, in the RCP 4.5 2050s, suitable areas for two forest types increased, i.e., this was not negative in terms of diversity. This study highlights the necessity of adapting to climate change, and the importance of greenhouse gas reduction to minimize the impact on habitat change and diversity throughout forests and ecosystems.
Author Contributions
C.-H.L. designed this research, analyzed the results, and wrote the paper; S.Y. and Y.C. participated in analyzing the results and processing the data. S.W.J., Y.S., and W.-K.L. gave comments and improved the final manuscript.
Acknowledgments
This work was supported by “Public Technology Development Project based on Environmental Policy” (2016000210001) provided by Korea Environmental Industry and Technology Institute, and a Korea University Grant.
Conflicts of Interest
The authors declare no conflict of interest.
References
- Intergovernmental Panel on Climate Change (IPCC). Climate Change 2014: Impacts, Adaptation, and Vulnerability. Part A: Global and Sectoral Aspects. Contribution of Working Group II to the Fifth Assessment Report of the Intergovernmental Panel on Climate Change; Cambridge University Press: Cambridge, UK, 2014. [Google Scholar]
- Anadon, J.D.; Sala, O.E.; Maestre, F.T. Climate change will increase savannas at the expense of forests and treeless vegetation in tropical and subtropical Americas. J. Ecol. 2014, 102, 1363–1373. [Google Scholar] [CrossRef]
- Wernberg, T.; Bennett, S.; Babcock, R.C.; de Bettignies, T.; Cure, K.; Depczynski, M.; Dufois, F.; Fromont, J.; Fulton, C.J.; Hovey, R.K.; et al. Climate-driven regime shift of a temperate marine ecosystem. Science 2016, 353, 169–172. [Google Scholar] [CrossRef] [PubMed]
- Schlaepfer, D.R.; Bradford, J.B.; Lauenroth, W.K.; Munson, S.M.; Tietjen, B.; Hall, S.A.; Wilson, S.D.; Duniway, M.C.; Jia, G.; Pyke, D.A.; et al. Climate change reduces extent of temperate drylands and intensifies drought in deep soils. Nat. Commun. 2017, 8, 14196. [Google Scholar] [CrossRef] [PubMed]
- Isbell, F.; Craven, D.; Connolly, J.; Loreau, M.; Schmid, B.; Beierkuhnlein, C.; Bezemer, T.M.; Bonin, C.; Bruelheide, H.; de Luca, E.; et al. Biodiversity increases the resistance of ecosystem productivity to climate extremes. Nature 2015, 526, 574–577. [Google Scholar] [CrossRef] [PubMed]
- Prieto-Torres, D.A.; Navarro-Sigüenza, A.G.; Santiago-Alarcon, D.; Rojas-Soto, O.R. Response of the endangered tropical dry forests to climate change and the role of Mexican Protected Areas for their conservation. Glob. Chang. Biol. 2016, 22, 364–379. [Google Scholar] [CrossRef] [PubMed]
- Dyderski, M.K.; Paź, S.; Frelich, L.E.; Jagodziński, A.M. How much does climate change threaten European forest tree species distributions? Glob. Chang. Biol. 2017, 24, 1150–1163. [Google Scholar] [CrossRef] [PubMed]
- Akhter, S.; McDonald, M.A.; van Breugel, P.; Sohel, S.; Kjær, E.D.; Mariott, R. Habitat distribution modelling to identify areas of high conservation value under climate change for Mangifera sylvatica Roxb. of Bangladesh. Land Use Policy 2017, 60, 223–232. [Google Scholar] [CrossRef]
- Mair, L.; Harrison, P.J.; Räty, M.; Bärring, L.; Strandberg, G.; Snäll, T. Forest management could counteract distribution retractions forced by climate change. Ecol. Appl. 2017, 27, 1485–1497. [Google Scholar] [CrossRef] [PubMed]
- Clark, J.S.; Gelfand, A.E.; Woodall, C.W.; Zhu, K. More than the sum of the parts: Forest climate response from joint species distribution models. Ecol. Appl. 2014, 24, 990–999. [Google Scholar] [CrossRef] [PubMed]
- Koo, K.A.; Patten, B.C.; Madden, M. Predicting effects of climate change on habitat suitability of red spruce (Picea rubens Sarg.) in the southern Appalachian Mountains of the USA: Understanding complex systems mechanisms through modeling. Forests 2015, 6, 1208–1226. [Google Scholar] [CrossRef]
- De Rigo, D.; Caudullo, G.; San-Miguel-Ayanz, J.; Barredo, J.I. Robust Modelling of the Impacts of Climate Change on the Habitat Suitability of Forest Tree Species; Publication Office of the European Union: Luxembourg, 2017; 58p. [Google Scholar]
- Choi, S.; Lee, W.K.; Kwak, D.A.; Lee, S.; Son, Y.; Lim, J.H.; Saborowski, J. Predicting forest cover changes in future climate using hydrological and thermal indices in South Korea. Clim. Res. 2011, 49, 229–245. [Google Scholar] [CrossRef]
- Nam, K.; Lee, W.K.; Kim, M.; Kwak, D.A.; Byun, W.H.; Yu, H.; Kwak, H.; Kwon, T.; Sung, J.; Chung, D.J.; Lee, S.H. Spatio-temporal change in forest cover and carbon storage considering actual and potential forest cover in South Korea. Sci. China Life Sci. 2015, 58, 713–723. [Google Scholar] [CrossRef] [PubMed]
- Kang, W.; Minor, E.S.; Lee, D.; Park, C.R. Predicting impacts of climate change on habitat connectivity of Kalopanax septemlobus in South Korea. Acta Oecol. 2016, 71, 31–38. [Google Scholar] [CrossRef]
- Park, S.U.; Koo, K.A.; Seo, C.; Hong, S. Climate-related range shifts of Ardisia japonica in the Korean Peninsula: A role of dispersal capacity. J. Ecol. Environ. 2017, 41, 38. [Google Scholar] [CrossRef]
- Koo, K.A.; Park, S.U.; Seo, C. Effects of Climate Change on the Climatic Niches of Warm-Adapted Evergreen Plants: Expansion or Contraction? Forests 2017, 8, 500. [Google Scholar] [CrossRef]
- Huang, J.; Li, G.; Li, J.; Zhang, X.; Yan, M.; Du, S. Projecting the Range Shifts in Climatically Suitable Habitat for Chinese Sea Buckthorn under Climate Change Scenarios. Forests 2018, 9, 9. [Google Scholar] [CrossRef]
- Alsterberg, C.; Roger, F.; Sundbäck, K.; Juhanson, J.; Hulth, S.; Hallin, S.; Gamfeldt, L. Habitat diversity and ecosystem multifunctionality—The importance of direct and indirect effects. Sci. Adv. 2017, 3, e1601475. [Google Scholar] [CrossRef] [PubMed]
- Rosenzweig, M.L. Species diversity gradients: We know more and less than we thought. J. Mammal. 1992, 73, 715–730. [Google Scholar] [CrossRef]
- Paquette, A.; Messier, C. The effect of biodiversity on tree productivity: From temperate to boreal forests. Glob. Ecol. Biogeogr. 2011, 20, 170–180. [Google Scholar] [CrossRef] [Green Version]
- Müllerová, J.; Hédl, R.; Szabó, P. Coppice abandonment and its implications for species diversity in forest vegetation. For. Ecol. Manag. 2015, 343, 88–100. [Google Scholar] [CrossRef] [PubMed]
- Kim, M.; Lee, W.K.; Choi, G.M.; Song, C.; Lim, C.H.; Moon, J.; Piao, D.; Kraxner, F.; Shividenko, A.; Forsell, N. Modeling stand-level mortality based on maximum stem number and seasonal temperature. For. Ecol. Manag. 2017, 386, 37–50. [Google Scholar] [CrossRef]
- Yoo, S.; Lee, W.K.; Kim, M.; Lim, C.H.; Song, C.; Kim, S.J. Predicting Endangered Coniferous Tree Species Distribution under Climate Change: Implication of HyTAG Model. J. Environ. Impact Assess. 2018. under review. [Google Scholar]
- Lim, C.H.; Kim, S.H.; Choi, Y.; Kafatos, M.C.; Lee, W.K. Estimation of the Virtual Water Content of Main Crops on the Korean Peninsula Using Multiple Regional Climate Models and Evapotranspiration Methods. Sustainability 2017, 9, 1172. [Google Scholar] [CrossRef]
- Lamchin, M.; Lee, W.K.; Jeon, S.W.; Wang, S.W.; Lim, C.H.; Song, C.; Sung, M. Long-term trend and correlation between vegetation greenness and climate variables in Asia based on satellite data. Sci. Total Environ. 2018, 618, 1089–1095. [Google Scholar] [CrossRef] [PubMed]
- Lim, C.H.; Choi, Y.; Kim, M.; Lee, S.J.; Folberth, C.; Lee, W.K. Spatially Explicit Assessment of Agricultural Water Equilibrium in the Korean Peninsula. Sustainability 2018, 10, 201. [Google Scholar] [CrossRef]
- Koo, K.A.; Park, S.U.; Hong, S.; Jang, I.; Seo, C. Future distributions of warm-adapted evergreen trees, Neolitsea sericea and Camellia japonica under climate change: Ensemble forecasts and predictive uncertainty. Ecol. Res. 2018, 33, 313–325. [Google Scholar] [CrossRef]
- Lim, C.H.; Choi, Y.; Kim, M.; Jeon, S.W.; Lee, W.K. Impact of deforestation on agro-environmental variables in cropland, North Korea. Sustainability 2017, 9, 1354. [Google Scholar] [CrossRef]
- Lim, C.H. A Cross-Sectoral Approach in the Water-Food-Ecosystem Nexus to Climate Change in the Korean Peninsula. Ph.D. Thesis, Korea University, Seoul, Korea, 2017. [Google Scholar]
- Chao, A.; Chiu, C.H.; Jost, L. Statistical challenges of evaluating diversity patterns across environmental gradients in mega-diverse communities. J. Veg. Sci. 2016, 27, 437–438. [Google Scholar] [CrossRef]
- Fick, S.E.; Hijmans, R.J. Worldclim 2: New 1-km spatial resolution climate surfaces for global land areas. Int. J. Climatol. 2017, 37, 4302–4315. [Google Scholar] [CrossRef]
- Bachelet, D.; Lenihan, J.M.; Daly, C.; Neilson, R.P.; Ojima, D.S.; Parton, W.J. MC1: A Dynamic Vegetation Model for Estimating the Distribution of Vegetation and Associated Ecosystem Fluxes of Carbon, Nutrients, and Water; Pacific Northwest Station General Technical Report PNW-GTR-508; USDA: Washington, DC, USA, 2001.
- Neilson, R.P. A model for predicting continental-scale vegetation distribution and water balance. Ecol. Appl. 1995, 5, 362–385. [Google Scholar] [CrossRef]
- Kira, T. A New Classification of Climate in Eastern Asia as the Basis for Agricultural Geography; Horticultural Institute Kyoto University: Kyoto, Japan, 1945. [Google Scholar]
- Yim, Y.J. Distribution of forest vegetation and climate in the Korean Peninsula: III. Distribution of tree species along the thermal gradient. Jpn. J. Ecol. 1977, 27, 177–189. [Google Scholar]
- Thornthwaite, C.W. The climates of North America: According to a new classification. Geogr. Rev. 1931, 21, 633–655. [Google Scholar] [CrossRef]
- Vörösmarty, C.J.; Douglas, E.M.; Green, P.A.; Revenga, C. Geospatial indicators of emerging water stress: An application to Africa. Ambio 2005, 34, 230–236. [Google Scholar] [CrossRef] [PubMed]
- Choi, Y.; Lim, C.H.; Ryu, J.; Jeon, S.W. Bioclimatic Classification of the Northeast Asia Reflecting Social Factors: Development and Characterization. Sustainability 2017, 9, 1137. [Google Scholar] [CrossRef]
- Lim, C.H.; Kim, G.S.; Lee, E.J.; Heo, S.; Kim, T.; Kim, Y.S.; Lee, W.K. Development on Crop Yield Forecasting Model for Major Vegetable Crops using Meteorological Information of Main Production Area. J. Clim. Chang. Res. 2016, 7, 193–203. [Google Scholar] [CrossRef]
- Deblauwe, V.; Barbier, N.; Couteron, P.; Lejeune, O.; Bogaert, J. The global biogeography of semi-arid periodic vegetation patterns. Glob. Ecol. Biogeogr. 2008, 17, 715–723. [Google Scholar] [CrossRef]
- Phillips, S.J.; Dudík, M. Modeling of species distributions with MaxEnt: New extensions and a comprehensive evaluation. Ecography 2008, 31, 161–175. [Google Scholar] [CrossRef]
- Elith, J.; Phillips, S.J.; Hastie, T.; Dudík, M.; Chee, Y.E.; Yates, C.J. A statistical explanation of MaxEnt for ecologists. Divers. Distrib. 2011, 17, 43–57. [Google Scholar] [CrossRef]
- Chen, F.; Du, Y.; Niu, S.; Zhao, J. Modeling forest lightning fire occurrence in the Daxinganling Mountains of Northeastern China with MAXENT. Forests 2015, 6, 1422–1438. [Google Scholar] [CrossRef]
- Ikegami, M.; Jenkins, T.A. Estimate global risks of a forest disease under current and future climates using species distribution model and simple thermal model–Pine Wilt disease as a model case. For. Ecol. Manag. 2018, 409, 343–352. [Google Scholar] [CrossRef]
- Xiaofeng, L.; Yi, Q.; Diqiang, L.; Shirong, L.; Xiulei, W.; Bo, W.; Chunquan, Z. Habitat evaluation of wild Amur tiger (Panthera tigris altaica) and conservation priority setting in north-eastern China. J. Environ. Manag. 2011, 92, 31–42. [Google Scholar] [CrossRef] [PubMed]
- Jenks, G.F. The Data Model Concept in Statistical Mapping. In International Yearbook of Cartography; George Philip: London, UK, 1967; Volume 7, pp. 186–190. [Google Scholar]
- Vilar, L.; Gómez, I.; Martínez-Vega, J.; Echavarría, P.; Riaño, D.; Martín, M.P. Multitemporal modelling of socio-economic wildfire drivers in central Spain between the 1980s and the 2000s: Comparing generalized linear models to machine learning algorithms. PLoS ONE 2016, 11, e0161344. [Google Scholar] [CrossRef] [PubMed]
- Kafatos, M.C.; Kim, S.H.; Lim, C.-H.; Kim, J.; Lee, W.-K. Responses of Agroecosystems to Climate Change: Specifics of Resilience in the Mid-Latitude Region. Sustainability 2017, 9, 1361. [Google Scholar] [CrossRef]
- Kim, T.; Song, C.; Lee, W.K.; Kim, M.; Lim, C.H.; Jeon, S.W.; Kim, J. Habitat Quality Valuation Using InVEST Model in Jeju Island. J. Korea Soc. Environ. Restor. Technol. 2015, 18, 1–11. [Google Scholar] [CrossRef]
- Cui, G.; Kwak, H.; Choi, S.; Kim, M.; Lim, C.H.; Lee, W.K.; Kim, J.; Chae, Y. Assessing vulnerability of forests to climate change in South Korea. J. For. Res. 2016, 27, 489–503. [Google Scholar] [CrossRef]
- Koo, K.A.; Kong, W.S.; Nibbelink, N.P.; Hopkinson, C.S.; Lee, J.H. Potential effects of climate change on the distribution of cold-tolerant evergreen broadleaved woody plants in the Korean Peninsula. PLoS ONE 2015, 10, e0134043. [Google Scholar] [CrossRef] [PubMed]
- Lim, C.H; Lee, W.K. Climate-Environmental Impacts on Agriculture and Water Balance; LAP: Beau Bassin, Mauritius, 2018. [Google Scholar]
- Kim, M.; Lee, W.K.; Kim, Y.S.; Lim, C.H.; Song, C.; Park, T.; Son, Y.; Son, Y.M. Impact of thinning intensity on the diameter and height growth of Larix kaempferi stands in central Korea. For. Sci. Technol. 2016, 12, 77–87. [Google Scholar]
- Song, C.H.; Lee, W.K.; Choi, H.A.; Kim, J.; Jeon, S.W.; Kim, J.S. Spatial assessment of ecosystem functions and services for air purification of forests in South Korea. Environ. Sci. Policy 2016, 63, 27–34. [Google Scholar] [CrossRef]
- Kim, G.S.; Lim, C.H.; Kim, S.J.; Lee, J.; Son, Y.; Lee, W.K. Effect of national-scale afforestation on forest water supply and soil loss in South Korea, 1971–2010. Sustainability 2017, 9, 1017. [Google Scholar] [CrossRef]
- Lee, J.; Lim, C.H.; Kim, G.S.; Markandya, A.; Chowdhury, S.; Kim, S.J.; Lee, W.K.; Son, Y. Economic viability of the national-scale forestation program: The case of success in the Republic of Korea. Ecosyst. Serv. 2018, 29, 40–46. [Google Scholar] [CrossRef]
- Correia, R.A.; Bugalho, M.N.; Franco, A.M.; Palmeirim, J.M. Contribution of spatially explicit models to climate change adaptation and mitigation plans for a priority forest habitat. Mitig. Adapt. Strateg. Glob. Chang. 2018, 23, 371–386. [Google Scholar] [CrossRef]
Figure 1.
Study area ((a): forest species sites used in this study, (b): administrative boundary with topographical information).
Figure 1.
Study area ((a): forest species sites used in this study, (b): administrative boundary with topographical information).

Figure 2.
Three climate indices calculated for baseline and future periods.

Figure 3.
Results of forest habitat suitability by type at the baseline period.

Figure 4.
Evaluating habitat modeling performance using ROC and AUC ((a): warm temperate evergreen forest; (b): temperate forest; (c): subalpine forest).
Figure 4.
Evaluating habitat modeling performance using ROC and AUC ((a): warm temperate evergreen forest; (b): temperate forest; (c): subalpine forest).

Figure 5.
Comparison with actual vegetation maps for evaluation of habitat modeling performance ((a): warm temperate evergreen forest; (b): temperate forest; (c): subalpine forest).
Figure 5.
Comparison with actual vegetation maps for evaluation of habitat modeling performance ((a): warm temperate evergreen forest; (b): temperate forest; (c): subalpine forest).

Figure 6.
Spatial distribution of forest habitat suitability in baseline and future climates.

Figure 7.
Spatial distribution of forest habitat diversity in baseline and future climates.


Table 1.
Habitat suitable area statistics of each forest type and period, km2 (%).
| Forest Type | Baseline | RCP 4.5 2050s | RCP 4.5 2070s | RCP 8.5 2050s | RCP 8.5 2070s |
|---|---|---|---|---|---|
| Evergreen | 8372 (3.68) | 22,302 (9.79) | 28,100 (12.34) | 27,254 (11.97) | 43,731 (19.21) |
| Temperate | 149,811 (65.79) | 139,074 (61.08) | 138,652 (60.09) | 132,375 (58.14) | 137,245 (60.28) |
| Subalpine | 39,128 (17.18) | 26,938 (11.83) | 24,907 (10.94) | 29,906 (13.13) | 16,779 (7.37) |
| Non-suitable | 30,383 (13.34) | 39,380 (17.29) | 36,035 (15.83) | 38,159 (16.76) | 29,939 (13.15) |
Table 2.
Habitat diverse area statistics of each type and period, km2 (%).
| Diversity | Baseline | RCP 4.5–2050s | RCP 4.5–2070s | RCP 8.5–2050s | RCP 4.5–2070s |
|---|---|---|---|---|---|
| Not suitable | 30,383 (13.34) | 39,926 (17.53) | 36,035 (15.83) | 38,159 (16.76) | 29,939 (13.15) |
| 1 suitable | 183,099 (80.41) | 159,309 (69.97) | 181,911 (79.89) | 177,624 (78.01) | 191,466 (84.09) |
| 2 suitable | 13,925 (6.12) | 28,304 (12.43) | 9748 (4.28) | 11,911 (5.23) | 6289 (2.76) |
| 3 suitable | 287 (0.13) | 155 (0.07) | - | - | - |
© 2018 by the authors. Licensee MDPI, Basel, Switzerland. This article is an open access article distributed under the terms and conditions of the Creative Commons Attribution (CC BY) license (http://creativecommons.org/licenses/by/4.0/).
Share and Cite
MDPI and ACS Style
Lim, C.-H.; Yoo, S.; Choi, Y.; Jeon, S.W.; Son, Y.; Lee, W.-K. Assessing Climate Change Impact on Forest Habitat Suitability and Diversity in the Korean Peninsula. Forests 2018, 9, 259. https://doi.org/10.3390/f9050259
AMA Style
Lim C-H, Yoo S, Choi Y, Jeon SW, Son Y, Lee W-K. Assessing Climate Change Impact on Forest Habitat Suitability and Diversity in the Korean Peninsula. Forests. 2018; 9(5):259. https://doi.org/10.3390/f9050259
Chicago/Turabian StyleLim, Chul-Hee, Somin Yoo, Yuyoung Choi, Seong Woo Jeon, Yowhan Son, and Woo-Kyun Lee. 2018. "Assessing Climate Change Impact on Forest Habitat Suitability and Diversity in the Korean Peninsula" Forests 9, no. 5: 259. https://doi.org/10.3390/f9050259
Note that from the first issue of 2016, this journal uses article numbers instead of page numbers. See further details here.