Biophysical Factors Affecting Forest Cover Changes in Community Forestry: A Country Scale Analysis in Cambodia


1
Graduate School of Bioresource and Bioenvironmental Sciences, Kyushu University, Fukuoka 812-8581, Japan
2
Faculty of Agriculture, Kyushu University, Fukuoka 812-8581, Japan
3
Institute of Decision Science for a Sustainable Society, Kyushu University, Fukuoka 812-8581, Japan
4
Faculty of Agriculture, Kagoshima University, Kagoshima 890-8580, Japan
*
Author to whom correspondence should be addressed.
Forests 2018, 9(5), 273; https://doi.org/10.3390/f9050273
Submission received: 23 April 2018
/
Revised: 10 May 2018
/
Accepted: 13 May 2018
/
Published: 17 May 2018
(This article belongs to the Section Forest Ecology and Management)
Abstract
:Community forestry (CF) is increasingly used in developing countries to achieve both the socioeconomic outcome of poverty reduction and an ecological outcome. There have been many single case studies in a specific region to identify the factors affecting the success or failure of CF. Other studies have used large-N data collected from multiple countries. However, there is a dearth of large-N studies within a single country. In this study, we used a country scale dataset of 197 CF projects, established between 1994 and 2005 across Cambodia, to identify the biophysical factors that affected forest cover changes from 2005 to 2016. A mixed-effects logistic regression model was used for a total of 71,252 randomly sampled data pixels nested in the 197 CF. Results showed that deforestation in CF was likely to increase with increasing size of CF area at lower elevations and on gentler slopes. Deforestation also increased if CF was located close to villages, markets and CF boundaries, but further away from main roads. These findings on biophysical factors can help the government to decide on priority locations for further conservation interventions or for the establishment of new CF projects.
1. Introduction
Over half a billion people are relying on forests managed by the communities [1] and to combat with forest decline, there is an increasing global trend of shifting forest ownership from the state to the local communities [2]. Community forestry (CF) is an increasingly important form of management, where forests are managed by local community members at the village level. It is expected to be a successful tool in achieving both socioeconomic outcomes (poverty reduction and livelihood improvement) and ecological outcomes (biodiversity and carbon conservation) [3,4,5,6]. It is also reported that CF is more effective than protected areas for forest conservation [7,8] and has potentials in reducing emission from deforestation and forest degradation, conservation, and sustainable management of the forests and enhancement of forest carbon (REDD+) for climate change mitigation and adaptation [9,10]. Although CF is perceived as a successful forest management model for forest conservation globally [11], some studies indicate that the success or failure of CF depends on a variety of often site-specific contexts in different countries [11,12].
Many studies have tried to find the factors affecting the success or failure of CF, most of which have conducted a single or a few case studies in a specific region. Literature reviews of the case studies from different counties qualitatively summarized key factors such as tenure security, clear ownership, and effective enforcement [11,12]. Case studies can be effective in providing in-depth knowledge of specific conjunctures and highlighting the importance of causal processes significant in those conjunctures, but they are less effective when the objective is to assess the magnitude or relative importance of various factors [13]. In contrast, some studies have conducted statistical analysis using large-N datasets from different regions within single countries or across different countries to identify the success factors of CF [13,14,15,16,17,18]. Meta-analysis using data from different countries may provide us with universal insights of success factors that can be applicable all over the world, but the sample size from each country is often quite small, e.g., n = 83 from six countries [16], n = 152 from nine countries [15] and n = 80 from 10 countries [18]. Agrawal and Chhatre [13] and Nagendra [14] used large-N (95 and 55) from a specific region within the single countries of Nepal and India, respectively. Nevertheless, there have been relatively few studies which have analyzed a county-wide, large-N dataset, which can provide useful results for decision makers in a given country.
Cambodia is a Southeast Asian country with a total population of about 15 million people in 2015 where more than 70% of its population live in relative poverty in rural areas and depend on forests and agricultural land for subsistence. Millions of households in Cambodia depend directly and indirectly on forests, and the natural resources from forests are vital for rural livelihoods. The Royal Government of Cambodia (RGC) has recognized the importance of forests, laying down policies and strategies both to conserve forests and to improve local livelihoods in a sustainable manner. To this end, CF is one of the initiatives that was started in the 1990s. Under the Ministry of Agriculture, Forestry and Fisheries (MAFF) of Cambodia, the Forestry Administration (FA), which facilitates CF establishment, and other stakeholder initiatives from local non-governmental organizations and international organizations as well as development partners have supported CF establishment and operation actively. According to the statistics of CF in Cambodia in 2017, there were 580 CF in 21 provinces covering a total forest area of 470,970 ha [19]. The FA plans to create 1000 CFs by 2029 with a total land area of 2 million ha [20,21]. Therefore, it would be useful to know where and under which biophysical conditions CFs would best be newly established. As in other counties, there have been some case studies on CF in Cambodia [22,23,24,25], but there have been no county-scale studies on the effectiveness of CF in Cambodia.
The objective of this study was to use a country scale dataset of 197 CF, which were established between 1994 and 2005 across Cambodia, to identify the biophysical factors that affected forest cover changes from 2005 to 2016. A mixed-effects logistic regression model was adopted for a total of 71,252 randomly sampled data pixels nested in the 197 CF. Due to limited data availability, this study focused on biophysical factors although it may be best also to consider other socio-economic and institutional factors to affect forest cover changes. For example, Pagdee et al. [11] identified nine factors as important to the success of CF, summarized from 31 articles reviewed in the meta-analysis, and the Cambodian REDD+ project found 10 underlying factors of deforestation and forest degradation [26]. The biophysical factors are just one among the 9 or 10 factors. Nevertheless, biophysical factors are of considerable importance as found by Agrawal and Chhatre [13], especially when considering the establishment of new CF within a country.
2. Materials and Methods
2.1. Study Area
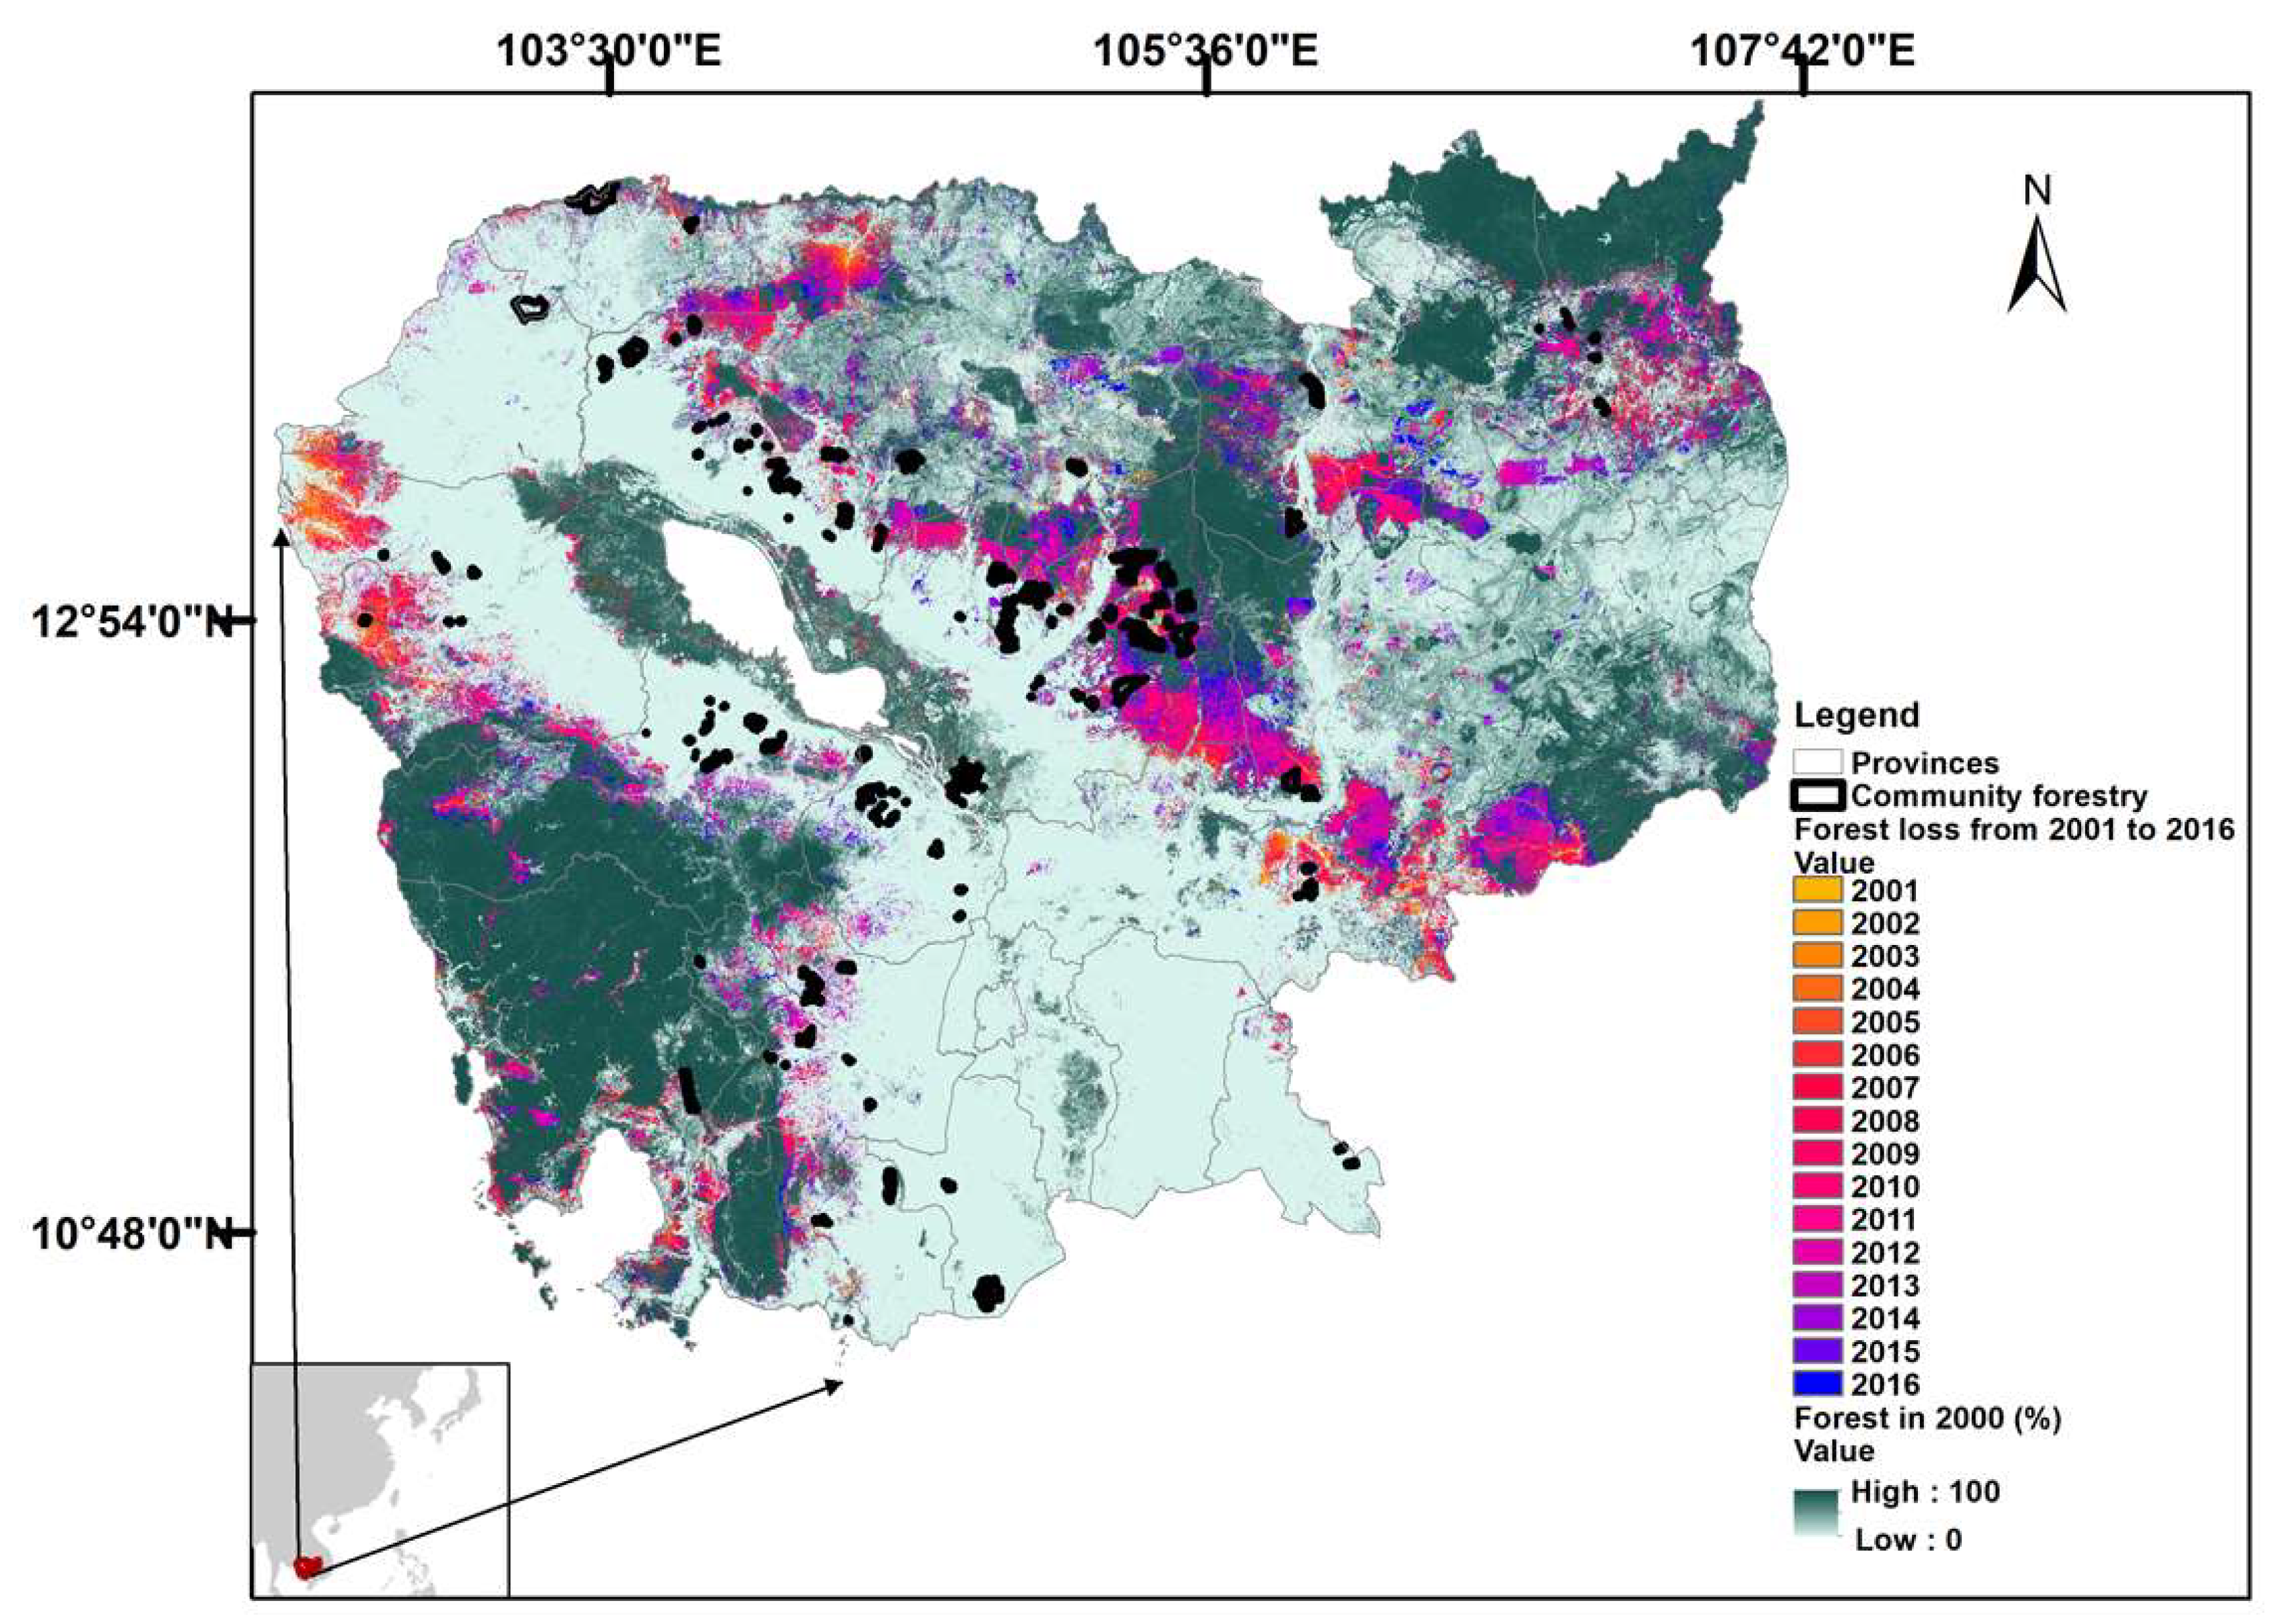
After checking the available data for CF in the whole of Cambodia which were recorded by the FA, we found missing information for some CF regarding the year of establishment and the village names involved in that CF. As a result, only 197 CF in 19 provinces (Figure 1), which were established between 1994 and 2005, were selected for our study. The forest change was analyzed between 2005 and 2016 to see the impact of CF since its establishment. The selected CF were located mainly to the north and south of Tonle Sap Lake with average elevations between 0 m and 589 m above sea level and slopes between 0% and 43%. Annual rainfall in the area was between 1000 mm and 2600 mm [27,28]. The main forest types were semi-evergreen, evergreen and deciduous forests, and the condition of the forests in CF were generally degraded but being restored and regenerated [29]. The major tree species include Beng (Afzelia xylocarpa (Kurz) Craib.), Thnong (Pterocarpus pedatus Pierre), Kokoh (Sindora cochinchinensis H. Baill), Phcheuk (Shorea obtusa Wallich ex Blume), Sokram (Xylia dolabriformis Benth.), Tbaeng (Dipterocarpus obtusifolius Teijsm. ex Miq.) [29].
2.2. Data
Forest data were obtained from the global forest change map 2000–2016 created by Hansen et al. [30] and Hansen [31] including tree canopy cover (%) in 2000 and information on forest-loss or no forest-loss from 2001 to 2016 for each pixel with 30 m × 30 m resolution. In this study, we defined forest as a pixel with at least 30% tree canopy cover, as in Davis et al. [32]. We estimated forest or non-forest for each pixel in 2005 and 2016. We defined a pixel as “deforestation (forest loss)” when the pixel changed from forest in 2005 to non-forest in 2016 and “no deforestation (no forest loss)” when the forest pixel in 2005 was also forest in 2016.
Statistical data on CF and the location of CF boundaries in GIS files were obtained from the FA. The boundaries of the country, markets (district centers) and villages were obtained from the National Institute of Statistics of the Ministry of Planning of Cambodia from 2008 census map layers and databases [27]. A road network (main roads and sub-roads) was obtained from the Ministry of Public Work and Transport of Cambodia. The elevation and slope were generated from Advanced Spaceborne Thermal Emission and Reflection Radiometer Global Digital Elevation Model (ASTER GDEM).
2.3. Data Analysis
To evaluate the biophysical factors affecting the probability of deforestation, we considered accessibility to forest, forest size, and group size based on the previous studies [11,26]. We used a generalized linear mixed model (GLMM) with a binomial distribution and a logit link function was applied using the ‘glmmML’ software package in the statistical software of R environment for statistical computing [33]. The response variable was whether the forest pixel in 2005 was deforested (1) or not deforested (0) in 2016 (Table 1). The fixed effects were group size (household number) [17], CF size (ha), elevation (m), slope (%) [13,14], distance to road (m), distance to market (district center) (m) [7], and distance to CF boundary (m) (Table 1). The identity (ID) of each CF was considered as a random effect. For the GLMM, we randomly selected 10% of pixels (71,252 pixels) from the total number of pixels with 30 m × 30 m resolution within the 197 CF that were “forest” in 2005. Among the selected 71,252 pixels, 16,536 and 54,716 pixels were deforested (1) and not deforested (0) in 2016, respectively, and these served as the binary dependent variable. We checked multi-collinearity among independent variables and confirmed no collinearity with Variance Inflation Factor (VIF) < 5 [34]. The importance of each independent variable in the full model was tested based on the Akaike’s information criterion (AIC). The delta AIC (∆AIC), which is the difference in the AIC between the best model and the model that excluded a variable from the best model, was calculated to see which variables were more influential (variables with a higher ∆AIC were more influential).
3. Results and Discussion
The GLMM result showed that all the explanatory variables except for group size were significant for explaining the probability of deforestation in the 197 CF that were examined (Table 2). The deforestation probability increased with increasing forest size and distance to road, and with decreasing elevation, slope, and distance to market, village, and CF boundary (Table 2). Among the eight explanatory variables, elevation was most influential, followed by distance to village and CF boundary (Table 3).
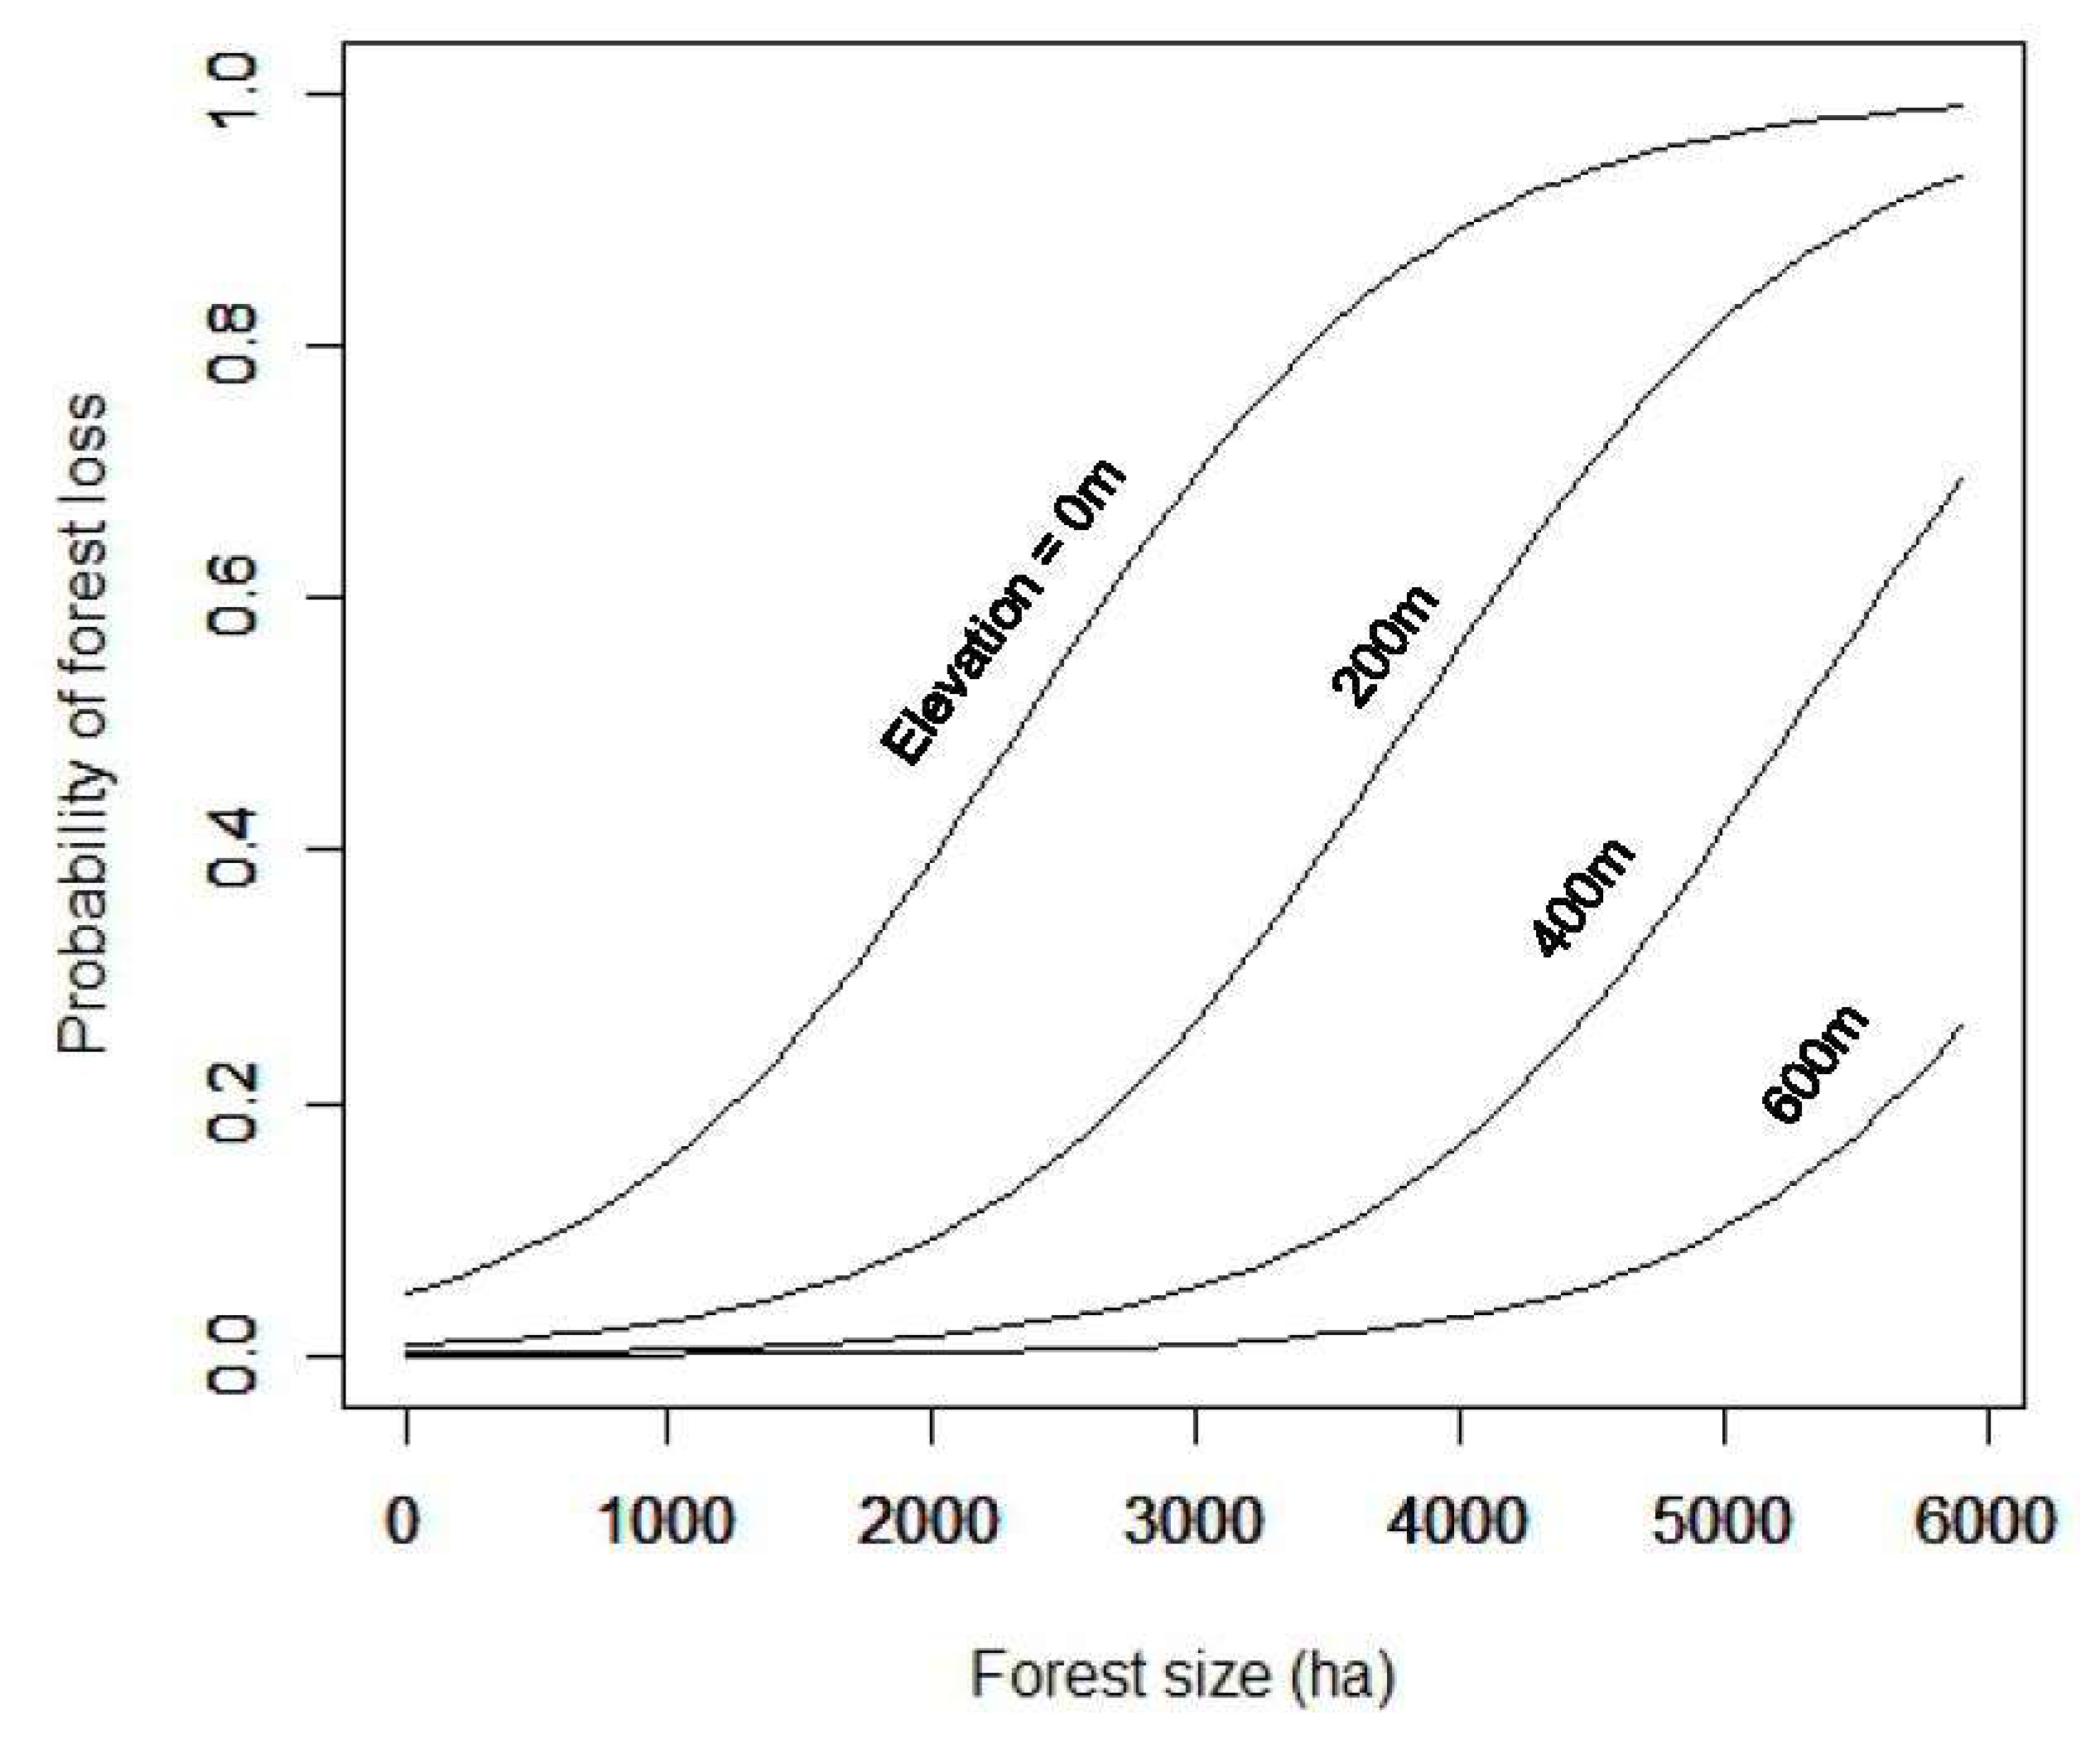
An example of the GLMM prediction is shown in Figure 2, indicating how the deforestation probability increased with greater forest size and lower elevation. A similar effect of forest size on forest cover was also confirmed from meta-analysis using a dataset of 152 forests across nine countries, implying that larger patches of forests are less easy to monitor and control [15]. Judging from Figure 2, it seems that the risk of deforestation steadily becomes higher when forest size is between 2000 and 6000 ha depending on the elevation. In our study, elevation was the most influential factor, based on the ∆AIC values when this variable was omitted (Table 3). Agrawal and Chhatre [13] also emphasized the importance of elevation among 26 variables covering biophysical, economic, demographic, institutional, and socio-political aspects in 95 CF in the Indian Himalaya. It should be noted that although there was a similarity in elevational importance between the two studies, the elevation ranges were quite different: 0 m to 589 m in our study and 400 m to 3450 m in Agrawal and Chhatre [13].
The accessibility of the forest is one known key factor that affects forest condition. For example, Top et al. [35,36] showed that higher population density and shorter distance to villages led to more forest degradation in Cambodia. Popradit et al. [37] indicated forest stocks and biodiversity were reduced with decreasing distance to villages in Thailand. In our study, five variables (elevation, slope, and distance to market, to village, and to CF boundary) were likely to be related to forest accessibility, and these all were negatively related to the probability of deforestation. This confirms that more accessible areas were more susceptible to deforestation (Table 2). In contrast, distance to road was positively related: the nearer the road, the less was the probability of deforestation. Similar results have been found in other studies (e.g., Agrawal and Chhatre [13]; Htun et al. [38]). We suggest that the distance from roads can be a proxy also for the distance from government offices, and an official presence acts as a disincentive to deforestation [13]. The proximity to road might also enable people to out-migration for other employment so that forest dependency is less [39].
Researchers are increasingly paying attention to the effects of group size on collective action and resource outcomes. Researchers debate whether the group-size effect is linear, positive, negative, curvilinear, or non-significant [17]. In our study, group size was the only non-significant factor (Table 2), but the reason for this was not clear. As Chhatre and Agrawal [15] suggested, instead of the absolute number of group users, it may be more important to investigate the nature of demands on a forest to identify how use and dependence are related to changes in forest condition. Our study only focused on biophysical factors due to shortage of data related to variables such as socio-economic and institutional factors. Those studying collective action have pointed out the importance of local enforcement [15], rulemaking participation [16], and leadership [40]. Thus, it would be attractive if further research can use large-N data covering not only biophysical factors but also other factors within a single country.
Over the past two decades, the numbers of CF have steadily increased in Cambodia, and the government plans to double the number and area of CF in the coming decade. Such a new establishment plan calls for quantitative information on the contribution of biophysical conditions to the success of CF. Our study used a country-wide dataset of CF in Cambodia to identify biophysical factors affecting forest cover changes through statistical modelling. Our findings were compatible with interpretations from the previous case studies and meta-analyses using data from different countries. We recommend for land use planning decisions of the government that new CF should be established with smaller size if it is located at lower elevation on gentle slope. For example, CF size should be smaller than 2000 ha if CF is established at elevation lower than 200 m (Figure 2). CF should be also located far away from the market and villages. In addition to the biophysical factors, the government should consider other important factors to the success of CF such as tenure security, clear ownership, effective enforcement, monitoring, equitable benefit sharing, sanctioning, and strong leadership [11,41].
4. Conclusions
Using a country-wide large-N dataset of CF in Cambodia, we conclude that deforestation risk in CF increased for larger CF in locations with easier accessibility (lower elevation, gentle slope, and shorter distance from village, market, and CF boundary). It can be suggested that at least the government should not establish new large CF of more than 2000 ha at low elevation. In addition, monitoring and patrol activities should not be done only from the main roads because the probability of deforestation in CF is higher further away from roads.
Author Contributions
P.L., N.M., and T.O. performed the analysis. All authors (P.L., N.M., T.O., T.K., and S.Y.) contributed to the writing of the paper.
Funding
This study was supported by grants from JST-RISTEX for Future Earth and JSPS KAKENHI [grant number 17H01477]
Acknowledgments
We would like to thank the Ministry of Education, Culture, Sports, Science and Technology (MEXT) of Japan that provided the scholarship for Lonn Pichdara. We also thank the staff of the Forestry Administration of Cambodia based in the provinces and in Phnom Penh, and the staff of RECOFTC (The Center for People and Forests) in Phnom Penh and the provinces, local authorities, CF members and all the communities that cooperated with and supported this study. We thank Leonie Seabrook, from Edanz Group (www.edanzediting.com/ac) for editing a draft of this manuscript.
Conflicts of Interest
The authors declare no conflict of interest.
References
- Agrawal, A. Forests, Governance, and Sustainability: Common Property Theory and its Contributions. Int. J. Commons 2007, 1, 111–136. [Google Scholar] [CrossRef]
- Bixler, R.P. From community forest management to polycentric governance: Assessing evidence from the bottom up. Soc. Nat. Resour. 2014, 27, 155–169. [Google Scholar] [CrossRef]
- Pokharel, B.K.; Branney, P.; Nurse, M.; Malla, Y.B. Community forestry: Conserving forests, sustaining livelihoods and strengthening democracy. J. For. Livelihood 2007, 6, 8–19. [Google Scholar]
- Bowler, D.E.; Buyung-Ali, L.M.; Healey, J.R.; Jones, J.P.G.; Knight, T.M.; Pullin, A.S. Does community forest management provide global environmental benefits and improve local welfare? Front. Ecol. Environ. 2012, 10, 29–36. [Google Scholar] [CrossRef]
- Newton, P.; Schaap, B.; Fournier, M.; Cornwall, M.; Rosenbach, D.W.; DeBoer, J.; Whittemore, J.; Stock, R.; Yoders, M.; Brodnig, G.; et al. Community forest management and REDD+. For. Policy Econ. 2015, 56, 27–37. [Google Scholar] [CrossRef]
- Maraseni, T.N. Selection of Non-timber Forest Species for Community and Private Plantations in the High and Low Altitude Areas of Makawanpur District, Nepal. Small-Scale For. 2008, 7, 151–161. [Google Scholar] [CrossRef] [Green Version]
- Ellis, E.A.; Porter-Bolland, L. Is community-based forest management more effective than protected areas?: A comparison of land use/land cover change in two neighboring study areas of the Central Yucatan Peninsula, Mexico. For. Ecol. Manag. 2008, 256, 1971–1983. [Google Scholar] [CrossRef]
- Porter-Bolland, L.; Ellis, E.A.; Guariguata, M.R.; Ruiz-Mallén, I.; Negrete-Yankelevich, S.; Reyes-García, V. Community managed forests and forest protected areas: An assessment of their conservation effectiveness across the tropics. For. Ecol. Manag. 2012, 268, 6–17. [Google Scholar] [CrossRef]
- Pandey, S.S.; Maraseni, T.N.; Reardon-Smith, K.; Cockfield, G. Analysing foregone costs of communities and carbon benefits in small scale community based forestry practice in Nepal. Land Use Policy 2017, 69, 160–166. [Google Scholar] [CrossRef]
- Pandey, S.S.; Cockfield, G.; Maraseni, T.N. Assessing the roles of community forestry in climate change mitigation and adaptation: A case study from Nepal. For. Ecol. Manag. 2016, 360, 400–407. [Google Scholar] [CrossRef]
- Pagdee, A.; Kim, Y.; Daugherty, P.J. What makes community forest management successful: A meta-study from community forests throughout the world. Soc. Nat. Resour. 2006, 19, 33–52. [Google Scholar] [CrossRef]
- Baynes, J.; Herbohn, J.; Smith, C.; Fisher, R.; Bray, D. Key factors which influence the success of community forestry in developing countries. Glob. Environ. Chang. 2015, 35, 226–238. [Google Scholar] [CrossRef]
- Agrawal, A.; Chhatre, A. Explaining success on the commons: Community forest governance in the Indian Himalaya. World Dev. 2006, 34, 149–166. [Google Scholar] [CrossRef]
- Nagendra, H. Drivers of reforestation in human-dominated forests. Proc. Natl. Acad. Sci. USA 2007, 104, 15218–15223. [Google Scholar] [CrossRef] [PubMed]
- Chhatre, A.; Agrawal, A. Forest commons and local enforcement. Proc. Natl. Acad. Sci. USA 2008, 105, 13286–13291. [Google Scholar] [CrossRef] [PubMed]
- Persha, L.; Agrawal, A.; Chhatre, A. Social and ecological synergy: Local rulemaking, forest livelihoods, and biodiversity conservation. Science 2011, 331, 1606–1608. [Google Scholar] [CrossRef] [PubMed]
- Yang, W.; Liu, W.; Vina, A.; Tuanmu, M.N.; He, G.; Dietz, T.; Liu, J. Nonlinear effects of group size on collective action and resource outcomes. Proc. Natl. Acad. Sci. USA 2013, 110, 10916–10921. [Google Scholar] [CrossRef] [PubMed]
- Chhatre, A.; Agrawal, A. Trade-offs and synergies between carbon storage and livelihood benefits from forest commons. Proc. Natl. Acad. Sci. USA 2009, 106, 17667–17670. [Google Scholar] [CrossRef] [PubMed]
- Forestry Administration. Statistics of Community Forestry 2017; Forestry Administration: Phnom Penh, Cambodia, 2017.
- Ministry of Agriculture Forestry and Fishery (MAFF). National Forest Program 2010–2029; MAFF: Phnom Penh, Cambodia, 2010.
- Forestry Administration. Statistics of Community Forestry 2015; Forestry Administration: Phnom Penh, Cambodia, 2015.
- Sokh, H.; Iida, S. Community forestry models in Southeast Asia and Cambodia: A comparative study. J. Faculty Agric.-Kyushu Univ. Jpn. 2001, 46, 113–121. [Google Scholar]
- Sunderlin, W.D. Poverty alleviation through community forestry in Cambodia, Laos, and Vietnam: An assessment of the potential. For. Policy Econ. 2006, 8, 386–396. [Google Scholar] [CrossRef]
- Lambrick, F.H.; Brown, N.D.; Lawrence, A.; Bebber, D.P. Effectiveness of community forestry in prey long forest, Cambodia. Conserv. Biol. 2014, 28, 372–381. [Google Scholar] [CrossRef] [PubMed]
- Persson, J.; Prowse, M. Collective action on forest governance: An institutional analysis of the Cambodian community forest system. For. Policy Econ. 2017, 83, 70–79. [Google Scholar] [CrossRef]
- Nguon, P.; Kulakowski, D. Natural forest disturbances and the design of REDD+ initiatives. Environ. Sci. Policy 2013, 33, 332–345. [Google Scholar] [CrossRef]
- National Institute of Statistics (NIS). 2008 Census Map Layers and Databases; National Institute of Statistics: Phnom Penh, Cambodia, 2010.
- National Institute of Statistics (NIS). Statistical Year Book 2011; National Institute of Statistics: Phnom Penh, Cambodia, 2012.
- Forestry Administration. Statistics of Community Forestry 2010; Forestry Administration: Phnom Penh, Cambodia, 2010.
- Hansen, M.C.; Potapov, P.V.; Moore, R.; Hancher, M.; Turubanova, S.A.; Tyukavina, A.; Thau, D.; Stehman, S.V.; Goetz, S.J.; Loveland, T.R.; et al. High-resolution global maps of 21st-century forest cover change. Science 2013, 342, 850–853. [Google Scholar] [CrossRef] [PubMed]
- Hansen, M.C. Global Forest Change. 2018. Available online: https://earthenginepartners.appspot.com/science-2013-global-forest/download_v1.4.html (accessed on 20 April 2018).
- Davis, K.F.; Yu, K.; Rulli, M.C.; Pichdara, L.; D’Odorico, P. Accelerated deforestation driven by large-scale land acquisitions in Cambodia. Nat. Geosci. 2015, 8, 772–775. [Google Scholar] [CrossRef]
- R Core Team. A Language and Environment for Statistical Computing; R Foundation for Statistical Computing: Vienna, Austria, 2017. [Google Scholar]
- Fox, J.; Weisberg, S.; Price, B.; Adler, D.; Bates, D.; Baud-Bovy, G.; Bolker, B.; Ellison, S.; Firth, D.; Friendly, M.; et al. Package ‘Car’; R Foundation for Statistical Computing: Vienna, Austria, 2018; Available online: https://cran.r-project.org/web/packages/car/car.pdf (accessed on 15 May 2018).
- Top, N.; Mizoue, N.; Kai, S.; Nakao, T. Variation in woodfuel consumption patterns in response to forest availability in Kampong Thom Province, Cambodia. Biomass Bioenergy 2004, 27, 57–68. [Google Scholar] [CrossRef]
- Top, N.; Mizoue, N.; Ito, S.; Kai, S.; Nakao, T.; Ty, S. Effects of population density on forest structure and species richness and diversity of trees in Kampong Thom Province, Cambodia. Biodivers. Conserv. 2009, 18, 717–738. [Google Scholar] [CrossRef]
- Popradit, A.; Srisatit, T.; Kiratiprayoon, S.; Yoshimura, J.; Ishida, A.; Shiyomi, M.; Murayama, T.; Chantaranothai, P.; Outtaranakorn, S.; Phromma, I. Anthropogenic effects on a tropical forest according to the distance from human settlements. Sci. Rep. 2015, 5, 14689. [Google Scholar] [CrossRef] [PubMed] [Green Version]
- Htun, N.Z.; Mizoue, N.; Yoshida, S. Changes in determinants of deforestation and forest degradation in Popa Mountain Park, Central Myanmar. Environ. Manag. 2013, 51, 423–434. [Google Scholar] [CrossRef] [PubMed]
- Barbieri, A.F.; Carr, D.L. Gender-specific out-migration, deforestation and urbanization in the Ecuadorian Amazon. Glob. Planet. Chang. 2005, 47, 99–110. [Google Scholar] [CrossRef] [PubMed]
- Gutierrez, N.L.; Hilborn, R.; Defeo, O. Leadership, social capital and incentives promote successful fisheries. Nature 2011, 470, 386–389. [Google Scholar] [CrossRef] [PubMed]
- Ostrom, E. A diagnostic approach for going beyond panaceas. Proc. Natl. Acad. Sci. USA 2007, 104, 15181–15187. [Google Scholar] [CrossRef] [PubMed]
Figure 1.
Location of 197 selected community forests (CF), forest cover in 2000 and forest loss between 2001 and 2016 using data created by Hansen et al. [30] and Hansen [31].

Figure 2.
Effect of forest size and elevation on probability of forest loss. For this GLMM predictions, the median values were used for explanatory valuables except for forest size and elevation.
Figure 2.
Effect of forest size and elevation on probability of forest loss. For this GLMM predictions, the median values were used for explanatory valuables except for forest size and elevation.


Table 1.
Characteristics of the response and explanatory variables used for the generalized linear mixed model (GLMM).
Table 1.
Characteristics of the response and explanatory variables used for the generalized linear mixed model (GLMM).
| Variables | Unit | Mean | Median | Min. | Max. |
|---|---|---|---|---|---|
| Objective variable | |||||
| Forest loss (1) | Binary (0,1) | ||||
| No forest loss (0) | |||||
| Explanatory variables | |||||
| Group size | Number of households | 334.3 | 219.0 | 30.0 | 1663.0 |
| Forest size | ha | 1995.3 | 1395.1 | 7.0 | 6112.8 |
| Elevation | m | 88.5 | 73.0 | 0.0 | 589.0 |
| Slope | % | 4.1 | 3.0 | 0.0 | 43.0 |
| Distance to road | m | 4645.6 | 3679.2 | 0.1 | 17,512.6 |
| Distance to market | m | 20,024.5 | 17,734.0 | 1449.5 | 45,340.5 |
| Distance to village | m | 4480.6 | 3898.8 | 34.1 | 12,786.8 |
| Distance to CF boundary | m | 524.2 | 417.3 | 0.0 | 3150.7 |
Table 2.
The estimates of the generalized linear mixed model (GLMM) 1 explaining the probability of deforestation.
Table 2.
The estimates of the generalized linear mixed model (GLMM) 1 explaining the probability of deforestation.
| Coefficients | Estimate | Std. Error | z Value | Pr (>|z|) |
|---|---|---|---|---|
| (Intercept) | −2.718 | 0.3070 | −8.855 | <0.0001 |
| Group size (households) | −0.0008990 | 0.0007648 | −1.175 | 0.240 |
| Forest size (ha) | 0.001270 | 0.0002036 | 6.241 | <0.0001 |
| Elevation (m) | −0.009288 | 0.0003745 | −24.802 | <0.0001 |
| Slope (%) | −0.01822 | 0.003951 | −4.61 | <0.0001 |
| Distance to road (m) | 0.00008554 | 0.00001012 | 8.456 | <0.0001 |
| Distance to market (m) | −0.00002074 | 0.000006543 | −3.17 | 0.002 |
| Distance to village (m) | −0.0001739 | 0.00001013 | −17.167 | <0.0001 |
| Distance to CF boundary (m) | −0.0003640 | 0.00002883 | −12.626 | <0.0001 |
1 The scale parameter in the mixing distribution and its standard error were 2.268 and 0.1255, respectively.
Table 3.
The estimated delta Akaike’s information criterion (△AIC) values showing the relative importance of the variables.
Table 3.
The estimated delta Akaike’s information criterion (△AIC) values showing the relative importance of the variables.
| Models | Number of Variables | AIC | △AIC 2 | |||||||
|---|---|---|---|---|---|---|---|---|---|---|
| S.Group | S.Forest | Elevation | Slope | D.road | D.market | D.village | D.boundary | 8 | 46,920 | 0 |
| S.Forest | Elevation | Slope | D.road | D.market | D.village | D.boundary | 7 | 46,920 | 0 | |
| S.Group | Elevation | Slope | D.road | D.market | D.village | D.boundary | 7 | 46,950 | 30 | |
| S.Group | S.Forest | Slope | D.road | D.market | D.village | D.boundary | 7 | 47,590 | 670 | |
| S.Group | S.Forest | Elevation | D.road | D.market | D.village | D.boundary | 7 | 46,940 | 20 | |
| S.Group | S.Forest | Elevation | Slope | D.market | D.village | D.boundary | 7 | 46,990 | 70 | |
| S.Group | S.Forest | Elevation | Slope | D.road | D.village | D.boundary | 7 | 46,930 | 10 | |
| S.Group | S.Forest | Elevation | Slope | D.road | D.market | D.boundary | 7 | 47,210 | 290 | |
| S.Group | S.Forest | Elevation | Slope | D.road | D.market | D.village | 7 | 47,080 | 160 | |
2 △AIC was calculated by subtracting the AIC values between the full model using eight variables and the other models. S.group = group size; S.forest = forest size; D.road = distance to road; D.market = distance to market; D.village = distance to village; and C.boundary = distance to CF boundary.
© 2018 by the authors. Licensee MDPI, Basel, Switzerland. This article is an open access article distributed under the terms and conditions of the Creative Commons Attribution (CC BY) license (http://creativecommons.org/licenses/by/4.0/).
Share and Cite
MDPI and ACS Style
Lonn, P.; Mizoue, N.; Ota, T.; Kajisa, T.; Yoshida, S. Biophysical Factors Affecting Forest Cover Changes in Community Forestry: A Country Scale Analysis in Cambodia. Forests 2018, 9, 273. https://doi.org/10.3390/f9050273
AMA Style
Lonn P, Mizoue N, Ota T, Kajisa T, Yoshida S. Biophysical Factors Affecting Forest Cover Changes in Community Forestry: A Country Scale Analysis in Cambodia. Forests. 2018; 9(5):273. https://doi.org/10.3390/f9050273
Chicago/Turabian StyleLonn, Pichdara, Nobuya Mizoue, Tetsuji Ota, Tsuyoshi Kajisa, and Shigejiro Yoshida. 2018. "Biophysical Factors Affecting Forest Cover Changes in Community Forestry: A Country Scale Analysis in Cambodia" Forests 9, no. 5: 273. https://doi.org/10.3390/f9050273
Note that from the first issue of 2016, this journal uses article numbers instead of page numbers. See further details here.