Detection of Annual Spruce Budworm Defoliation and Severity Classification Using Landsat Imagery


1
School of Forest Resources, University of Maine, 5755 Nutting Hall, Orono, ME 04469, USA
2
Department of Biological Sciences, University of Quebec in Montreal, Montreal, QC H3C 3P8, Canada
3
Faculty of Forestry and Environmental Management, University of New Brunswick, Fredericton, NB E3B 5A3, Canada
*
Author to whom correspondence should be addressed.
Forests 2018, 9(6), 357; https://doi.org/10.3390/f9060357
Submission received: 10 May 2018
/
Revised: 9 June 2018
/
Accepted: 12 June 2018
/
Published: 14 June 2018
(This article belongs to the Special Issue Protection Strategy against Spruce Budworm)
Abstract
:Spruce budworm (SBW) is the most destructive forest pest in eastern forests of North America. Mapping annual current-year SBW defoliation is challenging because of the large landscape scale of infestations, high temporal/spatial variability, and the short period of time when detection is possible. We used Landsat-5 and Landsat-MSS data to develop a method to detect and map SBW defoliation, which can be used as ancillary or alternative information for aerial sketch maps (ASMs). Results indicated that Landsat-5 data were capable of detecting and classifying SBW defoliation into three levels comparable to ASMs. For SBW defoliation classification, a combination of three vegetation indices, including normalized difference moisture index (NDMI), enhanced vegetation index (EVI), and normalized difference vegetation index (NDVI), were found to provide the highest accuracy (non-defoliated: 77%, light defoliation: 60%, moderate defoliation: 52%, and severe defoliation: 77%) compared to using only NDMI (non-defoliated: 76%, light defoliation: 40%, moderate defoliation: 43%, and severe defoliation: 67%). Detection of historical SBW defoliation was possible using Landsat-MSS NDVI data, and the produced maps were used to complement coarse-resolution aerial sketch maps of the past outbreak. The method developed for Landsat-5 data can be used for current SBW outbreak mapping in North America using Landsat-8 and Sentinel-2 imagery. Overall, the work highlights the potential of moderate resolution optical remote sensing data to detect and classify fine-scale patterns in tree defoliation.
1. Introduction
Northeastern forests of the United States and Canada provide numerous products and services for human livelihood, wildlife, and the environment, including timber, fiber products, firewood, wildlife habitat, watershed protection, carbon storage, and recreation. Northeastern forests have been subjected to several biotic and abiotic stressors. Biotic stressors like the outbreak of pests and pathogens—in particular, spruce budworm (Choristoneura fumiferana Clem.; SBW)—have greatly changed forest structure and composition in recent years. SBW is the most damaging forest pest in Northeastern forests. As outbreaks occur on a regional scale, they modify carbon fluxes, as well as the vitality of the forest products industry and regional economics. The last outbreak in the 1970s in Northeastern forests affected 57 million ha of forests [1,2,3].
Compared to other destructive pests, such as the jack pine budworm (Choristoneura pinus Freeman) or gypsy moth (Lymantria dispar L.), SBW has longer cyclical and more synchronous outbreaks, occurring at somewhat regular 30–40 year intervals over large areas. SBW outbreak duration is typically 10 years or longer, resulting in widespread tree mortality and a loss of productivity in balsam fir (Abies balsamea (L.) Mill.) and spruce (Picea spp.) [4,5,6]. The current SBW outbreak started in 2006 in Quebec, and by the summer of 2017 had defoliated over 7.1 million ha of the province [7]. The first defoliation in northern New Brunswick (NB) was detected in 2015. Currently, the outbreak is expected to affect Maine (ME) in the near future, with about 2.3 million ha of spruce–fir stands being at risk of SBW defoliation [8].
Accurate estimation of annual SBW defoliation extent and severity mapping at the landscape scale is of high interest for SBW risk prediction, better estimation of economic impacts of the outbreak, quantifying wood supply losses and changes in wildlife habitats, and management decisions for forestry practices in order to mitigate the impacts of the infestation. The primary management response is use of biological insecticide Bacillus thuringiensis var. kurstaki to reduce defoliation and keep trees alive—or, in early intervention attempts, to prevent outbreaks or reduce severity. However, mapping SBW annual defoliation is challenging, due to the short period of optimum visual observation of the damage (red partially-consumed foliage is only visible from the air for about 2–3 weeks, before these reddened needles fall); high year-to-year variation in bud flush timing for balsam fir and spruce, and in turn for defoliation; and the vast geographical extent of defoliation [1]. Current landscape mapping of annual SBW defoliation is mainly based on aerial sketch maps (ASMs), also known as insect and disease surveys (IDS) in the United States. In general, aerial mapping of defoliation is time-consuming, costly, and requires skilled observers; in addition, its overall accuracy varies depending on differences in mapping techniques used in Canada or the United States, which can range from rather fine to coarse spatial resolution [1,9]. The accuracy of ASMs has been quantified in NB, indicating reasonably good accuracy for higher levels of defoliation, but generally lower accuracy in discriminating nil (0–10%) from light (11–30%) defoliation classes [1,10].
SBW defoliation that is of interest to forest management can be evaluated in two different categories: current-year (annual) defoliation and cumulative defoliation. SBW strongly prefers to feed on the new (current-year) foliage age class, but multiple years of feeding results in cumulative removal of all age classes of foliage on balsam fir and spruce trees. Current-year defoliation is quantified as the percentage of the current foliage age class that is removed and is correlated with the reddish discoloration of foliage that provides information on the location and severity of defoliation and distribution of budworm populations in any year. When SBW larvae feed, needles are severed and become entangled with silken threads and frass, later drying out to present a reddish-brown color. Since this phenomenon lasts for only 2–3 weeks, surveys to assess the level of current defoliation must be conducted during this period [1], before the dried foliage is lost. This type of information is normally provided through ASMs [11]. Cumulative defoliation is quantified as the percentage of all foliage on the tree that is removed by successive years of SBW feeding [12]. Cumulative defoliation can be assessed using binocular estimation of individual tree crowns [13], or by summing current annual defoliation over multiple years [14]. Cumulative defoliation information has value as a model input to predict growth reduction and mortality, but current defoliation is what is used in both decision support system (DSS) and protection planning.
Airborne and space-borne optical remote sensing (RS) sensors have been explored in various research in the past for detecting and quantifying insect-induced forest defoliation and mortality, as well as for forecasting future outbreak patterns [11,15,16]. Among them, multi-spectral satellite data, such as Land Remote Sensing Satellite (Landsat), Satellite Pour l’Observation de la Terre (SPOT), Moderate resolution Imaging Spectroradiometer (MODIS), and Sentinel-2 have been used to detect and characterize defoliators like gypsy moth [17,18,19,20], forest tent caterpillar (Malacosoma disstria) [21], jack pine budworm [22,23], hemlock looper (Lambdina fiscellaria (Guenée)) [24], pine-tree lappet (Dendrolimus pini L.) [25], and SBW [6,12,26,27,28]. Compared to other defoliators, remote sensing research on SBW defoliation is less available, and previous attempts to detect and quantify SBW defoliation have been primarily focused on cumulative defoliation [26,27,28,29,30,31]. Only a few studies have addressed current-year SBW defoliation detection using airborne or satellite imagery like Landsat and SPOT [12,32,33]; however, these did not use the remotely-sensed vegetation indices that are the focus of this work. Other recent remote sensing technologies, such as hyper-spectral sensors with narrow spectral bands and unmanned aerial vehicles, have the potential for forest pest damage and infestation detection and quantification [31,32,33,34]. However, methods based on these techniques have not yet been used for SBW current-year defoliation assessment in regional or national forest management and planning. Should remote sensing methodologies prove to be operationally feasible, cost-effective, and accurate, there is interest across several jurisdictions to adopt such methods.
Although multi-spectral satellite imagery has the technical capacity to map both current and cumulative SBW defoliation, detection of current-year defoliation can be problematic, because of the short period of time when detection is possible, generally around July, depending on the SBW and host tree phenology. Cloud contamination and the coarse temporal resolution of some satellites such as Landsat normally limit these type of studies. Satellite-derived data on forest defoliation can potentially have several advantages over ASMs. Errors like missed defoliated regions, which can happen during aerial surveys, may be avoided. Furthermore, the quantification of defoliation can be less subjective compared to ASM-derived data, and the operation can be less expensive and laborious. Long-term archives of Landsat data can also support studies that need accurate information about past forest defoliation, as well as damage extent and dynamics. Accurate historical maps and data on defoliation are needed to (1) better understand the behavior of SBW outbreaks; (2) as input for DSS simulation models, such as the SBW-DSS [35]; and (3) to identify risk factors influencing outbreak severity and future outbreak projections [9,36]. Many historical ASMs, such as historical SBW defoliation maps of Maine produced during the last outbreak in 1970s and 1980s, are coarse-resolution and would benefit from the results of this study.
The objectives of this research were to evaluate remote sensing methods for detection and quantification of current-year (annual) SBW defoliation using Landsat imagery. Two different study areas from Northeastern forests with different disturbance regimes, forest composition, and remote sensing data availability were evaluated. The first study area, in Quebec, was used to evaluate a model for the detection of recent annual SBW defoliation extent and severity using Landsat-5 imagery, with the ultimate goal of generating maps similar to ASMs. The research in the second study area, in Maine, focused on the 1970s–1980s SBW outbreak and evaluated the capability of Landsat-MSS data to detect SBW defoliation.
2. Methods
2.1. Study Area in Quebec, Canada
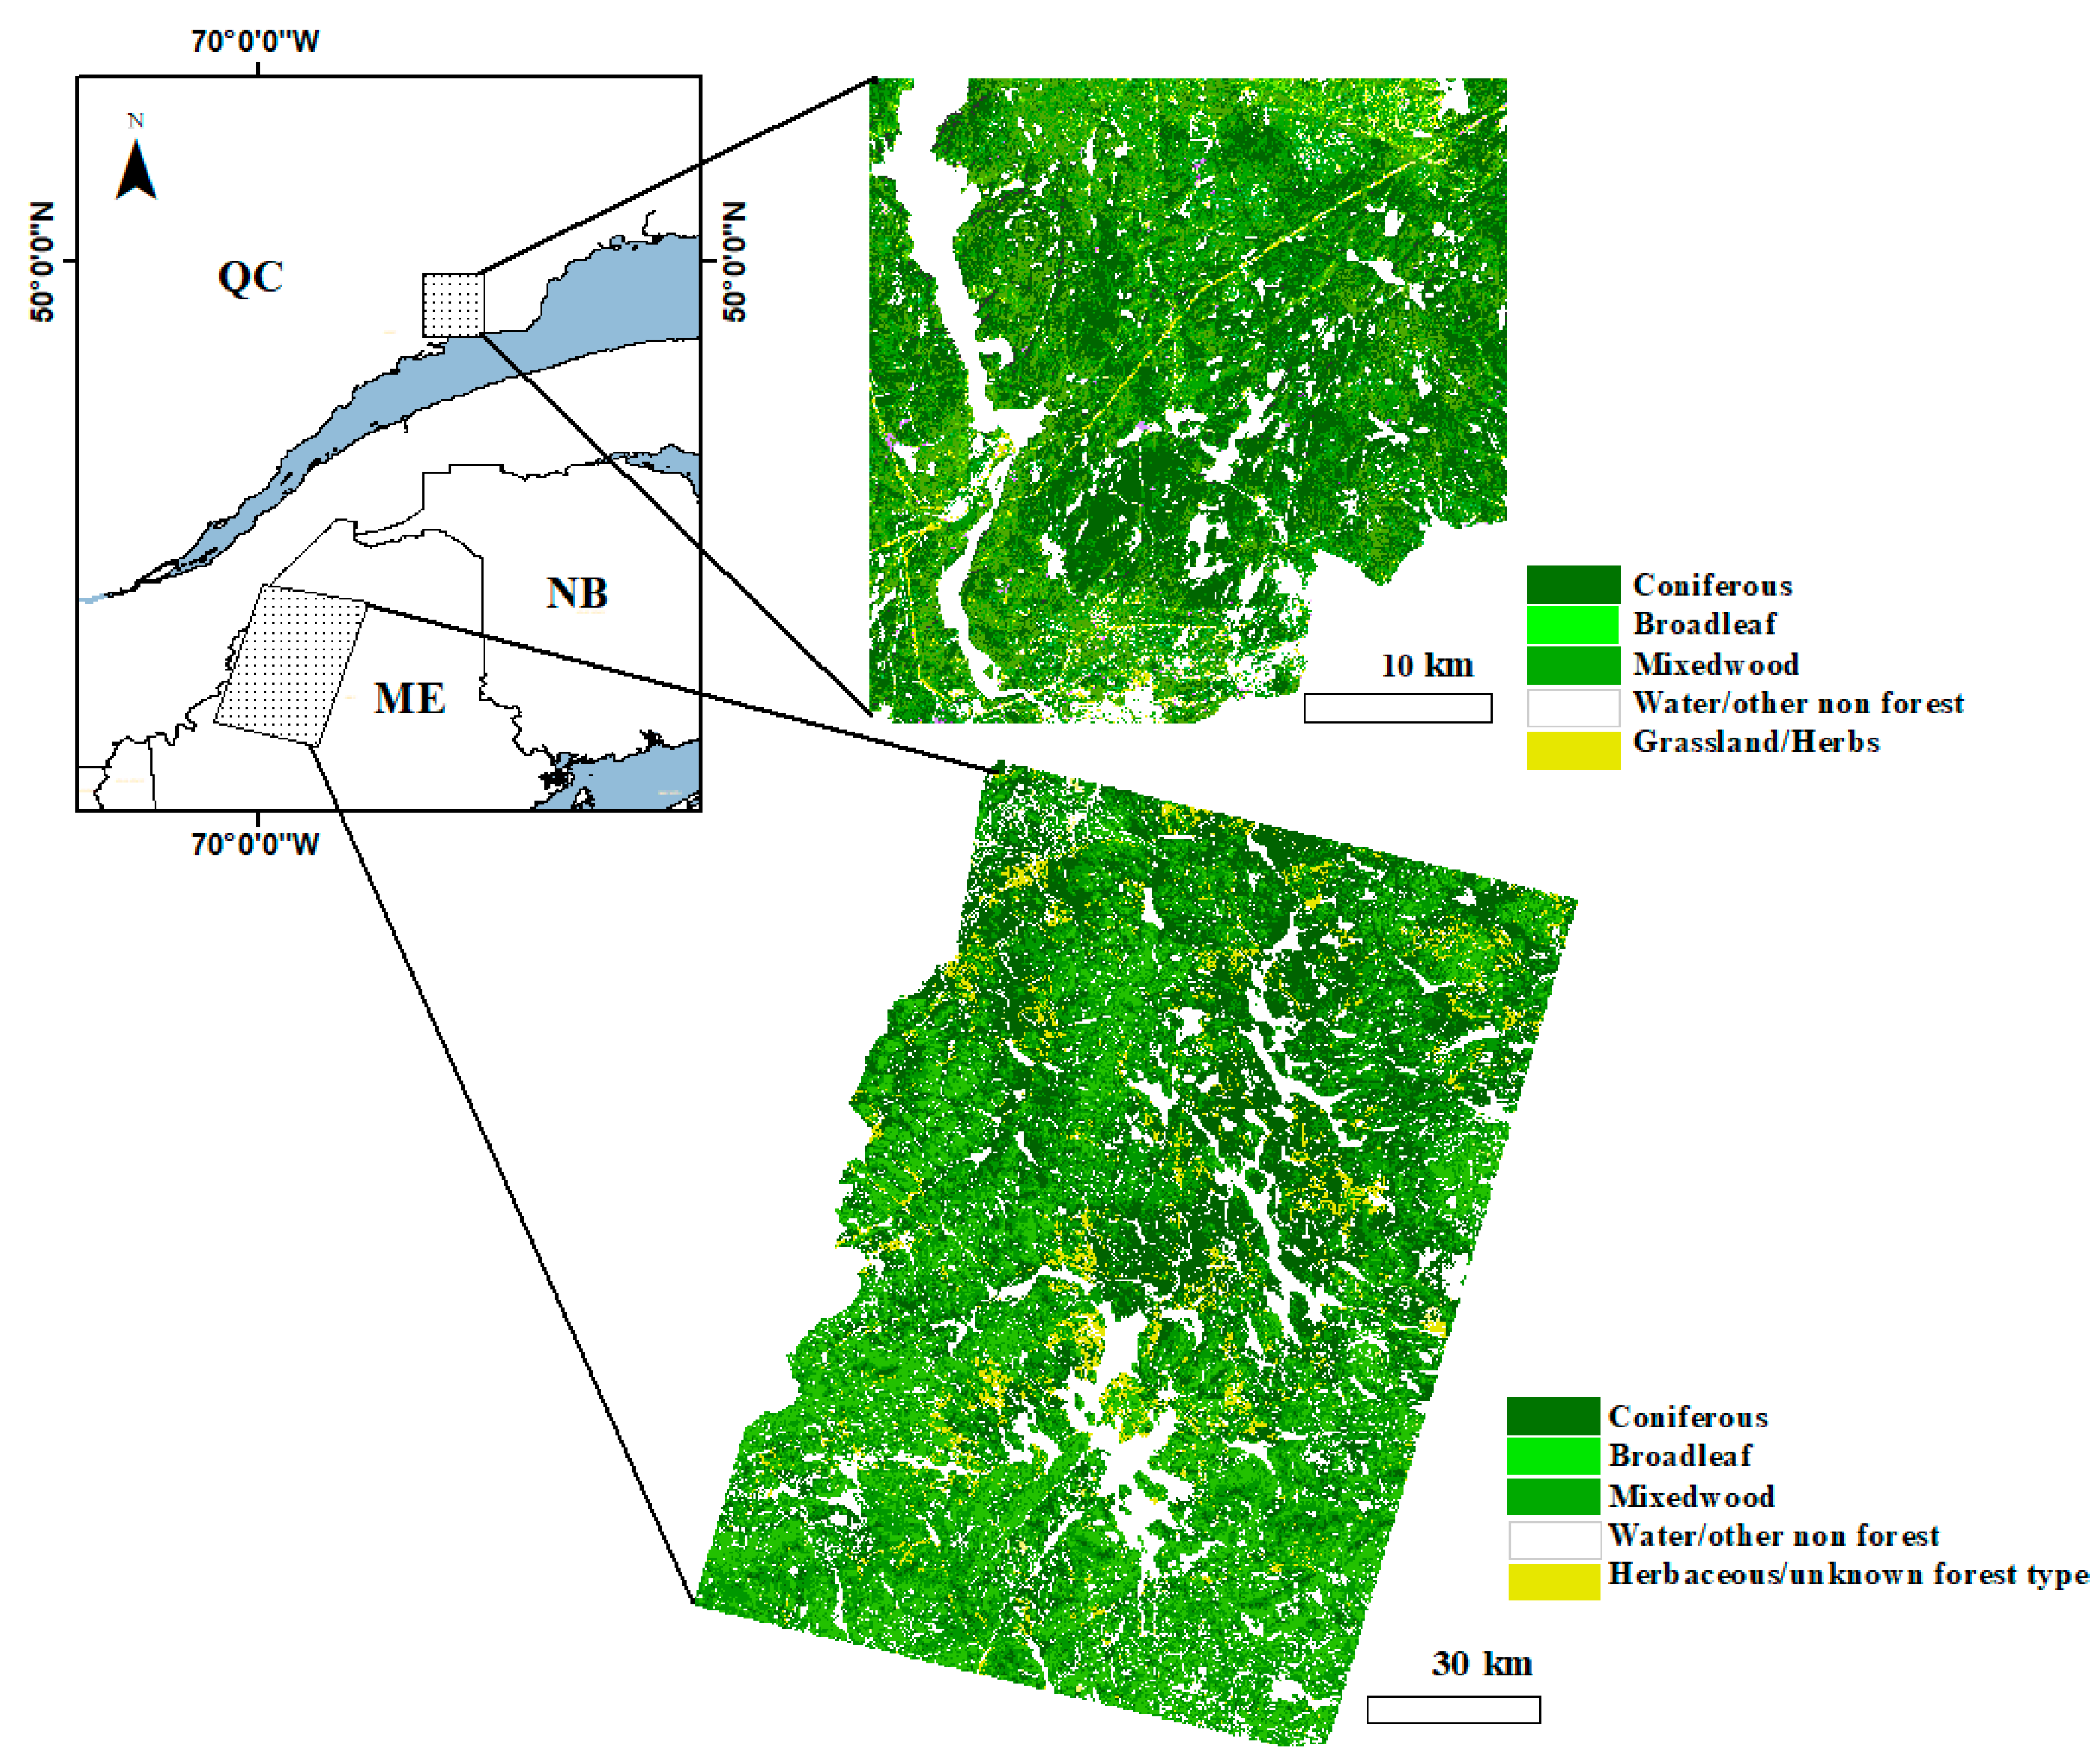
This study area (~35 × 35 km2) was located in Quebec’s North Shore region, where the current SBW outbreak originated in 2006 (Figure 1). Quebec’s North Shore is part of the boreal forest, and the southern portion of the study area is within the balsam fir–white birch (Betula papyrifera Marsh.) domain, while the northern area is part of the black spruce (Picea mariana (Mill.) B.S.P))–moss domain [37]. Our study area was an ecotone between the two domains, where black spruce and balsam fir are the dominant tree species. White spruce (Picea glauca (Moench) Voss), trembling aspen (Populus tremuloides Michx.), jack pine (Pinus banksiana Lamb.), and white birch are also present across the study area. A large portion of the landscape is free from logging activities (unmanaged). In comparison with continental Canada, this region has a lower fire frequency, and thus it is dominated by old-growth forests, along with irregularly shaped patches of younger forests recovering from fire or other severe disturbances [38,39]. The major prominent natural disturbances in the region are periodic SBW defoliation and fire.
2.2. Study Area in Maine, United States
This study area (~100 × 150 km2) was located in the northern part of Maine (Figure 1). This region is part of New England Acadian forests, which are a transition zone between boreal spruce–fir forests to the north and deciduous forests to the south. It is relatively flat, with low mountains and abundant lakes, ponds, and streams. The forest cover type is composed of coniferous species, in particular balsam fir and red spruce, deciduous species of red maple (Acer rubrum L.), sugar maple (Acer saccharum Marshall), yellow birch (Betula alleghaniensis Britton), white birch, American beech (Fagus grandifolia Ehrh.), and mixed stands of coniferous and deciduous trees. Over 90% of the forestlands are privately owned and are of commercial value. Intensive clear-cutting during the SBW outbreak between 1970s and 1980s and SBW-induced defoliation were the major landscape-scale causes of change in the region. Later, in the 1990s, management practices shifted to clear cutting with protection of advance regeneration [40]. The last outbreak in Maine was particularly severe. Forest conditions in Maine have changed considerably as a result of SBW-induced spruce–fir stand mortality, which killed between 72.5 and 90.6 million m3 of fir [41], and intensive salvage logging.
2.3. Satellite Data Acquisition and Pre-Processing
For the study area in Quebec, the Landsat-5 Thematic Mapper (TM) atmospherically corrected images of surface reflectance, and spectral indices products with 30 m spatial resolution were obtained from the United States Geological Survey (USGS) for study years 2004, 2005, 2008, and 2009 (Table 1). Although defoliation had been detected since 2006 in the study area, the full range of all defoliation severity levels were better observed from 2008 on. Landsat-8 images available since 2013 were too cloudy in the study area to be used. Landsat-7 data also suffered from striping problems and could not be used. Image selection was based on using multiple-year data that compared healthy forest conditions with no defoliation as the base years, versus defoliated years. For healthy years (i.e., before the outbreak), two cloud-free images for 2004 and 2005 during the summer were selected. To minimize the effect of phenology and dry/wet years on vegetation vigor, vegetation indices values of 2004 and 2005 were averaged and used as the base-year vegetation index values. Data for a specific period of time in early to late July were needed to map forest foliage discoloration (red-brown) similar to ASMs; this makes obtaining cloud-free imagery challenging in this region.
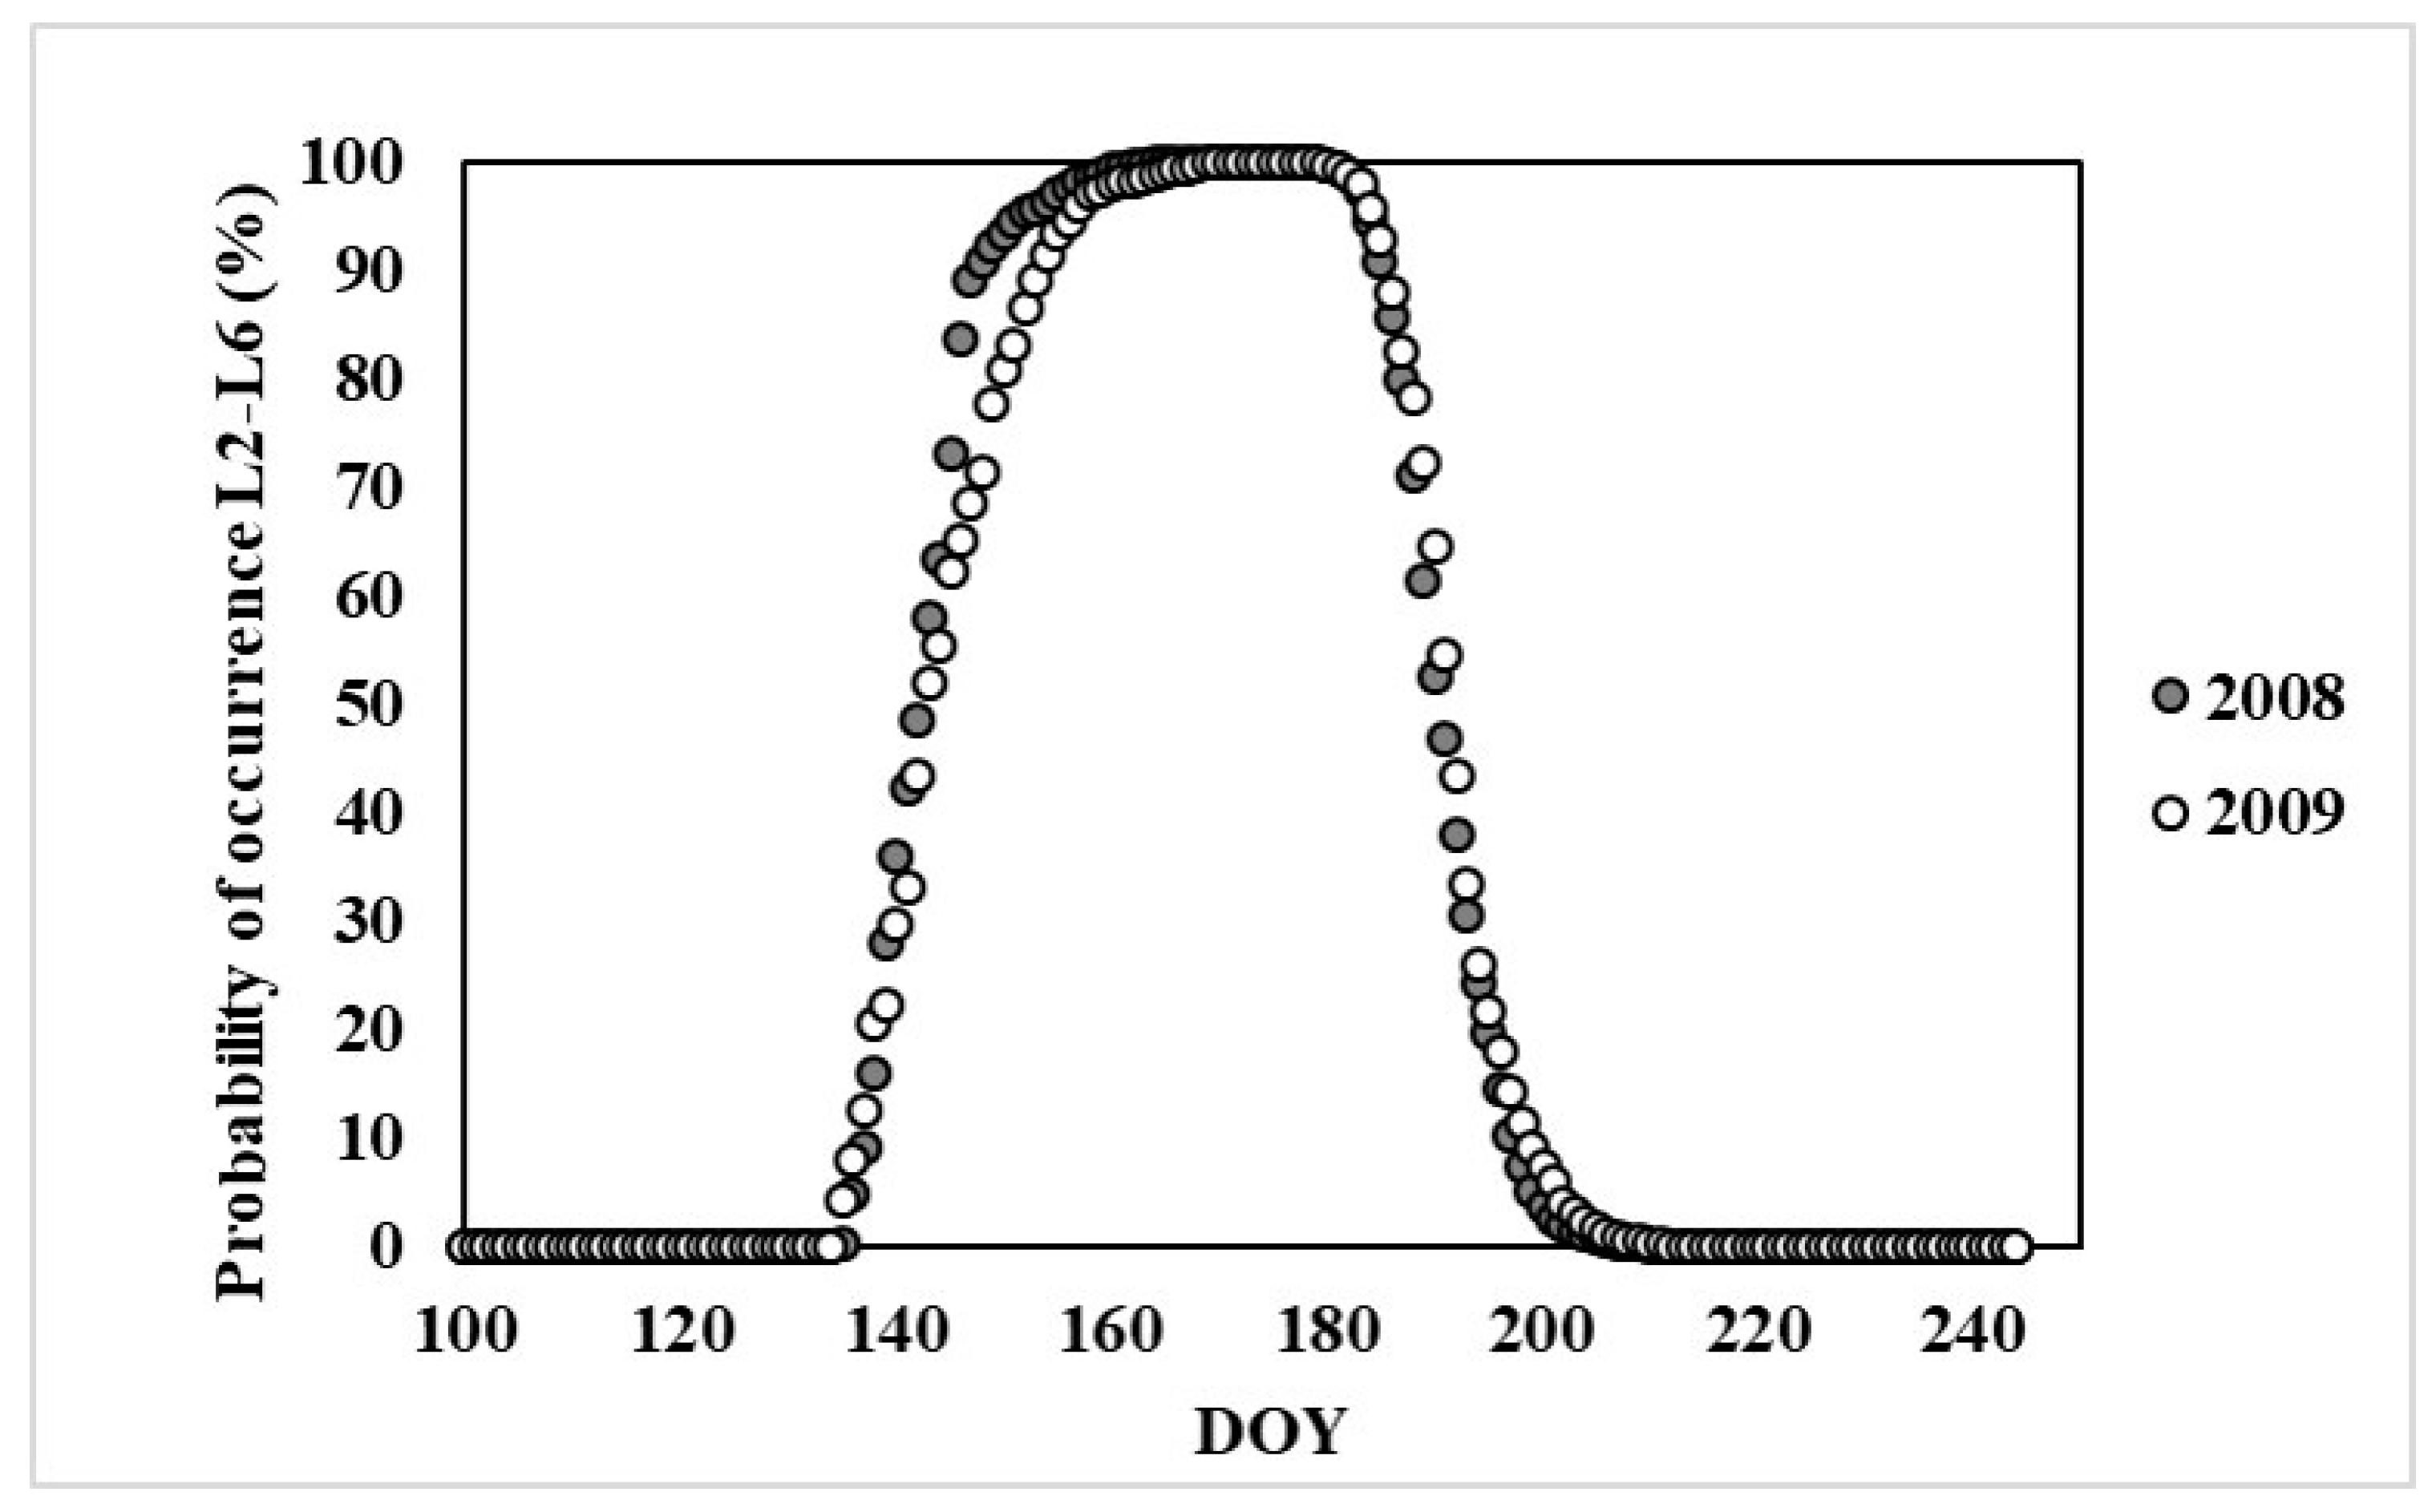
Timing of current-year defoliation was determined based on vegetation and SBW phenology for 2008 and 2009, as the defoliated years. SBW phenology was simulated using the BioSIM tool. The BioSIM is a climatically-driven model for pest management applications, is based on climatic data and degree–day compilation from a suite of weather stations [42], and has been validated and used to simulate annual pest phenology [15,42]. The BioSIM simulation software (v.10) [43] was used for 2008 and 2009 to estimate SBW larvae phenology to model peak SBW larval feeding time. In both years, peak feeding time was modeled as occurring around day of year (DOY) 170, when red-brownish defoliation was expected to start and last for a 2–3 week window (Figure 2). For vegetation phenology, a time series of Landsat TM data for DOY 160 to DOY 280 in a healthy year (2005) and defoliated year (2009) (five images for each year) were used (row and path 11/26 and 12/26). Landsat-derived vegetation indices were calculated for the 2005 healthy year, as well as for the 2009 defoliated year for the Quebec study area. Defoliated areas were determined based on ASMs. In the defoliated areas from 2009, vegetation indices started to decline around DOY 170 to 190, and leveled off until DOY 205, at which point they increased slightly until around DOY 220. However, in moderate and severely defoliated areas, the max vegetation index values did not reach the peak that was observed in 2005. Based on the BioSIM simulation results and Landsat-derived vegetation phenology data, two images for DOY 189 and DOY 191 for 2008 and 2009, respectively, were selected for the defoliated years. Clouds, cloud shadows, and water bodies were delineated and masked out prior to change detection analysis.
For the study area in Maine, relative radiometric normalized Landsat-MSS imagery for a pre-defoliation years (1972 and 1973), two defoliated years (1975 and 1982), and a Landsat-derived forest cover type map for 1975 with 60 m spatial resolution [40] were acquired (Table 1). BioSIM simulation was not used for image selection in Maine because of limited satellite image availability. For 1975 and 1982, two images of DOY 221 and DOY 211 were available and were used for defoliation detection. Cloud and cloud shadows were removed using automated cloud cover identification [44]. Because the northern part of the study area was found to be moderately defoliated in 1973, based on historical ASMs and SBW egg mass data [35], in order to produce pre-defoliated imagery, an image from early September 1972 for row 12/28 was acquired, radiometrically normalized, and applied to replace spectral band values in the northern part of Landsat-MSS scene 13/28 of 1973.
2.4. Spruce Budworm Defoliation Detection and Severity Level Estimation for the Quebec Study Area Current Spruce Budworm Outbreak
Remote sensing of insect defoliation can be based on single- or multiple-date image analysis [11]. Our method was based on multi-date change detection using vegetation indices (VIs) [6,20,46]. The Landsat-5 TM sensor has six spectral bands (blue, green, red, near infrared (NIR), and two shortwave infrared (SWIR) bands) with a spatial resolution of 30 m; therefore, several common vegetation indices can be estimated. A wide range of vegetation indices, such as visible (VIS)-near infrared (NIR) [19,46,47,48] or NIR-SWIR indices [17,20,28,49], have been tested in various forest defoliation detection studies. In this study, seven vegetation indices, including normalized difference vegetation index (NDVI) [50], enhanced vegetation index (EVI) [51,52], green chlorophyll index (Chlgreen) [53,54], greenness normalized difference vegetation index (GNDVI) [55], normalized difference moisture index (NDMI) [56], normalized burn ratio1 (NBR1) [57], and normalized burn ratio2 (NBR2) [58] were tested for their capacity to detect and quantify defoliation (Table 2). These indices have information on vegetation pigment content (NDVI, GNDVI, and Chlgreen), water content (NDMI, NBR1 and NBR2), and foliage structure and amount (NDVI and EVI). Defoliation can be detected by studying reflectance changes in defoliated forest stands compared to their healthy condition before the damage occurred. Defoliated forest stands exhibit progressive decreases in near-infrared reflectance but an increase in short-wave infrared and visible reflectance, due to changes in canopy cover pigment content, water content, and foliage amount [12].
Eco-forest maps from the Quebec Ministry of Forests, Wildlife and Parks (3rd Inventory) with 25 m spatial resolution were used to extract information about susceptible forest stands [59]. Five species groups (balsam fir, black spruce, spruce mixed with other conifers, balsam fir mixed with other conifers, and balsam fir mixed with broad-leaved species) were selected. Annual ASMs of SBW defoliation (e.g., [7]) were used as our field data, to train the remote sensing model for defoliation severity classification. ASM maps have been used for the same purpose by others [24,60,61].
The random forest (RF) non-parametric method [62] was employed to evaluate the performance of the VIs for SBW defoliation detection and severity classification. In the RF method, the variables in a dataset can be ranked, and the most influential variables can be selected and used for defoliation detection and classification. The RF training algorithm applies a bagging (bootstrap aggregation) operation, where a number of decision trees are created based on a random subset of samples derived from the training data. The RF algorithm gives an error rate—called the out-of-bag (OOB) error—for each input variable, using the data not used in deriving the decision trees. The “RandomForest” [63] library in R statistical software v.3 [64] was applied to implement the statistical analysis.
Four hundred samples (200 samples for each year) were collected using a stratified random sampling method. Samples were extracted for the five above-mentioned species groups (40 samples per species) from non-defoliated and defoliated areas in three defoliation severity classes (light, moderate, and severe) [7]. From 400 samples, two-thirds were used as training data to create an in-bag partition to construct the decision tree, while one-third were used for validation and OOB estimation. Seven VIs (Table 2) and species types were input variables, and the OOB error was used to assess classification and choose the number of variables that yielded the smallest error rate. The Gini importance measure was used to determine the order of importance of the variables. Finally, the best VIs were selected for defoliation detection and severity classification. Both single and combinations of VIs were tried for defoliation detection and severity classification. Although previous studies have shown that there is no need for cross-validation or separate tests, because this is already achieved by OOB estimates [65], a confusion matrix was also constructed for further validation of our best model, using an additional 100 samples (50 per year in 2008 and 2009) that were not used for the modeling [40,65]. Confidence intervals were calculated using Wald’s method [66].
2.5. Spruce Budworm Defoliation Detection for the Maine Study Area Past Spruce Budworm Outbreak
The method for the Maine study area was also based on multi-date change detection using VIs [6,20]. However, Landsat-MSS sensors only had four spectral bands (green, red, and two NIR) with a spatial resolution of 60 m, so that many common vegetation indices could not be estimated; therefore, change detection was based only on NDVI. Among the different spectral bands and VIs that could be used for foliage damage detection using Landsat MSS, the red and NIR2 bands (2 and 4), as well as NDVI are suggested as the best for vegetation change studies [67]. The historical ASMs of Maine were very coarse in spatial resolution, and thus were not suitable as a measure of defoliation data. Expected defoliation levels derived from SBW egg-mass data [35] were used instead for comparison with Landsat-MSS derived defoliation maps. A total of 349 and 247 egg-mass data plots were used for the years 1975 and 1982, respectively. Egg-mass data were converted to defoliation levels, using the method outlined in Simmons (1974) [68] and the equation presented in Hennigar et al. [35]. Ordinal regression [69] was used to evaluate the relationship between expected defoliation levels and NDVI changes in both years. Any reduction in NDVI larger than 0.05 was considered as defoliation, and SBW defoliation maps were produced from NDVI data for the years 1975 and 1982. The percentage of correctly identified defoliated areas was determined by comparing defoliation information derived from egg-mass data and those derived from Landsat-MSS.
2.6. Detecting Other Disturbances in Spruce Budworm-Defoliated Forests
In the Quebec study area, no fire or harvest disturbances were detected. The Maine study area included intensive harvest activities, including clear-cuts in the 1970s that changed fir–spruce forests, while SBW defoliation was developing. Producing SBW defoliation maps thus required differentiating harvest-related changes. To avoid confounding information, past Maine harvest data from [40] were used to remove all areas with harvest activities from the Landsat-MSS imagery. The remaining changes detected over the host forests were assumed to be related to SBW defoliation, which was the dominant natural disturbance in the area.
3. Results
3.1. Spruce Budworm Defoliation Detection and Severity Level Classification in the Current Quebec Outbreak
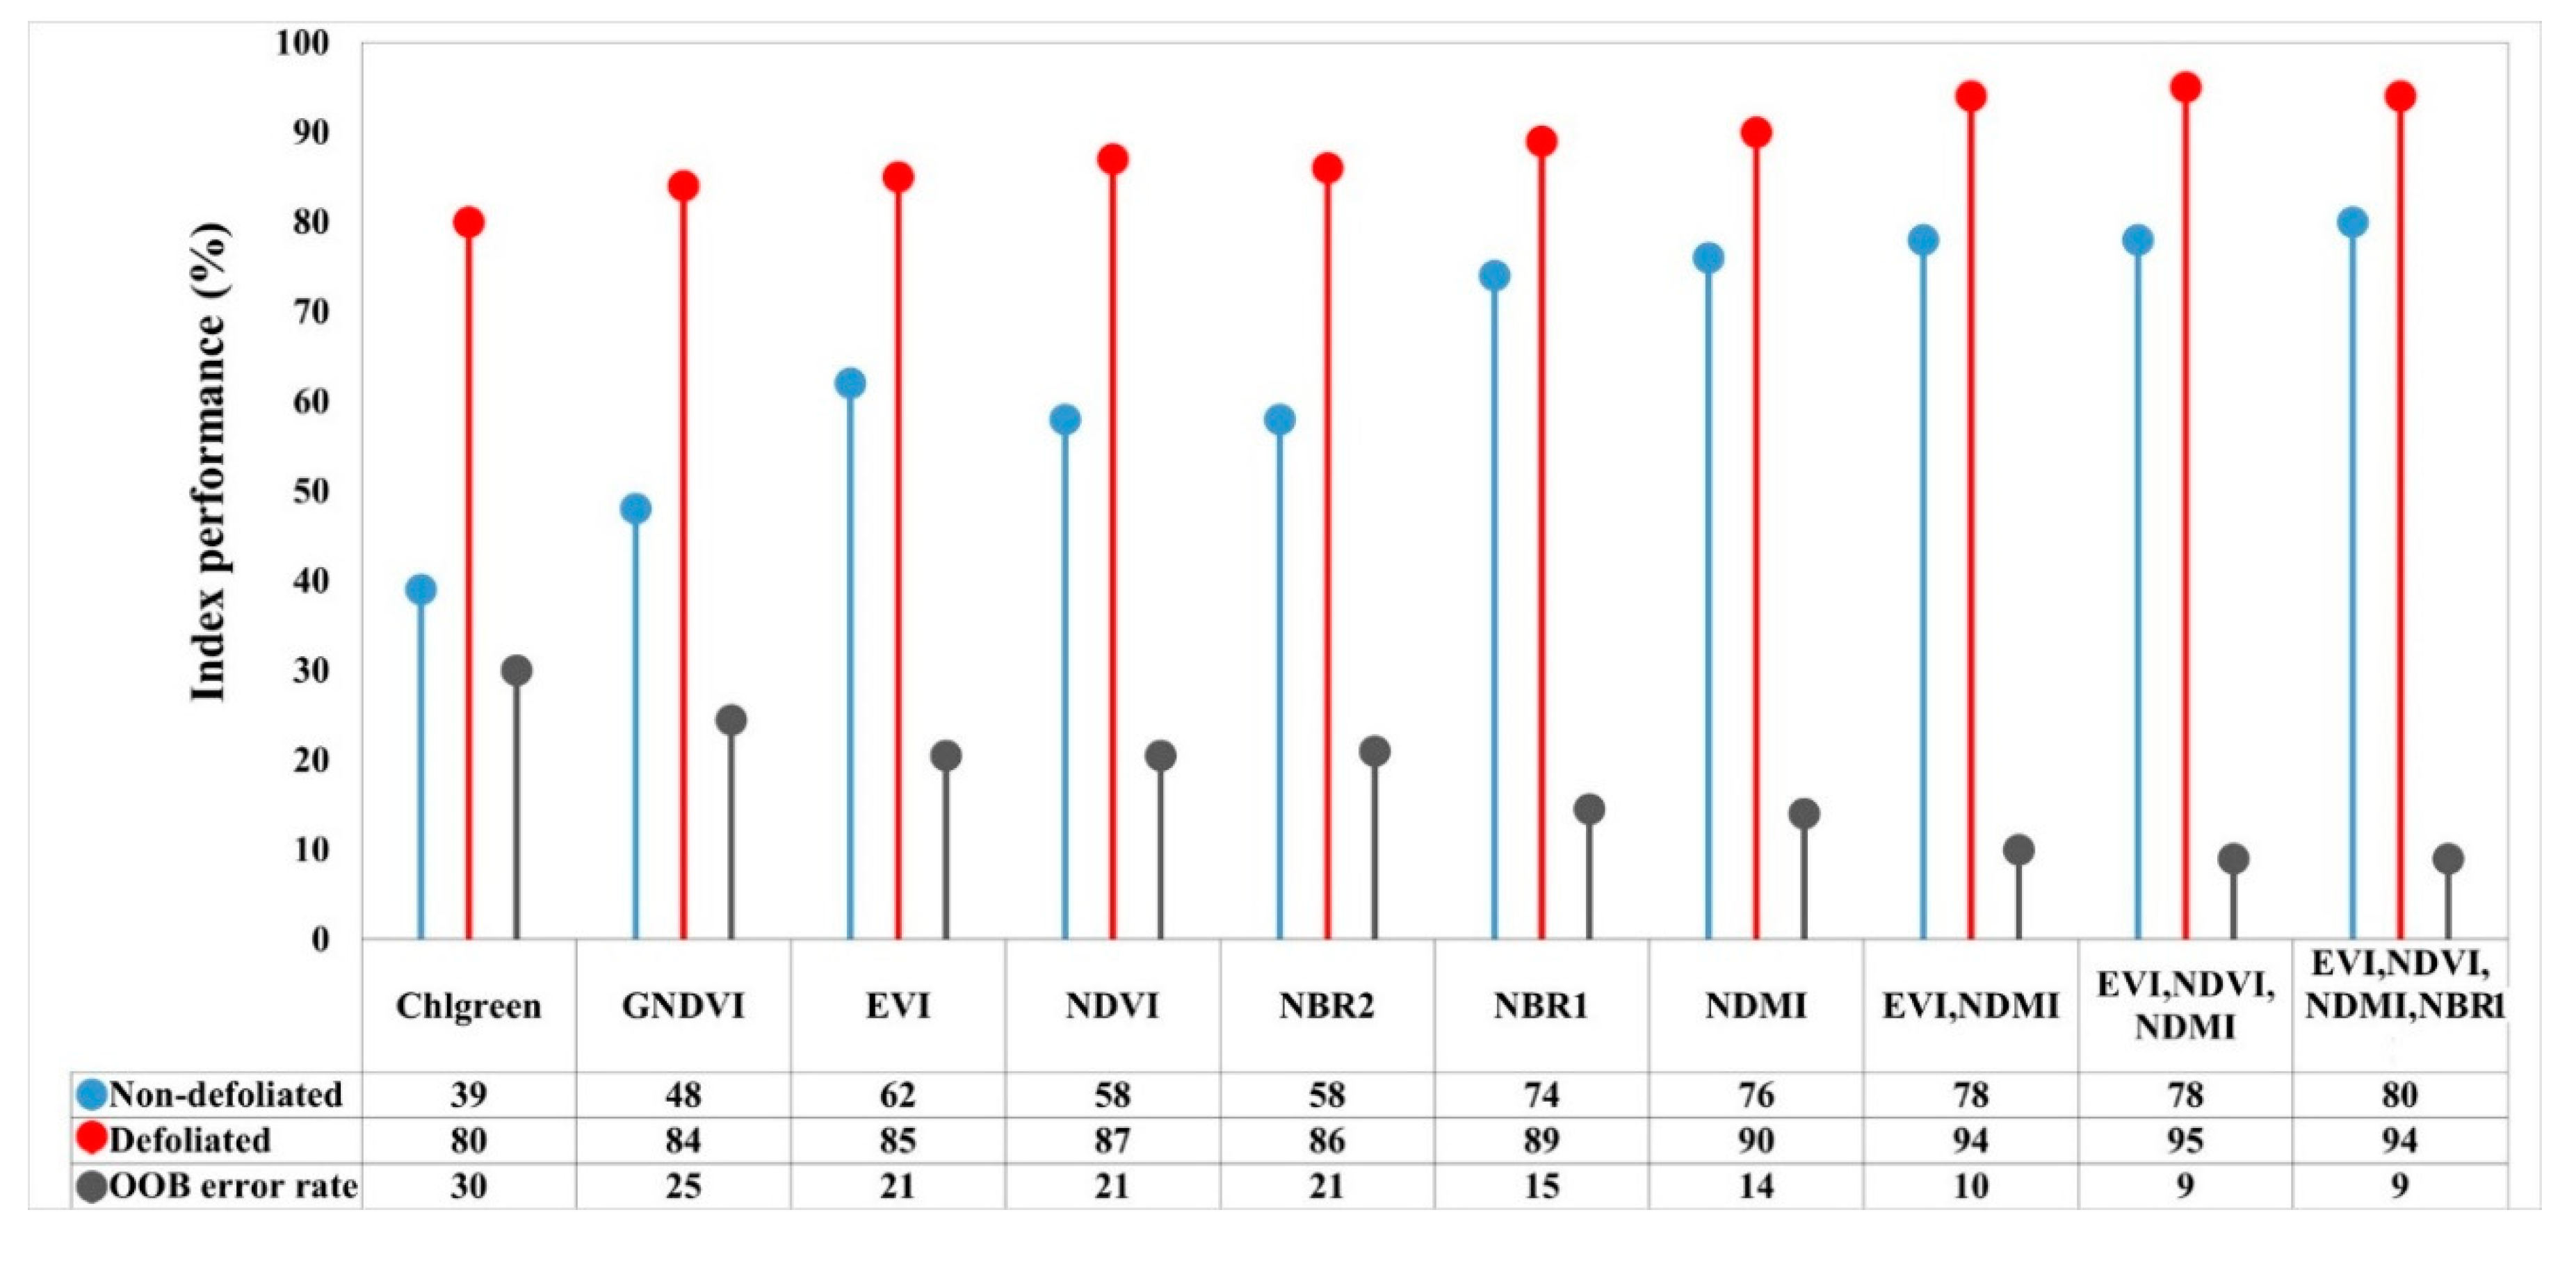
Figure 3 compares the performance of the seven single VIs and three best combinations thereof, to detect defoliated versus non-defoliated forests. All indices were able to identify defoliated stands with greater than 80% producer’s accuracy, but identification of non-defoliated stands was much more variable, as were errors in detection. The best indices to detect and classify SBW defoliation, in descending order, were NDMI, NBR1, EVI, and NDVI. NDMI had 90% accuracy in detecting defoliated pixels and 76% accuracy in detecting non-defoliated pixels. Different combinations of the four best vegetation indices were also evaluated. The results showed that the combination of NDMI, EVI, and NDVI reduced the error rate by 5% for SBW defoliation detection compared to NDMI only.
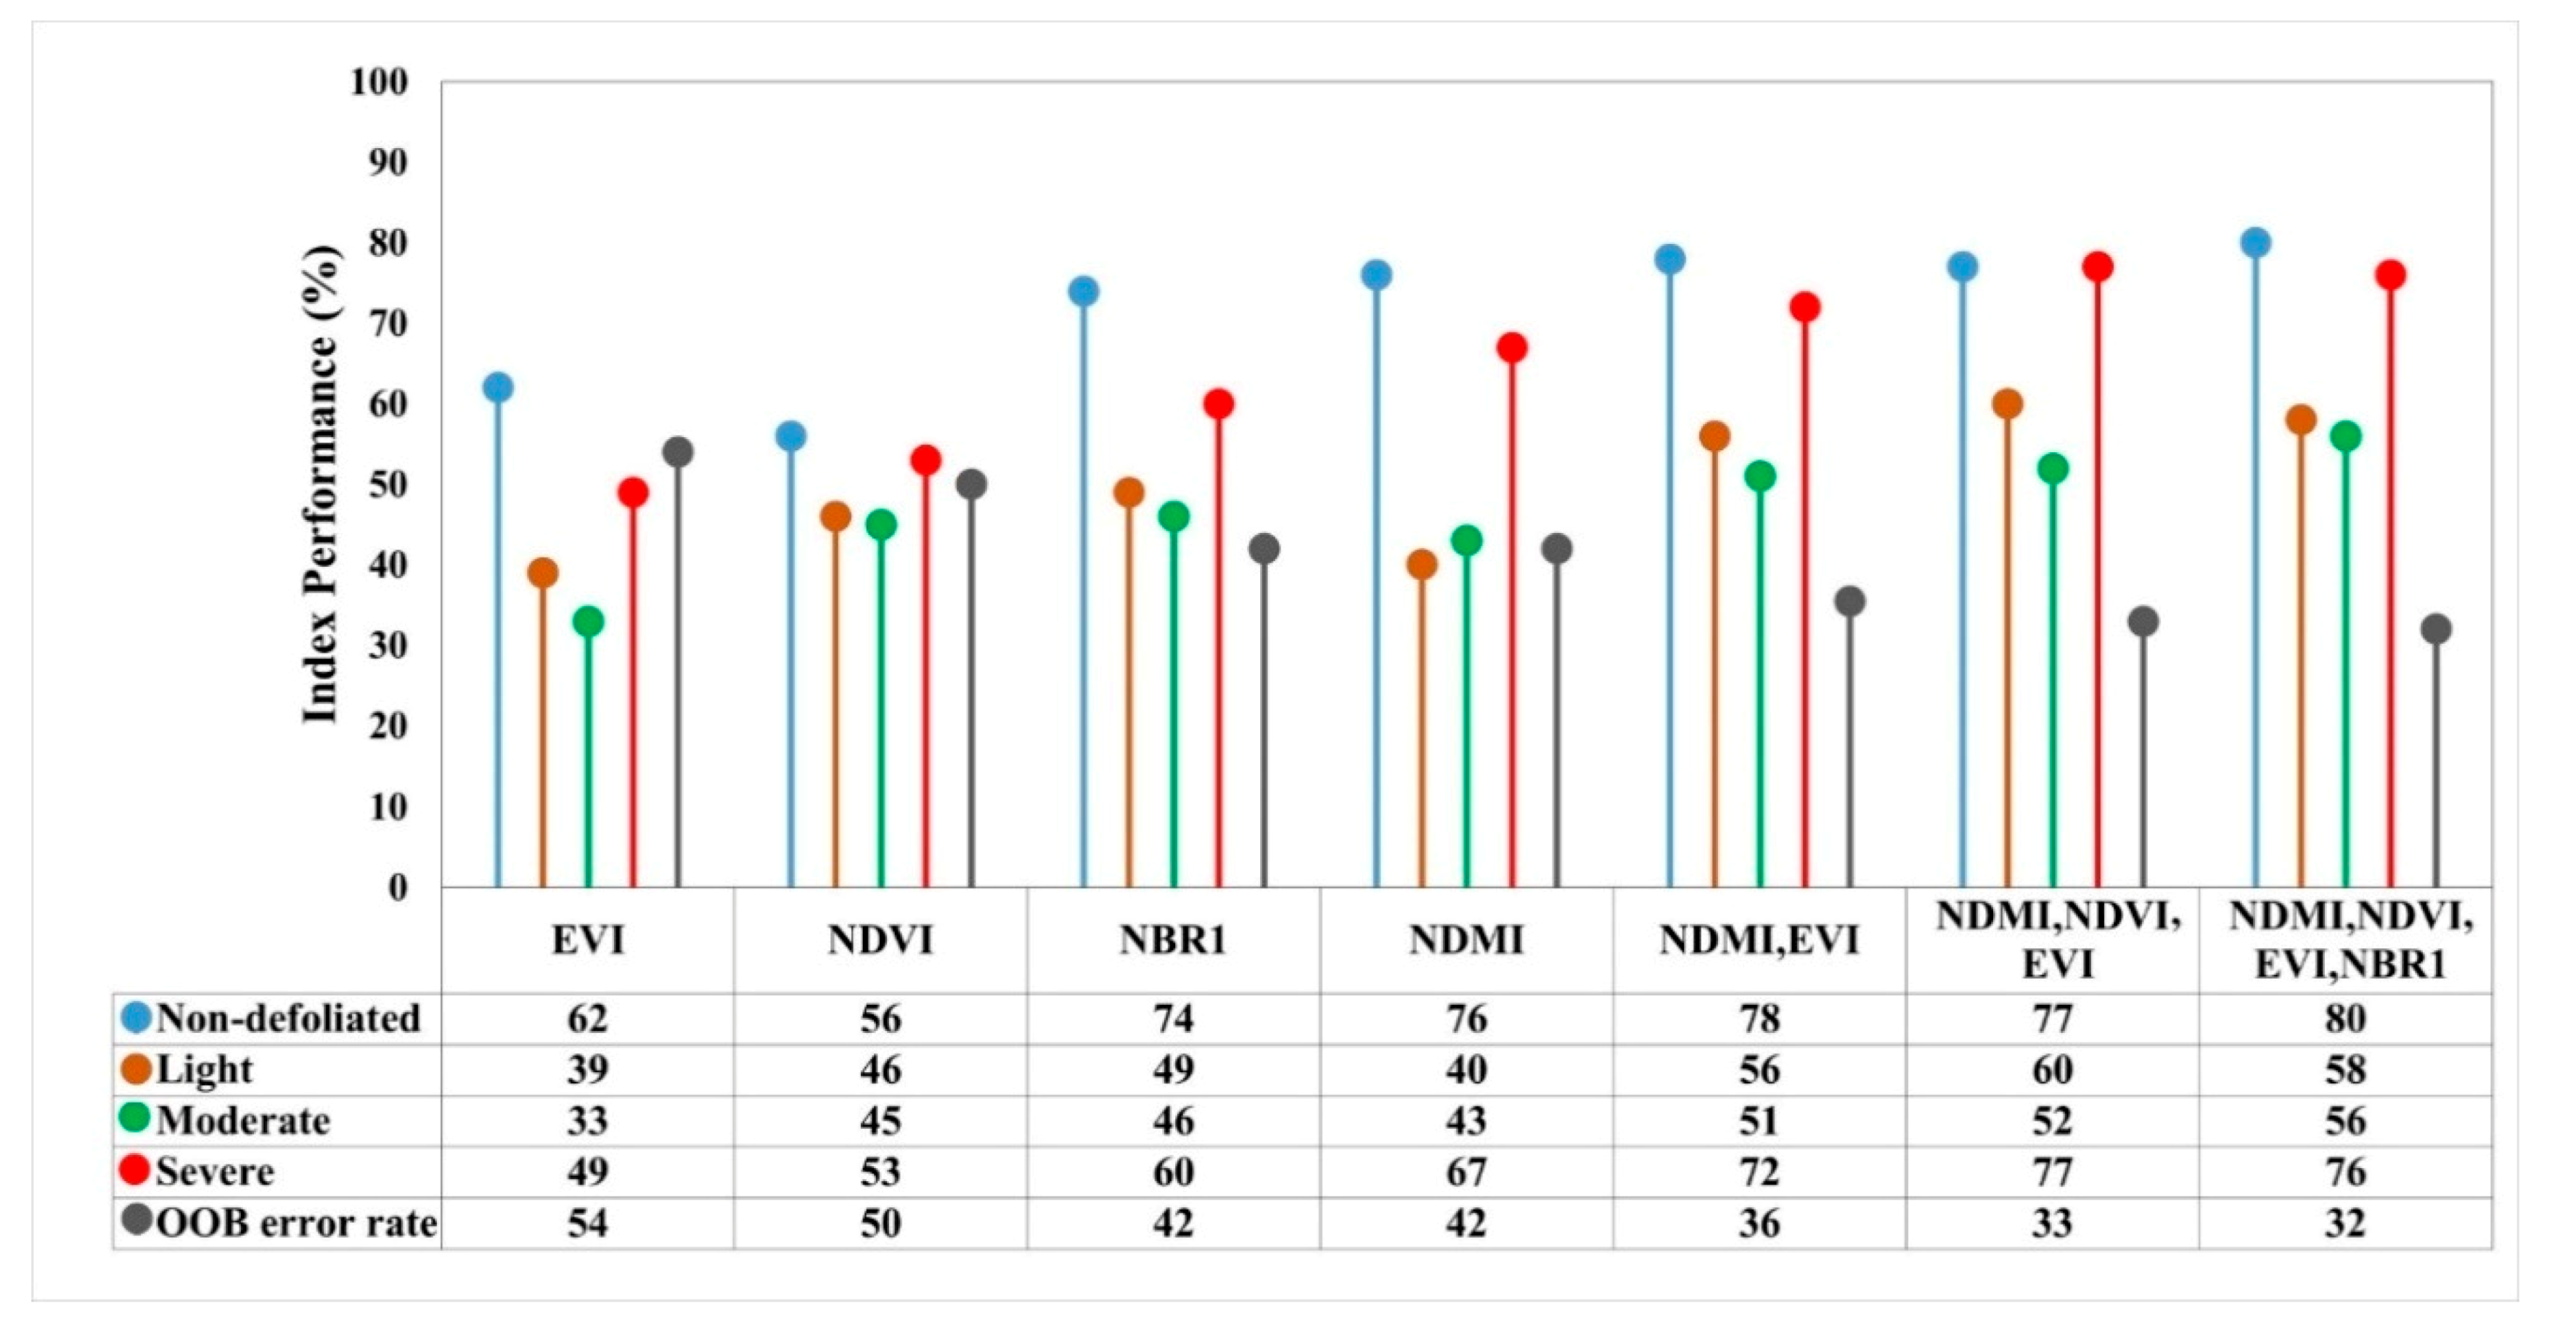
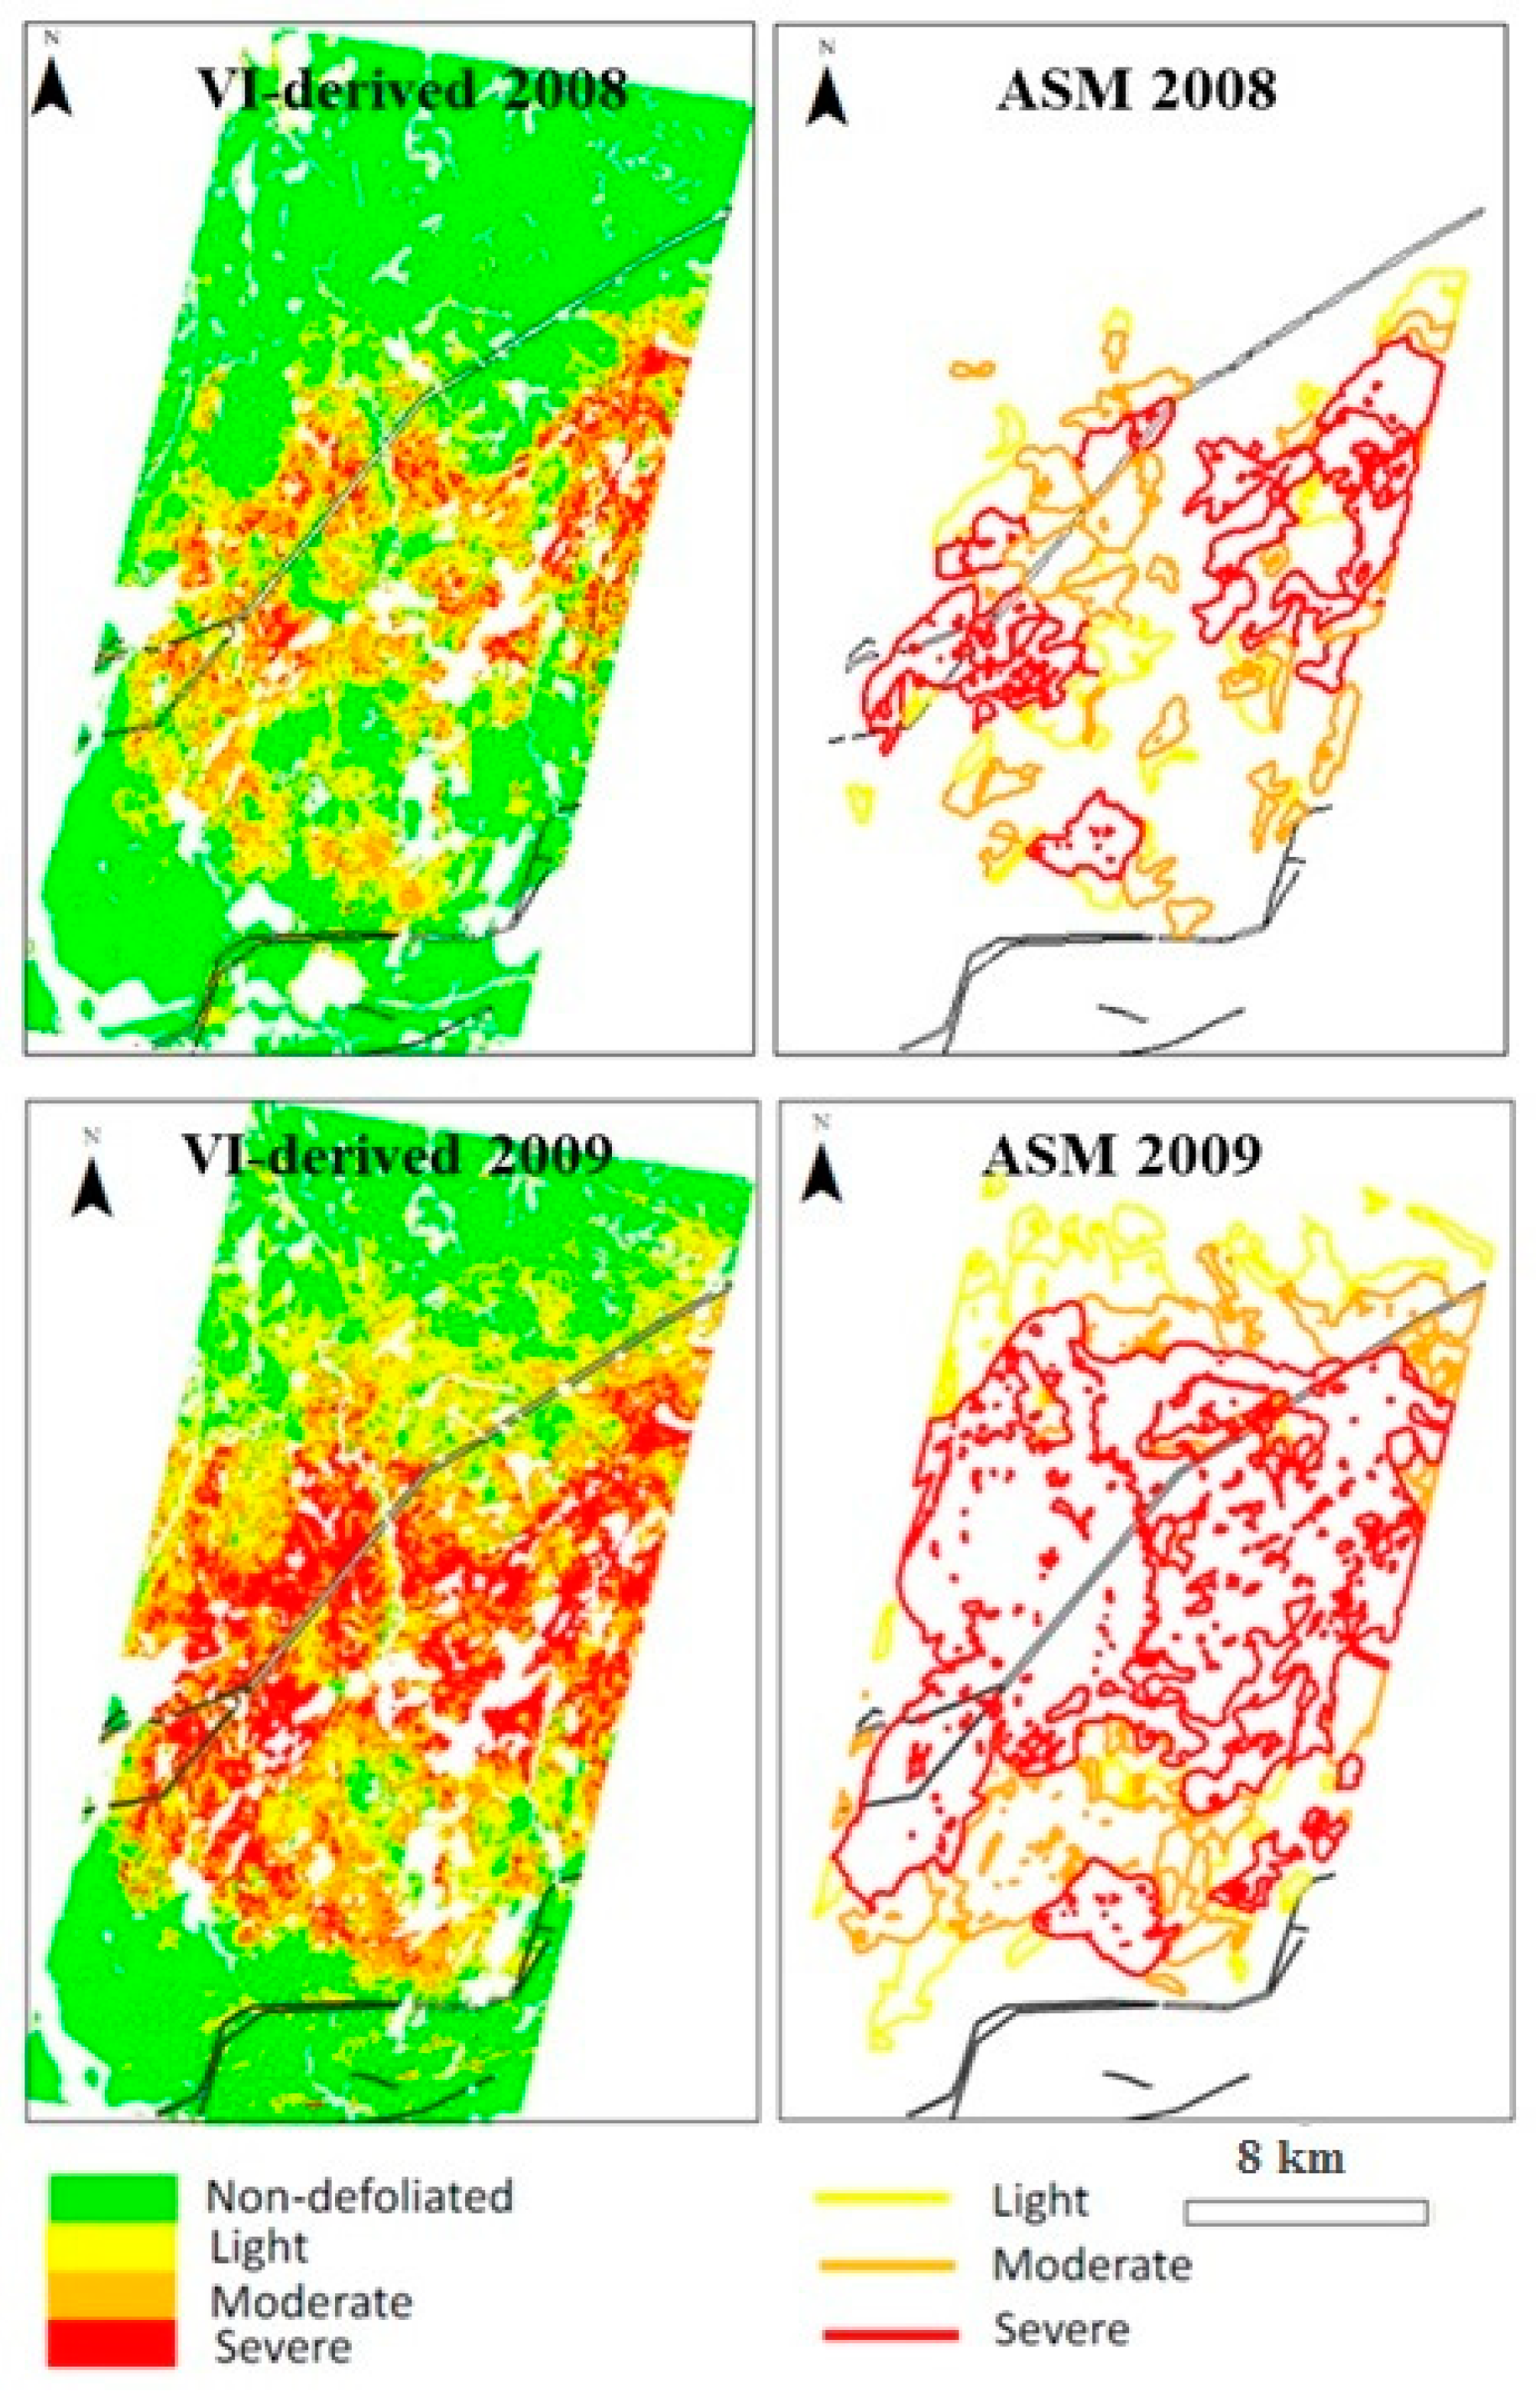
Based on the results of accuracy estimations in Figure 3, the four best indices and their combinations were selected for severity classification analysis. The combination of NDMI, EVI, NDVI, and NBR1 reduced the OOB error rate by 10%, compared with the use of the single best index NDMI or NBR1 (Figure 4). Addition of a fourth VI only marginally improved estimation error when compared with the three-VI approach. As NBR1 and NDMI contain similar information about canopy water content, we selected the combination of NDMI, EVI, and NDVI for defoliation severity classification. Landsat-derived SBW defoliation severity maps for the years 2008 and 2009 produced using the three-VI classification approach for parts of the Quebec study area, along with ASMs in the same years, are presented in Figure 5.
Results of defoliation classification accuracy for 2008 and 2009 are presented in Table 3. The overall accuracies and Kappa coefficients for the three VI-derived defoliation detection were, respectively, 93% and 0.84 for 2008 and 90% and 0.65 for 2009, indicating that the suggested method was able to detect defoliated areas. The overall accuracies and Kappa coefficients for defoliation severity classification were, respectively, 72% and 0.63 for 2008 and 64% and 0.50 for 2009. Less than 1% of the severely defoliated forests were classified as lightly or non-defoliated in both years. Less than 1% and 6% of pixels with moderate defoliation were classified as non-defoliated in 2009 and 2008, respectively. When misclassified, light defoliation was either classified as “no defoliation” or “moderate defoliation” in both years. Therefore, it seems that misclassification primarily occurred only between two adjacent categories.
3.2. Spruce Budworm Defoliation Detection in the Maine Past Outbreak
The relationship between defoliation levels estimated from egg mass data and change in mean NDVI values was weak, but statistically significant (Table 4). Not much variation in defoliation levels was explained by NDVI variation, as indicated by low pseudo-R2 values. On average, 57% and 47% of plots were correctly identified as either defoliated or non-defoliated for 1975 and 1982, respectively. In both years, the identification accuracy was considerably higher at greater defoliation levels. Due to the weak statistical relationship between the expected defoliation data and NDVI in Maine, but better accuracy for defoliation identification (% correctly identified data), only defoliated versus non-defoliated classes were mapped.
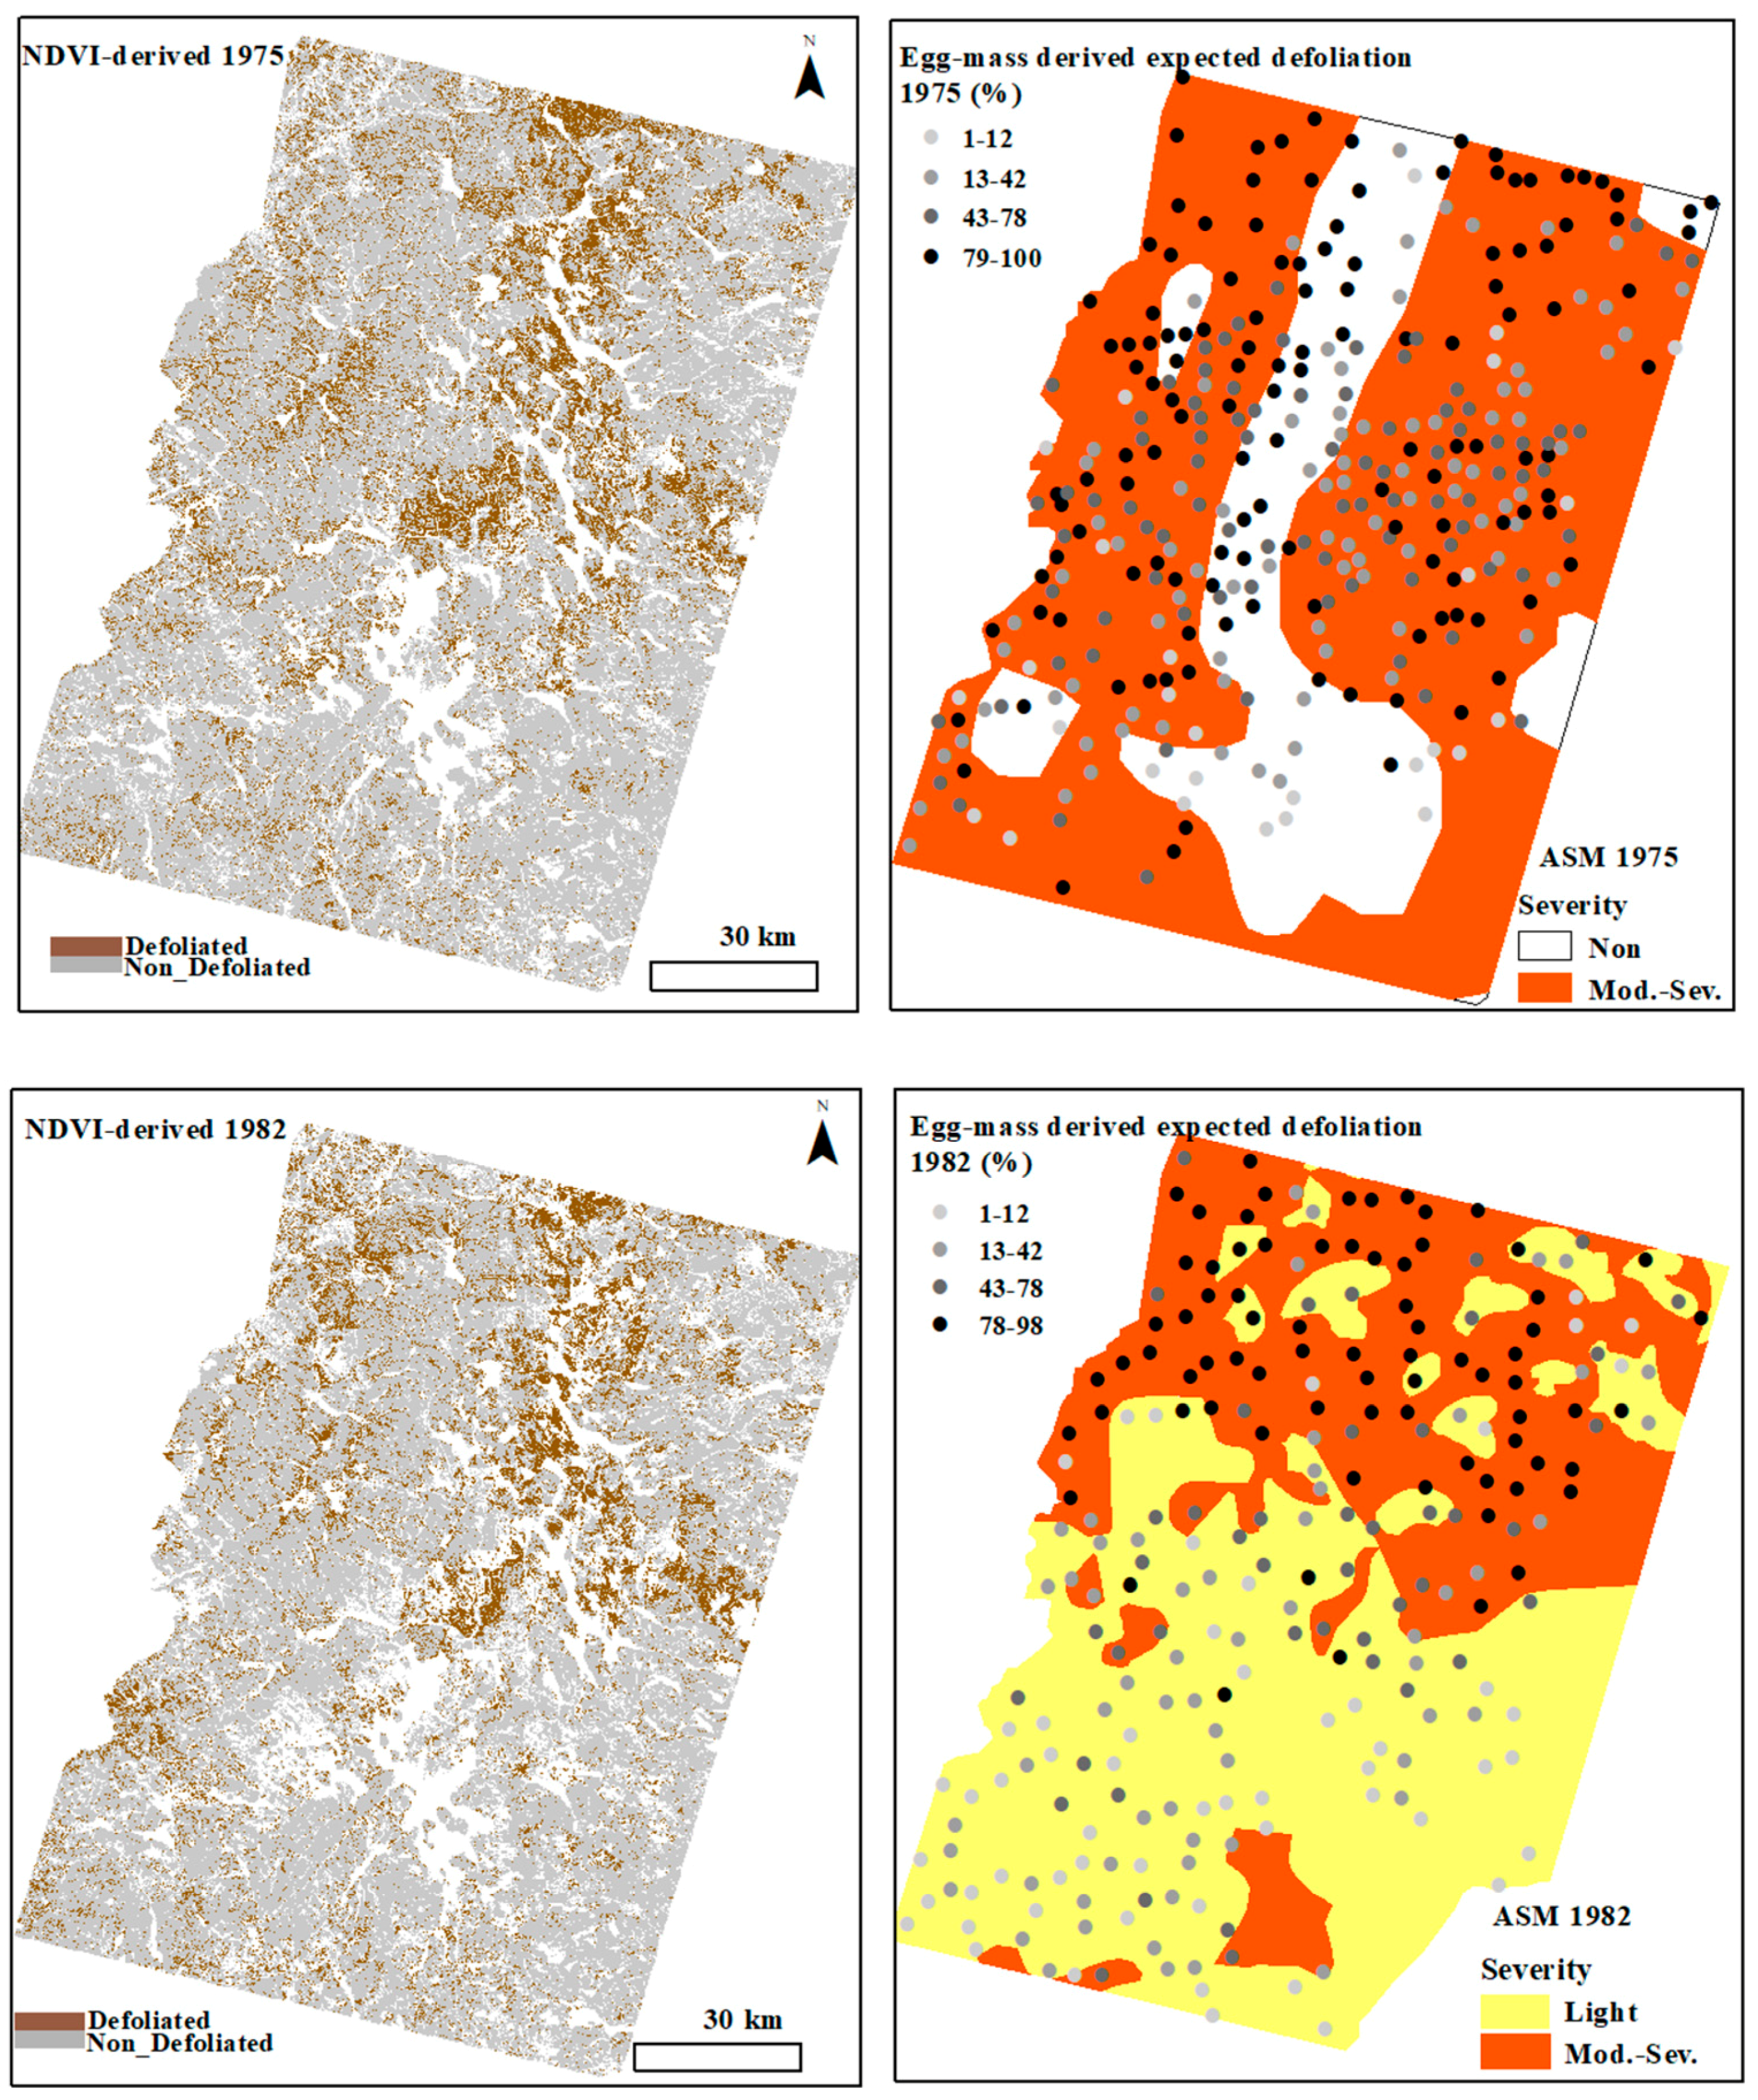
Figure 6 shows maps of SBW occurrence derived from NDVI for the years 1975 and 1982 in the Maine study area, along with the historical ASMs and expected defoliation calculated from egg-mass data. Although both ASMs and egg-mass-derived defoliation maps presented in Figure 6 contain information about defoliation severity levels, because our Landsat MSS-derived map only presents defoliation occurrence, our results only focus on defoliation occurrence and not severity. In general, the Landsat-MSS-derived map of defoliation showed good spatial agreement with expected defoliation in both years. Looking at the forest cover type map of 1975 in Figure 1, more defoliation would be expected in the northern, western, eastern, and central parts of the study area in Maine, where SBW host species were dominant, whereas less defoliation would be expected in the southern parts, where hardwoods were more dominant. This trend is evident in both Landsat-MSS-derived SBW defoliation maps and expected defoliation data, but not clearly in ASMs. Apparently, forest composition data were not incorporated into the ASM defoliation estimates [35].
In general, defoliation severity was higher in 1975 than in 1982. Looking at the ASM for 1975, the central and the southern parts of the Maine study area were identified as non-defoliated, while the central parts of the region should have been moderately defoliated, based on expected defoliation data retrieved from the egg-mass counts of 1975. Those areas were also mapped as defoliated in the Landsat-MSS derived defoliation map of 1975. In 1985, defoliation was more severe in the northern parts of the study area and lighter in the central and southern parts, based on ASM and expected defoliation data. This can be also observed in the Landsat-MSS defoliation map of 1985. It is evident that Landsat-MSS and expected defoliation data present more details about the status of defoliation over coniferous forests than ASM.
4. Discussion
Using Landsat-5 data, results indicated that NDMI was the best single index to detect defoliation across the studied forests in Quebec. In general, there is little literature on multi-VI defoliation detection performance in coniferous forests. Our findings are in agreement with studies performed on the detection of defoliation in deciduous forests where vegetation water indices like NDMI and NBR1, which are based on NIR/SWIR bands, performed better than NDVI or EVI, which are based on VIS/NIR bands [17,20]. Other studies applied single vegetation water indices for defoliation detection over coniferous forests but did not compare them with other indices [6,24]. Our results showed that the combination of NDVI, EVI, and NDMI can reduce the OOB rate of error for both SBW defoliation detection and classification. NDVI is more sensitive to canopy chlorophyll content, while EVI responds to canopy structural characteristics, such as leaf area index and canopy type. The combined application of these two indices has been suggested as a complementary tool for vegetation change detection [70]. Chlgreen and GNDVI were applied in this study as better indices, with wider dynamic ranges and higher sensitivity than NDVI, to evaluate changes in canopy chlorophyll concentration [53,54,55]; however, neither Chlgreen nor GNDVI were able to detect defoliated regions better than NDVI, and their performance to differentiate non-defoliated pixels was lower than NDVI.
It was evident that using the combination of Landsat-5-derived NDVI, EVI, and NDMI at 30 m resolution, as suggested in this research, provides a potentially useful tool for SBW defoliation detection, but differentiation of lightly defoliated from non-defoliated areas is still challenging. Using the model for severity classification, misclassification mostly occurred at lower defoliation levels (Table 3), with different levels of accuracy between the two years. This can be related to the broad range of defoliation categories of ASMs and their inherently lower accuracy for light defoliation detection [10]; for example, the lower range of defoliation in the medium-defoliation class can be confounded with the higher range in the light-defoliation class, making these variations inevitable. In addition, possible limitations of Landsat-derived vegetation indices to detect very light defoliation (e.g., <15%) can be attributed to both radiometric and spatial resolutions of the data. Minor disturbances, such as wind and frost-related damage, might also contribute to errors in non-defoliated forest detection. In terms of future work, models derived from satellite sensors, such as Landsat and Sentinel-2, should be trained with more accurate tree- and plot-measured defoliation data, in order to provide better estimates of defoliation severity.
Townsend et al. [20] suggested the viability of NDVI for mapping defoliation where SWIR spectral bands are not available. This was the situation for the past SBW outbreak in Maine using Landsat-MSS data. We found weak but statistically significant relationships between historically expected defoliation classification data and Landsat-MSS-derived NDVI change maps, indicating a potential mismatch between defoliation severity classes and NDVI-derived defoliation severity. The weak relationship can be attributed to differences between the egg-mass plot area size (~10 m2) that was used to estimate defoliation levels and the Landsat-MSS NDVI data pixel size (3600 m2). In addition, Landsat-MSS images for early August and late July were used for SBW defoliation detection in 1975 and 1982, respectively, because of the unavailability of data in mid-July, which was not an ideal time for annual defoliation detection. Finally, NDVI is known to saturate over dense forest canopy cover [55], and therefore, a slight decrease in foliage pigment content and structure may not always be detected.
In the Maine study area, on average, 57% and 47% of plots were correctly identified as either defoliated or non-defoliated in 1975 and 1982, respectively, with higher identification accuracy at greater defoliation levels. Therefore, we can conclude that Landsat-MSS NDVI is capable of detecting defoliation from historical Landsat imager—in particular, moderate and severe defoliation. In general, there was good spatial agreement with forest cover maps where SBW hosts were located, as well as expected defoliation levels derived from egg-mass data and Landsat-derived defoliation maps. Landsat-MSS defoliation occurrence and higher defoliation levels were concentrated in the northern and central parts of the study area in Maine for both years where SBW tree host species were dominant, while less defoliation was observed in the south. It is generally assumed that spruce–fir stands receive certain protection from hardwood stands, attributed to SBW dispersal and migration losses [71].
In addition to spectral information and the type of VI, data timing and radiometric consistency within the images were key factors for change detection in this analysis. For defoliation detection for the current outbreak in Quebec study area, Landsat-5 surface reflectance data were used, and BioSIM was applied to simulate SBW phenology for each year. Both DOY 189 and 191 for 2008 and 2009, respectively, appeared to be sound dates to detect SBW-induced foliage discoloration, and were reasonable dates for SBW annual defoliation detection. For defoliation detection during the past outbreak in Maine, relative radiometrically-corrected imagery was used, but because of unavailability of Landsat-MSS imagery for mid-July, available cloud-free images in late July and early August were used. Although these dates were not ideal times for annual defoliation detection, as discolored foliage might have fallen off, they still contain useful information on SBW defoliation extent, and how two different types of disturbances (i.e., SBW defoliation and harvest) were intensively altering Maine’s spruce–fir forest landscape. In addition, in multi-date change detection, the correct assignment of a base (healthy) image as reference is important, because it will affect change detection accuracy. Not much has been previously discussed about how effective the base image can be for the evaluation of defoliation severity. For a mature forest, it seems that the average of a few years of VIs in healthy condition in early–mid July would be ideal for current-year defoliation detection. This ensures the inclusion of vegetation phenology and the effect of dry/wet years on vegetation vigor. The fact that bud flush in balsam fir normally occurs, on average, two weeks earlier than in black spruce, and that the entire foliage discoloration process may take about three weeks, should be taken into consideration if only one date per year is used for image analysis and change detection.
5. Conclusions
Landsat data have the potential to be used for fine-scale annual SBW defoliation detection and quantification. In this work, we used historical Landsat-MSS and Landsat-5 data for annual SBW defoliation detection and classification. Landsat-5 imagery can be used to detect and classify current-year SBW defoliation, but more research is needed to improve the accuracy of the developed method, so that light and moderate defoliation can be better differentiated. Landsat-MSS also proved able to provide valuable information about annual SBW defoliation extent in a past outbreak, to complement (and potentially improve) historical coarse resolution ASMs and field data, such as egg-mass survey data.
The unavailability of cloud-free satellite imagery/pixels during the biological window to observe foliage discoloration is one of the main reasons SBW annual defoliation detection using remote sensing techniques has not been well-evaluated. It is expected that multi-spectral sensors will be available more widely in future, since for the first time, three free-of-charge, fine-resolution, multi-spectral satellites with harmonized spectral bands have recently become available. A combination of Landsat-8 with Sentinel-2A and 2B satellite data promises 2–3 day temporal resolution, and should provide sound data collection for defoliation detection and monitoring at a scale comparable with ASMs. This fine-resolution, satellite-derived, annual SBW defoliation information can be used for sustainable forest management and planning at the regional and local scales.
Author Contributions
P.R., A.W., D.K., and D.M. conceived and designed the study; P.R. developed the methodology; P.R., A.W., and D.K. analyzed the data; D.K. and D.M. contributed research materials and field data; P.R. wrote the paper.
Funding
Funding for this research was provided in part by the Cooperative Forestry Research Unit (CFRU), the USDA Forest Service Northeastern States Research Cooperative (NSRC), and the USDA National Institute of Food and Agriculture, McIntire-Stennis project number #ME041516 through the Maine Agricultural and Forest Experiment Station (Maine Agricultural and Forest Experiment Station Publication Number 3607).
Acknowledgments
The authors would also like to thank Kasey Legaard for providing the Landsat-MSS derived forest cover/harvest data for the past outbreak in Maine.
Conflicts of Interest
The authors declare no conflict of interest.
References
- MacLean, D.A.; MacKinnon, W.E. Accuracy of aerial sketch-mapping estimates of spruce budworm defoliation in New Brunswick. Can. J. For. Res. 1996, 26, 2099–2108. [Google Scholar] [CrossRef]
- MacLean, D.A.; MacKinnon, W.E. Effects of stand and site characteristics on susceptibility and vulnerability of balsam fir and spruce to spruce budworm in New Brunswick. Can. J. For. Res. 1997, 27, 1859–1871. [Google Scholar] [CrossRef]
- MacLean, D.A. Effects of spruce budworm outbreaks on the productivity and stability of balsam fir forests. For. Chron. 1984, 60, 273–279. [Google Scholar] [CrossRef]
- Gray, D.R. The relationship between climate and outbreak characteristics of the spruce budworm in eastern Canada. Clim. Chang. 2008, 87, 361–383. [Google Scholar] [CrossRef]
- Williams, D.W.; Liebhold, A.M. Spatial synchrony of spruce budworm outbreaks in eastern North America. Ecology 2000, 81, 2753–2766. [Google Scholar] [CrossRef]
- Hall, R.; Filiatrault, M.; Deschamps, A.; Arsenault, E. Mapping eastern spruce budworm cumulative defoliation severity from Landsat and SPOT. In Proceedings of the 30th Canadian Symposium on Remote Sensing, Lethbridge, AB, Canada, 22–25 June 2009; pp. 22–25. [Google Scholar]
- Ministère des Forêts de la Faune et des Parcs. Aires Infestées Par la Tordeuse des Bourgeons de L’épinette au Québec en 2017-Version 1.0; Gouvernement du Québec, Direction de la Protection des Forêts: Québec, QC, Canada, 2017; p. 16.
- Wagner, R.G.; Bryant, J.; Burgason, B.; Doty, M.; Roth, B.E.; Strauch, P.; Struble, D.; Denico, D. Coming Spruce Budworm Outbreak: Initial Risk Assessment and Preparation & Response Recommendations for Maine’s Forestry Community; Cooperative Forestry Research Unit, University of Maine: Orono, ME, USA, 2015; p. 77. [Google Scholar]
- Gray, D.R.; Régnière, J.; Boulet, B. Analysis and use of historical patterns of spruce budworm defoliation to forecast outbreak patterns in Quebec. For. Ecol. Manag. 2000, 127, 217–231. [Google Scholar] [CrossRef]
- Taylor, S.L.; MacLean, D.A. Validation of spruce budworm outbreak history developed from aerial sketch mapping of defoliation in New Brunswick. North. J. Appl. For. 2008, 25, 139–145. [Google Scholar]
- Hall, R.; Castilla, G.; White, J.; Cooke, B.; Skakun, R. Remote sensing of forest pest damage: A review and lessons learned from a Canadian perspective. Can. Entomol. 2016, 148, S296–S356. [Google Scholar] [CrossRef]
- Leckie, D.; Teillet, P.; Ostaff, D.; Fedosejevs, G. Sensor band selection for detecting current defoliation caused by the spruce budworm. Remote Sens. Environ. 1988, 26, 31–36. [Google Scholar] [CrossRef]
- MacLean, D.A.; Ostaff, D.P. Patterns of balsam fir mortality caused by an uncontrolled spruce budworm outbreak. Can. J. For. Res. 1989, 19, 1087–1095. [Google Scholar] [CrossRef]
- Ostaff, D.P.; MacLean, D.A. Patterns of balsam fir foliar production and growth in relation to defoliation by spruce budworm. Can. J. For. Res. 1995, 25, 1128–1136. [Google Scholar] [CrossRef]
- Rullan-Silva, C.; Olthoff, A.; de la Mata, J.D.; Pajares-Alonso, J. Remote monitoring of forest insect defoliation—A Review. For. Syst. 2013, 22, 377–391. [Google Scholar] [CrossRef]
- Brovkina, O.; Cienciala, E.; Zemek, F.; Lukeš, P.; Fabianek, T.; Russ, R. Composite indicator for monitoring of Norway spruce stand decline. Eur. J. Remote Sens. 2017, 50, 550–563. [Google Scholar] [CrossRef]
- De Beurs, K.; Townsend, P. Estimating the effect of gypsy moth defoliation using MODIS. Remote Sens. Environ. 2008, 112, 3983–3990. [Google Scholar] [CrossRef]
- Dottavio, C.L.; Williams, D.L. Satellite technology: An improved means for monitoring forest insect defoliation. J. For. 1983, 81, 30–34. [Google Scholar]
- Hurley, A.; Watts, D.; Burke, B.; Richards, C. Identifying gypsy moth defoliation in Ohio using Landsat data. Environ. Eng. Geosci. 2004, 10, 321–328. [Google Scholar] [CrossRef]
- Townsend, P.A.; Singh, A.; Foster, J.R.; Rehberg, N.J.; Kingdon, C.C.; Eshleman, K.N.; Seagle, S.W. A general Landsat model to predict canopy defoliation in broadleaf deciduous forests. Remote Sens. Environ. 2012, 119, 255–265. [Google Scholar] [CrossRef]
- Hall, R.; Crown, P.; Titus, S. Change detection methodology for aspen defoliation with Landsat MSS digital data. Can. J. Remote Sens. 1984, 10, 135–142. [Google Scholar] [CrossRef]
- Leckie, D.G.; Cloney, E.; Joyce, S.P. Automated detection and mapping of crown discolouration caused by jack pine budworm with 2.5 m resolution multispectral imagery. Int. J. Appl. Earth Obs. Geoinf. 2005, 7, 61–77. [Google Scholar] [CrossRef]
- Radeloff, V.C.; Mladenoff, D.J.; Boyce, M.S. Detecting jack pine budworm defoliation using spectral mixture analysis: Separating effects from determinants. Remote Sens. Environ. 1999, 69, 156–169. [Google Scholar] [CrossRef]
- Fraser, R.; Latifovic, R. Mapping insect-induced tree defoliation and mortality using coarse spatial resolution satellite imagery. Int. J. Remote Sens. 2005, 26, 193–200. [Google Scholar] [CrossRef]
- Hawryło, P.; Bednarz, B.; Wężyk, P.; Szostak, M. Estimating defoliation of Scots pine stands using machine-learning methods and vegetation indices of Sentinel-2. Eur. J. Remote Sens. 2018, 51, 194–204. [Google Scholar] [CrossRef]
- Franklin, S.; Fan, H.; Guo, X. Relationship between Landsat TM and SPOT vegetation indices and cumulative spruce budworm defoliation. Int. J. Remote Sens. 2008, 29, 1215–1220. [Google Scholar] [CrossRef]
- Franklin, S.; Waring, R.; McCreight, R.; Cohen, W.; Fiorella, M. Aerial and satellite sensor detection and classification of western spruce budworm defoliation in a subalpine forest. Can. J. Remote Sens. 1995, 21, 299–308. [Google Scholar] [CrossRef]
- Leckie, D.; Teillet, P.; Fedosejevs, G.; Ostaff, D. Reflectance characteristics of cumulative defoliation of balsam fir. Can. J. For. Res. 1988, 18, 1008–1016. [Google Scholar] [CrossRef]
- Hall, R.J.; Skakun, R.S.; Arsenault, E.J. Remotely sensed data in the mapping of insect defoliation. In Understanding Forest Disturbance and Spatial Pattern: Remote Sensing and Gis Approaches; Wulder, M.A., Franklin, S.E., Eds.; Taylor and Francis, CRC Press: Boca Raton, FL, USA, 2006; pp. 85–111. [Google Scholar]
- Leckie, D.G.; Yuan, X.; Ostaff, D.P.; Piene, H.; MacLean, D. Analysis of high resolution multispectral MEIS imagery for spruce budworm damage assessment on a single tree basis. Remote Sens. Environ. 1992, 40, 125–136. [Google Scholar] [CrossRef]
- Goodbody, T.R.; Coops, N.C.; Hermosilla, T.; Tompalski, P.; McCartney, G.; MacLean, D.A. Digital aerial photogrammetry for assessing cumulative spruce budworm defoliation and enhancing forest inventories at a landscape-level. ISPRS J. Photogramm. Remote Sens. 2018, 142, 1–11. [Google Scholar] [CrossRef]
- Chalifoux, S.; Cavayas, F.; Gray, J.T. Map-guided approach for the automatic detection on Landsat TM images of forest stands damaged by the spruce budworm. Photogramm. Eng. Remote Sens. 1998, 64, 629–635. [Google Scholar]
- Franklin, S.; Raske, A. Satellite remote sensing of spruce budworm forest defoliation in western Newfoundland. Can. J. Remote Sens. 1994, 20, 37–48. [Google Scholar]
- Campbell, P.E.; Rock, B.; Martin, M.; Neefus, C.; Irons, J.; Middleton, E.; Albrechtova, J. Detection of initial damage in Norway spruce canopies using hyperspectral airborne data. Int. J. Remote Sens. 2004, 25, 5557–5584. [Google Scholar] [CrossRef]
- Hennigar, C.R.; MacLean, D.A.; Erdle, T.A. Potential Spruce Budworm Impacts and Mitigation Opportunities in Maine; Cooperative Forest Research Unit, University of Maine: Orono, ME, USA, 2013; p. 68. [Google Scholar]
- Gray, D.R. The influence of forest composition and climate on outbreak characteristics of the spruce budworm in eastern Canada. Can. J. For. Res. 2013, 43, 1181–1195. [Google Scholar] [CrossRef]
- Saucier, J.; Bergeron, J.; Grondin, P.; Robitaille, A. Les régions écologiques du Québec méridional: Un des éléments du systeme hiérarchique de classification écologique du territoire mis au point par le Ministere des Ressources Naturelles. L’Aubelle 1998. [Google Scholar]
- Bélisle, A.C.; Gauthier, S.; Cyr, D.; Bergeron, Y.; Morin, H. Fire regime and old-growth boreal forests in central Quebec, Canada: An ecosystem management perspective. Silva Fenn. 2011, 45, 889–908. [Google Scholar] [CrossRef]
- Boucher, D.; De Grandpré, L.; Kneeshaw, D.; St-Onge, B.; Ruel, J.-C.; Waldron, K.; Lussier, J.-M. Effects of 80 years of forest management on landscape structure and pattern in the eastern Canadian boreal forest. Landsc. Ecol. 2015, 30, 1913–1929. [Google Scholar] [CrossRef]
- Legaard, K.R.; Sader, S.A.; Simons-Legaard, E.M. Evaluating the impact of abrupt changes in forest policy and management practices on landscape dynamics: Analysis of a Landsat image time series in the Atlantic Northern Forest. PLoS ONE 2015, 10, e0130428. [Google Scholar] [CrossRef] [PubMed]
- Maine Forest Service. Assessment of Maine’s Wood Supply; Maine Forest Service, Department of Conservation: Augusta, Maine, USA, 1993; p. 38.
- Régnière, J. Generalized approach to landscape-wide seasonal forecasting with temperature-driven simulation models. Environ. Entomol. 1996, 25, 869–881. [Google Scholar] [CrossRef]
- Régnière, J.; Cooke, B.; Bergeron, V. BioSIM: A Computer-Based Decision Support Tool for Seasonal Planning of Pest Management Activities; User’s Manual; Canadian Forest Service Information Report LAU-X-116; Canadian Forest Service Publications: Sainte-Foy, QC, Canada, 1995; 1996p.
- Braaten, J.D.; Cohen, W.B.; Yang, Z. Automated cloud and cloud shadow identification in Landsat MSS imagery for temperate ecosystems. Remote Sens. Environ. 2015, 169, 128–138. [Google Scholar] [CrossRef] [Green Version]
- Miller, C.A. The feeding impact of spruce budworm on balsam fir. Can. J. For. Res. 1977, 7, 76–84. [Google Scholar] [CrossRef]
- Eklundh, L.; Johansson, T.; Solberg, S. Mapping insect defoliation in Scots pine with MODIS time-series data. Remote Sens. Environ. 2009, 113, 1566–1573. [Google Scholar] [CrossRef]
- Spruce, J.P.; Sader, S.; Ryan, R.E.; Smoot, J.; Kuper, P.; Ross, K.; Prados, D.; Russell, J.; Gasser, G.; McKellip, R. Assessment of MODIS NDVI time series data products for detecting forest defoliation by gypsy moth outbreaks. Remote Sens. Environ. 2011, 115, 427–437. [Google Scholar] [CrossRef]
- Olsson, P.-O.; Lindström, J.; Eklundh, L. Near real-time monitoring of insect induced defoliation in subalpine birch forests with MODIS derived NDVI. Remote Sens. Environ. 2016, 181, 42–53. [Google Scholar] [CrossRef]
- Thomas, S.J.; Deschamps, A.; Landry, R.; van der Sanden, J.J.; Hall, R.J. Mapping insect defoliation using multi-temporal Landsat data. In Proceedings of the CRSS/ASPRS Specialty Conference: Our Common Borders—Safety, Security and the Environment through Remote Sensing, Ottawa, ON, Canada, 28 October–1 November 2007. [Google Scholar]
- Rouse, J.W., Jr.; Haas, R.; Schell, J.; Deering, D. Monitoring Vegetation Systems in the Great Plains with ERTS; NASA: Washington, DC, USA, 1974; pp. 309–317.
- Huete, A.; Justice, C.; Leeuwen, W. MODIS Vegetation Index (MOD13), EOS MODIS Algorithm; Theoretical Basis Document; NASA Goddard Space Flight Center: Greenbelt, MD, USA, 1996.
- Huete, A.R.; Liu, H.; van Leeuwen, W.J. The use of vegetation indices in forested regions: issues of linearity and saturation. In Proceedings of the 1997 IEEE International Geoscience and Remote Sensing—A Scientific Vision for Sustainable Development, Singapore, 3–8 August 1997; pp. 1966–1968. [Google Scholar]
- Gitelson, A.A.; Vina, A.; Arkebauer, T.J.; Rundquist, D.C.; Keydan, G.; Leavitt, B. Remote estimation of leaf area index and green leaf biomass in maize canopies. Geophys. Res. Lett. 2003, 30, 1248. [Google Scholar] [CrossRef]
- Gitelson, A.A.; Vina, A.; Ciganda, V.; Rundquist, D.C.; Arkebauer, T.J. Remote estimation of canopy chlorophyll content in crops. Geophys. Res. Lett. 2005, 32, L08403. [Google Scholar] [CrossRef]
- Gitelson, A.A.; Kaufman, Y.J.; Merzlyak, M.N. Use of a green channel in remote sensing of global vegetation from EOS-MODIS. Remote Sens. Environ. 1996, 58, 289–298. [Google Scholar] [CrossRef]
- Hunt, E.R., Jr.; Rock, B.N. Detection of changes in leaf water content using near-and middle-infrared reflectances. Remote Sens. Environ. 1989, 30, 43–54. [Google Scholar]
- Hardisky, M.; Klemas, V.; Smart, M. The influence of soil salinity, growth form, and leaf moisture on the spectral radiance of Spartina alterniflora canopies. Photogramm. Eng. Remote Sens. 1983, 49, 77–83. [Google Scholar]
- Key, C.; Benson, N. Measuring and remote sensing of burn severity. In Proceedings of the Joint Fire Science Conference and Workshop, Boise, ID, USA, 15–17 June 1999; University of Idaho and International Association: Moscow, ID, USA; p. 284. [Google Scholar]
- Ménard, S.; Darveau, M.; Imbeau, L.; Lemelin, L.-V. Méthode de Classification des Milieux Humides du Québec Boréal à Partir de la Carte Écoforestière du 3e Inventaire Décennal; Canards Illimités Canada: Quebec City, QB, Canada, 2006. [Google Scholar]
- Franklin, S.; Wulder, M.; Skakun, R.; Carroll, A. Mountain pine beetle red-attack forest damage classification using stratified Landsat TM data in British Columbia, Canada. Photogramm. Eng. Remote Sens. 2003, 69, 283–288. [Google Scholar] [CrossRef]
- Vogelmann, J.E.; Tolk, B.; Zhu, Z. Monitoring forest changes in the southwestern United States using multitemporal Landsat data. Remote Sens. Environ. 2009, 113, 1739–1748. [Google Scholar] [CrossRef]
- Breiman, L. Random forests. Mach. Learn. 2001, 45, 5–32. [Google Scholar] [CrossRef]
- Liaw, A.; Wiener, M. Classification and regression by randomForest. R News 2002, 2, 18–22. [Google Scholar]
- R Core Team. R: A Language and Environment for Statistical Computing; R Foundation for Statistical Computing: Vienna, Austria, 2013. [Google Scholar]
- Adelabu, S.; Mutanga, O.; Adam, E.; Sebego, R. Spectral discrimination of insect defoliation levels in mopane woodland using hyperspectral data. IEEE J. Sel. Topics Appl. Earth Obs. Remote Sens. 2014, 7, 177–186. [Google Scholar] [CrossRef]
- Sauro, J.; Lewis, J.R. Estimating completion rates from small samples using binomial confidence intervals: Comparisons and recommendations. In Proceedings of the Human Factors and Ergonomics Society Annual Meeting, Los Angeles, CA, USA, 26–30 September 2005; pp. 2100–2103. [Google Scholar]
- Lyon, J.G.; Yuan, D.; Lunetta, R.S.; Elvidge, C.D. A change detection experiment using vegetation indices. Photogramm. Eng. Remote Sens. 1998, 64, 143–150. [Google Scholar]
- Simmons, G. Influence of spruce budworm moth dispersal on suppression decisions, In A Symposium on the Spruce Budworm; United States Department of Agriculture, Forest Service: Alexandria, VI, USA, 1974.
- Harrell, F.E. Ordinal logistic regression. In Regression Modeling Strategies; Springer: New York, NY, USA, 2001; pp. 331–343. [Google Scholar]
- Huete, A.; Didan, K.; Miura, T.; Rodriguez, E.P.; Gao, X.; Ferreira, L.G. Overview of the radiometric and biophysical performance of the MODIS vegetation indices. Remote Sens. Environ. 2002, 83, 195–213. [Google Scholar] [CrossRef]
- Chen, C.; Weiskittel, A.; Bataineh, M.; MacLean, D.A. Evaluating the influence of varying levels of spruce budworm defoliation on annualized individual tree growth and mortality in Maine, USA and New Brunswick, Canada. For. Ecol. Manag. 2017, 396, 184–194. [Google Scholar] [CrossRef]
Figure 1.
Location of the study areas in Quebec (QC), Canada and Maine (ME), United States. The Quebec study area (~35 × 35 km2) was located in Landsat-5 scene 12/26, and the Maine study area (~100 × 150 km2) was located in Landsat-MSS scene 13/28 [40].
Figure 1.
Location of the study areas in Quebec (QC), Canada and Maine (ME), United States. The Quebec study area (~35 × 35 km2) was located in Landsat-5 scene 12/26, and the Maine study area (~100 × 150 km2) was located in Landsat-MSS scene 13/28 [40].

Figure 2.
Spruce budworm (SBW) probability of occurrence (L2–L6) in 2008 and 2009 for the Quebec study area, based on the BioSIM simulation: L2 and L6 are the second and sixth instar in the lifecycle of spruce budworm, respectively. DOY 170–190 represent 100% occurrence of SBW larvae and timing of stage 6 larva that do most (87%) of the defoliation, as described by Miller [45].

Figure 3.
Comparison of the performance of seven vegetation indices (VIs) and best combinations thereof to detect defoliated versus non-defoliated forests in the current spruce budworm outbreak in Quebec, using the random forest method. OOB is the out-of-bag error rate.
Figure 3.
Comparison of the performance of seven vegetation indices (VIs) and best combinations thereof to detect defoliated versus non-defoliated forests in the current spruce budworm outbreak in Quebec, using the random forest method. OOB is the out-of-bag error rate.

Figure 4.
Comparison of the performance of best single VIs and best combinations thereof to classify different severities of defoliation in the current spruce budworm outbreak in Quebec, using the random forest method. OOB is the out-of-bag error rate.
Figure 4.
Comparison of the performance of best single VIs and best combinations thereof to classify different severities of defoliation in the current spruce budworm outbreak in Quebec, using the random forest method. OOB is the out-of-bag error rate.

Figure 5.
Landsat-derived annual (current-year) defoliation severity maps for 2008 and 2009, at 30 m spatial resolution, for a portion of the Quebec study area, using a combination of NDMI, EVI, and NDVI, compared with aerial sketch maps (ASMs) for the same area. White pixels in VI-derived defoliation maps are water bodies, clouds, or cloud shadows.

Figure 6.
(Top) Landsat-MSS SBW defoliation occurrence map for 1975 at 60 m spatial resolution, and expected defoliation (%) derived from egg-mass counts in 1975 overlaid on an ASM SBW defoliation map for 1975. (Bottom) Landsat-MSS SBW defoliation occurrence map for 1982 at 60 m spatial resolution, and expected defoliation (%) derived from egg mass counts in 1982 overlaid on an ASM SBW defoliation map for 1982. White pixels in the Landsat-derived maps are water bodies, clouds, cloud shadows, and harvested forests.


Table 1.
Landsat images and acquisition dates used for annual defoliation detection in Quebec, Canada and Maine, United States.
Table 1.
Landsat images and acquisition dates used for annual defoliation detection in Quebec, Canada and Maine, United States.
| Study Area | Imagery Date | Landsat Sensor | Path/Row |
|---|---|---|---|
| Quebec | 12 July 2004 | TM5 | 12/26 |
| 15 July 2005 | TM5 | 12/26 | |
| 8 July 2008 | TM5 | 12/26 | |
| 10 July 2009 | TM5 | 12/26 | |
| Maine | 2 September 1972 | MSS1 | 12/28 |
| 23 July 1973 | MSS1 | 13/28 | |
| 9 August 1975 | MSS2 | 13/28 | |
| 30 July 1982 | MSS2 | 13/28 |
Table 2.
Landsat remotely-sensed indices evaluated in the study for defoliation detection. Landsat TM vegetation indices (Vis) were used for the Quebec study area, and Landsat MSS normalized difference vegetation index (NDVI) was used for the Maine study area.
Table 2.
Landsat remotely-sensed indices evaluated in the study for defoliation detection. Landsat TM vegetation indices (Vis) were used for the Quebec study area, and Landsat MSS normalized difference vegetation index (NDVI) was used for the Maine study area.
| Landsat Sensor | Index | Acronym and Formulation | Reference |
|---|---|---|---|
| TM | Enhanced Vegetation Index | EVI = 2.5 * (NIR − Red)/(NIR + 6 * Red − 7.5 * Blue + 1) | [51,52] |
| Normalized Difference Vegetation Index | NDVI = (NIR − Red)/(NIR + Red) | [50] | |
| Green Chlorophyll Index | Chlgreen = (NIR/Green) − 1 | [53,54] | |
| Greenness Normalized Difference Vegetation Index | GNDVI = (NIR − Green)/(NIR + Green) | [55] | |
| Normalized Difference Moisture Index | NDMI = (NIR − SWIR1)/(NIR + SWIR1) | [56] | |
| Normalized Burn Ratio1 | NBR1 = (NIR − SWIR2)/(NIR + SWIR2) | [57] | |
| Normalized Burn Ratio 2 | NBR2 = (SWIR1 − SWIR2)/(SWIR1 + SWIR2) | [58] | |
| MSS | Normalized Difference Vegetation Index | NDVI = (NIR2 − Red)/(NIR2 + Red) | [50] |
Table 3.
Error matrix and accuracy estimate (%) for the Quebec study area for the 2008 and 2009 SBW defoliation maps, derived from VIs versus ASMs (PA: producer’s accuracy; UA: user’s accuracy). Bold values are % correct classes. Confidence intervals are calculated at a 95% confidence level.
Table 3.
Error matrix and accuracy estimate (%) for the Quebec study area for the 2008 and 2009 SBW defoliation maps, derived from VIs versus ASMs (PA: producer’s accuracy; UA: user’s accuracy). Bold values are % correct classes. Confidence intervals are calculated at a 95% confidence level.
| No Defoliation | Light Defoliation | Moderate Defoliation | Severe Defoliation | PA | UA | PA Conf. Interval | UA Conf. Interval | |
|---|---|---|---|---|---|---|---|---|
| 2008 | ||||||||
| No defoliation | 93.4 | 15.7 | 6.2 | 0.1 | 93.4 | 85.9 | 92–94 | 84–87 |
| Light defoliation | 6.6 | 67.3 | 35.4 | 6.0 | 67.3 | 55.0 | 65–70 | 52–57 |
| Moderate defoliation | 0.0 | 14.9 | 53.1 | 25.8 | 53.1 | 56.3 | 50–56 | 54–59 |
| Severe defoliation | 0.0 | 2.0 | 5.4 | 68.1 | 68.1 | 91.0 | 66–70 | 89–93 |
| Overall Acc. and Kappa Coeff.: 72.4%, 0.63 | ||||||||
| 2009 | ||||||||
| No defoliation | 62.2 | 20.1 | 0.5 | 0.0 | 62.2 | 81.9 | 60–64 | 80–84 |
| Light defoliation | 24.2 | 49.5 | 4.4 | 0.6 | 49.5 | 55.3 | 47–52 | 53–58 |
| Moderate defoliation | 13.1 | 29.0 | 67.8 | 21.5 | 67.8 | 48.0 | 65–70 | 46–50 |
| Severe defoliation | 0.5 | 1.2 | 27.3 | 78.1 | 78.0 | 65.7 | 75–80 | 63–68 |
| Overall Acc. and Kappa Coeff.: 64%, 0.50 | ||||||||
Table 4.
Results of regression analysis between egg-mass-derived expected defoliation levels and Landsat-MSS-derived NDVI and defoliation occurrence analysis (Tot.: Total; Ave.: Average).
Table 4.
Results of regression analysis between egg-mass-derived expected defoliation levels and Landsat-MSS-derived NDVI and defoliation occurrence analysis (Tot.: Total; Ave.: Average).
| Year | Egg Mass Counts Class/100 ft2 | Expected Defoliation Class (%) | Samples per Egg-Mass Class | % of Total Egg-Mass Samples | % Correctly Identified | p-Value | Pseudo R2 (Nagelkerke) |
|---|---|---|---|---|---|---|---|
| 1975 | 0 | 0 | 3 | 1 | 67 | 0.001 | 0.038 |
| 1–50 | 1–12 | 29 | 8 | 41 | |||
| 51–170 | 13–42 | 87 | 25 | 45 | |||
| 171–320 | 43–78 | 87 | 25 | 68 | |||
| 321–+400 | 79–100 | 143 | 41 | 60 | |||
| - | - | Tot. 349 | Tot. 100 | Ave. 57 | |||
| 1982 | 1–50 | 1–12 | 52 | 21 | 42 | 0.002 | 0.041 |
| 51–170 | 13–42 | 55 | 22 | 36 | |||
| 171–320 | 43–78 | 48 | 20 | 56 | |||
| 321–400 | 79–98 | 92 | 37 | 53 | |||
| - | - | Tot. 247 | Tot. 100 | Ave. 47 |
© 2018 by the authors. Licensee MDPI, Basel, Switzerland. This article is an open access article distributed under the terms and conditions of the Creative Commons Attribution (CC BY) license (http://creativecommons.org/licenses/by/4.0/).
Share and Cite
MDPI and ACS Style
Rahimzadeh-Bajgiran, P.; Weiskittel, A.R.; Kneeshaw, D.; MacLean, D.A. Detection of Annual Spruce Budworm Defoliation and Severity Classification Using Landsat Imagery. Forests 2018, 9, 357. https://doi.org/10.3390/f9060357
AMA Style
Rahimzadeh-Bajgiran P, Weiskittel AR, Kneeshaw D, MacLean DA. Detection of Annual Spruce Budworm Defoliation and Severity Classification Using Landsat Imagery. Forests. 2018; 9(6):357. https://doi.org/10.3390/f9060357
Chicago/Turabian StyleRahimzadeh-Bajgiran, Parinaz, Aaron R. Weiskittel, Daniel Kneeshaw, and David A. MacLean. 2018. "Detection of Annual Spruce Budworm Defoliation and Severity Classification Using Landsat Imagery" Forests 9, no. 6: 357. https://doi.org/10.3390/f9060357
Note that from the first issue of 2016, this journal uses article numbers instead of page numbers. See further details here.